 Yanhong Liu
 Lan Gao
 Yanru Fan1
95% of researchers rate our articles as excellent or good
Learn more about the work of our research integrity team to safeguard the quality of each article we publish.
Find out more
ORIGINAL RESEARCH article
Front. Oncol. , 09 February 2023
Sec. Molecular and Cellular Oncology
Volume 13 - 2023 | https://doi.org/10.3389/fonc.2023.1079719
This article is part of the Research Topic Mass Spectrometry to Answer Clinical Questions: Insights in Oncology and Health Science Research Vol. II View all 6 articles
Objective: Non-small cell lung cancer (NSCLC) patients present a high incidence of venous thromboembolism (VTE) with poor prognosis. It is crucial to identify and diagnose VTE early. The study aimed to identify potential protein biomarkers and mechanism of VTE in NSCLC patients via proteomics research.
Methods: Proteomic analysis of the human plasma was performed through data-independent acquisition mass spectrometry for 20 NSCLC patients with VTE, and 15 NSCLC patients without VTE. Significantly differentially expressed proteins were analyzed by multiple bioinformatics method for further biomarker analysis.
Results: A total of 280 differentially expressed proteins were identified in VTE and non-VTE patients, where 42 were upregulated and 238 were downregulated. These proteins were involved in acute-phase response, cytokine production, neutrophil migration and other biological processes related to VTE and inflammation. Five proteins including SAA1, S100A8, LBP, HP and LDHB had significant change between VTE and non-VTE patients, with the area under the curve (AUC) were 0.8067, 0.8308, 0.7767, 0.8021, 0.8533, respectively.
Conclusions: SAA1, S100A8, LBP, HP and LDHB may serve as potential plasma biomarkers for diagnosis VTE in NSCLC patients.
Venous thromboembolism (VTE), comprising deep vein thrombosis (DVT) and pulmonary embolism (PE), is the common complications and a leading cause of death in patients with cancer (1). The risk of VTE is 4-7 fold higher in patients with cancer than in those without cancer (2, 3). Different cancer types carry different VTE risk (4). Lung cancer is the most common malignancy worldwide and is well established to be high risk of VTE, which account up to 21% of cancer-associated thrombotic cases (5, 6). Non-small cell lung cancer (NSCLC) accounts for more than 80% of lung cancer, with the reported incidence of DVT 13.6% and that of PE to 3.7% (7, 8). The incidence of VTE is higher in patients with NSCLC compared to patients with small cell lung cancer (SCLC) (9).
The diagnosis of VTE mainly depends on ultrasound, venography or pulmonary angiography owing to the lack of typical clinical signs and symptoms, but their costs, invasiveness and subjectivity limit the use in clinical practice. VTE can be ruled out based on a negative D-dimer test result. However, D-dimer may increase in case of cancer, inflammation, infection or necrosis which lead to a poor positive predictive. Cancer patients benefit less from D-dimer because of the high false positive rate (10, 11). Therefore, it is necessary to identify novel biomarkers of VTE in cancer patient.
Plasma is the most easily accessible specimen for the discovery of novel biomarkers. Proteins are usually the final executors of function and involved in extensive biological processes. The integrated effects of congenital and acquired factors that influence the risk of thrombosis are reflected in the protein profile in plasma. A variety of plasma proteins, especially those related to inflammation and fibrinolysis, have been confirmed to be associated with VTE (12, 13). Few studies have investigated the proteomics characteristics or associated signaling pathway of VTE in cancer patient.
Data-independent acquisition mass spectrometry (DIA-MS) is an acquisition scheme of tandem mass spectrometry that is independent of the composition of precursor ions for their fragmentation. It can be combined with the data analysis of proteomics research and has been widely used in the mechanism of disease research (14).
DIA-MS showed high reliability and reproducibility in the screening of novel biomarker in previous studies including in VTE patients (15–17). However, few studies have explored the proteomics features of cancer associated thrombosis. Our study is the first to employ proteomics strategy to identify novel biomarkers for VTE in NSCLC patients. In this study, DIA-MS was used to screen differentially expressed proteins between NSCLC patients with and without VTE to find candidate biomarker for subsequent verification. Then cluster analysis of differentially expressed proteins was used to reveal the specific changes of the biological process.
The study was a case-control study. 20 patients diagnosed with NSCLC within 3 years and VTE within 3 month recruited from Henan Provincial Hospital from 2020 to 2021 were case group (VTE group). 15 patients diagnosed with NSCLC within 3 years but without VTE were classified as control group (non-VTE group). The diagnosis of VTE and NSCLC were confirmed according to the recent guidelines (18–20). The demographic and relevant clinical information were collected.
The blood collection time of VTE group was within 3 month after the diagnosis of VTE, and were collected after treatment with subcutaneous low molecular weight heparin (LMWH). Samples from the non-VTE group were collected after ultrasonic showed no thrombosis. Peripheral blood samples were collected from each participant into tubes containing 3.2% sodium citrate as the anticoagulant and were centrifuged at 1,500 g for 10 minutes to separate plasma. All plasma samples have no jaundice or hemolysis. Samples were stored at -80°C until testing. This study was approved by the Research Ethics Committee of Henan Provincial People’s Hospital.
Three main steps were carried out as follows: protein extraction and peptide digestion, data dependent acquisition (DDA) mass spectrometry assay, DIA mass spectrometry assay and data analysis. The workflow is shown in Figure 1.
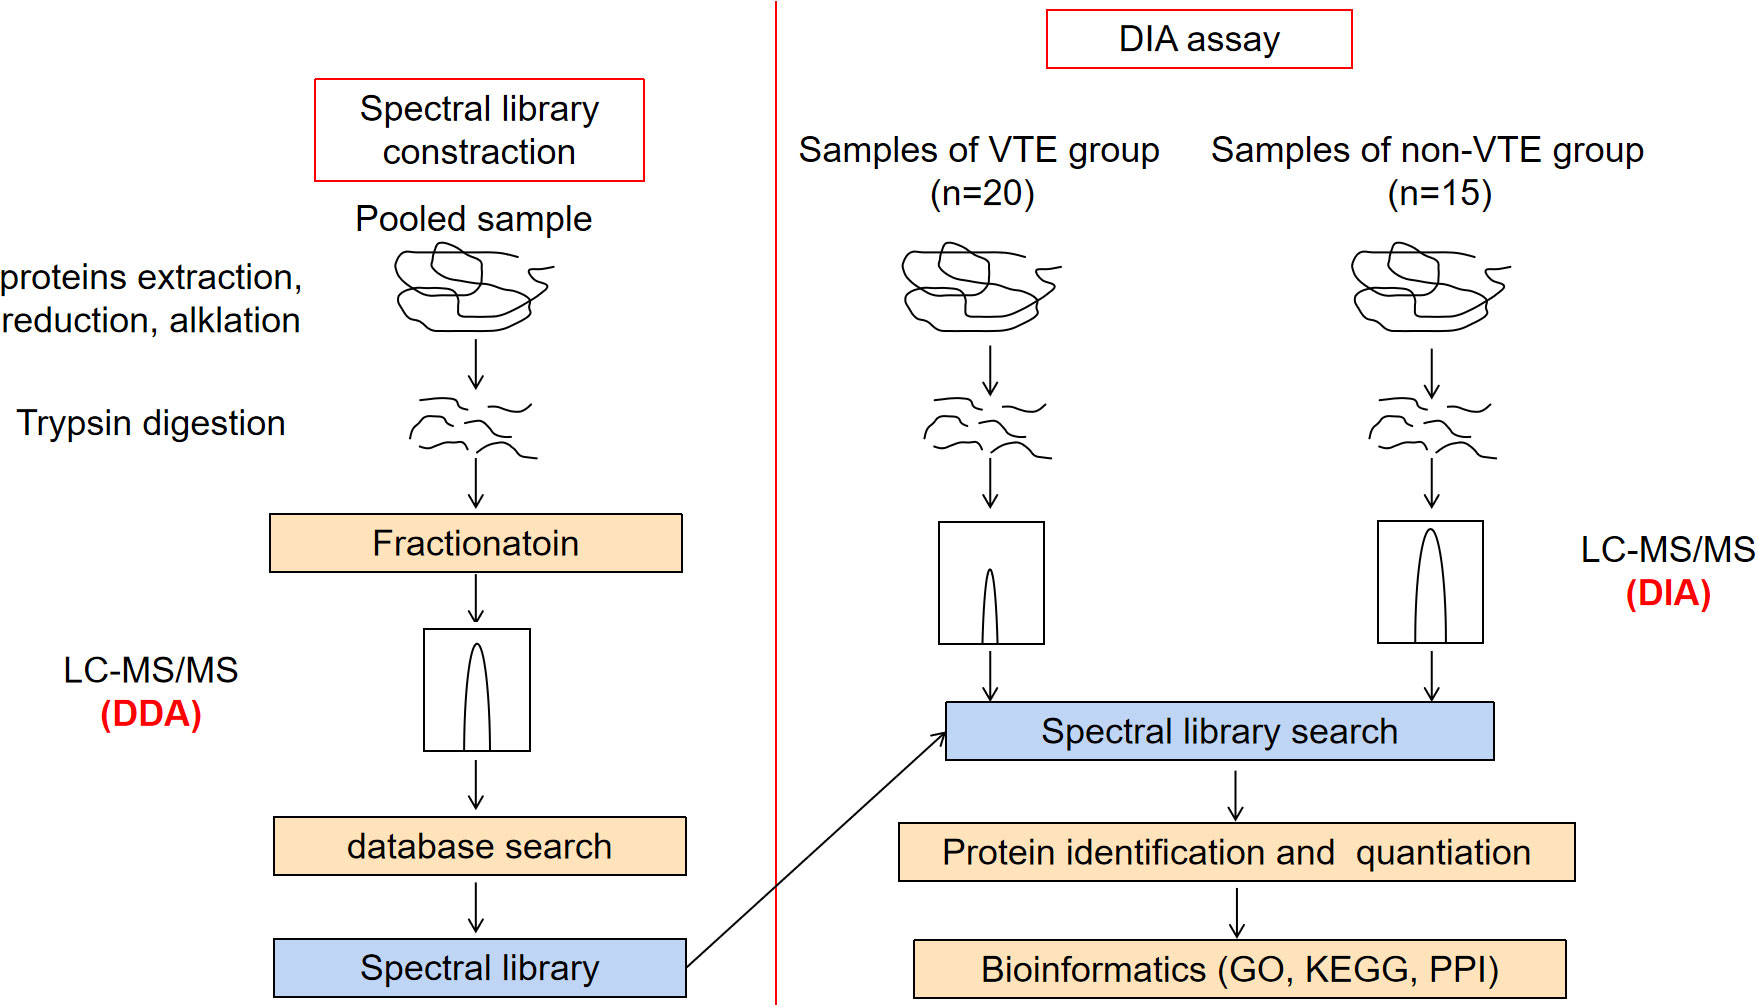
Figure 1 Flowchart of the experiment.
Plasma pools were separated of most abundant proteins following the manufacturer’s protocol (Agilent Technologies). The high and low abundance proteins were collected, desalted and concentrated respectively. 200 μg proteins was repeat ultrafiltered using UA buffer (8 M urea, 150 mM Tris-HCl pH 8.0). Then 100 μl iodoacetamide (100 mM IAA in UA buffer) was added to block reduced cysteine residues and the samples were incubated for 30 min in darkness. The protein suspensions were digested with 4 μg trypsin in 40 μl 25mM NH4HCO3 buffer overnight at 37°C. Collected peptides were desalted on C18 Cartridges and reconstituted in 40µl of 0.1% formic acid. The iRT-Kits (Biognosys) was added to correct the relative retention time.
All fractions for DDA library generation were analyzed by a Thermo Scientific Q Exactive HF X mass spectrometer connected to an Easy nLC 1200 chromatography system (Thermo Scientific). MS detection method was positive ion, the scan range was 300-1800 m/z, resolution for MS1 scan was 60000 at 200 m/z. Resolution for MS2 scan was 15000. Each DIA cycle contained one full MS-SIM scan, and 30 DIA scans covered a mass range of 350-1800 m/z. QC samples were injected with DIA mode at the beginning of the MS study and after every 6 injections throughout the experiment, which was used to monitor the MS performance.
For DDA library data, the FASTA sequence database was searched with Spectronaut™ software. Spectral library was constructed by importing the original raw files and DDA searching results into Spectronaut Pulsar X™ (Biognosys). DIA data was analyzed with Spectronaut™ 14.4.200727.47784 searching the above constructed spectral library. All results were filtered based on Q value cutoff 0.01 (equivalent to FDR<1%).
The differentially expressed proteins were analyzed by gene ontology (GO) and Kyoto Encyclopedia of Genes and Genomes (KEGG) analysis.
The GO terms were mapped and sequences were annotated using the software program Blast2GO. The GO annotation results were plotted by R scripts. The studied proteins were blasted against the online KEGG database to retrieve their KEGG orthology identifications and were subsequently mapped to pathways in KEGG. Enrichment analysis were applied based on the Fisher’ exact test. Benjamini-Hochberg correction for multiple testing was further applied to adjust derived P values. And only functional categories and pathways with P values under a threshold of 0.05 were considered as significant.
The protein–protein interaction (PPI) information of the studied proteins was retrieved from IntAct molecular interaction database (http://www.ebi.ac.uk/intact/) by their gene symbols or STRING software (http://string-db.org/).
For clinical data, Shapiro-Wilk test was performed for normality. Normally distributed data were expressed as the means ± standard deviations. Two independent sample t test was used for statistical analysis and P value < 0.05 were considered statistically significant. Non-normally distributed data were reported as medians (interquartile range), and compared using the Mann-Whitney test. Categorical variables were described by percentages and compared using Fisher’s test. Analyses were performed using the SPSS 20.0 software.
For proteomics data, the differentially expressed proteins were identified using the two samples t-distributed test (P-value <0.05). The proteins were defined as differentially expressed if the fold change between VTE and non-VTE group was >1.5 or < 0.67 and P value < 0.05. The diagnostic value of differentially expressed proteins was evaluated by receiver operating characteristic (ROC) curves and the area under the curve (AUC) was calculated of differentially expressed proteins using GraphPad Prism 7.0.
20 VTE patients and 15 non-VTE patients with NSCLC were recruited. In VTE group, 13 patients had DVT, 4 patients had PE, 3 patients had both VTE and PE. The age, sex, BMI, comorbidities and clinical test results of cases and controls are summarized in Table 1. There were no significant differences in age, sex and BMI between the two groups. PDW and NLR in VTE group were significantly higher than those in non-VTE group (P<0.05). However, RBC and HGB in VTE group were significantly lower than those in non-VTE group (P<0.05).
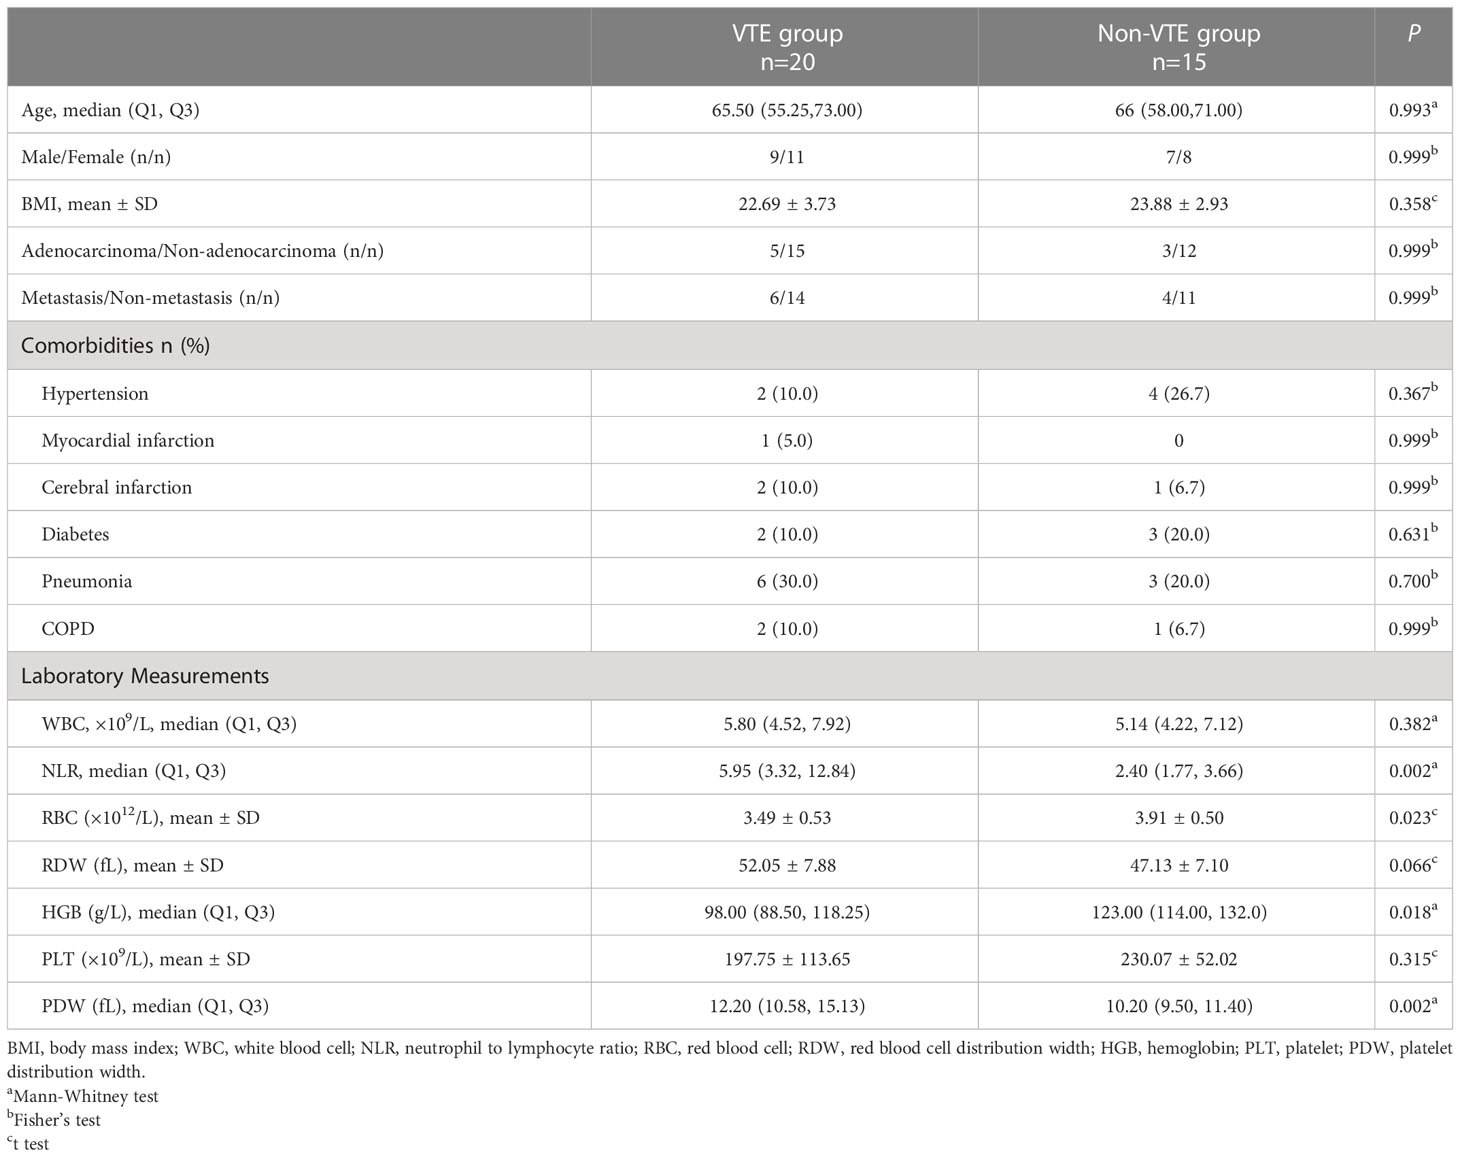
Table 1 Baseline clinical characteristics.
A total of 3275 proteins and 9007 peptides were identified. We screened 280 differentially expressed proteins. There were 42 upregulated and 238 downregulated proteins in VTE group compared to those in non-VTE group. The total number of differentially expressed proteins and volcano plot of proteins identified in DIA-MS are shown in Figure 2.
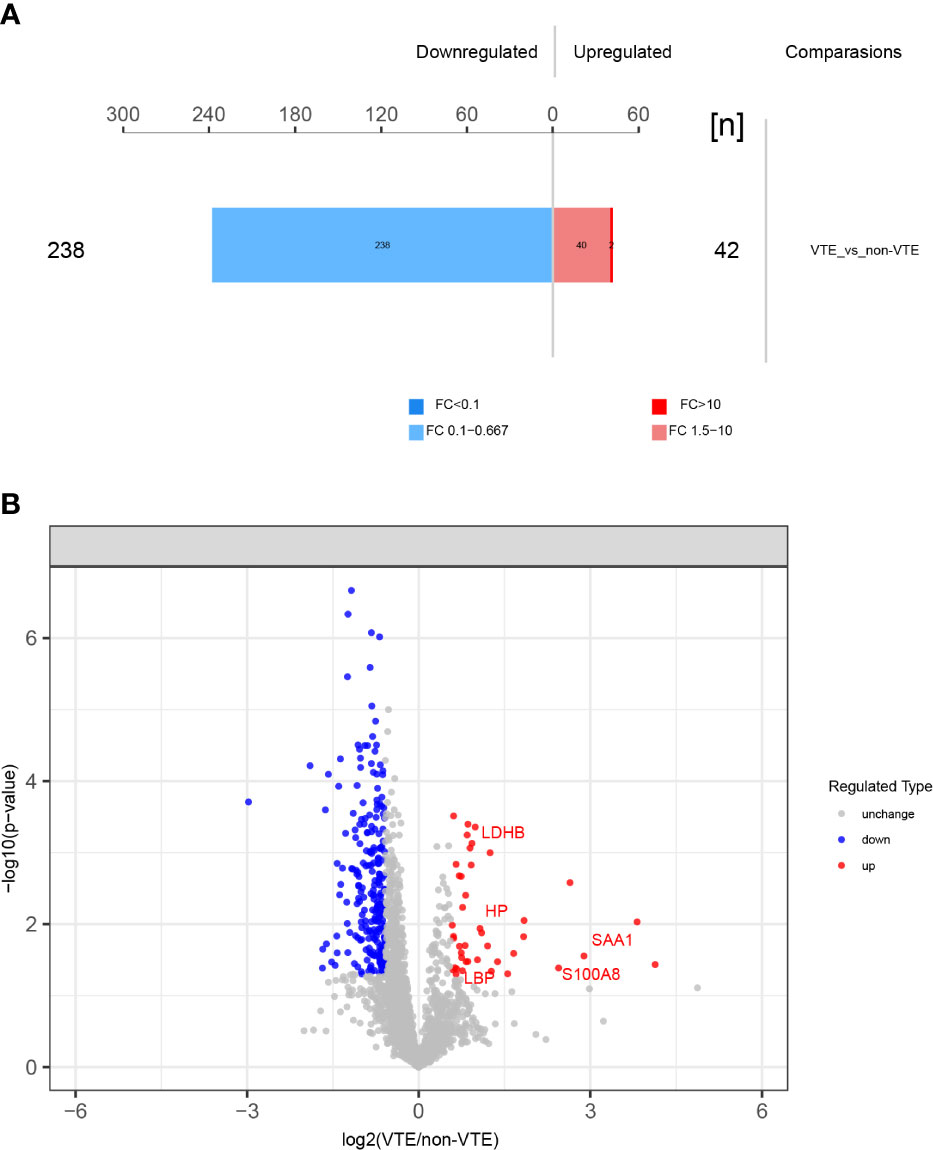
Figure 2 Differentially expressed proteins identified. (A) 280 differentially expressed proteins between VTE group and non-VTE group were screened. (B) Volcano plot of proteins identified. Red ones stand for the upregulated and blue ones for downregulated proteins.
The differentially expressed proteins were analyzed. Some of the differentially expressed proteins are fragments of immunoglobulin. Thrombosis related proteins from the upregulated proteins were selected to analyzed. SAA1 (serum amyloid A-1), S100A8 (protein S100 A8), LBP (lipopolysaccharide-binding protein), HP (haptoglobin), LDHB (lactate dehydrogenase B) were chosen. Differences in intensity of the 5 proteins between VTE group and non-VTE group are shown in Figure 3. The AUC of SAA1, S100A8, LBP, HP, LDHB were 0.8067, 0.8308, 0.7767, 0.8021, 0.8533, respectively (Figure 4).
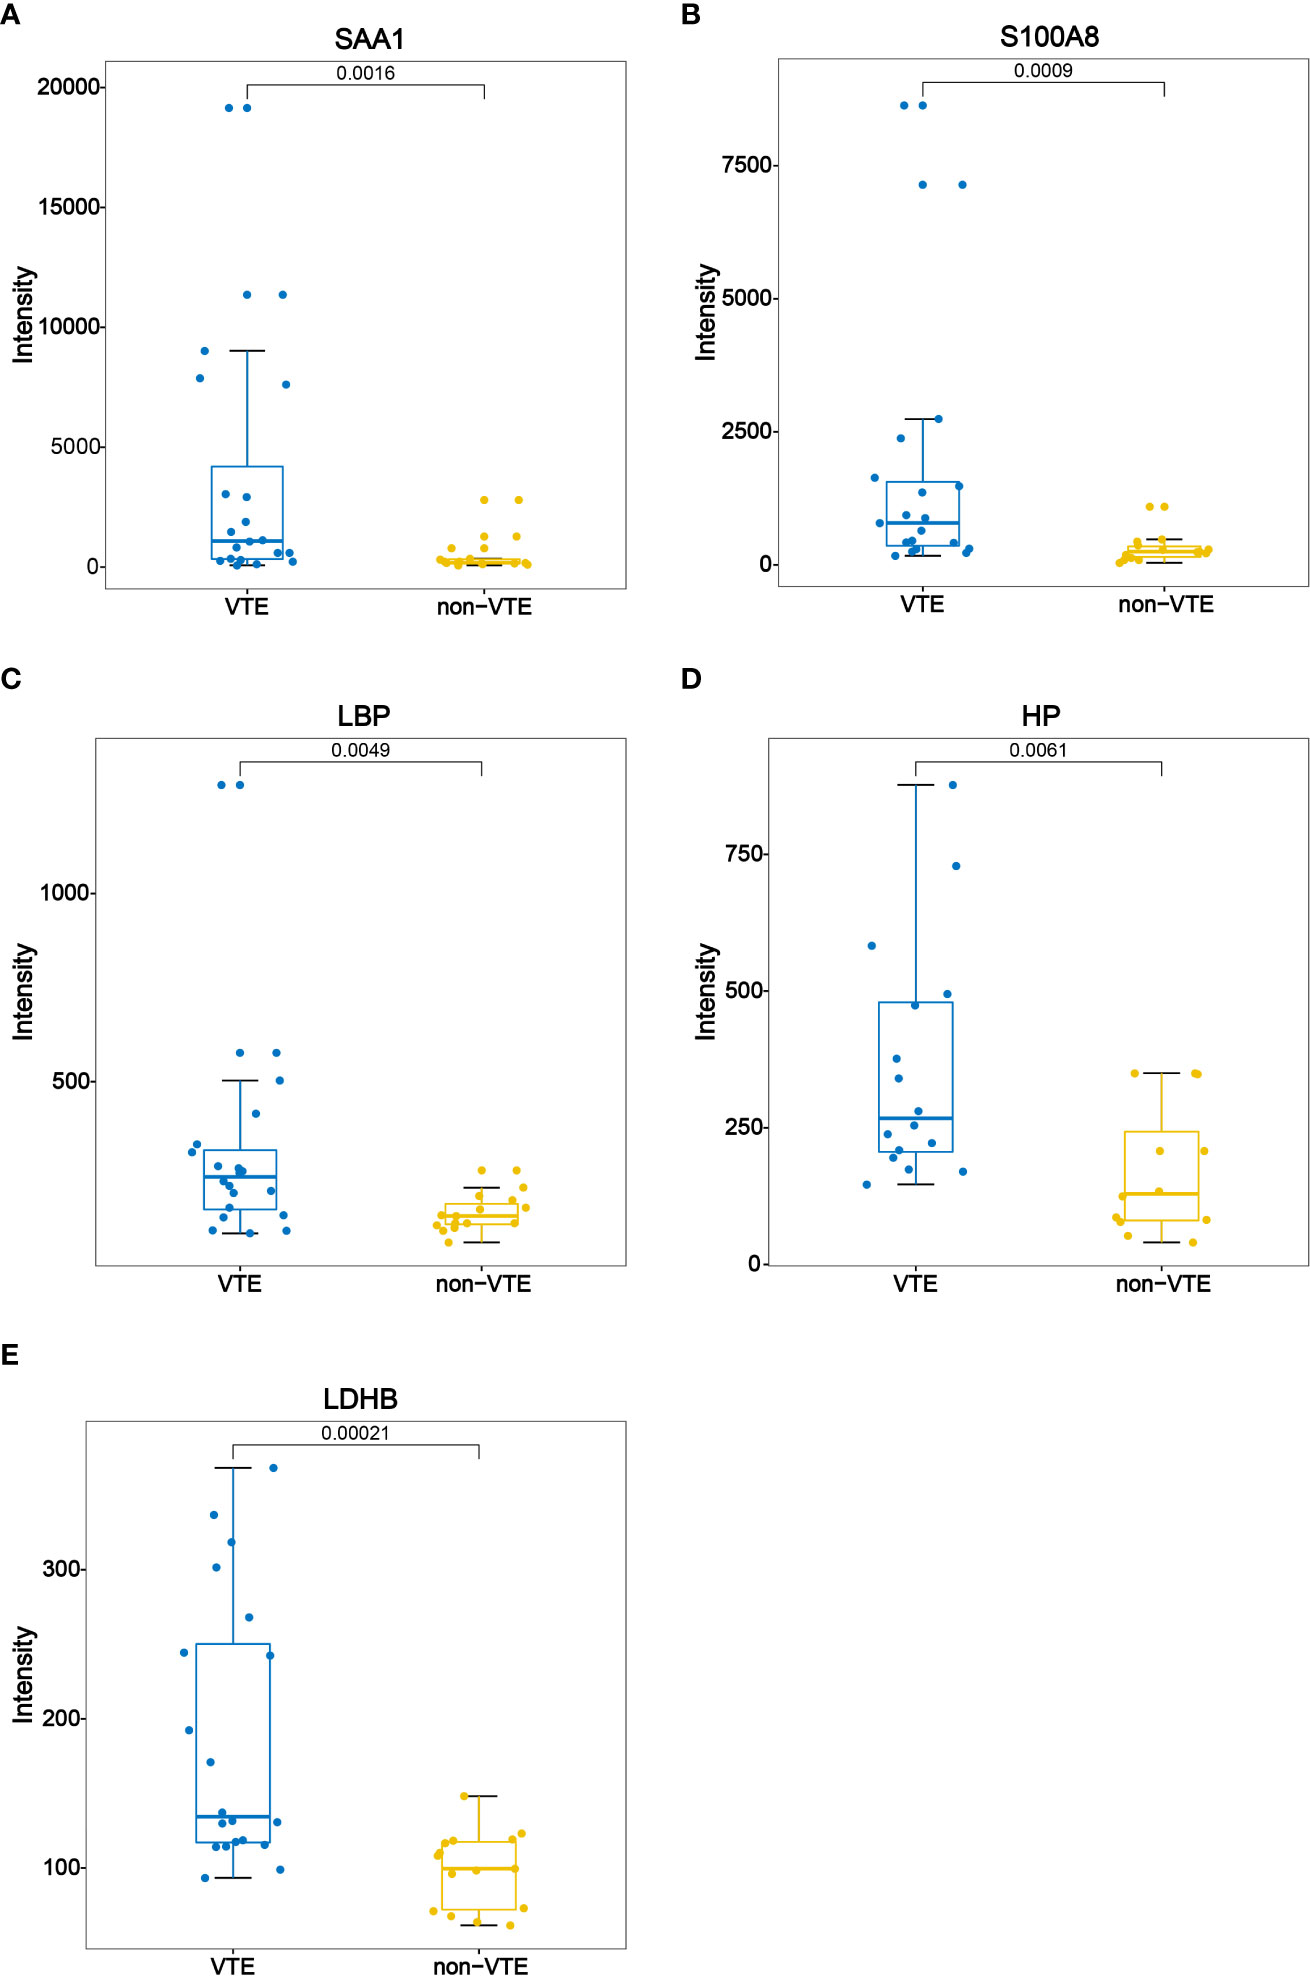
Figure 3 Boxplot of SAA1, S100A8, LBP, HP, LDHB between VTE group and non-VTE group.
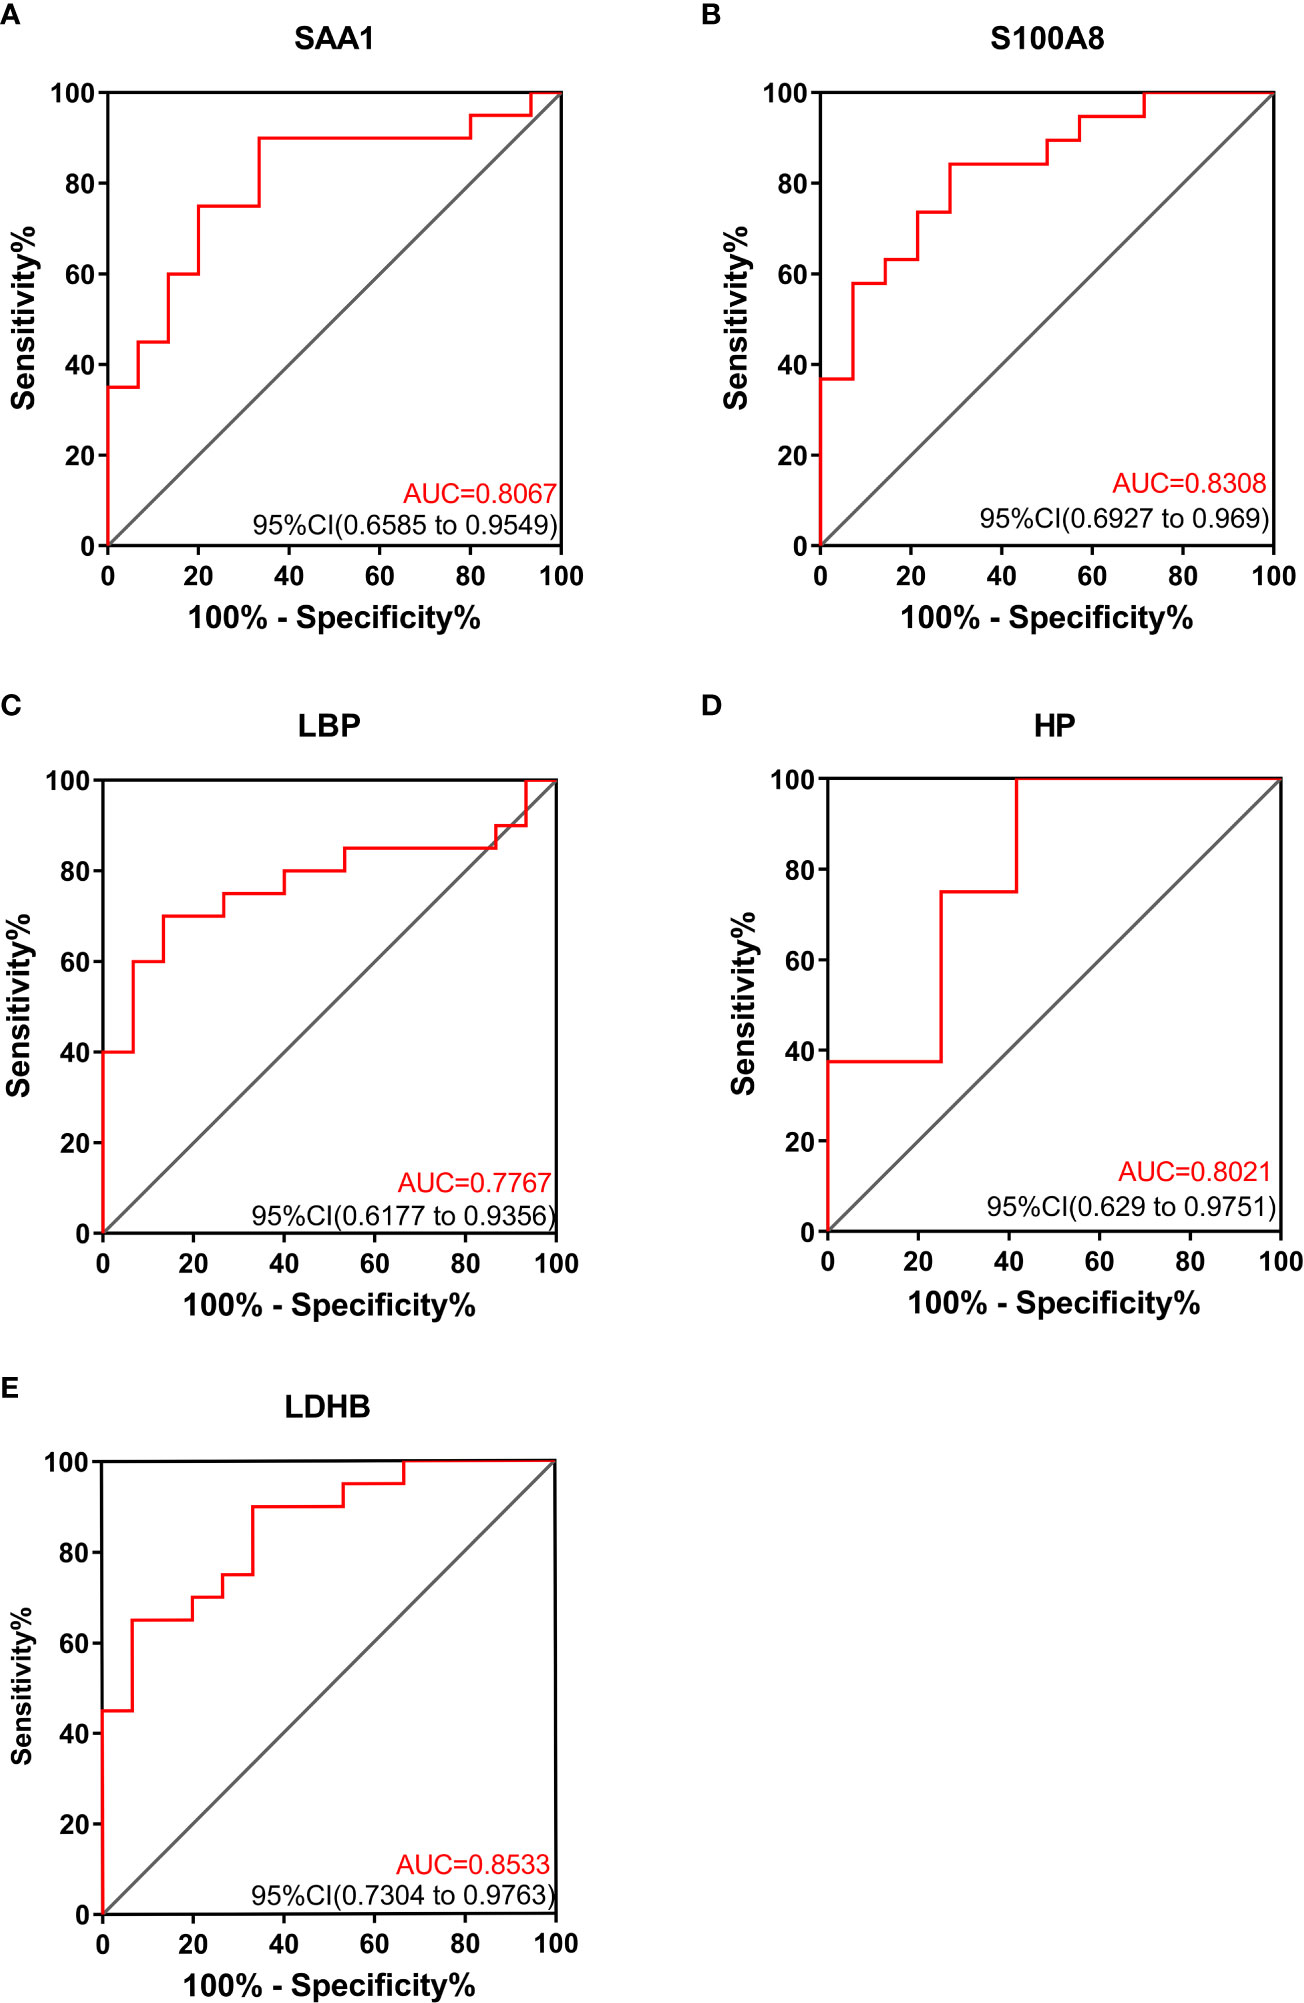
Figure 4 ROC curves of SAA1, S100A8, LBP, HP, LDHB between VTE group and non-VTE group.
We performed GO analysis of all differential proteins. GO function annotations are mainly divided into three categories: biological process, molecular function and cellular component. Through GO analysis, there are 4 biological processes with a high proportion, including acute-phase response (GO:0006953: CRP, ORM1, SAA1, LBP, ORM2, HP), cytokine production (GO:0001816: S100A8, ORM1, LBP, SAA1, immunoglobin peptides, ORM2, CRP), neutrophil migration (GO:1990266: S100A8, SAA1, LBP) (Figure 5).
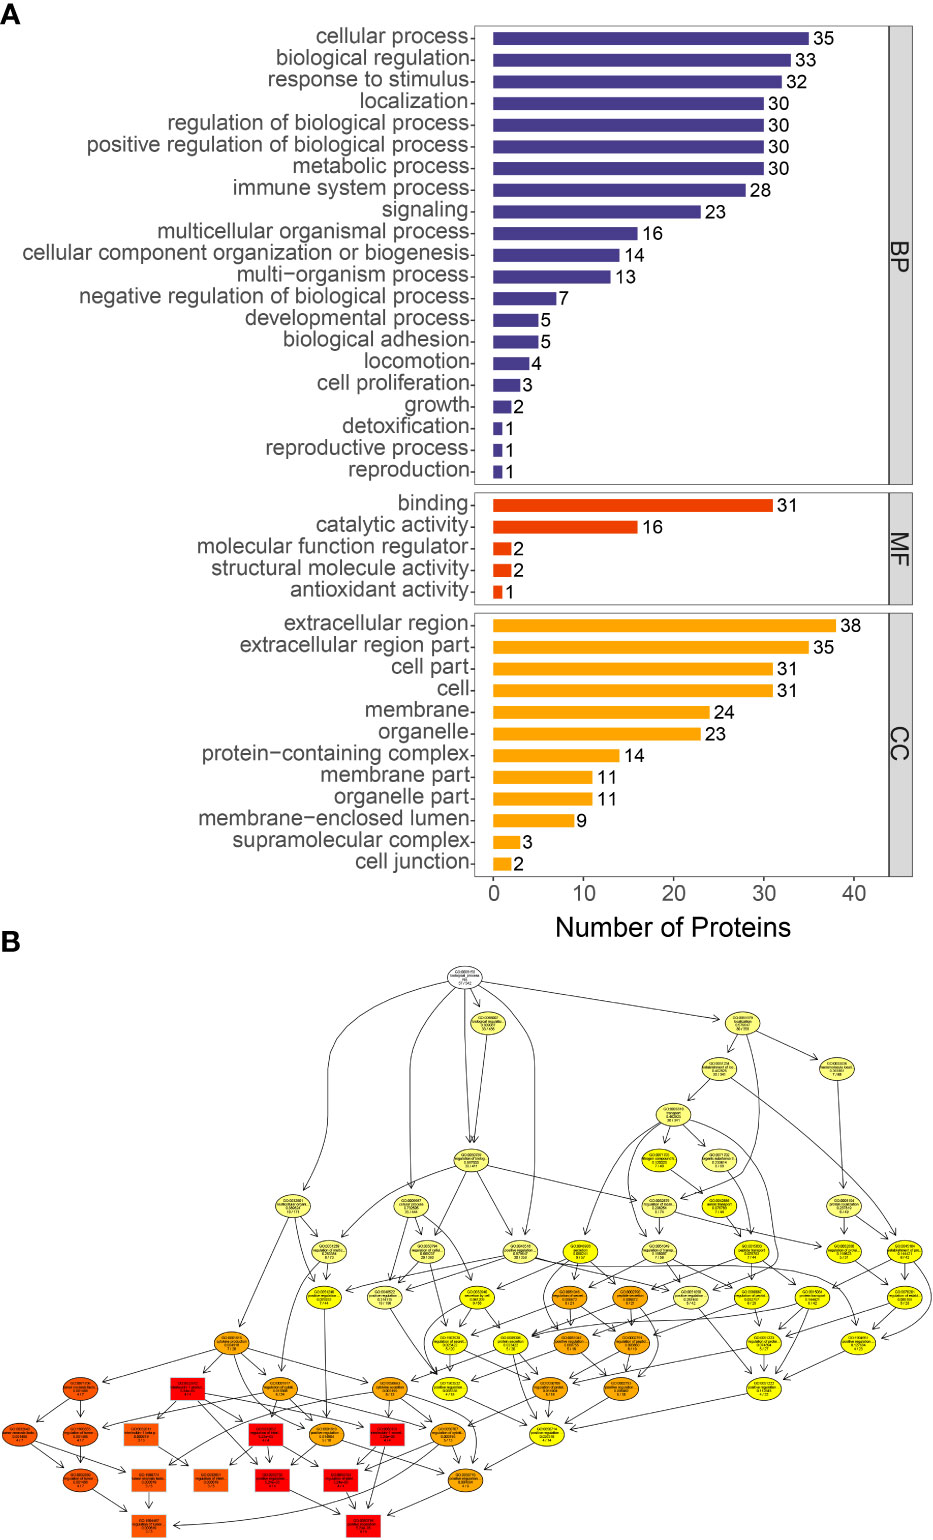
Figure 5 GO functional enrichment of differentially proteins. (A) The number of differentially expressed proteins in each categories. The abscissa represents the number of differentially expressed proteins under each functional category. (B) Directed acyclic graph of biological process. The branch represents the containment relationship. The lower the branch is, the more specific the function is.
KEGG was used to analyze the signaling pathways of differentially expressed proteins between VTE group and non-VTE group. Differentially expressed proteins were mainly concentrated in IL-17 signaling pathway, NF-κB signaling pathway, lipid and atherosclerosis (Figure 6). S100A8 were mainly present in IL-17 signaling pathway. LBP were mainly present in NF-kappa B signaling pathway and lipid and atherosclerosis.
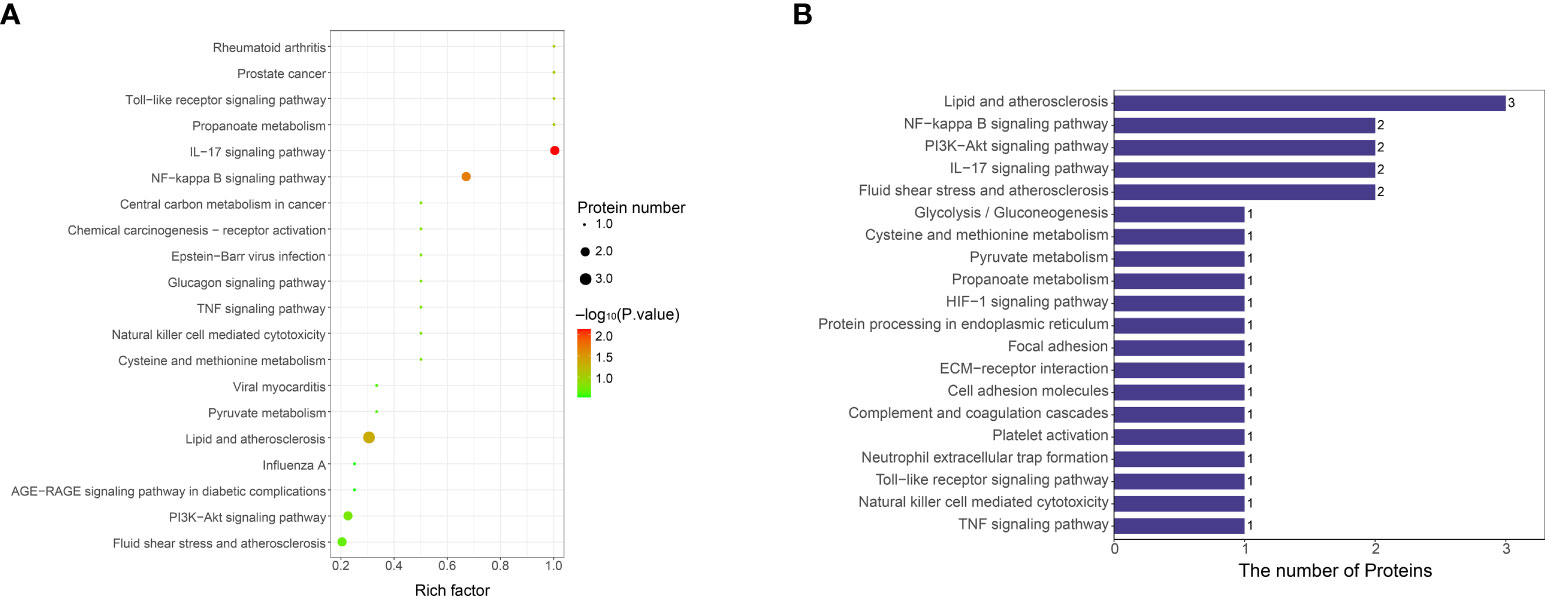
Figure 6 KEGG functional enrichment analysis of differentially expressed protein signaling pathways. (A) Bubble chart of signaling pathways associated with differentially expressed protein. The ordinate represents the statistical results of differential proteins under each KEGG pathway, the bubble color represents the significance of the enriched KEGG pathway, the P value is calculated based on Fisher’s exact test, and the color gradient represents the size of the P value (-log10), the closer the color is to red, the smaller the P value, and the higher the significance level of the corresponding metabolic pathway enrichment. (B) KEGG pathway annotation statistics for differentially expressed proteins. The ordinate is the name of the pathway involving differentially expressed proteins, and the abscissa represents the number of differentially expressed proteins involved in the pathway.
Protein interaction network for the differentially expressed proteins between VTE group and non-VTE group is shown in Figure 7. From the 280 differentially expressed proteins, 11 proteins were involved in protein interactions. SAA1, LBP involved interacting proteins.
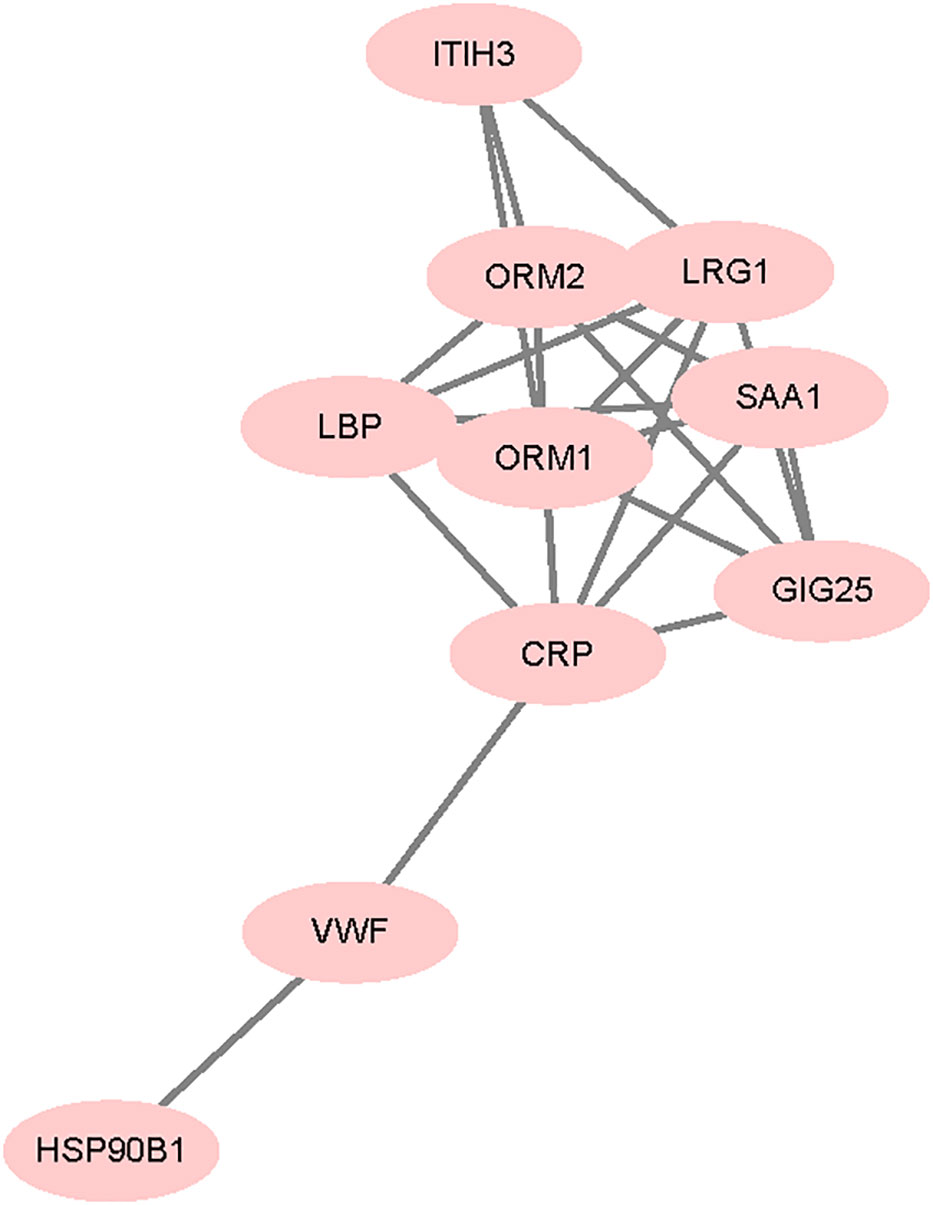
Figure 7 Differentially expressed protein interaction networks. Nodes represent proteins and lines represent protein-protein interactions.
In recent years, with the number of long-term cancer survivors steadily increasing, VTE in cancer patients has become a major health problem. The developments in proteomic approaches have enabled the discovery of disease-specific molecular markers, which can improve disease diagnosis and prognosis. To better understand the risk factors of VTE in NSCLC, we identified a matched control cohort of NSCLC but without VTE at the same time in the same hospital. Patients in the two groups were diagnosed with NSCLC within 3 year, which ensure that the VTE group and non-VTE group have the same background except VTE.
In this study, 42 plasma proteins were identified for upregulated in VTE group. Some of them are acute phase reactive proteins. Serum amyloid A1 (SAA1) was significantly increased in VTE group. SAA1 is a member of the SAA family which is whose level rise dramatically after trauma, infection and other stimuli. Not only is SAA a clinically useful marker of pro-inflammatory, it is considered a significant cardiovascular risk factor and clearly demonstrated to contribute to atherosclerosis development (21). SAA chemoattracts neutrophils, promotes endothelial dysfunction, induces tissue factor and ultimately activates coagulation both in arteries and veins. High levels of SAA were found to be associated with VTE and is considered to reflect tissue disturbances and inflammation associated with NSCLC invasion and metastasis, suggesting that it is a potential risk factor for VTE in NSCLC (16, 22–24).
S100A8, a member of the S100 family that normally forms a heterodimeric with S100A9 (calprotectin or S100A8/A9), was another upregulated protein in our study. Similar to SAA1, extracellular S100A8/A9 stimulates leukocyte recruitment and cytokine secretion (25). S100A8/A9 can promote tumor cell proliferation, invasion and metastasis, and its expression may be a potential prognostic factor of NSCLC patients (26). Increased S100A8/A9 were found to be associated with thrombus formation in acute coronary syndrome (ACS) (27). Kawano et al. (28) designed a S100A9 vaccine, which can result in long-term inhibition of thrombus formation through inhibition of increased S100A9/CD36 signaling without risk of bleeding or adverse autoimmune responses. Combining our findings, we thought S100A8/A9 may be a novel biomarker and therapeutic target of VTE in NSCLC patients.
Lipopolysaccharide-binding protein (LBP) binds lipopolysaccharide in the blood and transfers lipopolysaccharide to cellular receptor, which activates immune cells by producing inflammatory cytokines. Several studies have reported that LBP is a significant and independent predictor of atherosclerosis and cardiovascular disease (29–31). The pro-inflammatory effects of LBP might be an important contributor to the progression of atherosclerotic plaques. In addition to arterial disease, high LBP was found in fibrin clot of acute PE patients (32). Considering the data shown in this study, we speculate that LBP may promote vascular inflammation in NSCLC patients with VTE.
Reactive oxygen has been shown to cause endothelial damage, to promote atherosclerosis and to favor the development of thrombotic diseases. Haptoglobin (HP) is a plasma protein that binds free hemoglobin and inhibits the production of reactive oxygen species. High levels of serum HP were found to predict atherothrombotic (33). The study of Vormittag et al. (34) demonstrated that HP2-2, a kind of genotype of HP, is a risk factor for spontaneous VTE, presumably through a pathophysiological mechanism similar to arterial disease. Lactate dehydrogenase (LDH) is a tetramer composed of LDHA and LDHB subunits, which is most often measured to evaluate tissue damage. LDHA is particularly abundant in skeletal muscle and liver while LDHB is the major form in cardiac muscle. Elevated LDH levels is currently accepted as an important metric when there is clinical suspicion of pump induced thrombosis, as this kind of disorders are often accompanied by hemolysis (35, 36). LDHB and HP were elevated in the VTE group, indicating that NSCLC patients with VTE may have hemolysis or tissue damage.
The use of LMWH in VTE group was before blood collection in this study. However, LMWH have been applied for anti-inflammatory besides anticoagulation. Our results still showed a higher inflammatory state in VTE group than non-VTE group (37, 38). Previous studies have also suggested that patients with acute or chronic inflammation are at high risk of VTE. Inflammatory mediators can cause the expression of tissue factor, increase the levels of fibrinogen and plasminogen activator inhibitor, thus initiating the coagulation cascade and suppressing the fibrinolytic system (39).
Interestingly, the differentially expressed proteins we identified are not only associated with VTE, but also risk factors for arterial thrombosis. Arterial thrombosis and VTE were regarded as two completely different diseases in the past. Recent studies indicated that the two diseases share common risk factors, pathological mechanisms and preventive measures (40–42). Inflammation is most likely the underlying pathogenesis and the common mechanism by which different risk factors trigger venous and arterial thrombosis (43). Sussman et al. (44) found that most of the highly overexpressed genes in lung cancer with VTE were consistent with those identified in arterial thrombosis and inflammatory responses, which are quite consistent with the conclusion drawn by our proteomics analysis.
The blood routine parameters results confirmed DIA-MS analysis. Our clinical data show that neutrophil to lymphocyte ratio (NLR) in VTE group is significantly higher than non-VTE group (5.95 vs 2.40, P=0.002), which indicate that there is activation of inflammatory response in VTE group. Patients with lung cancer often exhibit leukocytosis (45). Activated neutrophils could enhance thrombosis in cancer patients by releasing neutrophil extracellular traps (NETs) (6). Murine models have confirmed that NETs contribute to thrombosis in lung cancer (46). Lung cancer patients with high NLR (≥3) also had a lower chance of VTE resolution (47). RBC and HGB in VTE group were significantly lower than those in non-VTE group. Decreased HGB are useful for predicting VTE risk in NSCLC patients (48), and prechemotherapy HGB level < 100 g/L is one of the laboratory parameters of VTE risk assessment in cancer patients (Khorana score) (49). The mechanism is less clear, possibly due to damage. In contrast, PDW was high in VTE group. PDW indicates variation in platelet size. Activated platelets provide procoagulant surface and release multiple molecules to amplify coagulation process. As an early index of platelet activation, increased PDW has been observed to be associated with artery thrombosis and VTE in many diseases (50–52). The role of PDW in NSCLC related VTE remains to be further confirmed.
The results of the bioinformatic analysis proved that inflammation, repair and cytokine play important roles in promoting the development of VTE and VTE may share common risk factors and pathways with arterial thrombosis in NSCLC, which may be useful for further investigations.
Nevertheless, there were some limitations in this study. First, the number of samples was small. Also, the identified differential proteins should be validated by other methods in future study and deep investigations are needed on the relevant mechanisms. To our knowledge, this study is the first to employ proteomics profiling to identify differentially expressed proteins and possible pathways for VTE in NSCLC patients, which may provide insights to develop new biomarkers for diagnosis, risk stratification and treatment of VTE in lung cancer.
The datasets presented in this study can be found in online repositories. The names of the repository/repositories and accession number(s) can be found below: http://www.proteomexchange.org/, PXD037222.
Written informed consent was obtained from the individual(s) for the publication of any potentially identifiable images or data included in this article.
LG conceived and designed the experiments. YL conducted the experiments and data analysis. Material preparation was performed by RM and GC. YA and YX provided technical support of experiments. YL and LG wrote the manuscript. YF prepared the figures and critically revised the manuscript. All authors contributed to the article and approved the submitted version.
This project is supported by the Henan Provincial Ministry Co-construction Project, Grant/Award Number: SB201901071.
The authors declare that the research was conducted in the absence of any commercial or financial relationships that could be construed as a potential conflict of interest.
All claims expressed in this article are solely those of the authors and do not necessarily represent those of their affiliated organizations, or those of the publisher, the editors and the reviewers. Any product that may be evaluated in this article, or claim that may be made by its manufacturer, is not guaranteed or endorsed by the publisher.
1. Timp JF, Braekkan SK, Versteeg HH, Cannegieter SC. Epidemiology of cancer-associated venous thrombosis. Blood (2013) 122(10):1712–23. doi: 10.1182/blood-2013-04-460121
2. Ay C, Pabinger I, Cohen AT. Cancer-associated venous thromboembolism: Burden, mechanisms, and management. Thromb Haemost (2017) 117(2):219–30. doi: 10.1160/TH16-08-0615
3. Ikushima S, Ono R, Fukuda K, Sakayori M, Awano N, Kondo K. Trousseau’s syndrome cancer-associated thrombosis. Jpn J Clin Oncol (2016) 46(3):204–8. doi: 10.1093/jjco/hyv165
4. Fernandes CJ, Morinaga LTK, Alves JL Jr, Castro MA, Calderaro D, Jardim CVP, et al. Cancer-associated thrombosis: the when, how and why. Eur Respir Rev (2019) 28(151):180119. doi: 10.1183/16000617.0119-2018
5. Corrales-Rodriguez L, Blais N. Lung cancer associated venous thromboembolic disease:A comprehensive review. Lung Cancer (2012) 75(1):1–8. doi: 10.1016/j.lungcan.2011.07.004
6. Hisada Y, Mackman N. Cancer-associated pathways and biomarkers of venous thrombosis. Blood (2017) 130(13):1499–506. doi: 10.1182/blood-2017-03-743211
7. Tagalakis V, Levi D, Agulnik JS, Cohen V, Kasymjanova G, Small D. High risk of deep vein thrombosis in patients with non-small cell lung cancer: A cohort study of 493 patients. J Thorac Oncol (2007) 2(8):729–34. doi: 10.1097/JTO.0b013e31811ea275
8. Li Y, Shang Y, Wang W, Ning S, Chen H. Lung cancer and pulmonary embolism: what is the relationship? A review. J Cancer (2018) 9(17):3046–57. doi: 10.7150/jca.26008
9. Chew HK, Davies AM, Wun T, Harvey D, Zhou H, White RH. The incidence of venous thromboembolism among patients with primary lung cancer. J Thromb Haemost (2008) 6(4):601–8. doi: 10.1111/j.1538-7836.2008.02908.x
10. Bounameaux H, Perrier A, Righini M. Diagnosis of venous thromboembolism: an update. Vasc Med (2010) 15(5):399–406. doi: 10.1177/1358863X10378788
11. Schmidt B, Michler R, Klein M, Faulmann G, Weber C, Schellong S. Ultrasound screening for distal vein thrombosis is not beneficial after major orthopedic surgery. a randomized controlled trial. Thromb Haemost (2003) 90(5):949–54. doi: 10.1160/TH03-03-0154
12. Flores-Nascimento MC, Paes-Leme AF, Mazetto BM, Zanella JL, Paula EVD, Annichino-Bizzacchi JM. Immune and lipid transportation proteins are differentially expressed in spontaneous and proximal deep vein thrombosis patients. Thromb Res (2012) 130(5):e246–50. doi: 10.1016/j.thromres.2012.08.306
13. Ramacciotti E, Hawley AE, Wrobleski SK, Jr DDM, Strahler JR, Andrews PC, et al. Proteomics of microparticles after deep venous thrombosis. Thromb Res (2010) 125(6):e269–74. doi: 10.1016/j.thromres.2010.01.019
14. Zhang F, Ge W, Ruan G, Cai X, Guo T. Data-independent acquisition mass spectrometry-based proteomics and software tools: A glimpse in 2020. Proteomics (2020) 20(17-18):e1900276. doi: 10.1002/pmic.201900276
15. Nigjeh EN, Chen R, Brand RE, Petersen GM, Chari ST, Haller PD, et al. Quantitative proteomics based on optimized data-independent acquisition in plasma analysis. J Proteome Res (2017) 16(2):665–76. doi: 10.1021/acs.jproteome.6b00727
16. Han B, Li C, Li H, Li Y, Luo X, Liu Y, et al. Discovery of plasma biomarkers with data-independent acquisition mass spectrometry and antibody microarray for diagnosis and risk stratification of pulmonary embolism. J Thromb Haemost (2021) 19(7):1738–51. doi: 10.1111/jth.15324
17. Letunica N, Van Den Helm S, McCafferty C, Swaney E, Cai T, Attard C, et al. Proteomics in Thrombosis and hemostasis. Thromb Haemost (2022) 122(7):1076–84. doi: 10.1055/a-1690-8897
18. Edge SB, Compton CC. The American joint committee on cancer: the 7th edition of the AJCC cancer staging manual and the future of TNM. Ann Surg Oncol (2010) 17(6):1471–4. doi: 10.1245/s10434-010-0985-4
19. Bates SM, Jaeschke R, Stevens SM, Goodacre S, Wells PS, Stevenson MD, et al. Antithrombotic therapy and prevention of thrombosis, 9th ed: American college of chest physicians evidence-based clinical practice guidelines. Chest (2012) 141(2 Suppl):e351S–418S. doi: 10.1378/chest.141.4.1129
20. Konstantinides SV, Torbicki A, Agnelli G, Danchin N, Fitzmaurice D, Galiè N, et al. ESC Guidelines on the diagnosis and management of acute pulmonary embolism. Eur Heart J (2014) 35(43):3033–69. doi: 10.1093/eurheartj/ehu283
21. Hua S, Song C, Geczy CL, Freedman SB, Witting PK. A role for acute-phase serum amyloid a and high-density lipoprotein in oxidative stress, endothelial dysfunction and atherosclerosis. Redox Rep (2009) 14(5):187–96. doi: 10.1179/135100009X12525712409490
22. Deguchi H, Elias DJ, Navarro S, España F, Griffin JH. Elevated serum amyloid a is associated with venous thromboembolism. Thromb Haemost (2013) 109(2):358–9.
23. Flores-Nascimento MC, Paes-Leme AF, Mazetto BM, Zanella JL, Paula EVD, Annichino-Bizzacchi JM. Inflammatory, immune and lipid transportation proteins are differentially expressed in spontaneous and proximal deep vein thrombosis patients. Thromb Res (2012) 130(5):e246–50. doi: 10.1016/j.thromres.2012.08.306
24. Kanoh Y, Abe T, Masuda N, Akahoshi T. Progression of non-small cell lung cancer: diagnostic and prognostic utility of matrix matalloproteinase-2, c-reactive protein and serum amyloid a. Oncol Rep (2013) 29(2):469–73. doi: 10.3892/or.2012.2123
25. Wang S, Song R, Wang Z, Jing Z, Wang S, Ma J. S100A8/A9 in inflammation. Front Immunol (2018) 9:1298. doi: 10.3389/fimmu.2018.01298
26. Koh HM, An HJ, Ko GH, Lee JH, Lee JS, Kim DC, et al. Prognostic role of S100A8 and S100A9 protein expressions in non-small cell carcinoma of the lung. J Pathol Transl Med (2019) 53(1):13–22. doi: 10.4132/jptm.2018.11.12
27. Sakuma M, Tanaka A, Kotooka N, Hikichi Y, Toyoda S, Abe S, et al. Myeloid-related protein-8/14 in acute coronary syndrome. Int J Cardiol (2017) 249:25–31. doi: 10.1016/j.ijcard.2017.09.020
28. Kawano T, Shimamura M, Nakagami H, Iso T, Koriyama H, Takeda S, et al. Therapeutic vaccine against S100A9 (S100 calcium-binding protein A9) inhibits thrombosis without increasing the risk of bleeding in ischemic stroke in mice. Hypertension (2018) 72(6):1355–64. doi: 10.1161/HYPERTENSIONAHA.118.11316
29. Lepper PM, Schumann C, Triantafilou K, Rasche FM, Schuster T, Frank H, et al. Association of lipopolysaccharide-binding protein and coronary artery disease in men. J Am Coll Cardiol (2007) 50(1):25–31. doi: 10.1016/j.jacc.2007.02.070
30. Serrano M, Moreno-Navarrete JM, Puig J, Moreno M, Guerra E, Ortega F, et al. Serum lipopolysaccharide-binding protein as a marker of atherosclerosis. Atherosclerosis (2013) 230(2):223–7. doi: 10.1016/j.atherosclerosis.2013.07.004
31. Asada M, Oishi E, Sakata S, Hata J, Yoshida D, Honda T, et al. Serum lipopolysaccharide-binding protein levels and the incidence of cardiovascular disease in a general Japanese population: The hisayama study. J Am Heart Assoc (2019) 8(21):e013628. doi: 10.1161/JAHA.119.013628
32. Bryk AH, Natorska J, Ząbczyk M, Zettl K, Wiśniewski JR, Undas A. Plasma fibrin clot proteomics in patients with acute pulmonary embolism: Association with clot properties. J Proteomics (2020) 229:103946. doi: 10.1016/j.jprot.2020.103946
33. Brea D, Sobrino T, Blanco M, Fraga M, Agulla J, Rodríguez-Yáñez M, et al. Usefulness of haptoglobin and serum amyloid a proteins as biomarkers for atherothrombotic ischemic stroke diagnosis confirmation. Atherosclerosis (2009) 205(2):561–7. doi: 10.1016/j.atherosclerosis.2008.12.028
34. Vormittag R, Vukovich T, Mannhalter C, Minar E, Schönauer V, Bialonczyk C, et al. Haptoglobin phenotype 2-2 as a potentially new risk factor for spontaneous venous thromboembolism. Haematologica (2005) 90(11):1557–61.
35. Gordon JS, Wood CT, Luc JGY, Watson RA, Maynes EJ, Choi JH, et al. Clinical implications of LDH isoenzymes in hemolysis and continous-flow left ventricular assist device-induced thrombosis. Artif Organs (2020) 44(3):231–8. doi: 10.1111/aor.13565
36. Bartoli CR, Zhang D, Kang J, Hennessy-Strahs S, Restle D, Howard J, et al. Clinical and in vitro evidence that subclinical hemolysis contributes to LVAD thrombosis. Ann Thorac Surg (2018) 105(3):807–14. doi: 10.1016/j.athoracsur.2017.05.060
37. Beurskens DMH, Huckriede JP, Schrijver R, Hemker HC, Reutelingsperger CP, Nicolaes GAF, et al. The anticoagulant and nonanticoagulant propertier of heparin. Thromb Haemost. (2020) 120(10):1371–83. doi: 10.1055/s-0040-1715460
38. Gao J, Huang LH, Wang JL. Outcomes of anticoagulant therapy with low-molecular-weight heparin (LMWH) and warfarin for thromboangiitis obliterans. Curr Vasc Pharmacol (2021) 19(6):655–62. doi: 10.2174/1570161119666210118125424
39. Esmon CT. Does inflammation contribute to thrombotic events? Haemostasis (2000) 30 Suppl 2:34–40. doi: 10.1159/000054161
40. Lowe GD. Arterial disease and venous thrombosis: Are they related, and if so, what should we do about it? J Thromb Haemost (2006) 4(9):1882–5. doi: 10.1111/j.1538-7836.2006.02130.x
41. Rinde LB, Lind C, Småbrekke B, Njølstad I, Mathiesen EB, Wilsgaard T, et al. Impact of incident myocardial infarction on the risk of venous thromboembolism: The tromso study. J Thromb Haemost (2016) 14(6):1183–91. doi: 10.1111/jth.13329
42. Lippi G, Favaloro EJ. Venous and arterial thromboses: Two sides of the same coin? Semin Thromb Hemost (2018) 44(3):239–48. doi: 10.1055/s-0037-1607202
43. Poredoš P. Interrelationship between venous and arterial thrombosis. Int Angiol (2017) 36(4):295–8. doi: 10.23736/S0392-9590.17.03820-2
44. Sussman TA, Abazeed ME, McCrae KR, Khorana AA. RNA Expression and risk of venous thromboembolism in lung cancer. Res Pract Thromb Haemost (2019) 4(1):117–23. doi: 10.1002/rth2.12284
45. Grieshober L, Graw S, Barnett MJ, Goodman GE, Chen C, Koestler DC, et al. Pre-diagnosis neutrophil-to-lymphocyte ratio and mortality in individuals who develop lung cancer. Cancer Causes Control. (2021) 32(11):1227–36. doi: 10.1007/s10552-021-01469-3
46. Hisada Y, Geddings JE, Ay C, Mackman N. Venous thrombosis and cancer: From mouse models to clinical trials. J Thromb Haemost (2015) 13(8):1372–82. doi: 10.1111/jth.13009
47. Go SI, Lee A, Lee US, Choi HJ, Kang MH, Kang JH, et al. Clinical significance of the neutrophil-lymphocyte ratio in venous thromboembolism patients with lung cancer. Lung Cancer (2014) 84(1):79–85. doi: 10.1016/j.lungcan.2014.01.014
48. Wang Z, Yan HH, Yang JJ, Wang BC, Chen HJ, Zhou Q, et al. Venous thromboembolism risk factors in Chinese non-small cell cancer patients. Support Care Cancer (2015) 23(3):635–41. doi: 10.1007/s00520-014-2405-y
49. Pabinger I, Thaler J, Ay C. Biomarkers for prediction of venous thromboembolism in cancer. Blood (2013) 122(12):2011–8. doi: 10.1182/blood-2013-04-460147
50. Shi Y, Jiang H, Huang C, Hu C, Zhao J, Li M, et al. Platelet distribution width is highly associated with thrombotic events in primary antiphospholipid syndrome. Clin Rheumatol (2021) 40(11):4581–8. doi: 10.1007/s10067-021-05843-z
51. Kamisli O, Kamisli S, Kablan Y, Gonullu S, Ozcan C. The prognostic value of an increased mean platelet volume and platelet distribution width in the early phase of cerebral venous sinus thrombosis. Clin Appl Thromb Hemost (2013) 19(1):29–32. doi: 10.1177/1076029612453196
Keywords: thromboembolism, NSCLC, biomarkers, proteomics, mass spectrometry
Citation: Liu Y, Gao L, Fan Y, Ma R, An Y, Chen G and Xie Y (2023) Discovery of protein biomarkers for venous thromboembolism in non-small cell lung cancer patients through data-independent acquisition mass spectrometry. Front. Oncol. 13:1079719. doi: 10.3389/fonc.2023.1079719
Received: 25 October 2022; Accepted: 23 January 2023;
Published: 09 February 2023.
Edited by:
Mariana Boroni, National Cancer Institute (INCA), BrazilReviewed by:
Sheau-Chiann Chen, Vanderbilt University Medical Center, United StatesCopyright © 2023 Liu, Gao, Fan, Ma, An, Chen and Xie. This is an open-access article distributed under the terms of the Creative Commons Attribution License (CC BY). The use, distribution or reproduction in other forums is permitted, provided the original author(s) and the copyright owner(s) are credited and that the original publication in this journal is cited, in accordance with accepted academic practice. No use, distribution or reproduction is permitted which does not comply with these terms.
*Correspondence: Lan Gao, Z2FvbGFuQHp6dS5lZHUuY24=
†These authors share first authorship
‡ORCID: Yanhong Liu, orcid.org/0000-0003-1795-8437
Disclaimer: All claims expressed in this article are solely those of the authors and do not necessarily represent those of their affiliated organizations, or those of the publisher, the editors and the reviewers. Any product that may be evaluated in this article or claim that may be made by its manufacturer is not guaranteed or endorsed by the publisher.
Research integrity at Frontiers
Learn more about the work of our research integrity team to safeguard the quality of each article we publish.