 Reihane Kazerani1
 Pouya Salehipour2
 Mohammadreza Shah Mohammadi3
 Elnaz Amanzadeh Jajin3
 Mohammad Hossein Modarressi2*
- 1Department of Biology, Science and Research Branch, Islamic Azad University, Tehran, Iran
- 2Department of Medical Genetics, School of Medicine, Tehran University of Medical Science, Tehran, Iran
- 3Functional Neurosurgery Research Center, Shohada Tajrish Comprehensive Neurosurgical Center of Excellence, Shahid Beheshti University of Medical Sciences, Tehran, Iran
Introduction: Brain tumors (BTs) are perceived as one of the most common malignancies among children. The specific regulation of each gene can play a critical role in cancer progression. The present study aimed to determine the transcripts of the TSGA10 and GGNBP2 genes, considering the alternative 5′UTR region, and investigating the expression of these different transcripts in BTs.
Material and methods: Public data on brain tumor microarray datasets in GEO were analyzed with R software to evaluate the expression levels of TSGA10 and GGNBP2 genes (the Pheatmap package in R was also used to plot DEGs in a heat map). In addition, to validate our in-silico data analysis, RT-PCR was performed to determine the splicing variants of TSGA10 and GGNBP2 genes in testis and brain tumor samples. The expression levels of splice variants of these genes were analyzed in 30 brain tumor samples and two testicular tissue samples as a positive control.
Results: In silico results show that the differential expression levels of TSGA10 and GGNBP2 were significant in the GEO datasets of BTs compared to normal samples (with adjusted p-value<0.05 and log fold change > 1). This study’s experimental results showed that the TSGA10 gene produces four different transcripts with two distinct promoter regions and splicing exon 4. The relative mRNA expression of transcripts without exon 4 was higher than transcripts with exon 4 in BT samples (p-value<001). In GGNBP2, exon 2 in the 5′UTR region and exon 6 in the coding sequence were spliced. The expression analysis results showed that the relative mRNA expression of transcript variants without exon 2 was higher than other transcript variants with exon 2 in BT samples (p-value<001).
Conclusion: The decreased expression levels of transcripts with longer 5′UTR in BT samples than in testicular or low-grade brain tumor samples may decrease their translation efficiency. Therefore, decreased amounts of TSGA10 and GGNBP2 as potential tumor suppressor proteins, especially in high-grade brain tumors, may cause cancer development by angiogenesis and metastasis.
Introduction
Primary brain tumors (BTs) originate from various types of nerve cells (1). Nerve cell neoplasms are regarded as one of the most prevalent tumors in children aged 0-14 years old and are one of the leading causes of death among this age group. These tumors are often associated with many clinical symptoms, such as headache, nausea, vomiting, vision loss, and others. Multiform glioblastoma is one of the most common and lethal primary brain tumors. The survival rate of these patients varies according to the histology and molecular characteristics of the tumor (2, 3). Different genetic mutations have helped to differentiate BTs, their classification, prognosis, and therapeutic responses (4–7). Moreover, the expression alterations of the oncogene or tumor suppressor gene can lead to tumor progression (8) (1).
Cancer testis antigens (CTAs) are normally and primarily expressed in germinal cells such as the testis and fetal ovary, along with the trophoblasts of the placenta under homeostatic conditions. They can be expressed in multiple malignancies (9). Given this, two types of CTAs are detected: encoded on the X chromosome (cancer testis-X antigens) and not encoded on the X chromosome (non-X cancer-testis antigens). The CT-X genes are mainly expressed in spermatogonia, while non-X CT genes are expressed in the later stage of germ-cell differentiation (10, 11). The expressions of CTAs in cancers supply prognostic value. Since CTAs are highly immunogenic and have limited expression in normal tissues, they became extremely appropriate targets for immunotherapy. However, the heterogeneous expression of many CTAs impedes their prosperous use in the clinical approach (12). Germ cell development processes and tumor progression are remarkably similar in terms of meiosis inducing, immortalization, invasion, and migration (10), indicating the pivotal role of testis-specific genes in cancer studies.
Testis-specific gene antigen 10 (TSGA10) is one of the potential CT-antigens (Cancer/Testis Antigen 79), predominantly expressed in testis and overexpressed in some tumors, such as BTs (13, 14). The overexpression of TSGA10 has been observed in embryogenesis, brain development, and some malignancies, including BTs. TSGA10 was discovered in 2001, and the protein consists of two fragments, including an N-terminal, 27 kDa, located in the fibrous sheath of the sperm tail, and a C-terminal, 55 kDa (14–16). The accumulation of TSGA10 inhibited the hypoxia-inducible factor 1a (HIF-1a) and prevented angiogenesis and metastasis (17). Since TSGA10 is involved in neuronal development and BTs, it could potentially serve as a biomarker for diagnostic and therapeutic targets (13).
Another important potential CT-antigen is Gametogenetin binding protein 2 (GGNBP2), located on chromosome 17q12, and is known as DIF3, LZK1, DIF-3, LCRG1, ZFP403, and ZNF403 (18). GGNBP2 is associated with spermatogenesis and is mainly expressed in the late stage of spermatocytes and the early stage of round spermatids, especially in the initial stage of spermatid meiosis (19). This gene acts as a tumor suppressor in some cancers, such as breast cancer, glioma, prostate cancer, and ovarian cancer (20–22). Its downregulation in primary laryngeal carcinomas leads to laryngeal tumorigenesis (23).
Alternative splicing is a key to transcriptome and proteome diversification in eukaryotes (24, 25), resulting in the expression of multiple RNA and vast protein diversity from one gene (26). A defect in this mechanism induces many diseases, including cancers. Cancer cells perform significant transcriptome alteration partly by cancer-specific splicing isoforms. It is identified as an essential indication for tumor progression and therapy in cancer (25, 27, 28). 5′UTR plays a critical role in regulating gene expression and controlling mRNA translation and stability (29). Various 5′UTR sequences derived from alternative splicing of non-coding exons can give rise to diverse variants of mature mRNAs (24, 29).
Untranslated regions contain exons around the coding sequence, which are transcribed into mRNA but are not translated into protein. These areas, named 5′UTR and 3′UTR, play significant roles in translational regulation. The average length of a 5′UTR is 100bp to 220bp among different species (30). The minimum length of 5′UTR is 18 nucleotides and the longest identified 5′UTR in humans is an oncogene mRNA with 2858 nucleotides (31). In vertebrates, transcription factors, proto-oncogenes, tumor suppressors, growth factors, and their receptors seek to manufacture transcripts with longer and more complicated 5′UTR regions (32, 33).
This study analyzed the 5′UTR region of TSGA10 and GGNBP2, considering the significance of the regulatory effects of 5′UTR and unclear mechanisms regulating the expression of TSGA10 and GGNBP2 in normal and cancer cells. Given the roles of TSGA10 and GGNBP2, cells may regulate the expression of these genes in both the transcription and translation stages. This article reports on the different expression patterns of TSGA10 and GGNBP2 transcript variants with different 5′UTR sequences in human brain tumor samples. Moreover, we investigated the pathways and genes related to TSGA10 and the brain tumor.
Materials and methods
Patients and samples
Thirty BT tissue samples belonging to the Shohadaye Tajrish Hospital from May 2018 to February 2019 were obtained according to the protocols of the Medical Ethics Committee. The tissues were collected in tubes and treated with RNA later. All the patients suffered from primary BTs with no radiotherapy or chemotherapy medical history. The patients’ characteristics, tumor types, and tumor grades were recorded for all patients (Table 1). Then, two normal testis tissues were derived from the prostate cancer patients treated with orchiectomy. Written informed consent was obtained from the participants.
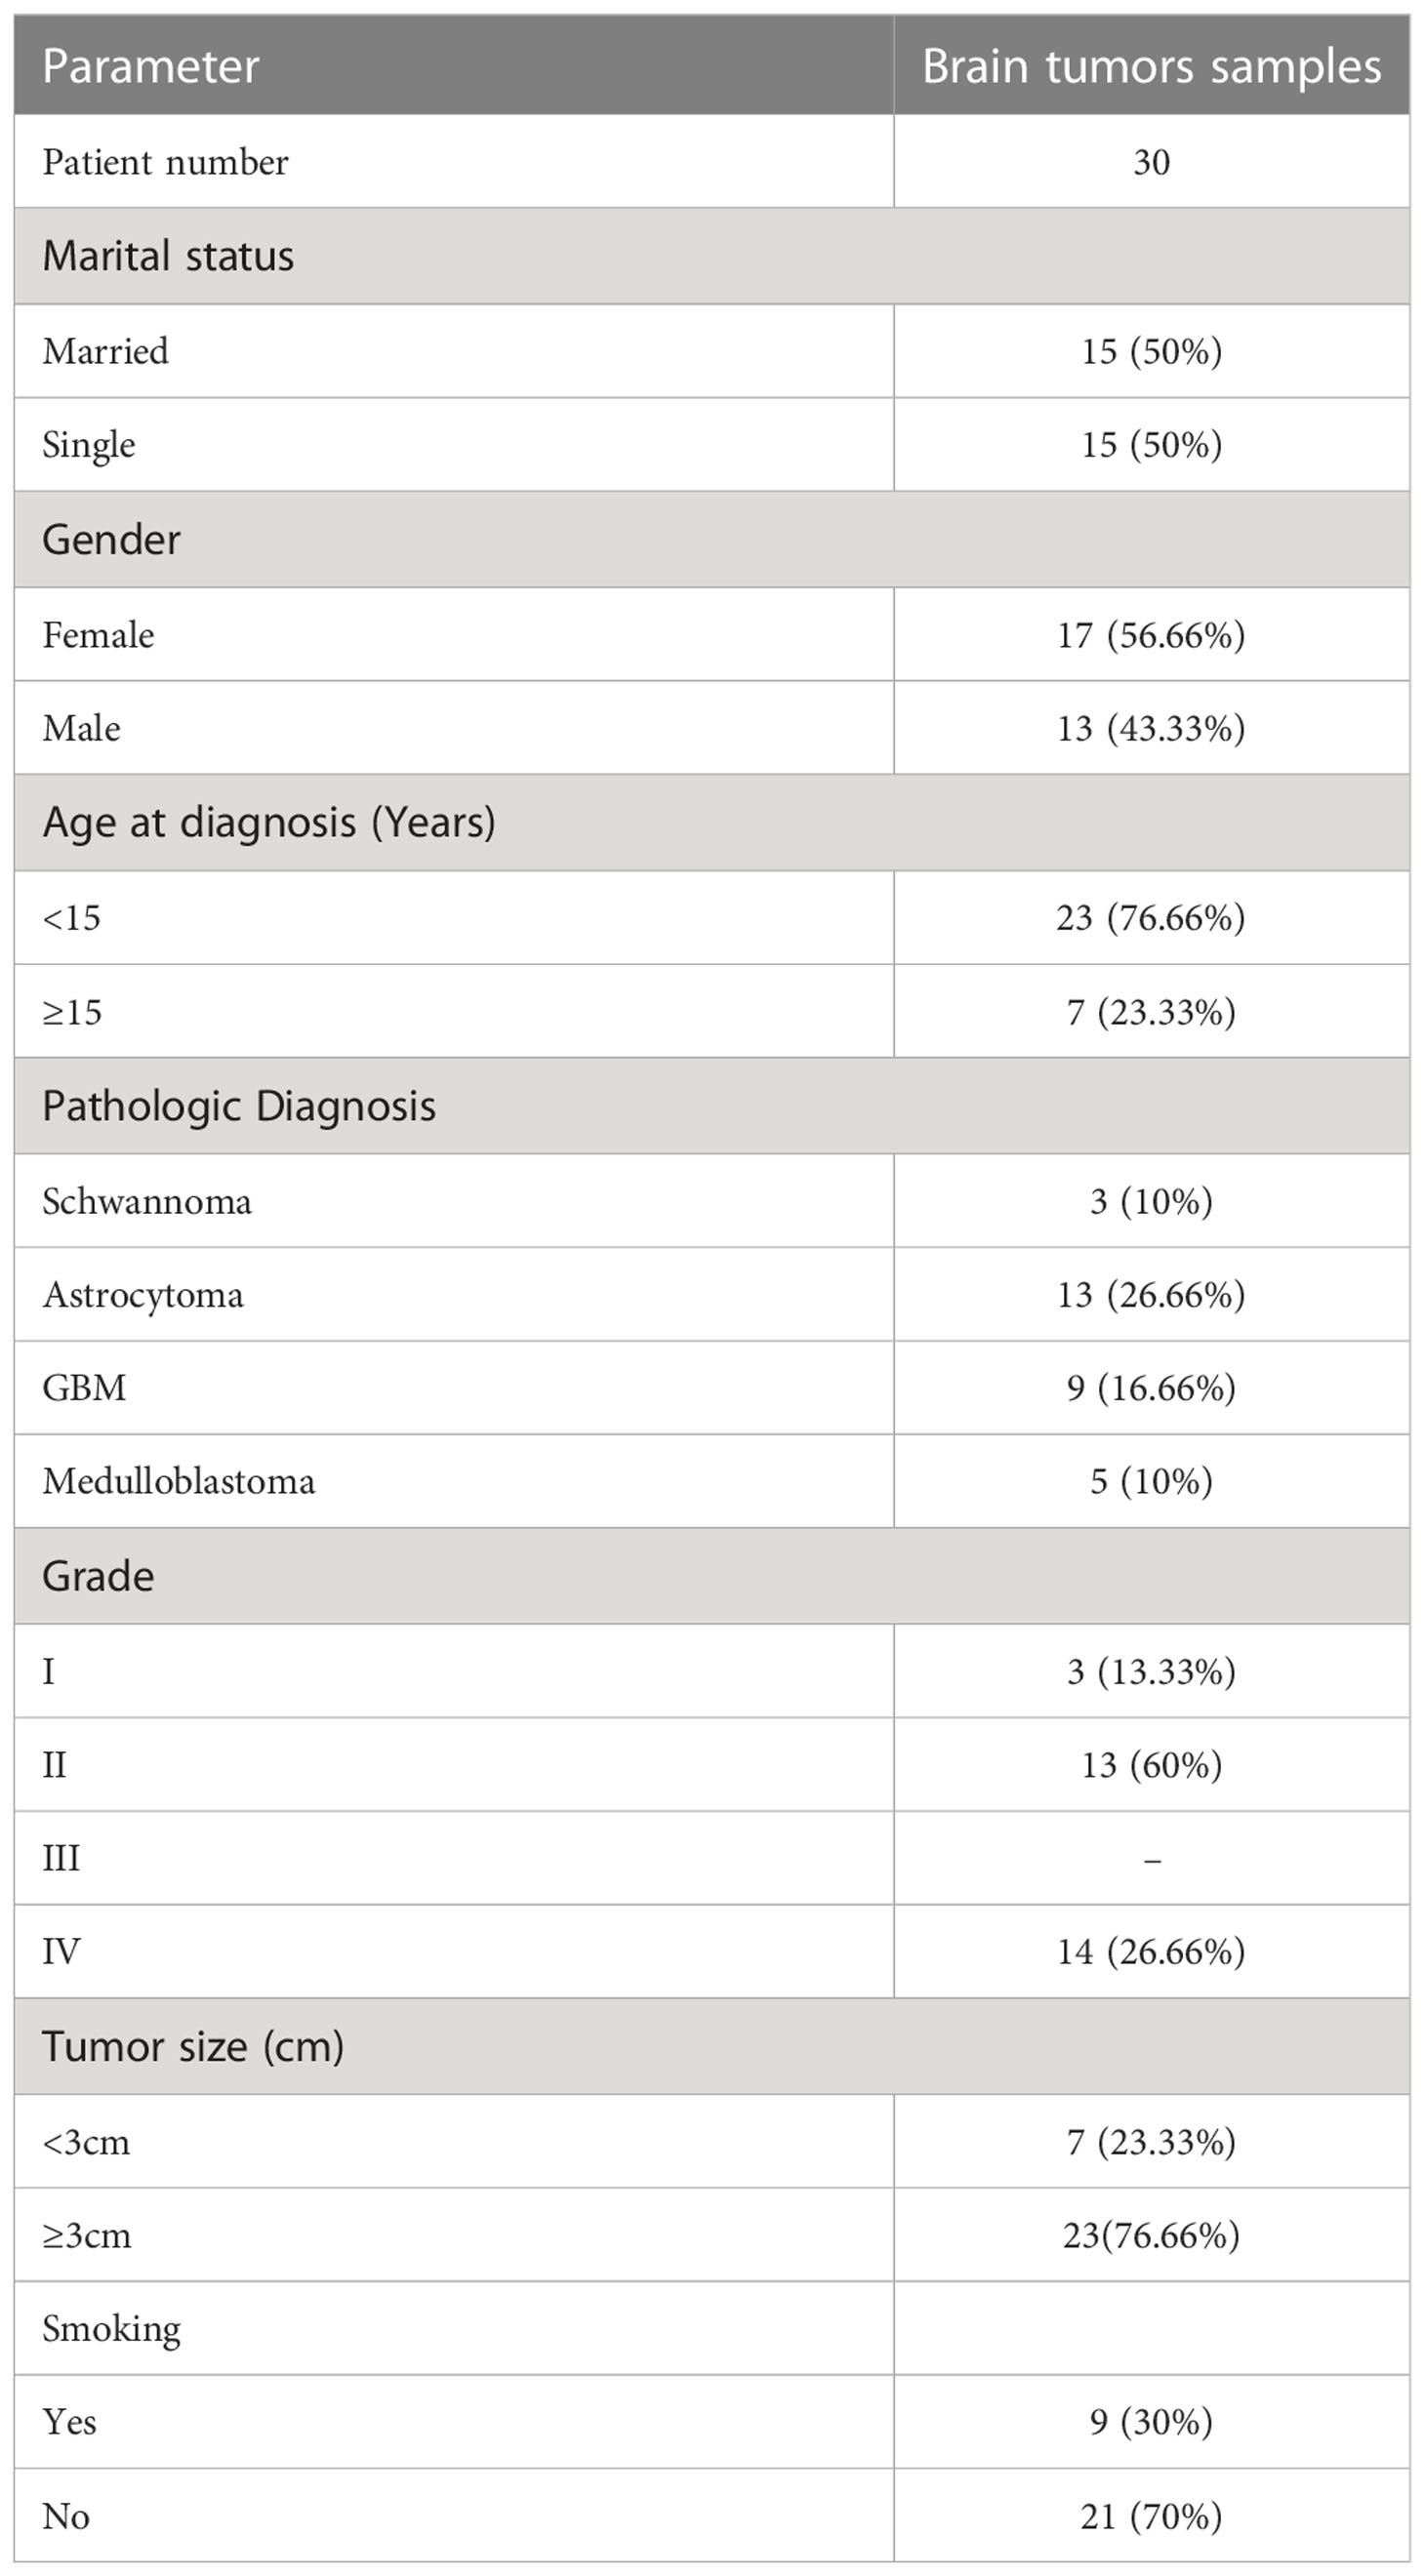
Table 1 Demographic and pathological characteristics of the study participants.
Bioinformatics analysis of target genes
We searched for public data on BT microarray datasets in order to assess the expression levels of TSGA10 and GGNBP2. The GEO (34) database was searched by applying filters to find the experiments, including healthy brain samples and intact brain samples with different BTs. Accordingly, all the studies or samples with BT patients undergoing any treatment methods were removed from the data. Datasets with GSE15824 (35), GSE35493 (36), and GSE50161 (37) were finally selected to be included in this study. Matrix data and description data files were downloaded to find differentially expressed genes (DEGs) and the screening expression levels of TSGA10 and GGNBP2. Given that each experiment included various types of tumors, we selected the samples required for each comparison. In this regard, a comparison of glioblastoma (12 samples) vs. healthy control (9 samples) and medulloblastoma (21 samples) vs. healthy control (9 samples) was conducted from the GSE35493 dataset. Moreover, BTs (33 samples including glioblastoma and medulloblastoma samples) vs. healthy control (12 samples) were compared from this dataset. Furthermore, Oligodendrioma (7 samples) vs. healthy control (2 samples), glioblastoma (25 samples) vs. healthy control (2 samples), and astrocytoma (11 samples) vs. healthy control (2 samples) were compared from the GSE15824 dataset. A comparison of BTs (42 samples including mentioned BT samples) vs. healthy control (2 samples) was also performed for this platform. Then astrocytoma (15 samples) vs. healthy control (13 samples), ependymoma (46 samples) vs. healthy control (13 samples), glioblastoma (34 samples) vs. healthy control (13 samples), and medulloblastoma (22 samples) vs. control (13 samples) were compared from the GSE50161 dataset. Finally, BTs (117 samples including mentioned BT samples) and healthy control (13 samples) were compared from the same dataset.
Data analysis and DEGs identification
Analyses were performed in R, using Limma (38), GEOquery (39), and UMAP (40) packages. The raw data of the microarray was preprocessed to convert probes into gene symbols, using GEOquery software. Then, data clean-up was performed to remove probes with no gene symbols or gene symbols with more than one probe using the UMAP package. Data normalization and DEG screening between BTs and healthy controls were performed in R, using the Limma package (version 4.1). The significant differential expression level was set at adjusted p-value<0.05 and log-fold change > 1. The pheatmap package in R was also used to plot DEGs as a heat map (41).
Primer design
The primer sequence of TSGA10 gene transcripts for the 5’UTR region and one reverse primer from the coding sequence of TSGA10 were designed to check the expressed transcripts from the coding region (Figure 1). The primers were used from Salehipour et al.’s study to examine the transcripts of this gene in breast cancer (42). NCBI Primer-Blast was applied to design the primers of the GGNBP2 gene for alternative splicing analyses, and their specificity was checked (Figure 2). Then, the primers designed by Gene Runner software were examined. A pair of primers for housekeeping gene phosphoglucomutase 1 (PGM1) was designed to control cDNA synthesis from our RNA samples. Table 2 shows the sequence of the primers.
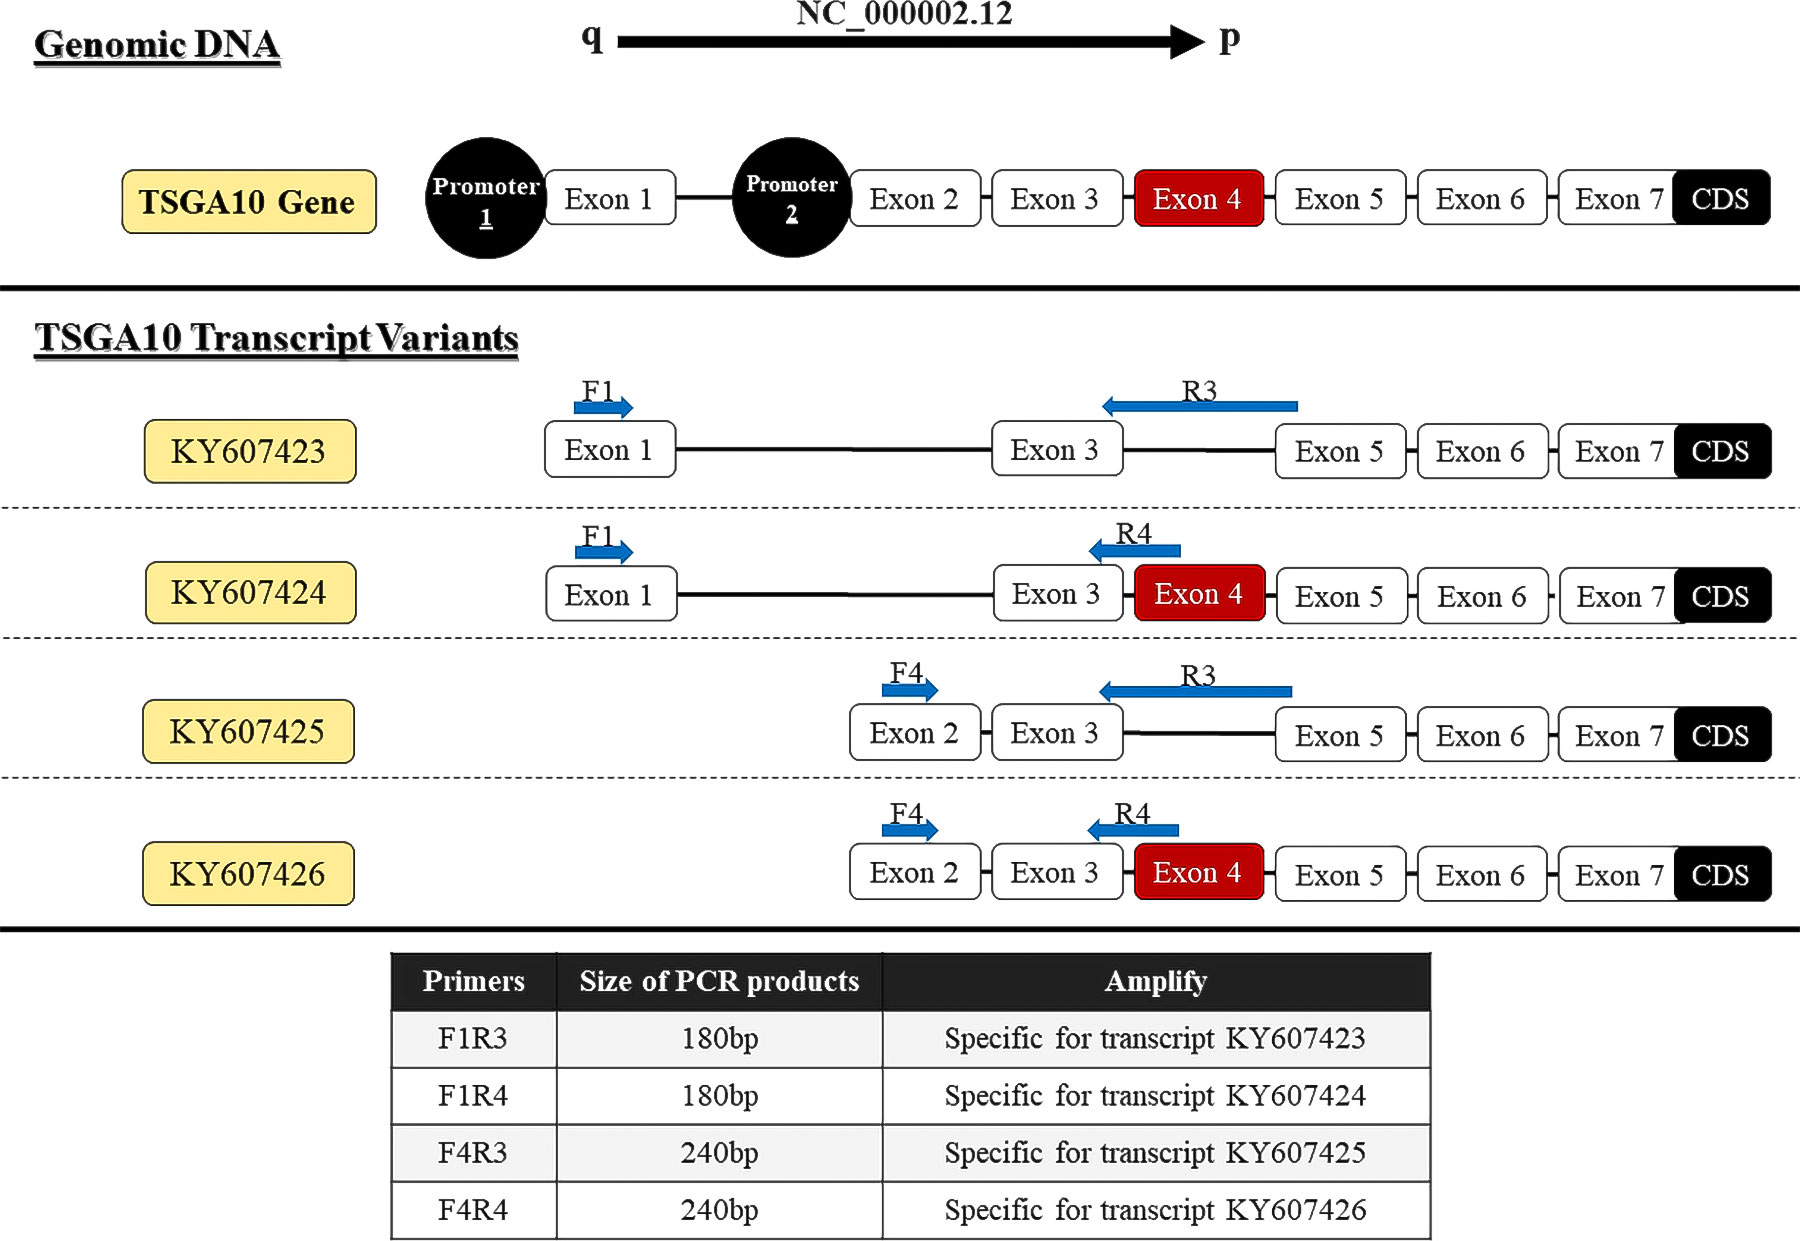
Figure 1 Locations of primers to amplify TSGA10 splice variants. Exons number 1-7, which form the 5′UTR region of four experimentally approved transcript variants. Primers were designed to detect spliced variants based on exon 4 splicing and two distinct promoters (shown in red).
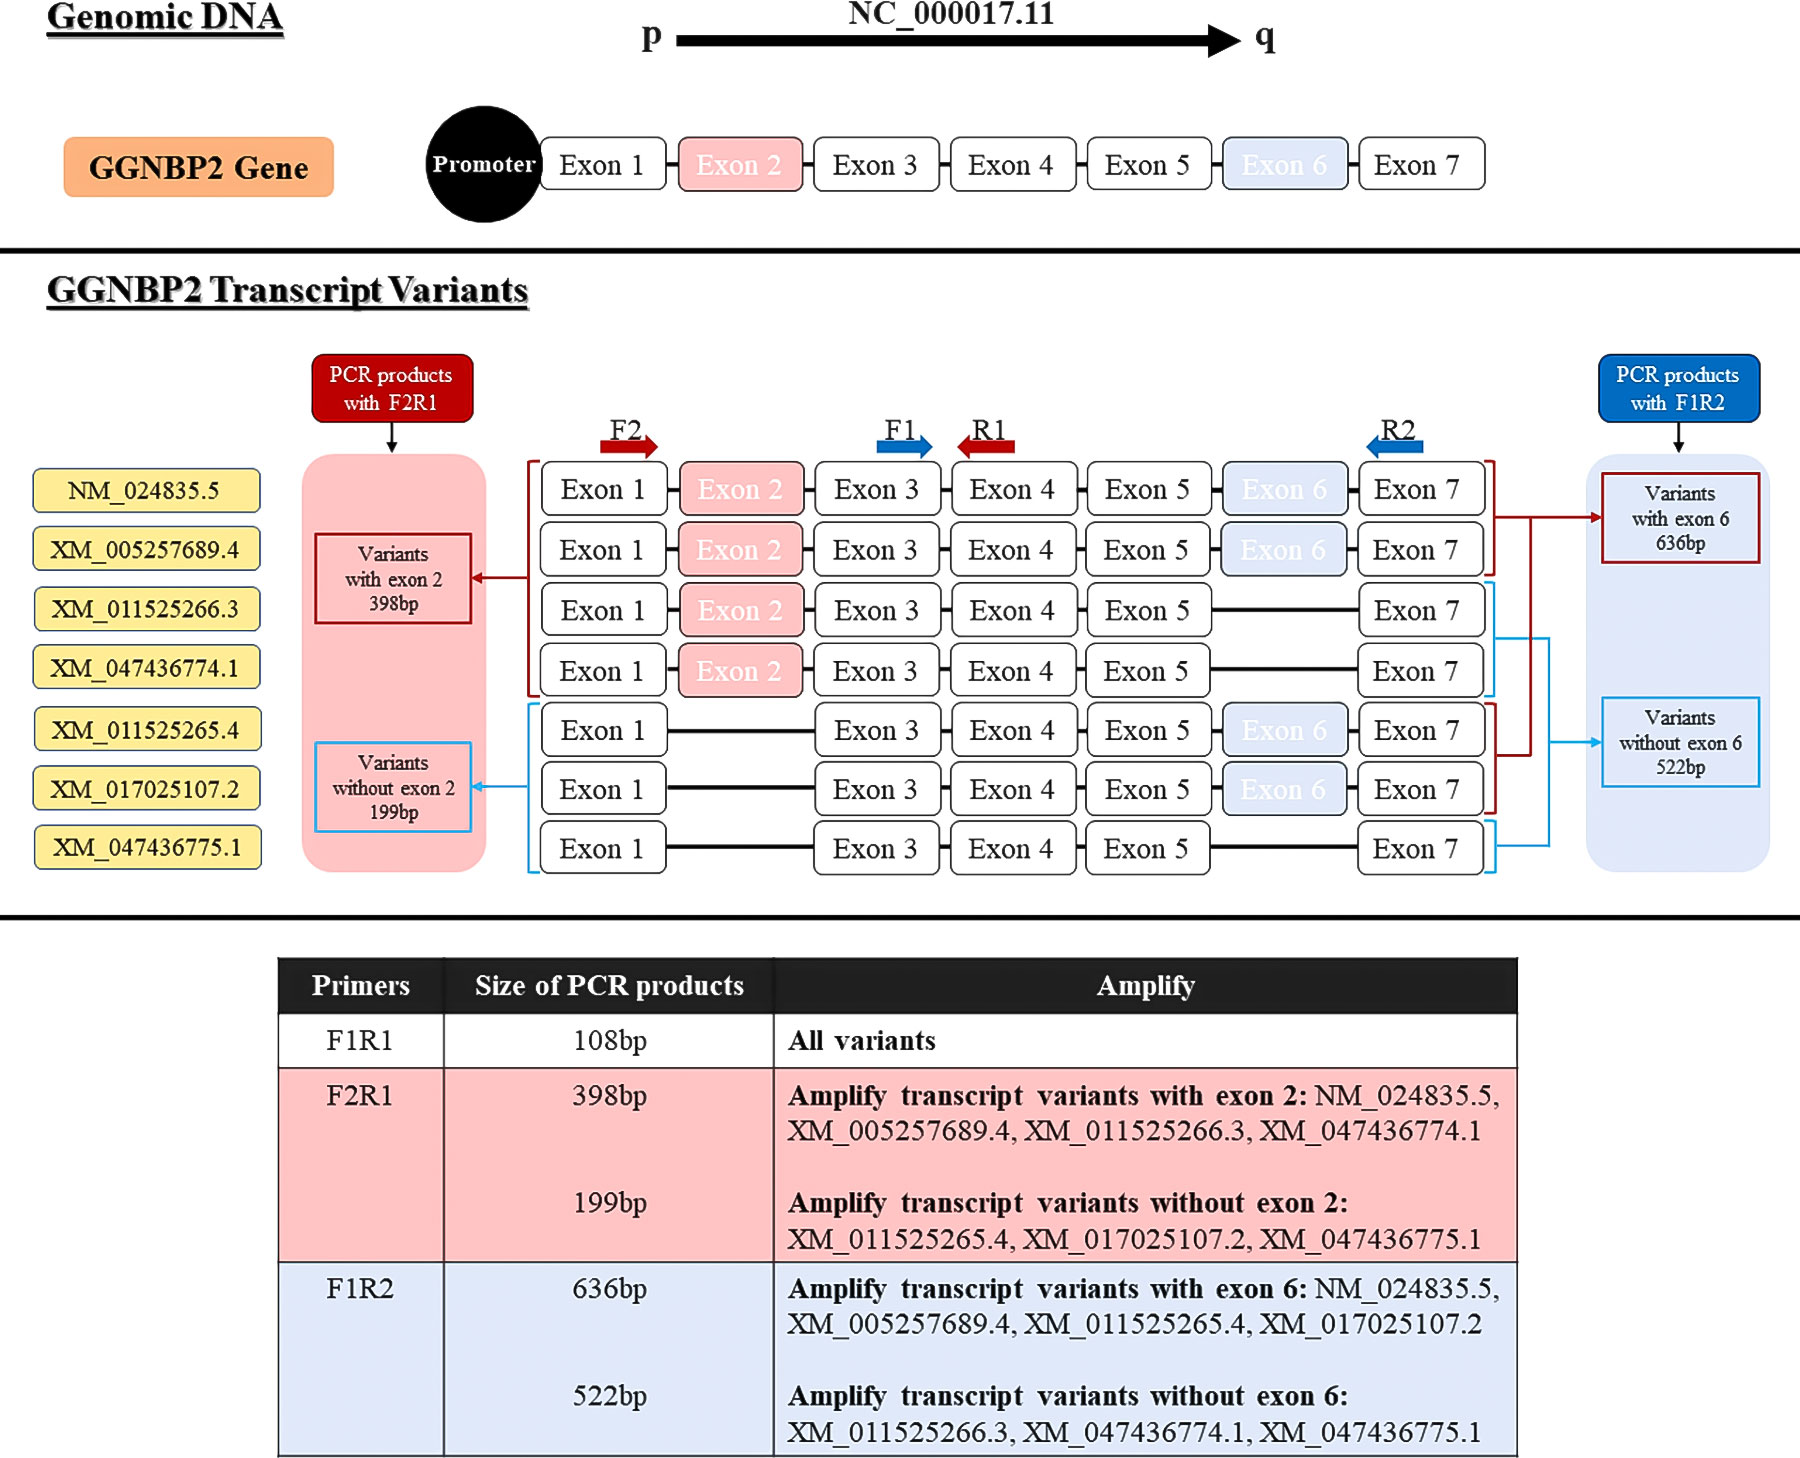
Figure 2 Locations of primers to amplify GGNBP2 splice variants. Exons number 1-7 show the GGNPB2 gene and 7 different transcript variants of this gene. Primer pair F2R1 were designed to detect spliced variants based on exon 2 splicing (shown in pink) and primer pair F1R2 were designed to detect spliced variants based on exon 4 splicing (shown in blue).
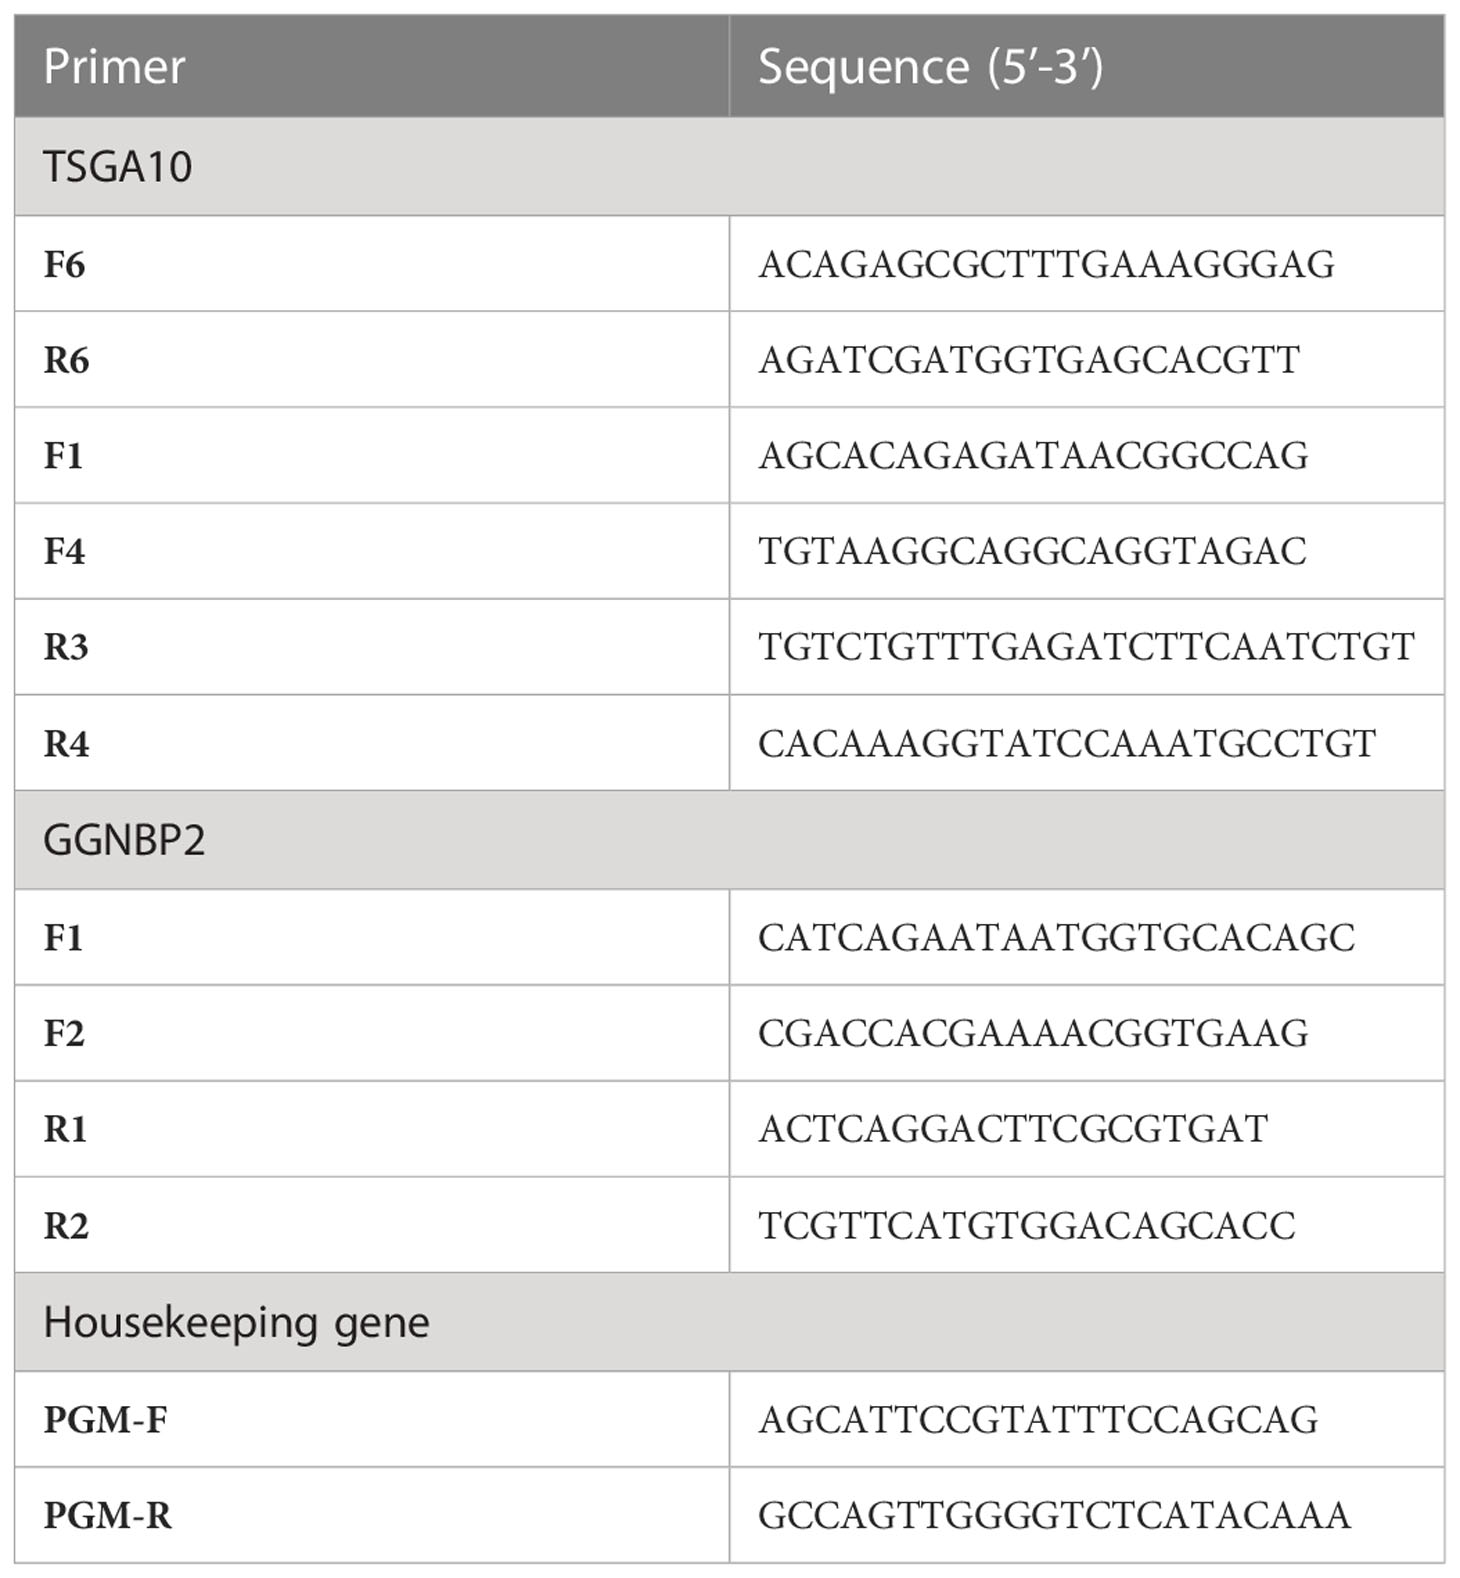
Table 2 DNA oligonucleotides used in this study (F: Forward primer and R: Reverse primer).
Total RNA extraction
Trizol (Invitrogen) was used to extract total RNA from 50mg tissue samples according to the manufacturer’s instructions. The quantity (on average 700 ng in a total volume of 30ml) and purity (average A260/A280 ratio 1.7) of each RNA sample were measured by NanoDropND-2000 Spectrophotometer (Thermo Fisher Scientific, Wilmington, DE), and their integrity was confirmed by electrophoresis on 1% agarose gel (UltraPure TM Agarose; Merk) in 2.2M formaldehyde. The high-quality RNA samples with no degradation (in which a smear was observed with two bands, S18 and S28, corresponding to ribosomal RNA, indicating the appropriate quality of RNA for cDNA production) were stored at -80°C for a maximum of one month before further analyses.
Two-step RT-PCR
The first strand of cDNA was synthesized using a cDNA synthesis kit (Thermo Fisher Scientific). Then 2000ng of total RNA from the testis and BT samples were reversely transcribed using random hexamer and oligo-dT primers. The PCR assay with a specific primer for PGM1 was carried out to verify the existence of cDNA (120bp band). The cDNAs were used for the PCR assays with primer pairs F1R3, F1R4, F4R3, and F4R4 to identify the expression of each TSGA10 transcript variant in the testis and BT samples specifically. The other PCR assays with primer pairs F1R1, F1R2, and F2R1 were used to identify the expressed transcript variants of GGNBP2 and exon splicing in the testis and BTs. The PCR assays were performed under initial heating for 5 minutes at 94°C. In the next phase, 30 thirty-second cycles of amplification were performed at 94, 56, and 72°C, followed by a final extension of 5 minutes at 72°C, after which the PCR products were separated on 2% agarose gel and visualized under UV light after DNA staining. The ImageJ program was employed to quantify the bands in a range of 0-4.
Statistical analysis
The PGM1 mRNA levels were applied to normalize the mRNA levels of different TSGA10 and GGNBP1 transcript variants, with relative mRNA levels as the ratios between TSGA10 and GGNBP2 transcript variants and PGM. Statistical analyses were conducted using IBM SPSS software. The expression of different TSGA10 and GGNBP2 transcript variants in the BT tissues was compared using the Wilcoxon test. The correlation between the expression of TSGA10 and GGNBP2 transcript variants with the clinic pathological variables was examined through the nonparametric Mann-Whitney U test. A two-tailed p-value <0.05 was set as the significance level.
Results
Data profile of brain tumor GEO datasets
The microarray data in the GSE15824 (Figure S1) were divided into four groups (namely GBM, Astrocytoma, Oligodandrocytoma, and control). Those in GSE35493 (Figure S2) were divided into two groups (namely BTs and control), and those in GSE50161 (Figure S3) were separated into five groups (namely GBM, Astrocytoma, ependymoma, medulloblastoma, and control). Each of these datasets was analyzed separately with R software. Accordingly, each sample of the BT groups was compared with the control sample of each dataset individually.
Differential expression analysis of TSGA10 and GGNBP2
For data precision and consistency, having used the UMAP package in R software to reduce the dimension of the data, we then adjusted the p-value to modify the data Adjusted p-value under 0.05 was set as the significance level. In the GSE15824 dataset, the TSGA10 expression was reduced in the GBM tumor with a log2 fold change of -2.59 and increased in the oligodendrocytoma tumor with a log2 fold change of 2.521. In the GSE50161, the TSGA10 expression was also reduced in the ependymoma tumor with a log2 fold change of -2.67. The expression of GGNBP2 was significantly upregulated only in the GSE35493 dataset and in GMB tumor samples with a log2 fold change of 0.88 (Table 3). Tables S1, S2 present changed expression of the TSGA10 and GGNBP2 genes with the exact p-value and log FC. Figure 3 illustrates the heat map of the differential expression of the genes. The results showed that in GBM tumor samples, being regarded as the hardest tumor among brain tumors, the expression of many genes was downregulated.
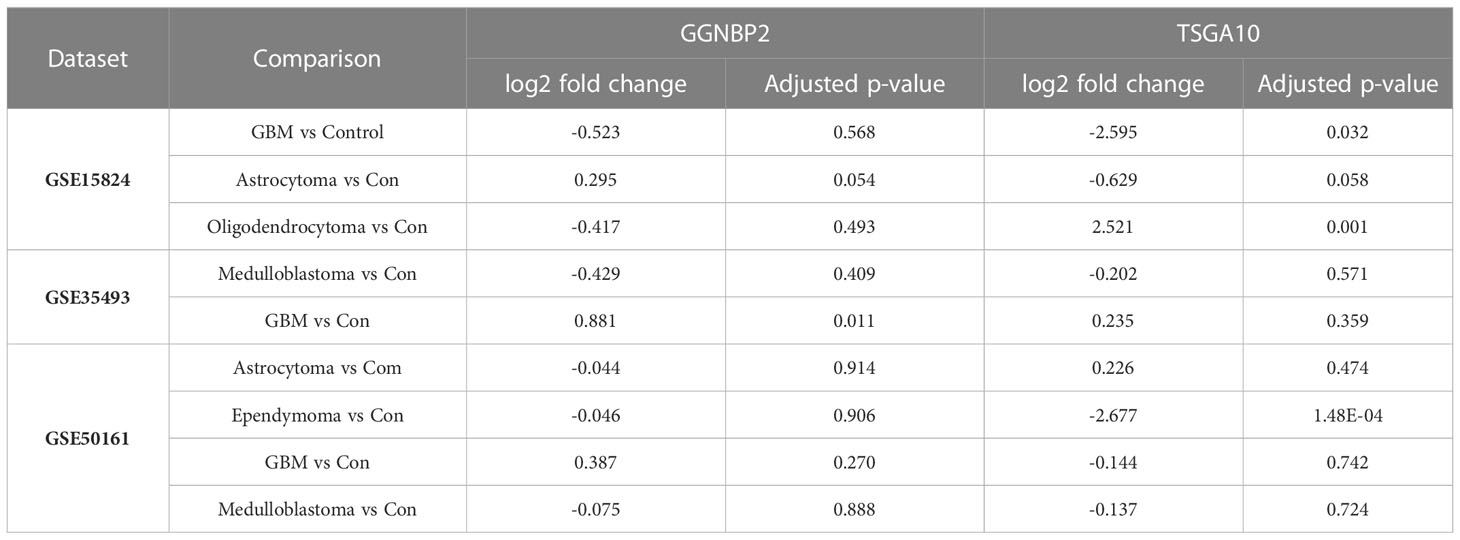
Table 3 Results of DEG analysis for comparison between brain tumors and control samples.
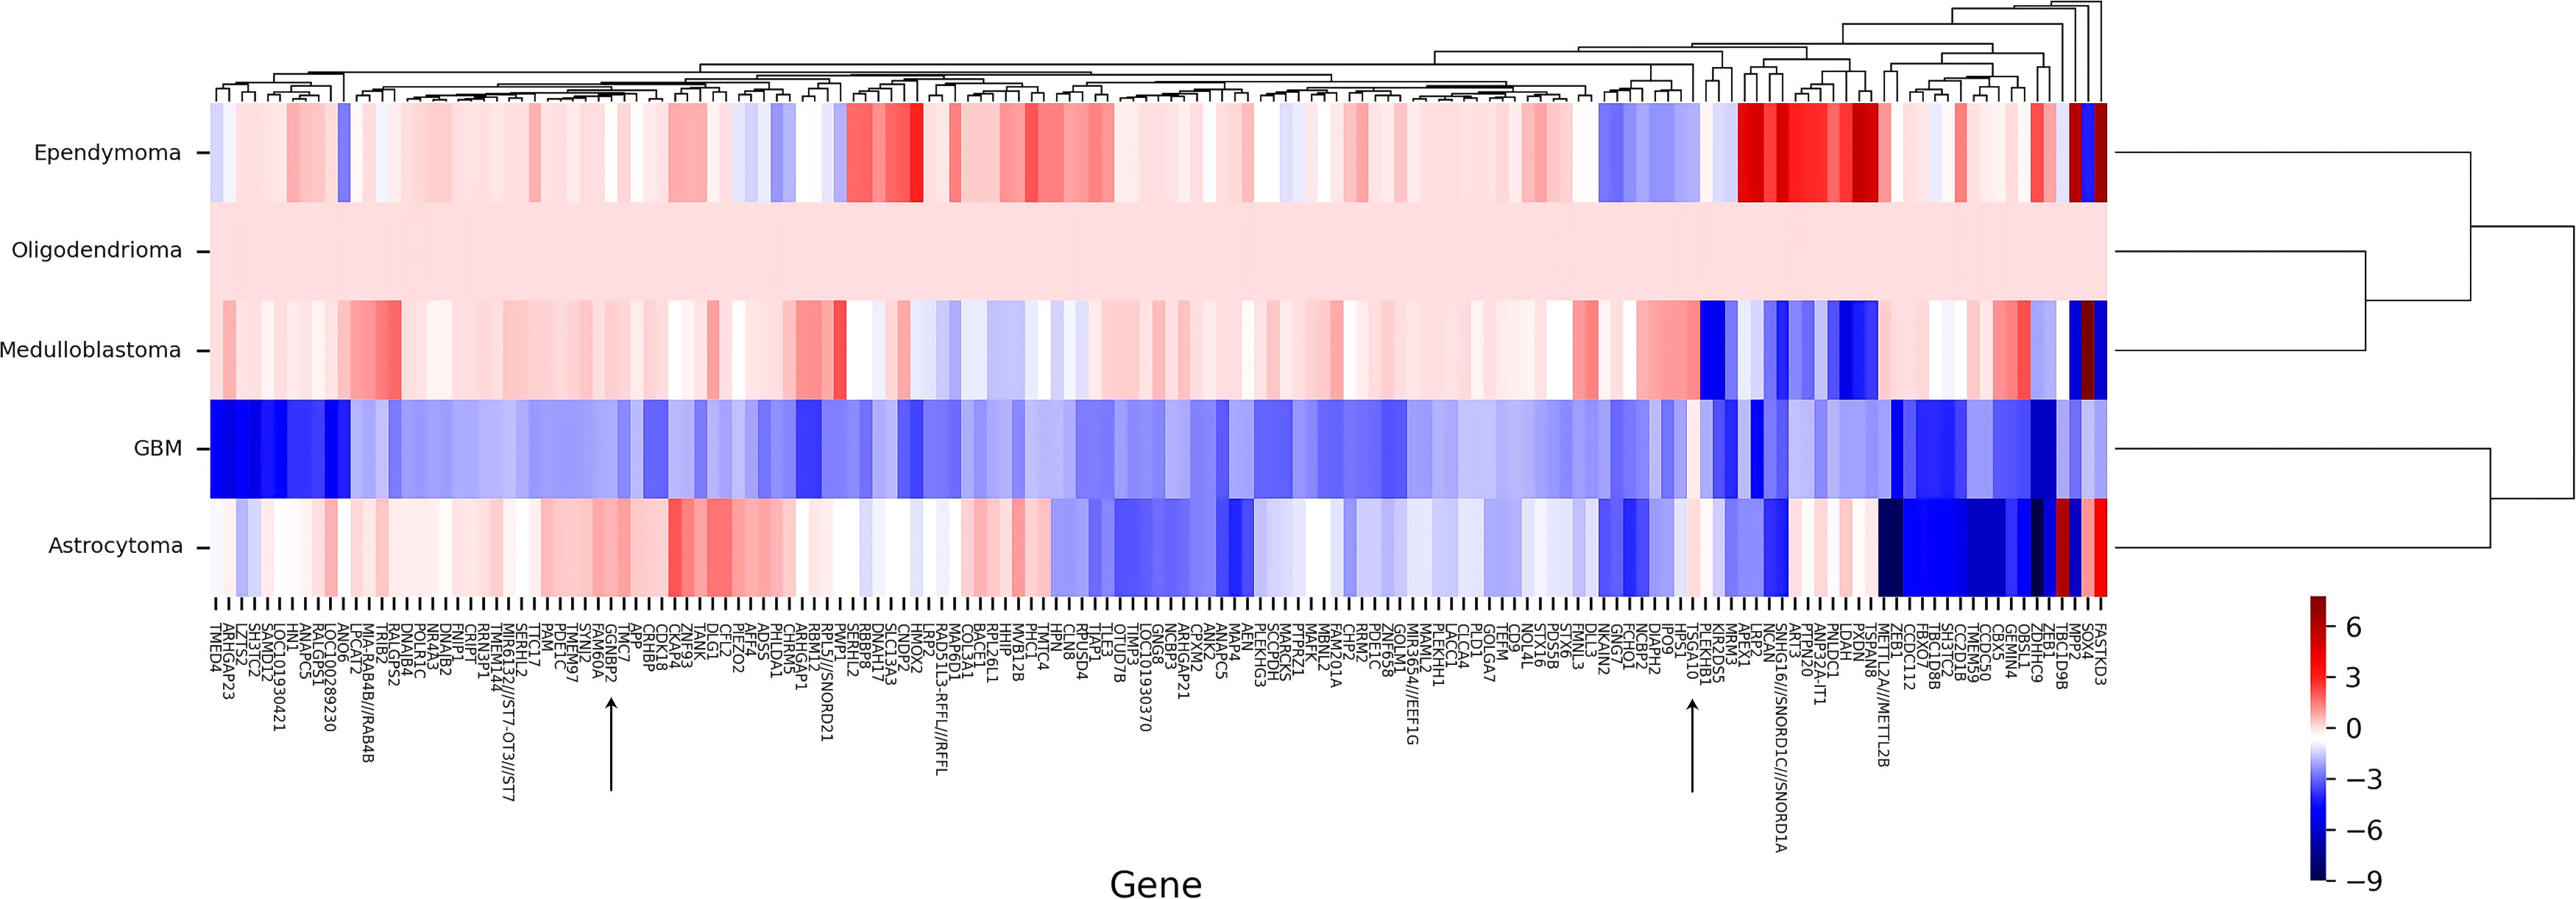
Figure 3 Clustering heat map of DEGs by normal tissues (N) and cancer tissues (C) in BTs. A representative heat map of gene expression was obtained from microarray analyses. Heat map of DEGs in a GMB, astrocytoma, medulloblastoma, oligodendrioma, and ependimoma is shown to express targeting genes TSGA10 and GGNBP2. In general, these two genes show upregulation in all BTs, except for GGNBP2 in GBM and TSGA10 in ependymoma, representing downregulation. Each column represents one type of BT, and each lane represents one gene. Gene expression levels are represented by a color scale ranging from red to blue, according to the log2fold change of genes. Accordingly, the redder the log2 fold change, the more upregulation it has, and the higher the level of expression obtained, meaning it goes towards blue, and the more its expression decreases. Heat maps of DEGs from two microarray datasets were generated with R software.
Expressed transcript variants of TSGA10 in brain tumor
Primer F6R6 binds to the coding sequence region (135bp), and the expression of this region was observed in all tissue samples of BT patients. The expression of various TSGA10 gene transcript variants was noticed in all BT samples (30 samples) regardless of their grade and stage. Then, specific primers were used for RT-PCR amplification of TSGA10 transcript variants, and the ImageJ program calculated the relative mRNA expression. Both promoters were active, producing TSGA10 mRNAs; however, the BT tissue samples witnessed a decreased expression of the transcript variants containing exon 4. The relative mRNA expressions were divided into two groups: high expression with relative mRNA expression higher than 3 and low expression with relative mRNA expression lower than 3. The percentage of samples with high expression of transcript variants without exon 4, including KY607423 and KY607425, was 96.66% (mean of relative mRNA expression was 3.74) and 86.66% (mean was 3.41), respectively. The percentage of samples with high expression of transcript variants containing exon 4, including KY607424 and KY607426, was 40% (mean of relative mRNA expression was 2.85) and 0.00% (mean was 0.88), respectively (Figure 4). The expression analysis results for the BT samples showed that the relative mRNA expression of transcripts without exon 4 (with a shorter 5′UTR sequence) was higher than transcripts with exon 4 in BT samples (p-value<001). There was no significant difference between Low (Stage I + II) and Advanced (Stage III + IV) regarding the separation of stage expression.
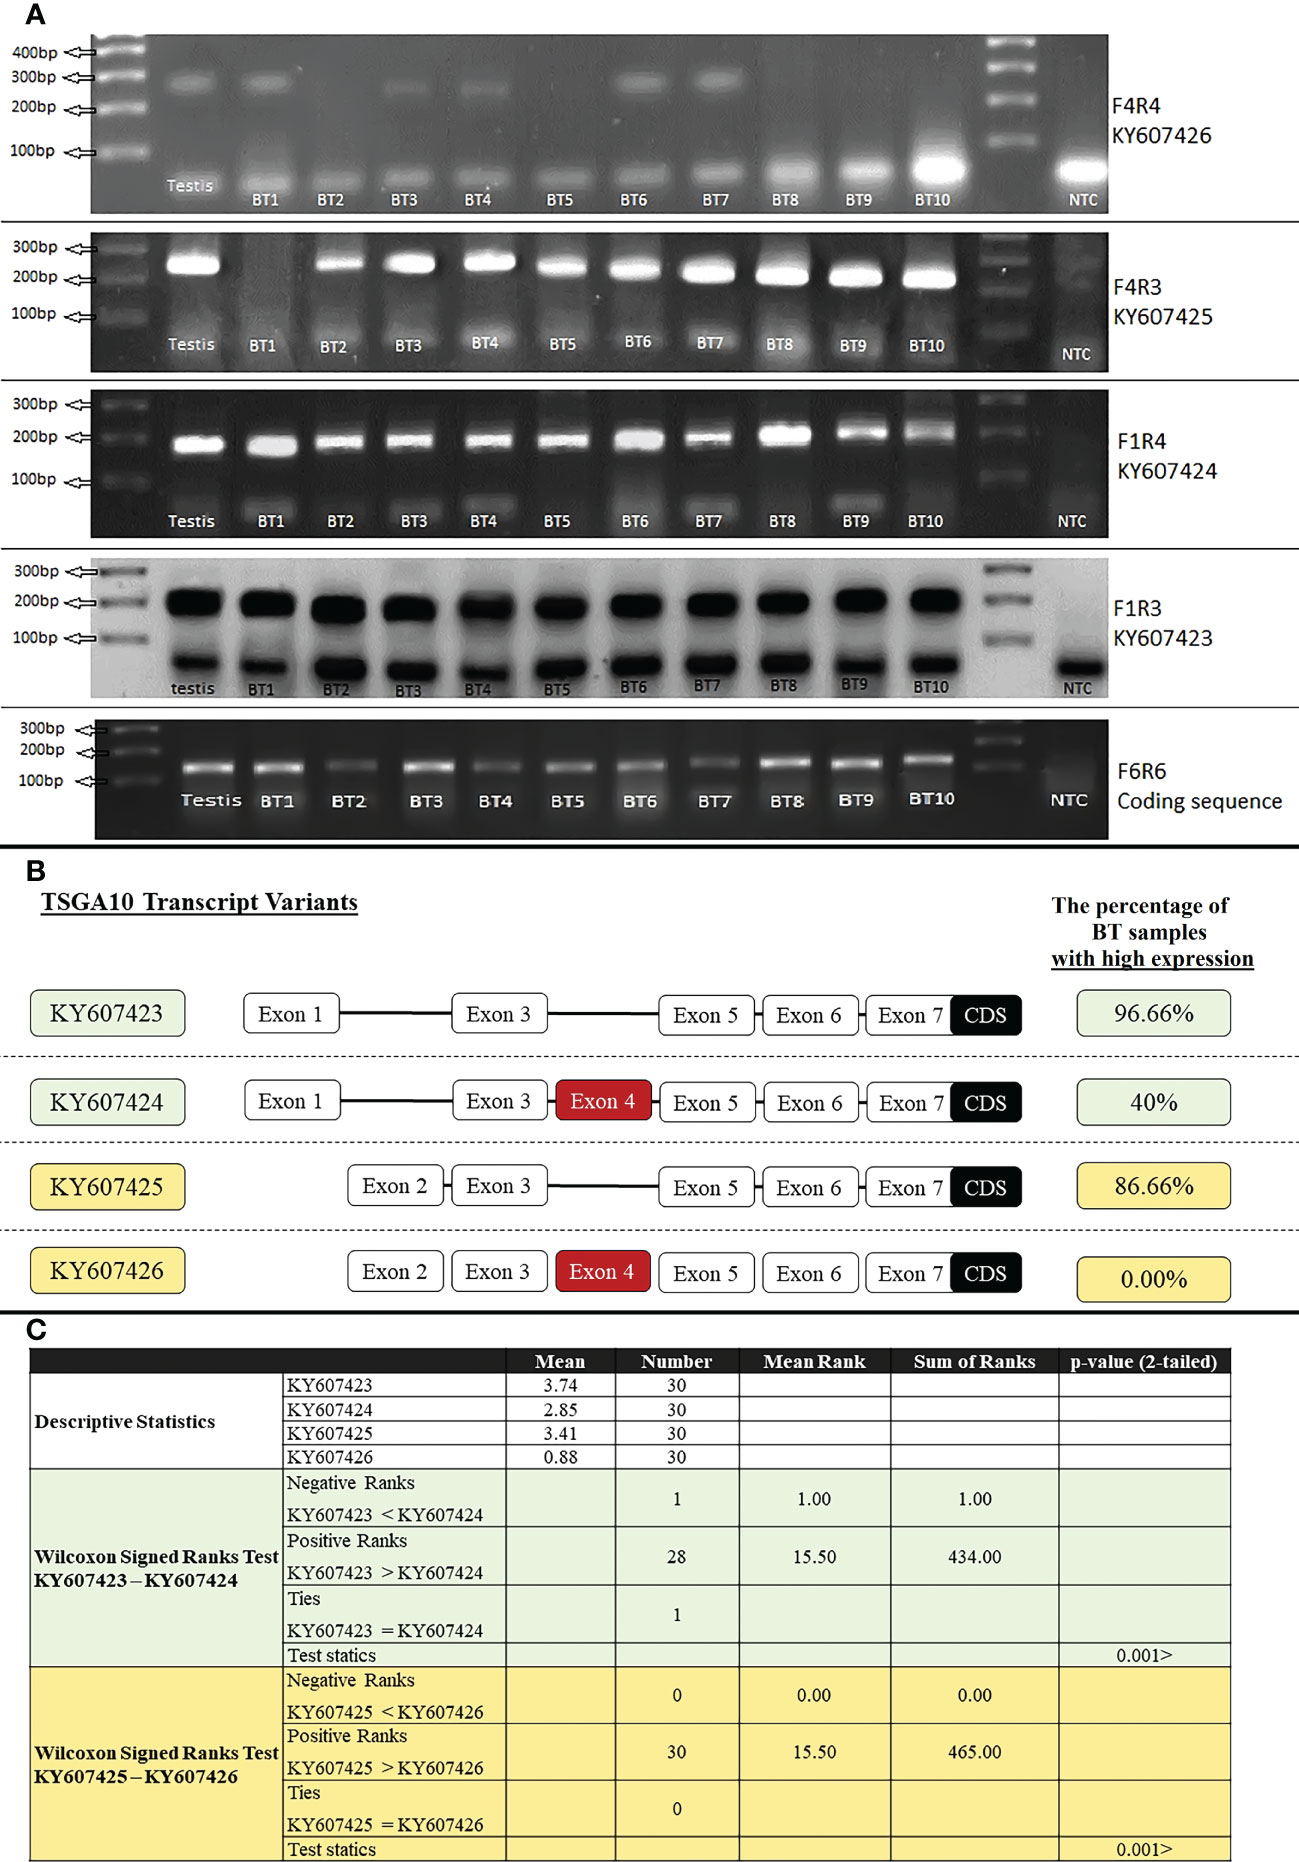
Figure 4 RT-PCR amplification of TSGA10 transcript variants. (A). 1500ng of total RNA from Testis and Brain tumor (BT) samples were reversely transcribed and amplified by specific primers for TSGA10 transcript variants. Primer pairs F4R4, F4R3, F1R4, and F1R3 were used to amplify transcript variants KY607426 (240bp), KY607425 (240bp), KY607424 (180bp), and KY607423 (180bp), respectively. Primer pair F6R6 amplifies all transcript variants of the TSGA10 gene (amplify coding sequence region) and produces a 120bp band. Lane NTC is a negative control. Bands were separated on 2% agarose gel. (B). Relative mRNA expression was calculated based on the ImageJ program and a relative expression higher than 3 was considered a high expression. Percentage of BT samples with high expression were calculated and shown for each spliced variant of the TSGA10 gene. (C). Non-parametric statistical Wilcoxon Signed Ranks Test were used to compare KY607423 vs KY607424 and KY607425 vs KY607426 transcript variants in BT samples. The results were shown that KY607423 and KY607425 transcripts (which do not have exon 4) have higher relative mRNA expression than KY607424 and KY607426 transcripts (which have exon 4), respectively in 30 BT samples (P <.001).
Expressed transcripts of the human GGNBP2 gene
Seven transcript variants of the GGNBP2 gene with different 5′UTR regions and coding sequences were expressed in human testicular tissue samples. The two essential splicing exons were located upstream of this gene, including the splicing of exon 2 in the 5’UTR region and the splicing of exon 6 in the coding region. The expression of GGNBP2 transcript variants was investigated in all BT samples (30 samples) according to the splicing of exons 2 and 6. The difference in expression of transcript variants spliced in exons 2 was investigated using the primer F2R1. The relative mRNA expressions were divided into two groups: high expression with relative mRNA expression higher than 3 and low expression with relative mRNA expression lower than 3. The percentage of samples with a high expression of transcript variants without exon 2 (amplified with primer F2R1, 199bp) and with exon 2 (amplified with primer F2R1, 398bp) was 86.66% (the mean of relative mRNA expression was 3.59) and 30% (mean was 2.14), respectively. Moreover, the difference in expression of transcript variants spliced in exon 6 was investigated using the primer F1R2. The percentage of high expression transcript variants without exon 6 (amplified with primer F1R2, 522bp) and with exon 6 (amplified with primer F1R2, 636bp) were 56.66% (mean of relative mRNA expression was 3.16) and 50% (mean was 2.43), respectively (Figure 5). The results indicated that the relative mRNA expression of transcripts without exon 2 (with a shorter 5′UTR sequence) was higher than transcripts with exon 2 in BT samples (p-value<001). There was no significant difference between Low (Stage I + II) and Advanced (Stage III + IV) brain tumors, considering the expression levels of the transcripts.
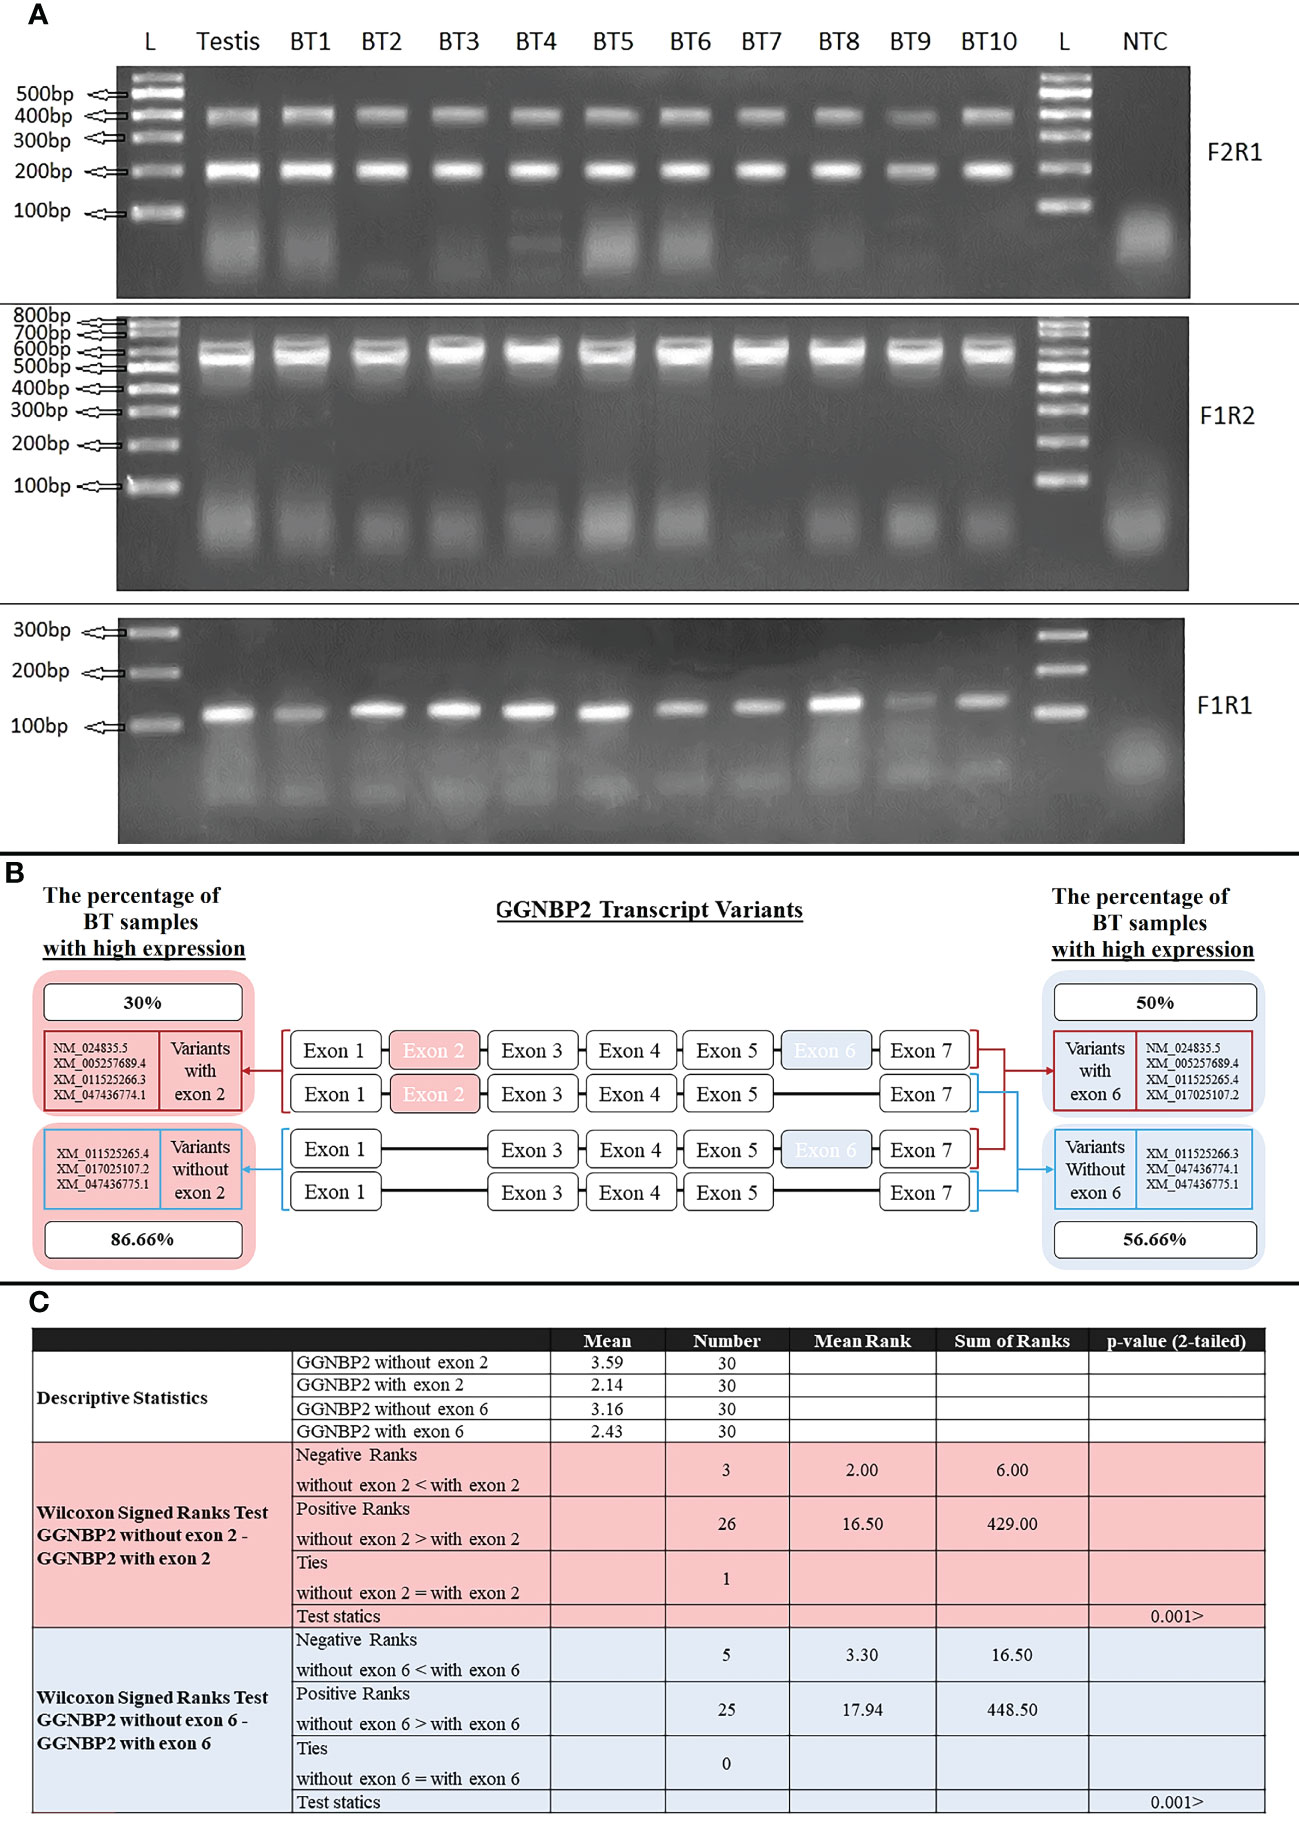
Figure 5 RT-PCR amplification of GGNBP2 mRNAs containing different splicing variants. (A). RT-PCR amplifications from Testis and BT samples were performed using the following combinations of primers: Primer pair F2R1 produced 398bp and 199bp bands indicating the exon 2 splicing of the GGNBP2 gene. Primer pair F1R2 produced 636bp and 522bp bands indicating the exon 6 splicing of the GGNBP2 gene. Primer pair F1R1 amplifies all transcript variants of GGNBP2 and produces a 108bp band. Lane NTC is a negative control. Lane L is a 100bp DNA ladder. Bands were separated on 2% agarose gel. (B). Relative mRNA expression was calculated based on the ImageJ program and a relative expression higher than 3 was considered a high expression. Percentage of BT samples with high expression were calculated and shown for each spliced variant of the GGNBP2 gene. (C). Non-parametric statistical Wilcoxon Signed Ranks Test were used to compare GGNBP2 exon 2 and exon 6 spliced variants. The results showed that spliced variants without exon 2 and exon 6 have higher relative mRNA expression than spliced variants with exon 2 and exon 6, respectively (P <.001).
Discussion
Brain tumors (BTs) are a heterogeneous group of neoplasms with unique biology, treatment, and prognosis (43). The treatment of BTs is challenging due to these cancers’ anatomic position and intrinsic factors, leading to high mortality and morbidity worldwide (44). The current focus of cancer research is to understand the genetic differences between the malignant cell to reach particular and effective therapy strategies (43). Brain and testis have many similarities since both glial cells and melanocytes are derived from the neuroectoderm. These two cell types share many biological and morphological features. The former can be referred to as a blood barrier and the latter is the gene whose expression is limited to these two tissues (45).
Many human neoplastic tissues express cancer-testis (CT) genes. The CT genes are a group of genes with different functions in normal germ cells, some of which are critical in the tumorigenesis process. CT gene expressions are restricted in normal tissues except in testis and a wide range of tumor types (10, 46). The expression of many cancer-testis (CT) genes in undifferentiated and differentiated BTs may provide particular targets for treating cancer recurrence and metastasis (45). Nevertheless, little is known about the function and different transcript expression patterns of the CT genes.
This study aimed to investigate the expression and transcription patterns of two potential cancer-testis genes, that is, TSGA10 and GGNBP2. The expression of these genes was examined in different stages and grades of BTs, and the results revealed that these genes were highly expressed in the lower grades of BTs. The more the grade of the tumor increases, the more its expression decreases, meaning these two genes may act as tumor suppressor genes in these tumors.
We examined the mRNA expression profiles of TSGA10 and GGNBP2 transcript variants in BTs of different malignancy grades. Compared to the other tumor groups, high expressions of TSGA10 and GGNBP2 were observed in astrocytoma’s grade 2. Higher-grade BTs display a sharp decrease in TSGA10 and GGNBP2 transcripts, especially in medulloblastoma grade IV, given that TSGA10 and GGNBP2 expressions decrease in higher grades of BTs (Table 4). These genes may play a critical role in the development of BTs. Apart from that, the splicing of exons in the 5’UTR region and expression of transcripts with shorter 5’UTR sequences could decrease the translation efficiency of these genes and increase angiogenesis and the development of BTs in higher grades, especially in astrocytoma (42). The findings suggest that the TSGA10 and GGNBP2 transcript variants might present a functional role, altering the expression patterns of these genes, thereby increasing tumor growth and stimulating malignancy traits. Accordingly, understanding their expression levels may be informative relative to the influence of the TSGA10 and GGNBP2 genes in astrocytoma and, consequently, in patients’ prognoses.
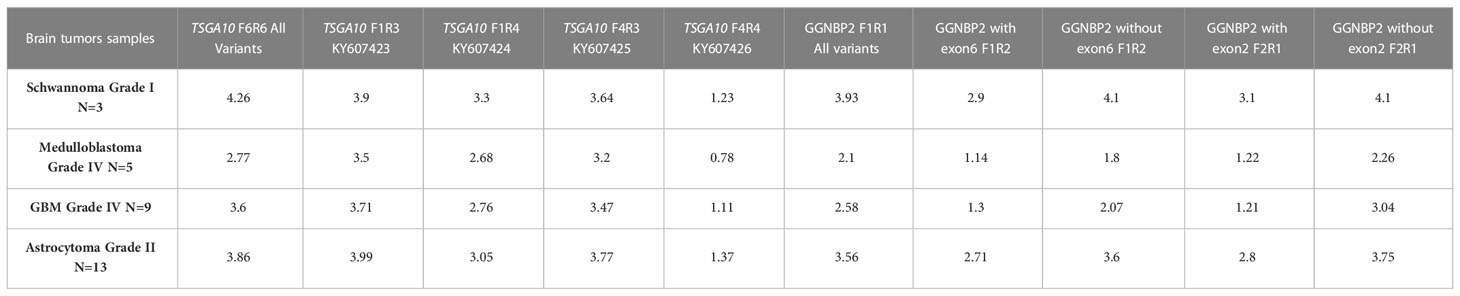
Table 4 TSGA10 and GGNBP2 gene variants expression in 30 brain tumor samples.
GGNBP2 is primarily expressed in spermatogenesis and male germ cells and is necessary for testis morphology and sperm development (47). GGNBP2 gene expression produces a protein binding to testicular germ-specific protein gametogenetin 1 (GGN1) (48). This protein is expressed in late pachytene in spermatocytes, simultaneous with meiosis, and is up-regulated in round spermatids. According to previous studies, GGNBP2 plays a crucial role in pregnancy prosperity by preserving equivalence in the proliferation and differentiation of trophoblast stem cells during placental progression (49). The overexpression of GGNBP2 decreases tumor cell proliferation, migration, invasion, angiogenesis, and metastasis of human cancers and arrest in the G1 phase of the cell cycle (22, 50). It down-regulates the protein levels of p-PI3K, p-Akt, Wnt, and b-catenin. This effect is significant since the activation of Wnt/b-catenin and PI3K/Akt signaling pathways results in the malignant development of various tumors, such as glioma (22). Accordingly, GGNBP2 acted as a tumor suppressor in patients with glioma and was suggested as a potential therapeutic method (50, 51).
TSGA10 is primarily detected in the testis and plays key roles in various biological processes such as spermatogenesis, embryogenesis, angiogenesis, and malignancy (52–54). It was also revealed that TSGA10 is overexpressed in BTs (13). The over-expression of TSGA10 was associated with tumor suppression and cancerous cell apoptosis (55). Moreover, the TSGA10 gene could express different transcript variants with the same coding region but different 5′UTR sequences in breast cancer (42). The pathway of the TSGA10 gene was Depicted by using the string database. Then, we identified and selected the genes involved in the brain through clustering (Figure 6). Using the GEPIA database, we measured the correlation between the expression of each gene and TSGA10 and observed that the GGNBP2 gene has a high correlation with TSGA10. In addition, in the GEPIA database, TSGA10 and GGNBP2 revealed a correlation expression of 81% in all brain tumor and normal brain and testis samples (Figure 7). In this study, these two genes revealed a correlation of 78.1% in 30 samples of BTs (Table 5).
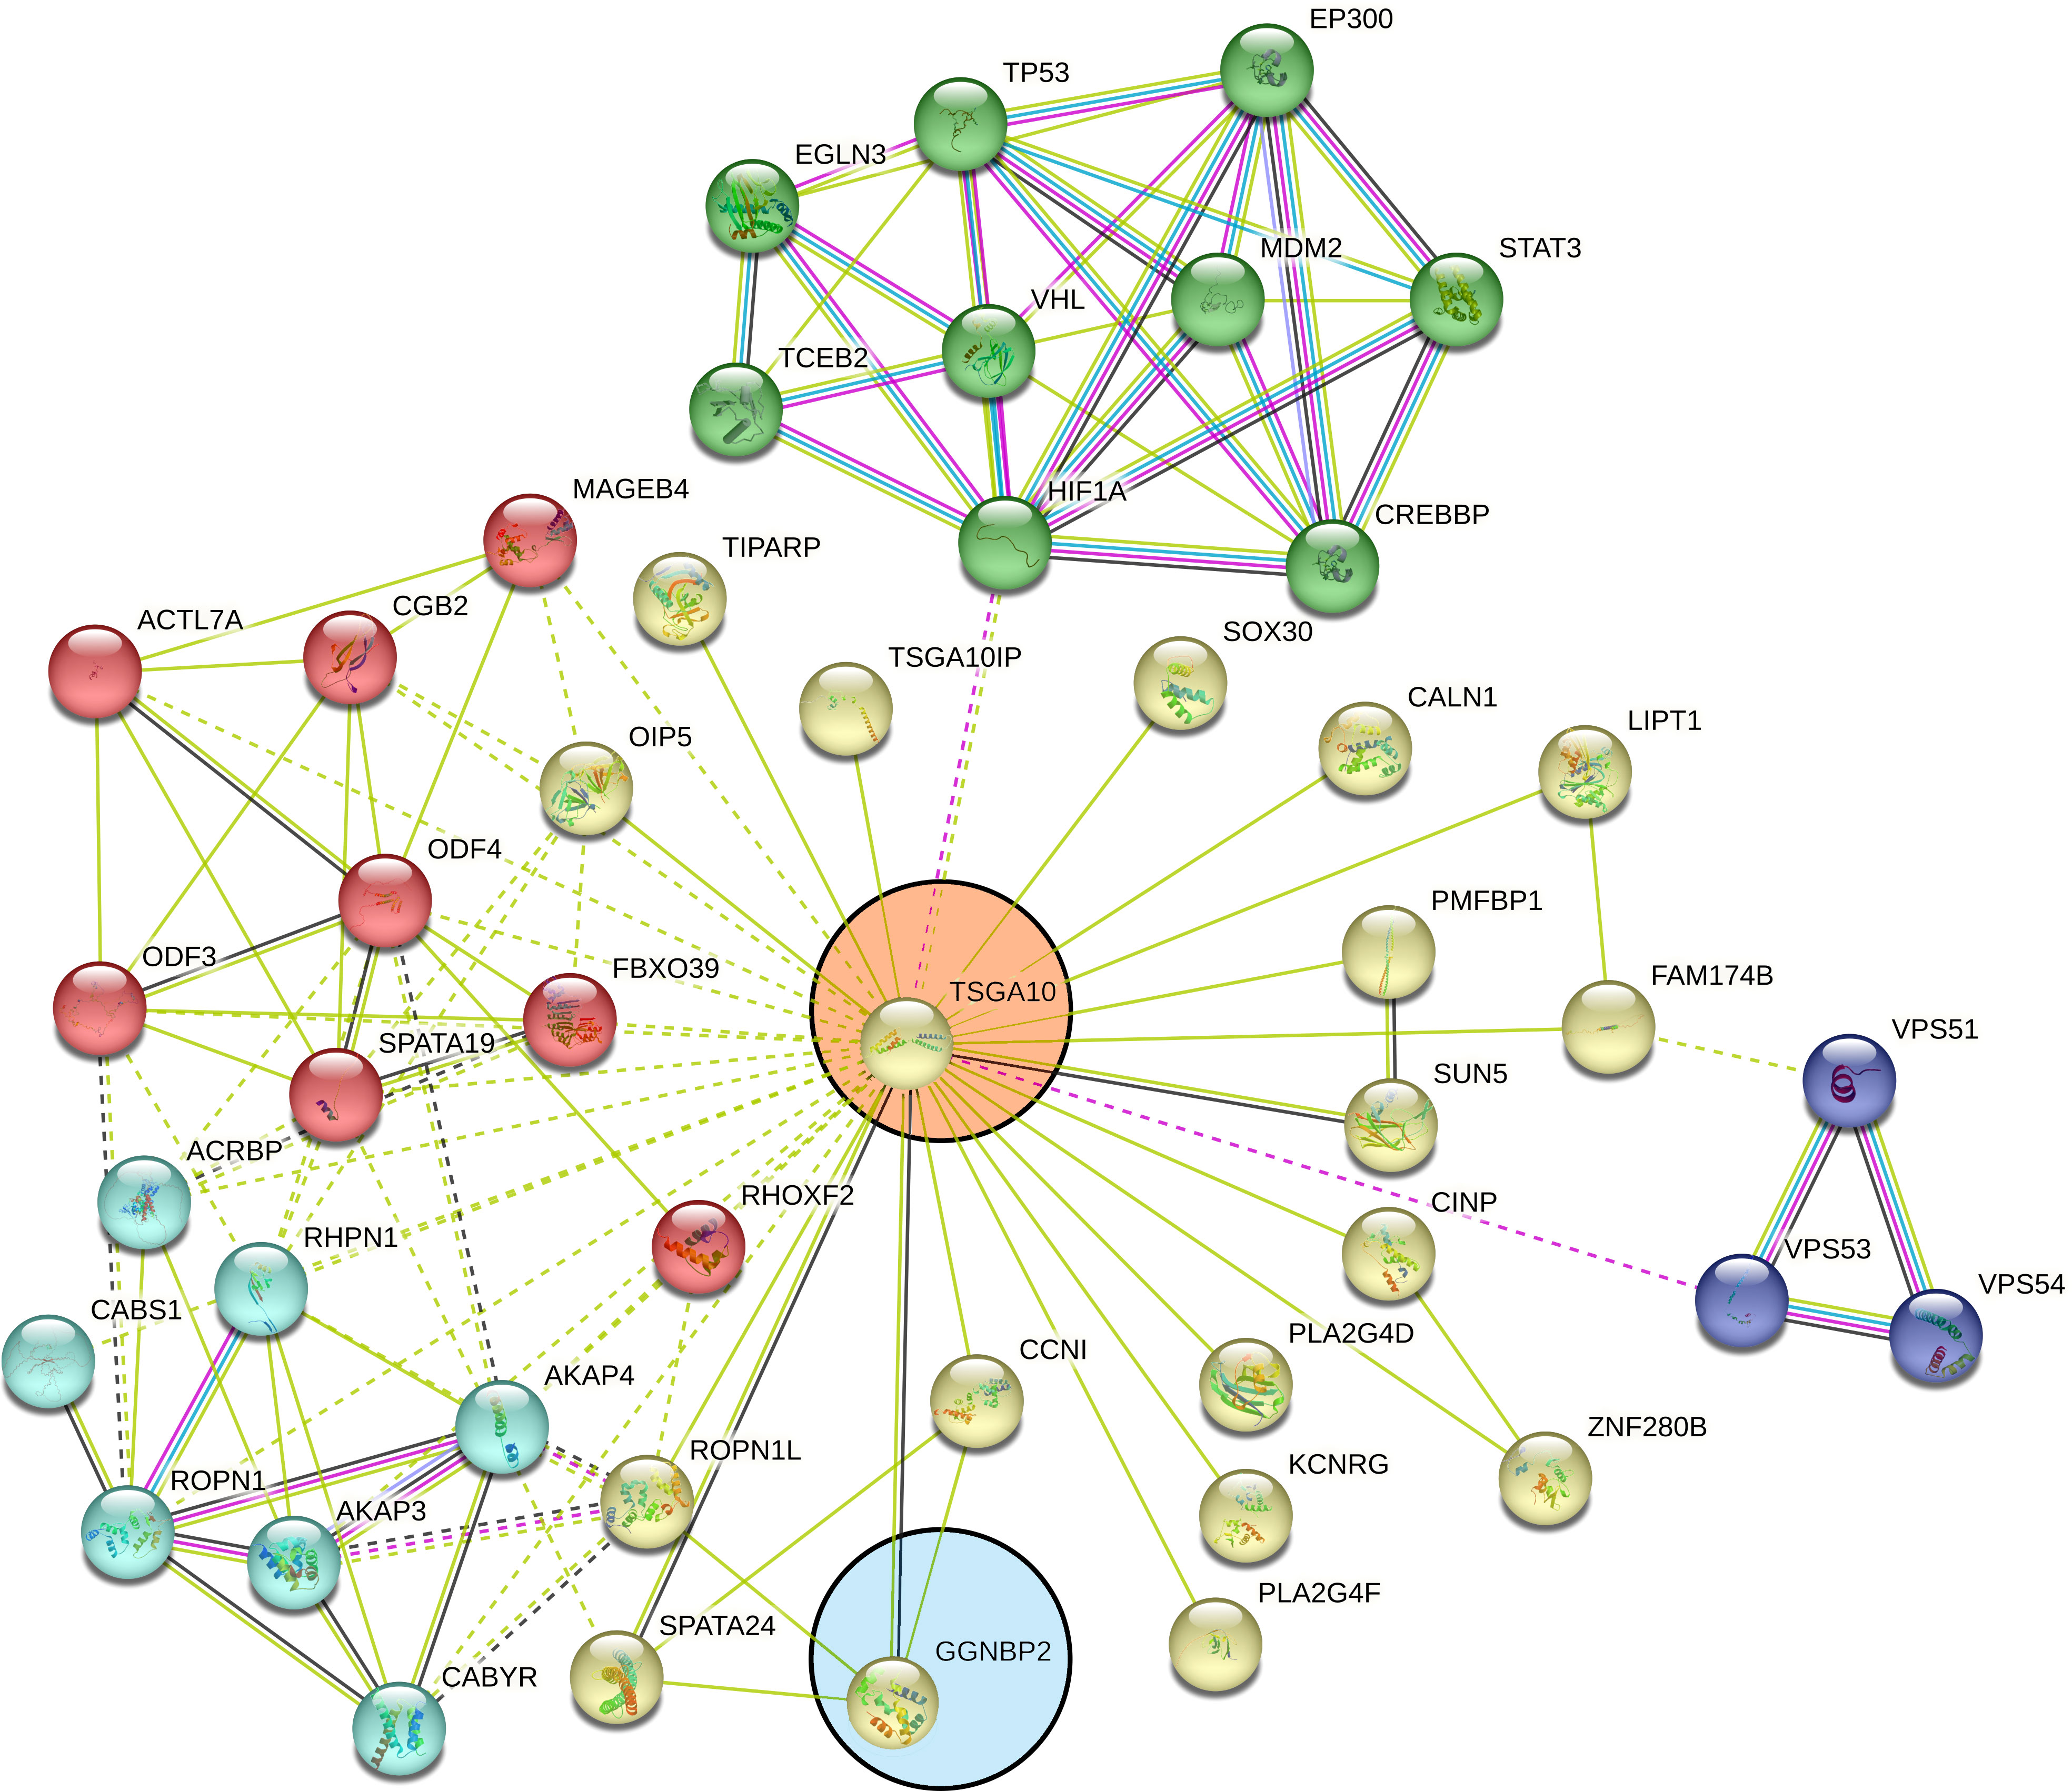
Figure 6 Clustered pathways of the TSGA10 gene by string database. The network of protein–protein interactions (PPI) was constructed for the TSGA10 gene, using the STRING online database. The genes were clustered based on the KEGG and the Reactome pathway databases. We selected the network modules related to the brain from the set of all TSGA10 networks. The genes were clustered based on the KEGG and the Reactome pathway databases. Networks were shown related to TSGA10 (in the pink circle) and GGNBP2 (in the blue circle) genes. Each line represents a STRING interaction score of greater than or equal to.
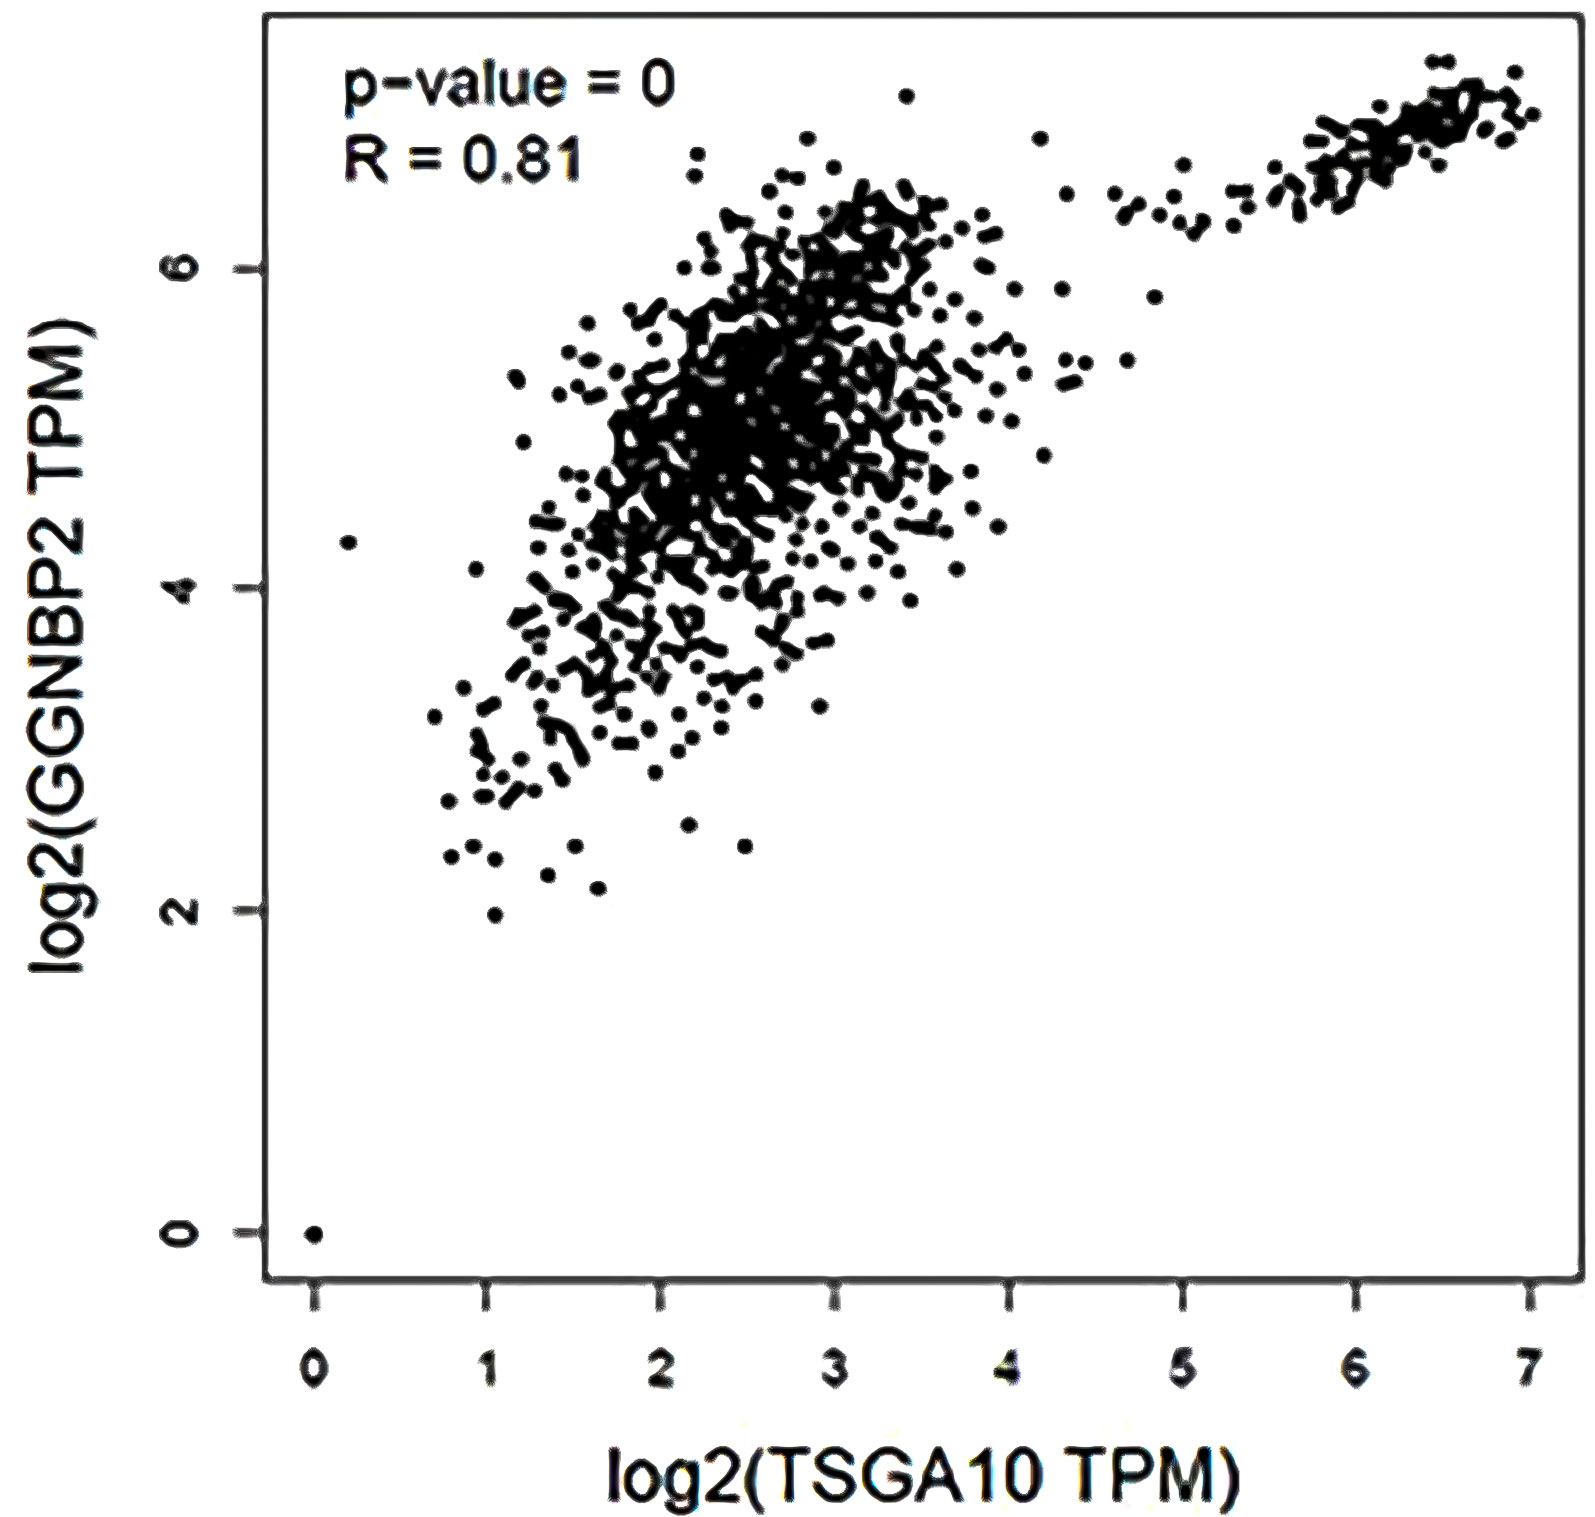
Figure 7 The expression correlation between GGNBP2 and TSGA10 genes that were shown by the GEPIA database. Co-expression results of genes predicted by the GEPIA database online analysis showed that there is a statistically significant spearman correlation between TSGA10 and GGNBP2 mRNA expression in BT and normal brain and testis based on TCGA (the cancer genome atlas) and GTEx (The Genotype-Tissue Expression) samples (Log-rank test; P=0 and R=0.81).
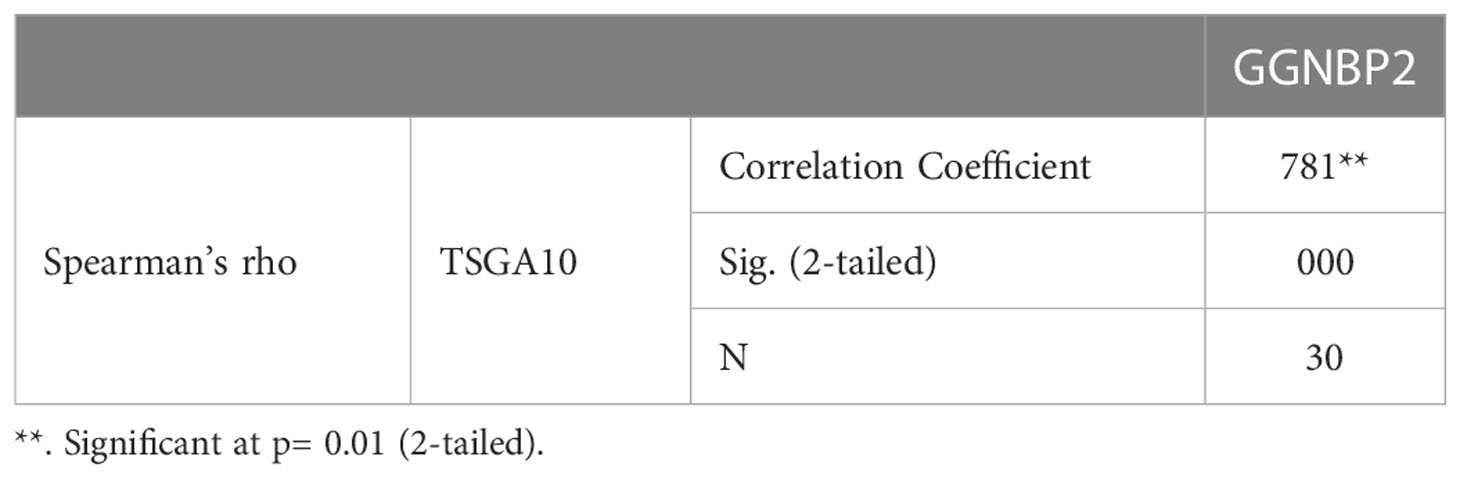
Table 5 Correlations between the TSGA10 and GGNBP2 genes.
Although the analysis of the microarray data for various BTs revealed significant changes in the expression of GGNBP2 and TSGA10 in BTs, these genes do not show drastic changes in all types of BTs. Accordingly, this might be associated with the alternative splicing of these genes in different tissues. This study showed that the human TSGA10 gene consists of at least 22 exons, and the human GGNBP2 gene consists of at least 14 exons, of which the first seven exons of TSGA10 and the first two exons of GGNBP2 form the 5′UTR region. The TSGA10 gene can produce four transcript variants derived from two distinct promoter regions and differential splicing of exon 4. The GGNBP2 gene can produce seven transcript variants due to exon splicing; two of the splicing exons are exon 2 splicing in the 5′UTR region and exon 6 splicing in the coding region. Regarding the transcript expression patterns, the relative mRNA expression of TSGA10 and GGNBP2 genes in the BT samples differed from normal testicular tissue; accordingly, the transcripts have a shorter 5′UTR sequence in tumor samples. In this study, for the first time, the expression mRNA levels of TSGA10 and GGNBP2 genes were investigated based on the splicing of their exons in BT samples. It was shown that the transcripts with longer 5’UTR have lower expression in BT samples, which can affect the translation ability of these genes (Figures 4, 5).
Although our study showed the expression of different transcript variants of TSGA10 and GGNBP2 genes in brain tumor samples, several limitations could affect this study. One of the limitations of this study was the small number of examined samples in different types of brain tumors as well as in different types of stages and grades. In addition, the gold standard for determining the role of the 5′UTR region on the efficiency of protein synthesis is the Luciferase assay method, which was not performed in this study due to existing limitations.
Conclusion
The present study undertook a microarray analysis and found that differential expression of TSGA10 and GGNBP2 were deregulated in brain tumor samples. We used RT-PCR to identify the expression pattern of TSGA10 and GGNBP2 transcript variants and the characteristics of their expression profiles in different brain tumor samples. We identified that the TSGA10 and GGNBP2 were expressed in all of the brain tumor and testicular tissue samples, but the expression of the transcript variants with longer 5′UTR was reduced in brain tumor samples, unlike the testis sample. The expression analysis results of the TSGA10 transcript variants in brain tumor samples were shown to have a higher expression of transcripts without exon 4 than transcripts with exon 4. The relative mRNA expression of the GGNBP2 transcript variants also showed that the expression of transcripts without exon 2 was higher than transcripts with exon 2. Downregulation of the transcript variants with longer 5′UTR could reduce the translation efficiency of these genes and this may lead to angiogenesis and progression of the brain tumor in patients.
Data availability statement
The datasets presented in this study can be found in online repositories. The names of the repository/repositories and accession number(s) can be found in the article/Supplementary Material.
Ethics statement
The studies involving human participants were reviewed and approved by Shahid Beheshti University of Medical Science Functional Neurosurgery research center [IR.SBMU.RETECH.REC.1399.1144]. Written informed consent to participate in this study was provided by the participants’ legal guardian/next of kin.
Author contributions
RK, MHM, and PS designed the study. MSM and RK collected the samples and reviewed cases. RK and PS performed the experiments. RK and EA analyzed the data statistically. RK, EA, MSM, and MHM interpreted the results. RK and EA wrote the manuscript. MSM and MHM revised the manuscript. All authors have read and approved the final manuscript.
Funding
This study was supported by Shahid Beheshti University of Medical Science Functional Neurosurgery research center [24306].
Acknowledgments
The authors express great appreciation to the Islamic Azad univerity of Tehran Science and Research Branch, the Medical Genetics Department at Tehran University of Medical Sciences, the Shahid Beheshti University of Medical Science and Shohadaye Tajrish Hospital for providing assistance and brain tumor samples. They are also grateful to Kimia Shankaie, Mojtaba Saffari, and Sina Majidian for their help and support.
Conflict of interest
The authors declare that the research was conducted in the absence of any commercial or financial relationships that could be construed as a potential conflict of interest.
Publisher’s note
All claims expressed in this article are solely those of the authors and do not necessarily represent those of their affiliated organizations, or those of the publisher, the editors and the reviewers. Any product that may be evaluated in this article, or claim that may be made by its manufacturer, is not guaranteed or endorsed by the publisher.
Supplementary material
The Supplementary Material for this article can be found online at: https://www.frontiersin.org/articles/10.3389/fonc.2023.1075638/full#supplementary-material
References
1. Pollack IF, Agnihotri S, Broniscer A. Childhood brain tumors: Current management, biological insights, and future directions. J Neurosurg Pediatr (2019) 23(3):261–73. doi: 10.3171/2018.10.PEDS18377
2. Ostrom QT, Cioffi G, Gittleman H, Patil N, Waite K, Kruchko C, et al. CBTRUS statistical report: Primary brain and other central nervous system tumors diagnosed in the united states in 2012-2016. Neuro Oncol (2019) 21(Suppl 5):v1–v100. doi: 10.1093/neuonc/noz150
3. Ostrom QT, Gittleman H, Liao P, Vecchione-Koval T, Wolinsky Y, Kruchko C, et al. CBTRUS statistical report: Primary brain and other central nervous system tumors diagnosed in the united states in 2010-2014. Neuro Oncol (2017) 19(suppl_5):v1–v88. doi: 10.1093/neuonc/nox158
4. Klonou A, Piperi C, Gargalionis AN, Papavassiliou AG. Molecular basis of pediatric brain tumors. Neuromolecular Med (2017) 19(2-3):256–70. doi: 10.1007/s12017-017-8455-9
5. Guerreiro Stucklin AS, Ramaswamy V, Daniels C, Taylor MD. Review of molecular classification and treatment implications of pediatric brain tumors. Curr Opin Pediatr (2018) 30(1):3–9. doi: 10.1097/MOP.0000000000000562
6. Verhaak RG, Hoadley KA, Purdom E, Wang V, Qi Y, Wilkerson MD, et al. Integrated genomic analysis identifies clinically relevant subtypes of glioblastoma characterized by abnormalities in PDGFRA, IDH1, EGFR, and NF1. Cancer Cell (2010) 17(1):98–110. doi: 10.1016/j.ccr.2009.12.020
7. Gardeck AM, Sheehan J, Low WC. Immune and viral therapies for malignant primary brain tumors. Expert Opin Biol Ther (2017) 17(4):457–74. doi: 10.1080/14712598.2017.1296132
8. Kontomanolis EN, Koutras A, Syllaios A, Schizas D, Mastoraki A, Garmpis N, et al. Role of oncogenes and tumor-suppressor genes in carcinogenesis: A review. Anticancer Res (2020) 40(11):6009. doi: 10.21873/anticanres.14622
9. Bode PK, Thielken A, Brandt S, Barghorn A, Lohe B, Knuth A, et al. Cancer testis antigen expression in testicular germ cell tumorigenesis. Mod Pathol (2014) 27(6):899–905. doi: 10.1038/modpathol.2013.183
10. Simpson AJ, Caballero OL, Jungbluth A, Chen YT, Old LJ. Cancer/testis antigens, gametogenesis and cancer. Nat Rev Cancer (2005) 5(8):615–25. doi: 10.1038/nrc1669
11. Chen YT, Chiu R, Lee P, Beneck D, Jin B, Old LJ. Chromosome X-encoded cancer/testis antigens show distinctive expression patterns in developing gonads and in testicular seminoma. Hum Reprod (2011) 26(12):3232–43. doi: 10.1093/humrep/der330
12. Li Y, Chu J, Li J, Feng W, Yang F, Wang Y, et al. Cancer/testis antigen-Plac1 promotes invasion and metastasis of breast cancer through Furin/NICD/PTEN signaling pathway. Mol Oncol (2018) 12(8):1233–48. doi: 10.1002/1878-0261.12311
13. Behnam B, Chahlavi A, Pattisapu J, Wolfe J. TSGA10 is specifically expressed in astrocyte and over-expressed in brain tumors. Avicenna J Med Biotechnol (2009) 1(3):161.
14. Hossein Modarressi M, Cameron J, Taylor KE, Wolfe J. Identification and characterisation of a novel gene, TSGA10 , expressed in testis. Gene (2001) 262(1-2):249–55. doi: 10.1016/S0378-1119(00)00519-9
15. Modarressi MH, Behnam B, Cheng M, Taylor KE, Wolfe J, van der Hoorn FA. Tsga10 encodes a 65-kilodalton protein that is processed to the 27-kilodalton fibrous sheath protein. Biol Reprod (2004) 70(3):608–15. doi: 10.1095/biolreprod.103.021170
16. Tanaka R, Ono T, Sato S, Nakada T, Koizumi F, Hasegawa K, et al. Over-expression of the testis-specific gene TSGA10 in cancers and its immunogenicity. Microbiol Immunol (2004) 48(4):339–45. doi: 10.1111/j.1348-0421.2004.tb03515.x
17. Hagele S, Behnam B, Borter E, Wolfe J, Paasch U, Lukashev D, et al. TSGA10 prevents nuclear localization of the hypoxia-inducible factor (HIF)-1alpha. FEBS Lett (2006) 580(15):3731–8. doi: 10.1016/j.febslet.2006.05.058
18. Lan ZJ, Hu Y, Zhang S, Li X, Zhou H, Ding J, et al. GGNBP2 acts as a tumor suppressor by inhibiting estrogen receptor alpha activity in breast cancer cells. Breast Cancer Res Treat (2016) 158(2):263–76. doi: 10.1007/s10549-016-3880-2
19. Guo K, He Y, Liu L, Liang Z, Li X, Cai L, et al. Ablation of Ggnbp2 impairs meiotic DNA double-strand break repair during spermatogenesis in mice. J Cell Mol Med (2018) 22(10):4863–74. doi: 10.1111/jcmm.13751
20. Zhu Z, Lou C, Zheng Z, Zhu R, Tian S, Xie C, et al. ZFP403, a novel tumor suppressor, inhibits the proliferation and metastasis in ovarian cancer. Gynecol Oncol (2017) 147(2):418–25. doi: 10.1016/j.ygyno.2017.08.025
21. Yang Z, Wang Y, Ma L. Effects of gametogenetin-binding protein 2 on proliferation, invasion and migration of prostate cancer PC-3 cells. Andrologia (2020) 52(2):e13488. doi: 10.1111/and.13488
22. Zhan A, Lei B, Wu H, Wen Y, Zheng L, Wang S, et al. GGNBP2 suppresses the proliferation, invasion, and migration of human glioma cells. Oncol Res (2017) 25(5):831–42. doi: 10.3727/096504016X14816726393937
23. Li Y, Chen Z. Molecular cloning and characterization of LCRG1 a novel gene localized to the tumor suppressor locus D17S800-D17S930. Cancer Lett (2004) 209(1):75–85. doi: 10.1016/j.canlet.2003.11.034
24. Baralle FE, Giudice J. Alternative splicing as a regulator of development and tissue identity. Nat Rev Mol Cell Biol (2017) 18(7):437–51. doi: 10.1038/nrm.2017.27
25. Jiang W, Chen L. Alternative splicing: Human disease and quantitative analysis from high-throughput sequencing. Comput Struct Biotechnol J (2021) 19:183–95. doi: 10.1016/j.csbj.2020.12.009
26. Black DL. Mechanisms of alternative pre-messenger RNA splicing. Annu Rev Biochem (2003) 72:291–336. doi: 10.1146/annurev.biochem.72.121801.161720
27. Bonnal SC, López-Oreja I, Valcárcel J. Roles and mechanisms of alternative splicing in cancer — implications for care. Nat Rev Clin Oncol (2020) 17(8):457–74. doi: 10.1038/s41571-020-0350-x
28. Qi F, Li Y, Yang X, Wu YP, Lin LJ, Liu XM. Significance of alternative splicing in cancer cells. Chin Med J (Engl). (2020) 133(2):221–8. doi: 10.1097/CM9.0000000000000542
29. Hinnebusch AG, Ivanov IP, Sonenberg N. Translational control by 5'-untranslated regions of eukaryotic mRNAs. Science (2016) 352(6292):1413–6. doi: 10.1126/science.aad9868
30. Mignone F, Gissi C, Liuni S, Pesole G. Untranslated regions of mRNAs. Genome Biol (2002) 3(3):Reviews0004. doi: 10.1186/gb-2002-3-3-reviews0004
31. Chatterjee S, Pal JK. Role of 5'- and 3'-untranslated regions of mRNAs in human diseases. Biol Cell (2009) 101(5):251–62. doi: 10.1042/BC20080104
32. Davuluri RV, Suzuki Y, Sugano S, Zhang MQ. CART classification of human 5' UTR sequences. Genome Res (2000) 10(11):1807–16. doi: 10.1101/gr.GR-1460R
33. Pesole G, Mignone F, Gissi C, Grillo G, Licciulli F, Liuni S. Structural and functional features of eukaryotic mRNA untranslated regions. Gene (2001) 276(1-2):73–81. doi: 10.1016/S0378-1119(01)00674-6
34. Barrett T, Wilhite SE, Ledoux P, Evangelista C, Kim IF, Tomashevsky M, et al. NCBI GEO: Archive for functional genomics data sets–update. Nucleic Acids Res (2012) 41(D1):D991–D5. doi: 10.1093/nar/gks1193
35. Grzmil M, Morin P Jr., Lino MM, Merlo A, Frank S, Wang Y, et al. MAP kinase-interacting kinase 1 regulates SMAD2-dependent TGF-beta signaling pathway in human glioblastoma. Cancer Res (2011) 71(6):2392–402. doi: 10.1158/0008-5472.CAN-10-3112
36. Birks DK, Donson AM, Patel PR, Sufit A, Algar EM, Dunham C, et al. Pediatric rhabdoid tumors of kidney and brain show many differences in gene expression but share dysregulation of cell cycle and epigenetic effector genes. Pediatr Blood Cancer (2013) 60(7):1095–102. doi: 10.1002/pbc.24481
37. Griesinger AM, Birks DK, Donson AM, Amani V, Hoffman LM, Waziri A, et al. Characterization of distinct immunophenotypes across pediatric brain tumor types. J Immunol (2013) 191(9):4880–8. doi: 10.4049/jimmunol.1301966
38. Ritchie ME, Phipson B, Wu D, Hu Y, Law CW, Shi W, et al. Limma powers differential expression analyses for RNA-sequencing and microarray studies. Nucleic Acids Res (2015) 43(7):e47. doi: 10.1093/nar/gkv007
39. Davis S, Meltzer PS. GEOquery: A bridge between the gene expression omnibus (GEO) and BioConductor. Bioinformatics (2007) 23(14):1846–7. doi: 10.1093/bioinformatics/btm254
40. McInnes L, Healy J, Saul N, Großberger L. UMAP: Uniform manifold approximation and projection. J Open Source Software (2018) 3(29):861. doi: 10.21105/joss.00861
41. Kolde R. pheatmap: Pretty Heatmaps. (2019). Available at: cran.r-project.org.
42. Salehipour P, Nematzadeh M, Mobasheri MB, Afsharpad M, Mansouri K, Modarressi MH. Identification of new TSGA10 transcript variants in human testis with conserved regulatory RNA elements in 5'untranslated region and distinct expression in breast cancer. Biochim Biophys Acta Gene Regul Mech (2017) 1860(9):973–82. doi: 10.1016/j.bbagrm.2017.07.007
44. Paskeh MDA, Mehrabi A, Gholami MH, Zabolian A, Ranjbar E, Saleki H, et al. EZH2 as a new therapeutic target in brain tumors: Molecular landscape, therapeutic targeting and future prospects. BioMed Pharmacother. (2022) 146:112532. doi: 10.1016/j.biopha.2021.112532
45. Ghafouri-Fard S, Modarressi MH. Expression of cancer-testis genes in brain tumors: Implications for cancer immunotherapy. Immunotherapy (2012) 4(1):59–75. doi: 10.2217/imt.11.145
46. Hofmann O, Caballero OL, Stevenson BJ, Chen YT, Cohen T, Chua R, et al. Genome-wide analysis of cancer/testis gene expression. Proc Natl Acad Sci U S A. (2008) 105(51):20422–7. doi: 10.1073/pnas.0810777105
47. Chen A, Li J, Song L, Ji C, Böing M, Chen J, et al. GGNBP2 is necessary for testis morphology and sperm development. Sci Rep (2017) 7(1):1–8. doi: 10.1038/s41598-017-03193-y
48. Zhang J, Wang Y, Zhou Y, Cao Z, Huang P, Lu B. Yeast two-hybrid screens imply that GGNBP1, GGNBP2 and OAZ3 are potential interaction partners of testicular germ cell-specific protein GGN1. FEBS Lett (2005) 579(2):559–66. doi: 10.1016/j.febslet.2004.10.112
49. Li S, Moore AK, Zhu J, Li X, Zhou H, Lin J, et al. Ggnbp2 is essential for pregnancy success via regulation of mouse trophoblast stem cell proliferation and differentiation. Biol Reprod (2016) 94(2):41, 1–12. doi: 10.1095/biolreprod.115.136358
50. Liu J, Liu L, Yagüe E, Yang Q, Pan T, Zhao H, et al. GGNBP2 suppresses triple-negative breast cancer aggressiveness through inhibition of IL-6/STAT3 signaling activation. Breast Cancer Res Treat (2019) 174(1):65–78. doi: 10.1007/s10549-018-5052-z
51. Zhang J. GGNBP2 suppresses tumor growth and cancer stem cell load of triple negative breast cancer by controlling STAT3 pathway. Ann Oncol (2017) 28:v1–2. doi: 10.1093/annonc/mdx361.003
52. Jahani M, Shahlaei M, Norooznezhad F, Miraghaee SS, Hosseinzadeh L, Moasefi N, et al. TSGA10 over expression decreases metastasic and metabolic activity by inhibiting HIF-1 in breast cancer cells. Arch Med Res (2020) 51(1):41–53. doi: 10.1016/j.arcmed.2019.12.002
53. Sha YW, Sha YK, Ji ZY, Mei LB, Ding L, Zhang Q, et al. TSGA10 is a novel candidate gene associated with acephalic spermatozoa. Clin Genet (2018) 93(4):776–83. doi: 10.1111/cge.13140
54. Mansouri K, Mostafie A, Rezazadeh D, Shahlaei M, Modarressi MH. New function of TSGA10 gene in angiogenesis and tumor metastasis: A response to a challengeable paradox. Hum Mol Genet (2016) 25(2):233–44. doi: 10.1093/hmg/ddv461
Keywords: cancer testis antigens (CTA), testis specific gene antigen 10 (TSGA10), gametogenetin binding protein 2 (GGNBP2), 5’ untranslated region, brain tumors, alternative splicing (AS)
Citation: Kazerani R, Salehipour P, Shah Mohammadi M, Amanzadeh Jajin E and Modarressi MH (2023) Identification of TSGA10 and GGNBP2 splicing variants in 5′ untranslated region with distinct expression profiles in brain tumor samples. Front. Oncol. 13:1075638. doi: 10.3389/fonc.2023.1075638
Received: 20 October 2022; Accepted: 30 January 2023;
Published: 13 February 2023.
Edited by:
Wentian Yang, Brown University, United StatesReviewed by:
Martyn Alun Sharpe, Houston Methodist Hospital, United StatesGelei Xiao, Department of Neurosurgery, Central South University, China
Copyright © 2023 Kazerani, Salehipour, Shah Mohammadi, Amanzadeh Jajin and Modarressi. This is an open-access article distributed under the terms of the Creative Commons Attribution License (CC BY). The use, distribution or reproduction in other forums is permitted, provided the original author(s) and the copyright owner(s) are credited and that the original publication in this journal is cited, in accordance with accepted academic practice. No use, distribution or reproduction is permitted which does not comply with these terms.
*Correspondence: Mohammad Hossein Modarressi, TW9kYXJlc2lAdHVtcy5hYy5pcg==