
94% of researchers rate our articles as excellent or good
Learn more about the work of our research integrity team to safeguard the quality of each article we publish.
Find out more
ORIGINAL RESEARCH article
Front. Oncol., 07 March 2023
Sec. Thoracic Oncology
Volume 13 - 2023 | https://doi.org/10.3389/fonc.2023.1066360
This article is part of the Research TopicClinical Trials, Practice and Design in Thoracic OncologyView all 5 articles
 Chengyu Chen1,2†
 Qun Geng3†Gesheng Song4
 Qian Zhang5Youruo Wang6
 Dongfeng Sun2Qingshi Zeng4Zhengjun Dai7Gongchao Wang1*
Objective: To establish a nomogram based on non-enhanced computed tomography(CT) imaging radiomics and clinical features for use in predicting the malignancy of sub-centimeter solid nodules (SCSNs).
Materials and methods: Retrospective analysis was performed of records for 198 patients with SCSNs that were surgically resected and examined pathologically at two medical institutions between January 2020 and June 2021. Patients from Center 1 were included in the training cohort (n = 147), and patients from Center 2 were included in the external validation cohort (n = 52). Radiomic features were extracted from chest CT images. The least absolute shrinkage and selection operator (LASSO) regression model was used for radiomic feature extraction and computation of radiomic scores. Clinical features, subjective CT findings, and radiomic scores were used to build multiple predictive models. Model performance was examined by evaluating the area under the receiver operating characteristic curve (AUC). The best model was selected for efficacy evaluation in a validation cohort, and column line plots were created.
Results: Pulmonary malignant nodules were significantly associated with vascular alterations in both the training (p < 0.001) and external validation (p < 0.001) cohorts. Eleven radiomic features were selected after a dimensionality reduction to calculate the radiomic scores. Based on these findings, three prediction models were constructed: subjective model (Model 1), radiomic score model (Model 2), and comprehensive model (Model 3), with AUCs of 0.672, 0.888, and 0.930, respectively. The optimal model with an AUC of 0.905 was applied to the validation cohort, and decision curve analysis indicated that the comprehensive model column line plot was clinically useful.
Conclusion: Predictive models constructed based on CT-based radiomics with clinical features can help clinicians diagnose pulmonary nodules and guide clinical decision making.
With increasing use of chest computed tomography(CT) in health check-ups and preoperative examinations, many pulmonary nodules that are difficult to identify on a chest X-ray are being detected (1). Common pulmonary nodules are usually classified into three categories: pure ground glass nodules (pGGNs), mixed ground glass nodules (mGGNs), and solid nodules (SNs) (2). Most solid nodules <1cm in diameter,also known as subcentimeter solid nodules (SCSNs), are benign and commonly encountered as intrapulmonary lymph, fibrous foci and tuberculosis nodules (3).But SCSNs do not guarantee their benignancy, some solid nodules are malignant, typically in lung adenocarcinoma (4, 5). Therefore, the diagnosis of pulmonary nodules is still important, since it is related to the need for close follow-up observation or surgical treatment. Early diagnosis can improve patient prognosis and reduce radiation exposure due to close follow-up (6). We found that there are more studies on pGGNs and mGGNs (7, 8), but less studies on SNs, especially SCSNs, so we focused on SCSN in an attempt to make a small contribution to the early diagnosis of lung cancer.
Nodule shape, margins, burr sign, and pleural pull sign can be used to determine the nature of the nodule. However, these signs are subjective and often not obvious when the nodules are small (2). Positron Emission Tomography-CT (PET-CT) is also commonly used for the diagnosis of tumors. It can aid in evaluating the metabolic activity of the mass to infer its nature, although its specificity for smaller lung nodules is low (9). Percutaneous biopsy is also used for the diagnosis of the nature of lung masses, but it has disadvantages, such as its invasive nature, which may lead to needle tract metastasis and puncture failure. It usually follows thoracoscopic resection biopsy as a last diagnostic resort (10, 11). Therefore, a more simple and accessible non-invasive and efficient diagnostic tool is needed.
Many researchers have realized that the morphological features on CT images do not provide a complete picture for diagnosis, and a large amount of high-dimensional and valuable data that cannot be seen are hidden in the images (12, 13). In 2012, Lambin et al. proposed using radiomics, which emphasizes extracting a large amount of information from images (CT, Magnetic Resonance Imaging, and PET-CT) in a high-throughput manner to achieve tumor image segmentation, feature extraction, and model building by virtue of deeper mining, analysis, and prediction of massive image data information to assist physicians in disease diagnosis, prognosis assessment, and treatment response prediction (14). Generally, the radiomics workflow consists of the following main steps: imaging data collection, imaging preprocessing, identification and segmentation of the region or volume of interest, feature extraction, feature selection, model establishment, and model validation (15, 16). Some studies have shown that chest CT radiomics can be used to predict benign and malignant lung nodules, aggressiveness, pathological typing, genetic phenotype, and treatment response and to determine prognosis (17–21). However, CT radiomics has not been applied to assess the malignancy of pulmonary SCSNs.
Therefore, the present study used non-enhanced chest CT imaging radiomics combined with clinical data to construct a predictive model for malignancy prediction of pulmonary SCSNs to guide clinical decision making.
This study was approved by the Ethics Committee of The First Affiliated Hospital of Shandong First Medical University (center 1) and the Shandong Provincial Hospital Affiliated to Shandong First Medical University (center 2). Patients’ informed consent was waived due to the retrospective nature of the study. A total of 147 patients hospitalized at center 1 between January 2020 and June 2021 were included in the modeling group. Moreover, 52 patients hospitalized at center 2 between January 2021 and June 2021 were included in the validation group. Inclusion criteria were as follows: a. SCSNs without obvious calcified components; b. thin-layer scans with layer thickness of ≤ 1.5 mm, c. CT images within two weeks before surgery, and d. patients underwent a complete surgical resection. Exclusion criteria were as follows: a. chemotherapy, radiotherapy, or previous history of malignancy prior to CT examination, b. poor image quality, and c. incomplete clinical or imaging data. Relevant patient information is shown in Table 1.
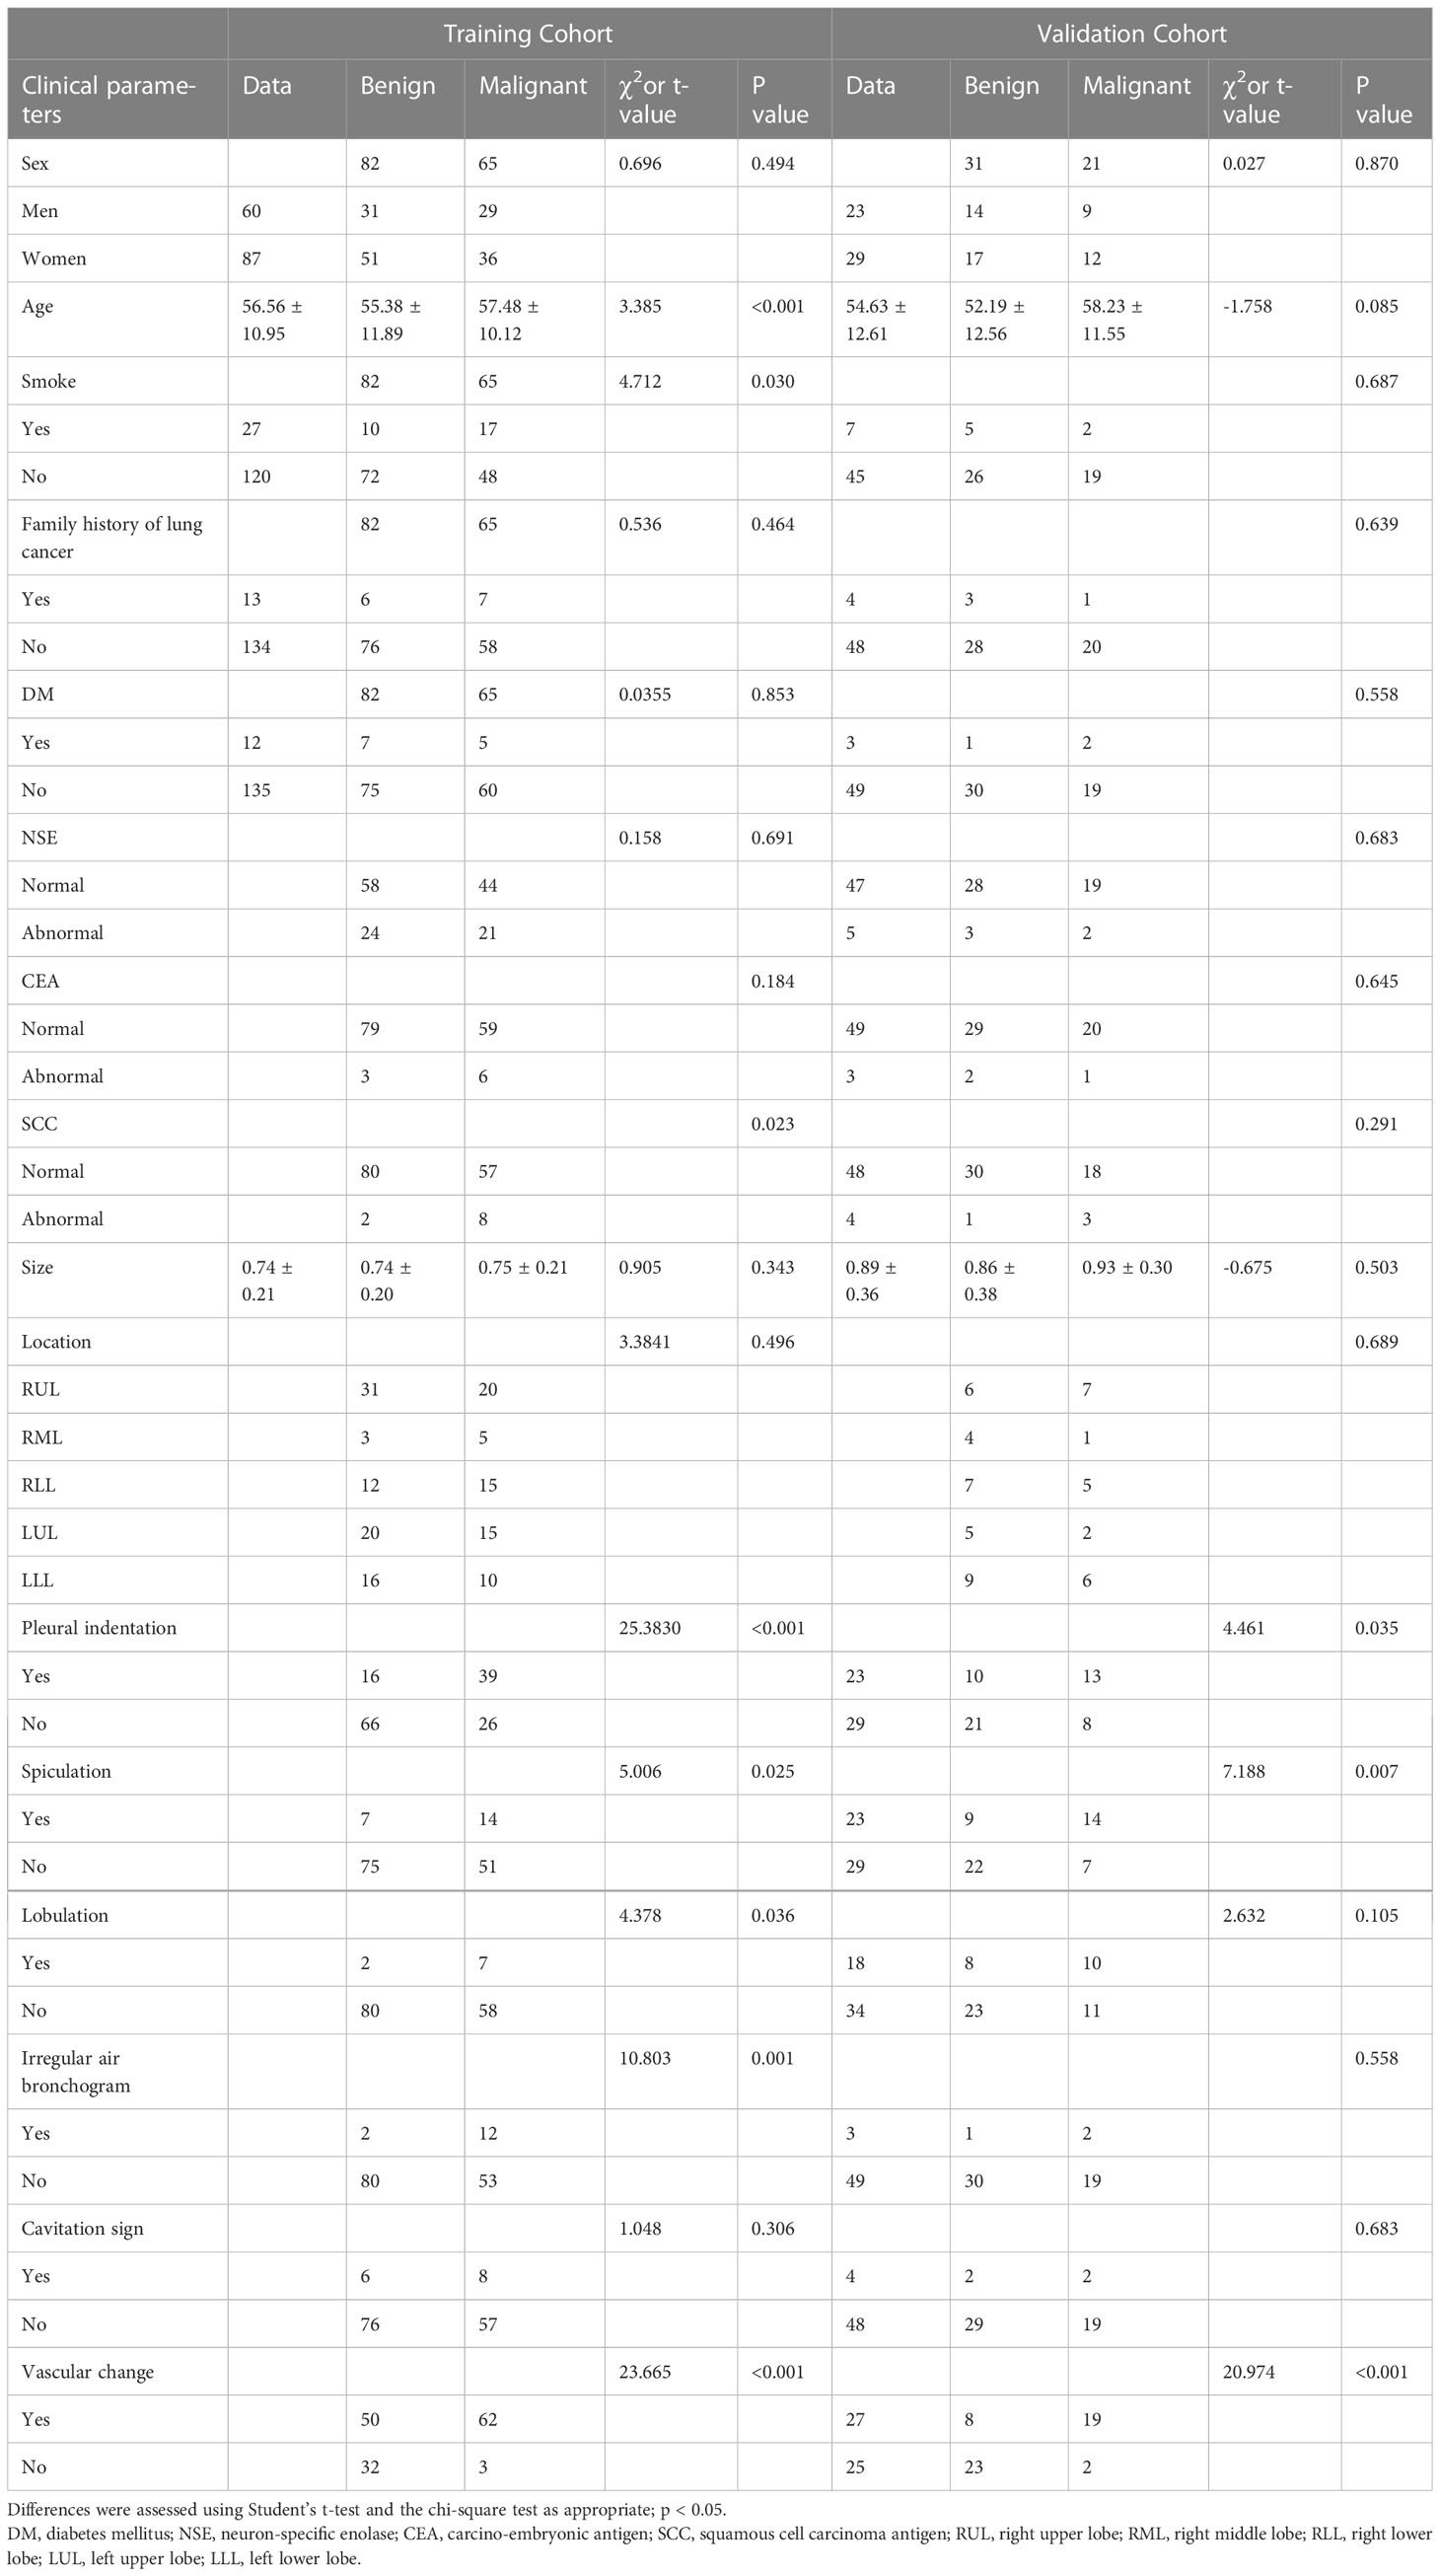
Table 1 Clinical characteristics and subjective CT findings of lung nodules in training and validation cohorts.
CT examinations were performed using non-enhanced CT scanning on a high-definition CT (HDCT) system (GE Discovery CT750 HD; GE Healthcare, Milwaukee, WI, USA). The parameters were: tube current of 275 mA, tube voltage of 120 kV, helical scanning, 1.375 helical pitch, 0.7 s tube rotation time, pixel matrix of 512 × 512, adopting 40 mm collimation, 5 mm slice thickness, and 5 mm slice interval. Patients held their breath for scanning in the supine position. The scanning area covered the whole chest. Axial images were reconstructed with a slice thickness of 1.25 mm and an interval of 1.0 mm with a lung algorithm.
CT features of the lung mass were independently evaluated by two experienced imaging physicians (with 6 and13years of experience in chest CT review, respectively) who were not informed of the pathology findings prior to the review. Disagreements between the two physicians were resolved via discussion. All CT findings were evaluated based on non-enhanced CT images. The main imaging features included spiculation (sunburst appearance), lobulation (abrupt bulging of the lesion contour), cavitation sign (gas-filled space presenting as a lucency or low-attenuation area), irregular air bronchogram (bronchial branch shadow with air in the nodule) and vascular change (abnormal angiogenesis or vascular distortion) (Figure 1), and pleural indentation (22–24).
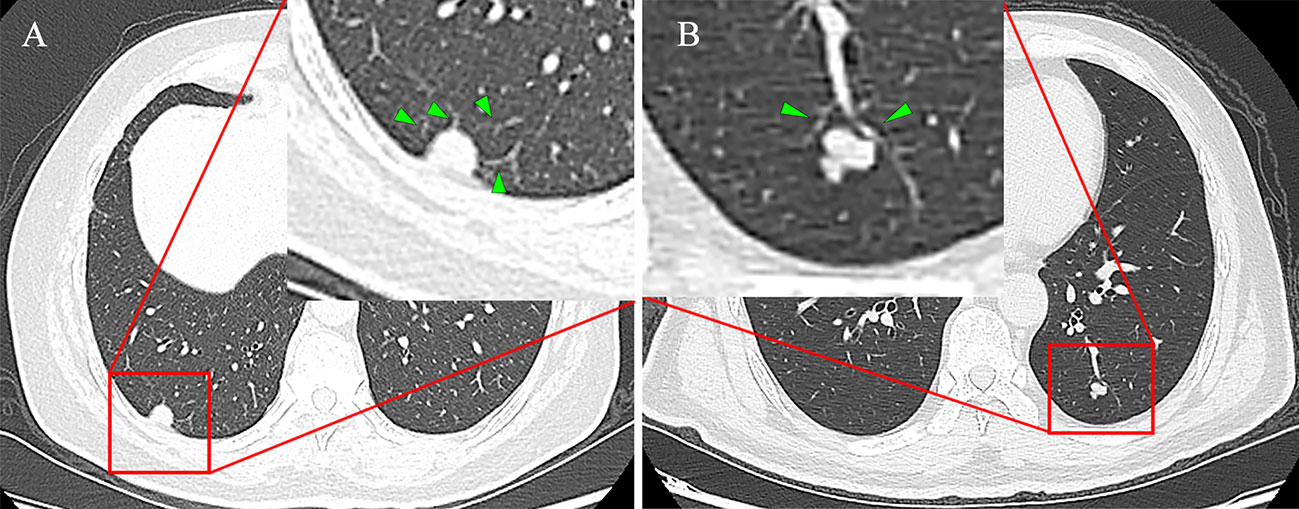
Figure 1 (A) Female, 68 years old, the SCSN had four abnormal angiogenesis into the interior of the lesion, defined as having vascular changes, no other malignant signs and pathologically confirmed adenocarcinoma. (B) Male, 50 years old, the SCSN had two normal vessels passing by without deformation and abnormal angiogenesis, defined as no vascular changes, and pathology confirmed as hamartoma.
Histopathological examination of surgical specimens was performed by two pathologists (with more than 10 years of experience and 15 years of experience, respectively) for pathological diagnosis. The chest CT report and clinical information were not communicated before reading the films. The excised lesions were classified according to the 2021 World Health Organization (WHO) classification (25).
RadCloud platform (version 2.1.2, https://mics.huiyihuiying.com/, Huiying Medical Technology Co., Ltd, Beijing, China) was used to manage image data, clinical data, and radiomic feature extraction.
CT images were acquired and uploaded to the database according to a standardized scanning protocol. The regions of interest (ROIs) were manually outlined on the CT images by a junior imaging physician (Dr. Song), and then all contours were examined by a senior imaging physician (Dr. zeng). If the discrepancy was ≥ 5%, the senior imaging physician determined the boundary.
Based on the ROIs outlined on CT images, 1409 features were automatically extracted using the RadCloud platform. The features were then divided into four categories (1): first-order statistics, which mainly describe the variation of voxel intensity in distributed CT images; (2) shape- and dimension-based features; (3) texture features, including grayscale dependence matrix, grayscale tour matrix, neighborhood grayscale difference matrix, grayscale size region matrix, and texture features that can quantify differences in regional heterogeneity; and (4) higher-order statistical features, which are obtained by filtering transformations on the original image. The filters used in the present study included exponential, square, square root, logarithmic, gradient, Ibp-2D, and wavelet. All imaging radiomics features were defined in accordance with those described in the Imaging Biomarker Standardization Initiative (26).
The analysis of the interclass and intraclass correlation coefficients (ICCs) was used to test the consistency of radiomics features of inter- and intra-observers. CT images of 60 patients were randomly selected for the test. To assess the reliability of inter-observers, a imaging physician (Dr. Song) segmented the ROIs, and after 1 week, the same radiologist segmented the ROIs for the second time. To assess the reliability of intra-observers, ROI segmentation was performed independently by another imaging physician (Dr. Zeng) and compared with the first segmentation results of the first radiologist (Dr. Song). An ICC value greater than 0.75 indicates good consistency and is included in the follow-up study.
Student’s t-test and the chi-square test were used to compare age, gender, tumor markers, smoking history, diabetes mellitus history, family history of malignancy, and CT characteristics between the two groups. The clinical factors (including gender and age) and subjective CT characteristics were analyzed by multifactorial regression to select meaningful indicators for the prediction model.
A large number of image features was obtained using imaging radiomics. However, not all of these extracted features may be useful for a specific task. Therefore, dimensionality reduction and selecting task-specific features for optimal performance are necessary steps. The least absolute shrinkage and selection operator (LASSO) was used to reduce the redundant features. For the LASSO model, the L1 regularizer was used as the cost function with an error value of 5 for cross-validation and a maximum number of 1000 iterations. The LASSO algorithm was used to reduce the dimensionality and select the best radiomic features to calculate the radiomic score (Ra-score) of each lesion. The Ra-score of benign and malignant SCSNs in the training and validation cohort were analyzed by Student’s t-test to clarify whether there were differences in Ra-scores between different pathological types.
Three prediction models for subjective features, Ra-score, and subjective features combined with Ra-score were built separately in the training set using logistic regression analysis. The prediction performance of the three models was evaluated using receiver operating characteristic (ROC) curves. The optimal model was then selected and validated in the validation set. Finally, the individualized prediction nomogram based on multivariate logistic model was constructed.
Statistical analyses were performed using SPSS software 22.0(IBM, Chicago, IL, USA) and Empower software. A p value of <0.05 was considered to indicate a statistically significant difference.
The clinical data of the patients are presented in Table 1. Of the benign SCSNs in the training cohort 82.93% were inflammatory (including chronic inflammation and granulomatous inflammation),13.41% were benign tumors (including hamartoma, pulmonary sclerosing pneumocytoma, adenofibrolipoma and bronchial adenoma), and 2.44% were intrapulmonary lymph nodes and 1.22% were fibrotic nodules; while in the validation group, the percentages were 64.52%, 25.81%, 3.23%, and 6.45%, respectively. In the validation cohort, 93.85% of the malignant SCSNs were adenocarcinomas, 4.62% were squamous cell carcinoma, and 1.54% were metastatic tumor; while in the malignant group, all were adenocarcinomas.
Multivariate logistic regression analysis showed that vascular changes in subjective features were an independent factor in identifying benign and malignant SCSNs (Table 2). Based on this, a prediction model for benign and malignant pulmonary nodules (subjective model, Model 1) had an AUC of 0.672 for the ROC curve and a mediocre predictive efficacy.
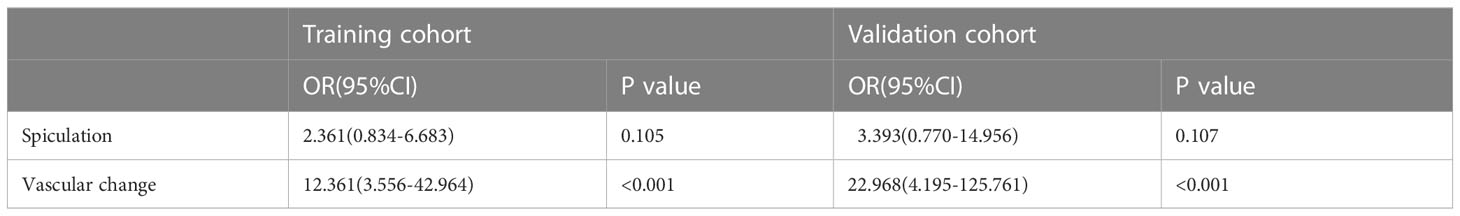
Table 2 Multivariate analyses.
The imaging histology data were screened using the LASSO regression to reduce the dimensionality (Figure 2). A total of 11 potential predictors were selected and their Ra-scores were calculated using the following formula:
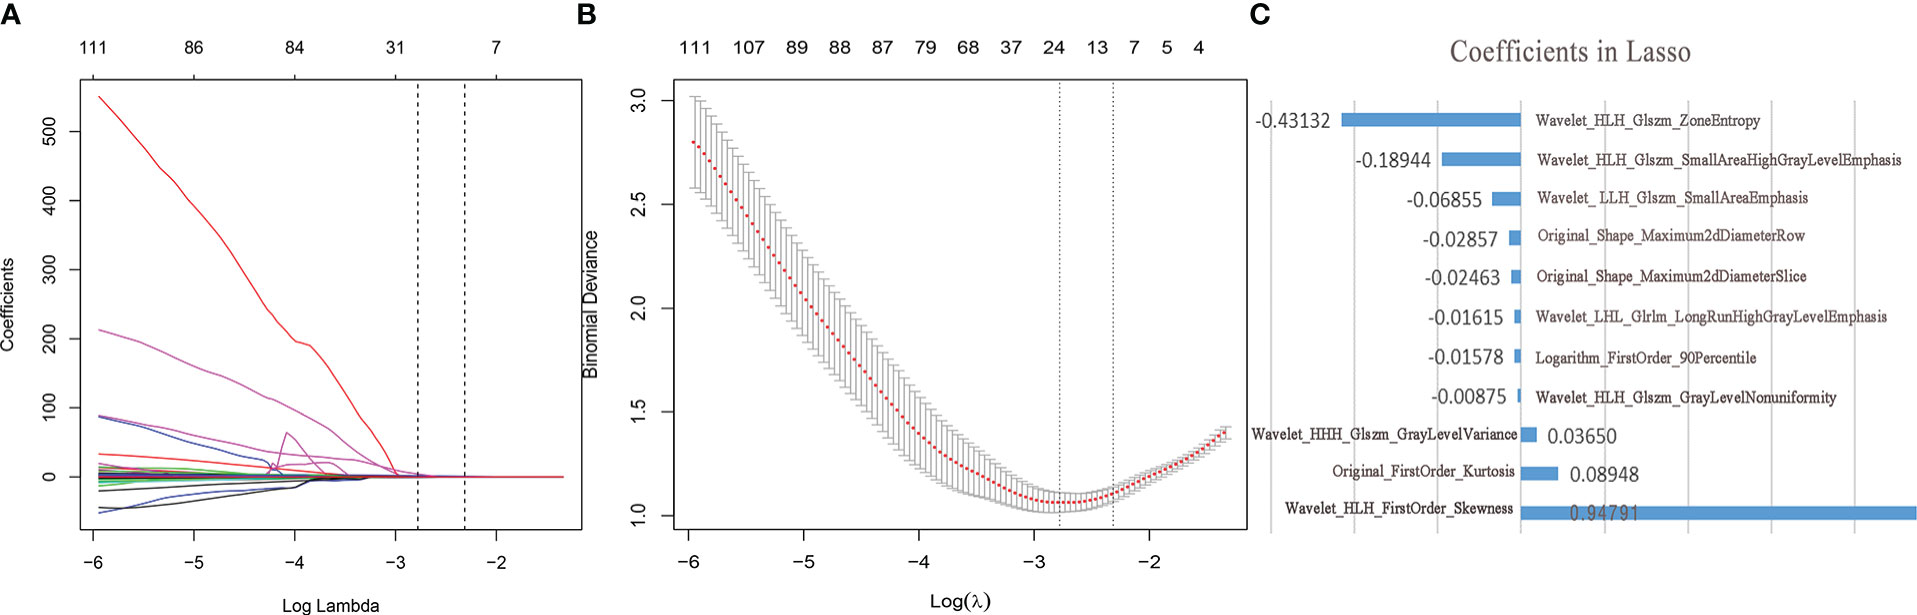
Figure 2 Feature selection and dimension reduction. (A) Ten-fold cross-validation of LASSO analysis was used to acquire the most valuable features when the minimum lambda was 0.0621. (B) LASSO regression coefficients (C) The radiological features selected by LASSO regression and its coefficients.
The Student’s t-test showed no significant difference in the Ra-score of benign SCSNs between the training and validation cohort (p=0.553),as well as in the malignant SCSNs(p=0.095). Model 2(radiomic score model) was a prediction model constructed using logistic regression analysis of Ra-score. It had an ROC curve AUC of 0.888 (0.835–0.942, p<0.001) and its predictive efficacy was significantly improved. In contrast, Model 3, which was a comprehensive prediction model generated by combining the Ra-score and subjective characteristics, had an AUC of 0.930 (0.888–0.972, p<0.001) for the ROC curve. Its predictive efficacy was enhanced in comparison to Model 2, and this difference was statistically significant (Figure 3).
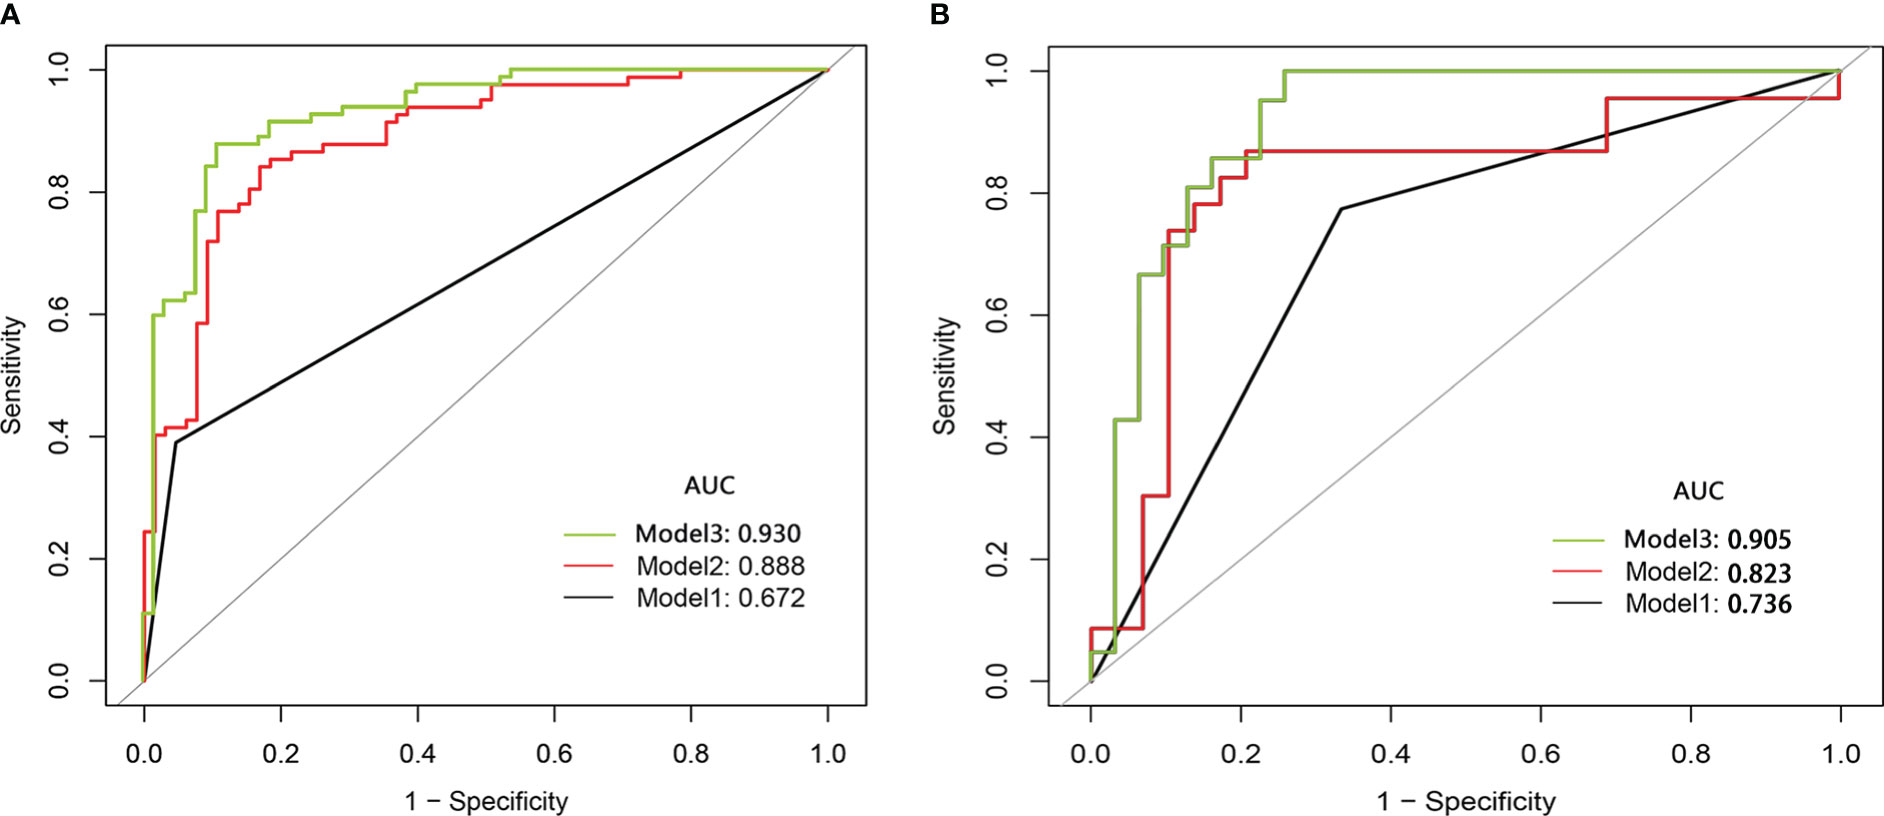
Figure 3 The comparison of the ROC curve of subjective model (Model 1,black line), radiomics score model(Model 2,red line)and comprehensive model(Model 3,green line) in the training cohort (A) and the validation cohort (B). ROC, receiver operating characteristic; AUC, area under the curve.
The three models were applied to a validation cohort consisting of 52 cases. The results showed that the AUC of the Model 3 ROC curve was 0.905, which was better than that of Model 1 (AUC = 0.736) and Model 2 (AUC = 0.823). Thus, the integrated prediction model based on the Ra-scores and subjective features was well stabilized and had a high predictive efficacy (Table 3). The DCA(decision curve analysis) showed that the overall net benefit of the integrated model column line plot was greater compared to the radiomics column line plot (Figure 4). A nomogram model was constructed that incorporated the radiomics score and clinical features (Figure 5A). The calibration curve demonstrated favorable calibration with the training and validation cohorts (Figures 5B, C).
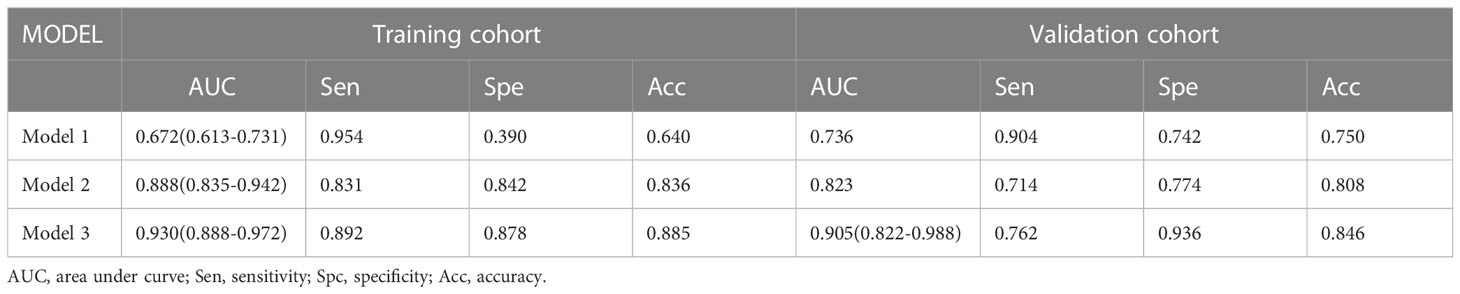
Table 3 Predictive efficacy of models in the training and validation cohorts.
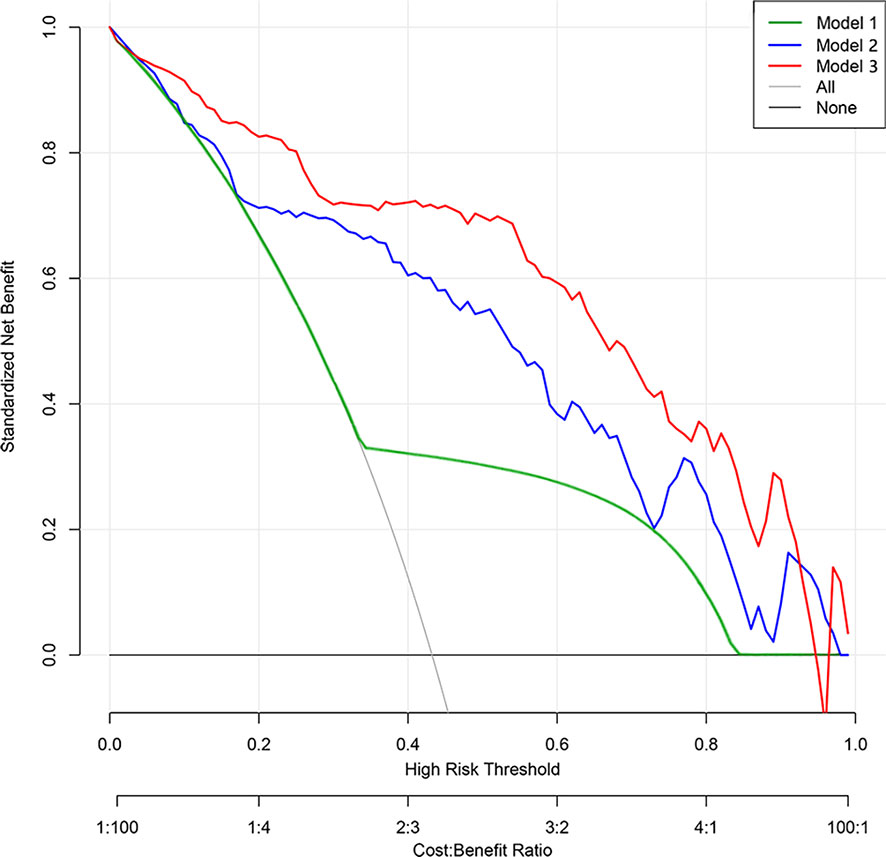
Figure 4 Decision curve analysis of prediction models. The y-axis represents the net benefit. The gray line represents the assumption that all patients had lung malignant nodules. The black line represents the hypothesis that all patients had benign nodules. The green line represents Model 1 (subjective model). The blue line represents Model 2 (radiomic nomogram model). The red line represents Model 3 (comprehensive nomogram). The x-axis represents the threshold probability. The threshold probability is where the expected benefit of treatment is equal to the expected benefit of no treatment. The decision curve shows that model 2 adds more net benefit than model 1, while model 3 performs better than model 2 in the range of 0.05 to 0.92.
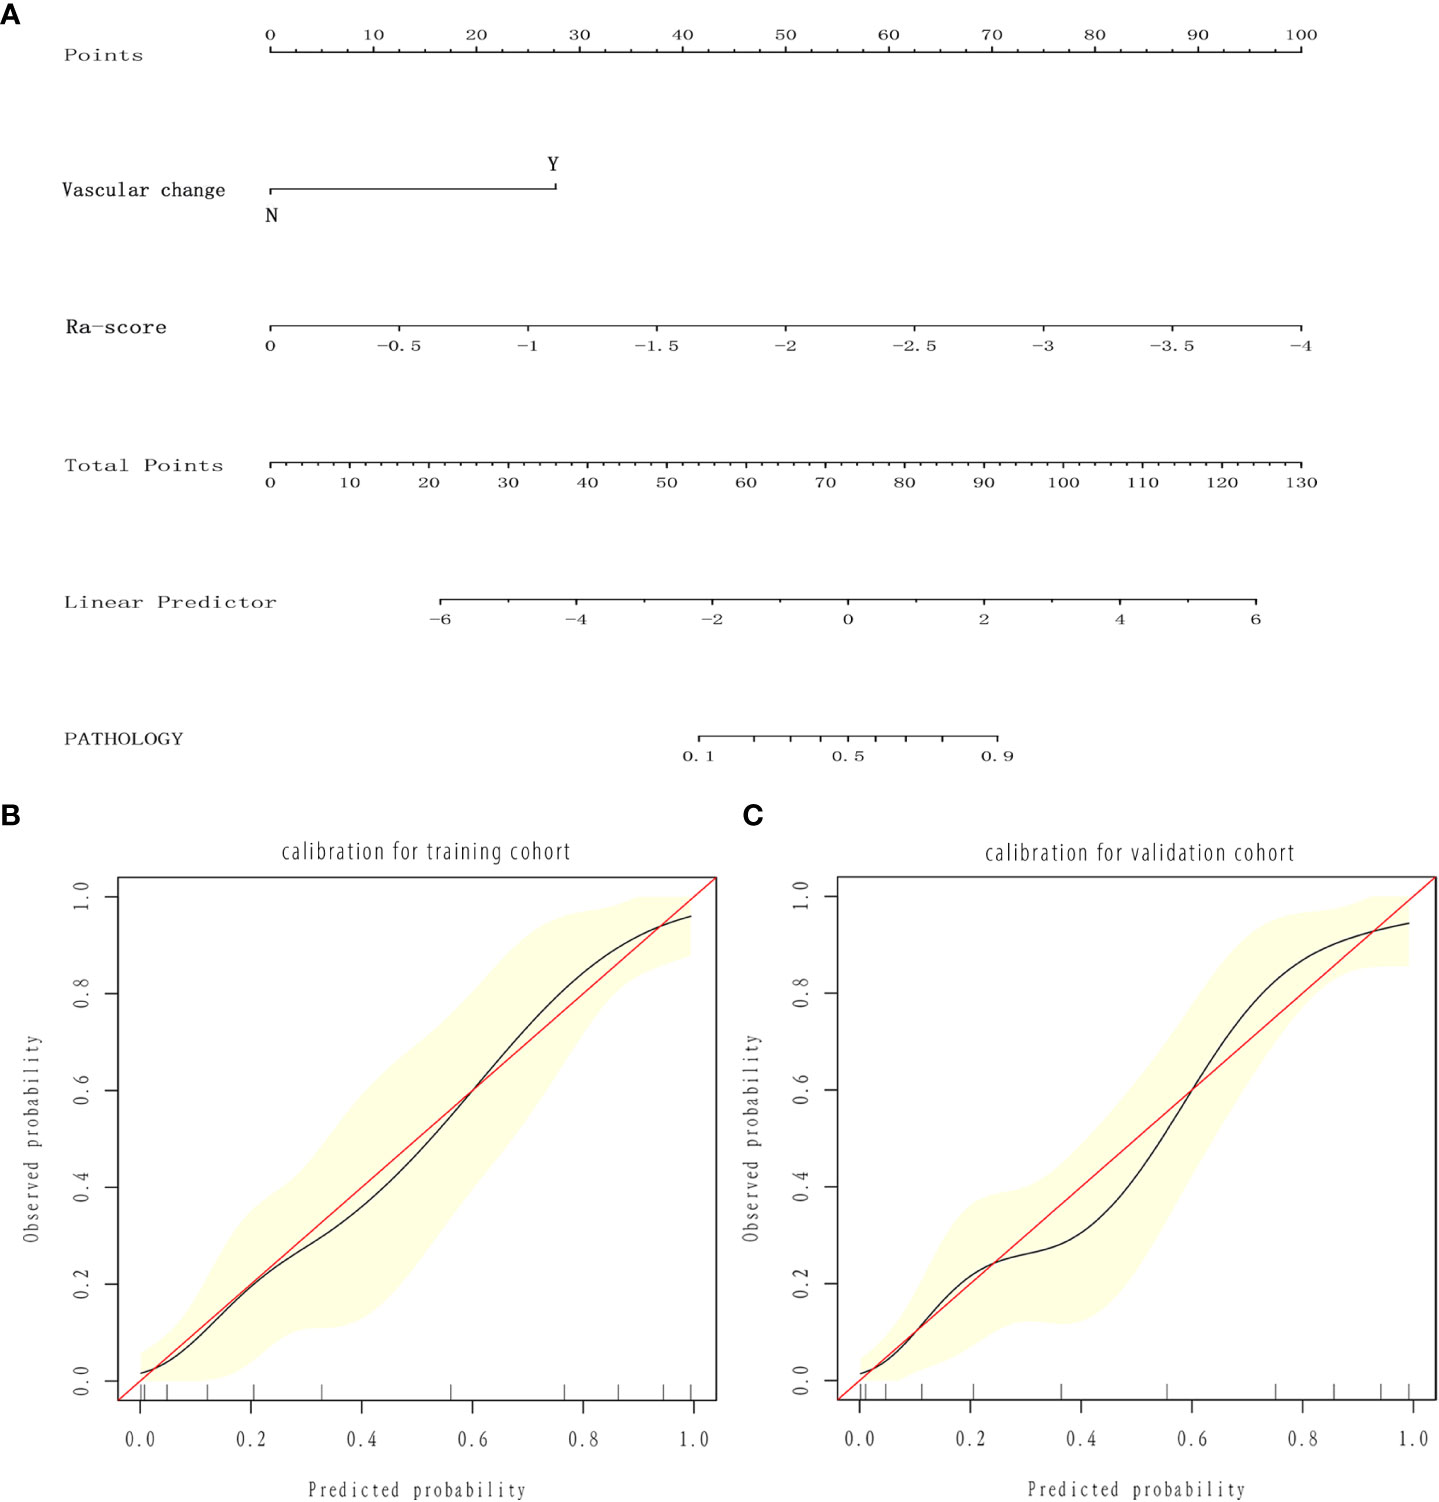
Figure 5 Nomogram and calibration curves. (A) Nomogram for predicting benign and malignant SCSNs. (B, C) Calibration curves of the radiomics nomogram in the training (B) and validation (C) cohort. The calibration curve describes the calibration of the nomogram based on the agreement between the prediction of the benign and malignant pulmonary nodules and the observed actual benign and malignant results. The red line represents the perfect prediction, and the red line represents the prediction performance of the radiomics nomogram. The yellow area is the 95% confidence interval (CI) of the calibration curve.
Pulmonary nodules are becoming more and more common in clinical experience. Even though current studies have been investigating the pGGNs and mGGNs more thoroughly, there is still not enough research on solid nodules. Moreover, all of the malignant solid nodules diagnosed in the present study were invasive carcinomas. It is not uncommon to encounter solid and micropapillary types of lung cancer with a high risk of recurrence and metastasis, which shows that malignant solid nodules can have a great impact on health if they go undiagnosed. The present study constructed a comprehensive subjective characteristics and Ra-score nomogram using logistic regression analysis to identify the benign and malignant pulmonary SCSNs. The model had a high predictive accuracy and provided a new idea for the diagnosis of SCSNs.
Multifactorial analysis showed that only vascular changes were helpful for disease diagnosis. This is likely because even though patients’ clinical information can sometimes be helpful for disease diagnosis, such as family history of lung cancer and tumor indicators, its specificity and sensitivity are not sufficient. Although conventional radiographs can suggest the benignity and malignancy of lung nodules using nodal features, such as pleural traction sign, burr sign, and lobar sign, when the nodules are small, their malignant imaging features are often not obvious and difficult to identify with the naked eye. This introduces a certain level of subjective bias, which is consistent with a previous study by Gao et al. (27). In contrast, several studies have shown that vascular changes, such as abnormal angiogenesis or vascular distortion, are commonly seen in malignant pulmonary nodules (23, 28). The area under the ROC curve of the clinical features prediction model based on this was 0.672 and had an average predictive efficacy.
In fact, CT images contain a lot of important information about lung nodules. Previously, some studies have found imaging histology to be effective in differentiating lung cancer from tuberculosis and analyzing tumor pathology types and gene expression (17–21). However, the radiological features selected in these studies were relatively few, which led to a low validity and stability of their results. In the present study, 1409 radiological features were extracted from images, including shape, size, boundary, density, and texture features. The LASSO algorithm was used to perform radiomic feature analysis in the training set, identifying 11 radiomic features with non-zero weighting coefficients. These were utilized to generate the final radiomic feature model to improve model stability. As a result, the AUC of the imaging histology prediction model was 0.888, which improved the prediction efficacy compared to the clinical feature prediction model. This difference was statistically significant. While combining imaging histology and subjective features to build the prediction model, the AUC of the ROC curve was 0.930 (0.888–0.972, p = 0.001), with a further increase in prediction efficacy that was statistically significantly different. We analyzed that the reason might be that the vascular changes were located outside of the pulmonary nodules and the abnormal vessels could not be outlined together with the nodules. Therefore, the histological imaging information did not include the vascular changes and the diagnostic efficacy was further improved by including them in the prediction model later on. Some studies have also included the peri-tumoral region, which is a 5-mm area around the nodule, in the imaging radiomics analysis after the nodule is outlined. Although this includes information about peri-nodal vessels, it cannot distinguish normal from abnormal vessels, and its application is limited when the nodule is surrounded by normal tissues, such as pleura and bronchi (29).
Methods and predictive models for discriminating the nature of lung nodules during early screening of lung cancer are increasingly becoming an important topic in the current clinical field. In previous studies, imaging radiomics and line drawings have been used to predict lymph node metastasis and prognosis in lung, colorectal, bladder, kidney, and gastric cancers, invasiveness of lung nodes, and epidermal growth factor receptor mutations (17–21, 30–33). However, there are no relevant studies on predicting the malignancy of lung SCSNs, and most of the above studies utilized pure imaging and radiomics models. The present study therefore is able to fill this gap. It also established several models based on subjective features and imaging radiomics and compared each model in order to identify the optimal model with predictive efficacy that was significantly better than that in similar studies. The t-test showed no significant difference of the Ra-scores between the different groups, indicating that although the type and proportion of pathology in the training and validation groups were not identical, it did not affect the stability of the results.
Due to the differences in clinician expertise and the lack of model understanding, it is difficult to extend the research results for lung nodule property discrimination to clinical application. Therefore, considering the prognostic significance of lung nodule characterization in early screening for lung cancer, the present study presents a nomogram of lung nodule characterization to assist physicians in diagnosing the malignancy of lung nodules, making it easy to use in clinical practice and helping to guide surgical treatment and clinical decision making.
There are some limitations in our study. First, the segmentation of CT images was manually outlined by clinicians, and although the data were reproducible by two physicians who outlined the review ROIs, subjective bias may remain. Therefore, this limits large-scale application, and the introduction of artificial intelligence to outline the ROIs should be considered at a later stage to further reduce the selection bias and facilitate data application. Second, the study data were collected from two centers in Shandong Province Qianfo Mountain Hospital and Shandong First Medical University Affiliated Provincial Hospital. Thus, these data are not as convincing as data from multicenter cohorts and different populations. Multicenter studies should be performed in the future. Third, Radiomics is inherently data-driven and lacks underlying biological principles by screening a large number of image features for reproducibility and potential information. Most published radiomics studies show no validation of the features used, except for the use of independent test sets. Yip et al. found an association between imaging features and radiomics features, but the association was not strong (34). Skogen et al. demonstrated in glioma that tumor grading, which is known to correlate with heterogeneity, correlated with the standard deviation of intensity distribution in CT images (35). In contrast, Liu et al. reported no correlation between tumor grading and heterogeneity, while showing a strong association with textural features (36). More studies may be needed to verify the biological meaning of the radiomics features. This disconnect between predictive models and biological significance will inevitably limit its wide clinical application. Combining clinical and preclinical experiments may also play an important role in the biological validation of imaging histology. Animal studies enable the experimental interventions necessary to establish causal relationships between biology and imaging histology and to provide precise, spatially aligned histological analyses for in-depth validation. We hope to do deeper research in future studies. Fourth, our study was a retrospective analysis of patients with pulmonary SCSN who underwent surgery at two centers, but in reality, a proportion of patients with pulmonary SCSN did not undergo surgery but were observed at long-term follow-up, which led to selective bias and a situation that was similar in some other studies (37, 38). In future studies, we will increase the sample size to include cases that did not undergo surgery with further follow-up observations to further validate and optimize this prediction model.
In conclusion, the imaging of histological features of plain CT images may help to identify benign and malignant SCSNs. A nomogram based on the imaging of histological features and abnormal vessels can be an effective tool to diagnose benign and malignant sub-centimeter solid pulmonary nodules and thus guide clinical decision making.
The original contributions presented in the study are included in the article/Supplementary Material. Further inquiries can be directed to the corresponding author.
The studies involving human participants were reviewed and approved by Ethics Committee of the First Affiliated Hospital of Shandong First Medical University, Ethics Committee of the Provincial Hospital of Shandong First Medical University. Written informed consent for participation was not required for this study in accordance with the national legislation and the institutional requirements.
QSZ and GW contributed to the conception of the study; QG and CC performed the experiment; QG contributed significantly to analysis and manuscript preparation; CC performed the data analyses and wrote the manuscript; ZD and YW assisted in the development of the radiomics model and data analysis; QZ, DS, and GS helped perform the analysis with constructive discussions. All authors contributed to the article and approved the submitted version.
This research study was supported by the Science and Technology Development Plan of Jinan (201907061).
We would like to express our sincere appreciation and gratitude to the hospital staff who helped to coordinate the trial. We thank the International Science Editing for editing this manuscript.
Author ZD was employed by Scientific Research Department, Huiying Medical Technology Co., Ltd.
The remaining authors declare that the research was conducted in the absence of any commercial or financial relationships that could be construed as a potential conflict of interest.
All claims expressed in this article are solely those of the authors and do not necessarily represent those of their affiliated organizations, or those of the publisher, the editors and the reviewers. Any product that may be evaluated in this article, or claim that may be made by its manufacturer, is not guaranteed or endorsed by the publisher.
1. Hoffman RM, Atallah RP, Struble RD, Badgett RG. Lung cancer screening with low-dose CT: A meta-analysis. J Gen Intern Med (2020) 35(10):3015–25. doi: 10.1007/s11606-020-05951-7
2. Azour L, Ko JP, Washer SL, Lanier A, Augello GB, Alpert JB, et al. Incidental lung nodules on cross-sectional imaging: Current reporting and management. Radiol Clin North Am (2021) 59(4):535–49. doi: 10.1016/j.rcl.2021.03.005
3. Shin KE, Lee KS, Yi CA, Chung MJ, Shin MH, Choi YH. Subcentimeter lung nodules stable for 2 years at LDCT: Long-term follow-up using volumetry. Respirology (2014) 19(6):921–8. doi: 10.1111/resp.12337
4. Silva M, Milanese G, Ledda RE, Pastorino U, Sverzellati N. Screen-detected solid nodules: From detection of nodule to structured reporting. Transl Lung Cancer Res (2021) 10(5):2335–46. doi: 10.21037/tlcr-20-296
5. Chen W, Zhu D, Chen H, Luo J, Fu H. Predictive model for the diagnosis of benign/malignant small pulmonary nodules. Med (Baltimore) (2020) 99(15):e19452. doi: 10.1097/MD.0000000000019452
6. Kim TJ, Kim CH, Lee HY, Chung MJ, Shin SH, Lee KJ, et al. Management of incidental pulmonary nodules: current strategies and future perspectives. Expert Rev Respir Med (2020) 14(2):173–94. doi: 10.1080/17476348.2020.1697853
7. Mironova V, Blasberg JD. Evaluation of ground glass nodules. Curr Opin Pulm Med (2018) 24(4):350–4. doi: 10.1097/MCP.0000000000000492
8. Jacobson FL, Jaklitsch MT. Computed tomography scanning for early detection of lung cancer. Annu Rev Med (2018) 69:235–45. doi: 10.1146/annurev-med-020917-053556
9. Groheux D, Quere G, Blanc E, Lemarignier C, Vercellino L, de Margerie-Mellon C, et al. FDG PET-CT for solitary pulmonary nodule and lung cancer: Literature review. Diagn Interv Imag (2016) 97(10):1003–17. doi: 10.1016/j.diii.2016.06.020
10. Kim J, Chee CG, Cho J, Kim Y, Yoon MA. Diagnostic accuracy and complication rate of image-guided percutaneous transthoracic needle lung biopsy for subsolid pulmonary nodules: a systematic review and meta-analysis. Br J Radiol (2021) 94(1127):20210065. doi: 10.1259/bjr.20210065
11. Wagnetz U, Menezes RJ, Boerner S, Paul NS, Wagnetz D, Keshavjee S, et al. CT screening for lung cancer: Implication of lung biopsy recommendations. AJR Am J Roentgenol (2012) 198(2):351–8. doi: 10.2214/AJR.11.6726
12. Gillies RJ, Kinahan PE, Hricak H. Radiomics: Images are more than pictures, they are Data. Radiology (2016) 278(2):563–77. doi: 10.1148/radiol.2015151169
13. Mayerhoefer ME, Materka A, Langs G, Häggström I, Szczypiński P, Gibbs P, et al. Introduction to radiomics. J Nucl Med (2020) 61(4):488–95. doi: 10.2967/jnumed.118.222893
14. Lambin P, Rios-Velazquez E, Leijenaar R, Carvalho S, Stiphout R, Granton P, et al. Radiomics: Extracting more information from medical images using advanced feature analysis. Eur J Cancer (2012) 48(4):441–6. doi: 10.1016/j.ejca.2011.11.036
15. McCague C, Ramlee S, Reinius M, Selby I, Hulse D, Piyatissa P, et al. Introduction to radiomics for a clinical audience. Clin Radiol (2023) 78(2):83–98. doi: 10.1016/j.crad.2022.08.149
16. Li S, Zhou B. A review of radiomics and genomics applications in cancers: the way towards precision medicine. Radiat Oncol (2022) 17(1):217. doi: 10.1186/s13014-022-02192-2
17. Chen X, Feng B, Chen Y, Liu K, Li K, Duan X, et al. A CT-based radiomics nomogram for prediction of lung adenocarcinomas and granulomatous lesions in patient with solitary sub-centimeter solid nodules. Cancer Imag (2020) 20(1):45. doi: 10.1186/s40644-020-00320-3
18. Wu YJ, Liu YC, Liao CY, Tang EK, Wu FZ. A comparative study to evaluate CT-based semantic and radiomic features in preoperative diagnosis of invasive pulmonary adenocarcinomas manifesting as subsolid nodules. Sci Rep (2021) 11(1):66. doi: 10.1038/s41598-020-79690-4
19. Chen W, Li M, Mao D, Ge X, Wang J, Tan M, et al. Radiomics signature on CECT as a predictive factor for invasiveness of lung adenocarcinoma manifesting as subcentimeter ground glass nodules. Sci Rep (2021) 11(1):3633. doi: 10.1038/s41598-021-83167-3
20. Meng X, Shu J, Xia Y, Yang R. A CT-based radiomics approach for the differential diagnosis of sarcomatoid and clear cell renal cell carcinoma. BioMed Res Int (2020) 2020:7103647. doi: 10.1155/2020/7103647
21. Yang G, Nie P, Zhao L, Guo J, Xue W, Yan L, et al. 2D and 3D texture analysis to predict lymphovascular invasion in lung adenocarcinoma. Eur J Radiol (2020) 129:109111. doi: 10.1016/j.ejrad.2020.109111
22. Parkar AP, Kandiah P. Differential diagnosis of cavitary lung lesions. J Belgian Soc Radiol (2016) 100:100. doi: 10.5334/jbr-btr.1202
23. Snoeckx A, Reyntiens P, Desbuquoit D, Spinhoven MJ, Van Schil PE, Van Meerbeeck JP, et al. Evaluation of the solitary pulmonary nodule: size matters, but do not ignore the power of morphology. Insights Imag (2018) 9(1):73–86. doi: 10.1007/s13244-017-0581-2
24. Lin CH, Li TC, Tsai PP, Lin WC. The relationships of the pulmonary arteries to lung lesions aid in differential diagnosis using computed tomography. Biomedicine (2015) 5:11. doi: 10.7603/s40681-015-0011-z
25. WHO Classification of Tumours Editorial Board. Thoracic tumours. In: WHO classification of tumours series, 5th ed, vol. 5. . Lyon, France: International Agency for Research on Cancer (2021).
26. Zwanenburg A, Vallières M, Abdalah MA, Alerts HJ, Andearczyk V, Apte A, et al. The image biomarker standardization initiative: Standardized quantitative radiomics for high-throughput image-based phenotyping. Radiology (2020) 295(2):328–38. doi: 10.1148/radiol.2020191145
27. Gao F, Sun Y, Zhang G, Zheng X, Li M, Hua Y. CT characterization of different pathological types of subcentimeter pulmonary ground-glass nodular lesions. Br J Radiol (2019) 92(1094):20180204. doi: 10.1259/bjr.20180204
28. Li X, Zhang W, Yu Y, Zhang G, Zhou L, Wu Z, et al. CT features and quantitative analysis of subsolid nodule lung adenocarcinoma for pathological classification prediction. BMC Cancer (2020) 20(1):60. doi: 10.1186/s12885-020-6556-6
29. Zhuo Y, Feng M, Yang S, Zhou L, Ge D, Lu S, et al. Radiomics nomograms of tumors and peritumoral regions for the preoperative prediction of spread through air spaces in lung adenocarcinoma. Transl Oncol (2020) 13(10):100820. doi: 10.1016/j.tranon.2020.100820
30. Liu Z, Meng X, Zhang H, Li Z, Liu J, Sun K, et al. Predicting distant metastasis and chemotherapy benefit in locally advanced rectal cancer. Nat Commun (2020) 11(1):4308. doi: 10.1038/s41467-020-18162-9
31. Li P, Song G, Wu R, Li H, Zhang R, Zuo P, et al. Multiparametric MRI-based machine learning models for preoperatively predicting rectal adenoma with canceration. MAGMA (2021) 34(5):707–16. doi: 10.1007/s10334-021-00915-2
32. Yang J, Wu Q, Xu L, Wang Z, Su K, Liu R, et al. Integrating tumor and nodal radiomics to predict lymph node metastasis in gastric cancer. Radiother Oncol (2020) 150:89–96. doi: 10.1016/j.radonc.2020.06.004
33. Rossi G, Barabino E, Fedeli A, Ficarra G, Coco S, Russo A, et al. Radiomic detection of EGFR mutations in NSCLC. Cancer Res (2021) 81(3):724–31. doi: 10.1158/0008-5472.CAN-20-0999
34. Yip SSF, Liu Y, Parmar C, Li Q, Liu S, Qu F, et al. Associations between radiologist-defined semantic and automatically computed radiomic features in non-small cell lung cancer. Sci Rep (2017) 7(1):3519. doi: 10.1038/s41598-017-02425-5
35. Skogen K, Ganeshan B, Good C, Critchley G, Miles K. Measurements of heterogeneity in gliomas on computed tomography relationship to tumour grade. J Neurooncol (2013) 111(2):213–9. doi: 10.1007/s11060-012-1010-5
36. Liu Y, Liu S, Qu F, Li Q, Cheng R, Ye Z. Tumor heterogeneity assessed by texture analysis on contrast-enhanced CT in lung adenocarcinoma: association with pathologic grade. Oncotarget (2017) 8(32):53664–74. doi: 10.18632/oncotarget.15399
37. Hu X, Gong J, Zhou W, Li H, Wang S, Wei M, et al. Computer-aided diagnosis of ground glass pulmonary nodule by fusing deep learning and radiomics features. Phys Med Biol (2021) 66(6):065015. doi: 10.1088/1361-6560/abe735
Keywords: radiomics, nomogram, CT, lung cancer, subcentimeter solid nodules
Citation: Chen C, Geng Q, Song G, Zhang Q, Wang Y, Sun D, Zeng Q, Dai Z and Wang G (2023) A comprehensive nomogram combining CT-based radiomics with clinical features for differentiation of benign and malignant lung subcentimeter solid nodules. Front. Oncol. 13:1066360. doi: 10.3389/fonc.2023.1066360
Received: 10 October 2022; Accepted: 13 February 2023;
Published: 07 March 2023.
Edited by:
Diego Signorelli, Niguarda Ca ‘Granda Hospital, ItalyReviewed by:
Cheng Dong, The Affiliated Hospital of Qingdao University, ChinaCopyright © 2023 Chen, Geng, Song, Zhang, Wang, Sun, Zeng, Dai and Wang. This is an open-access article distributed under the terms of the Creative Commons Attribution License (CC BY). The use, distribution or reproduction in other forums is permitted, provided the original author(s) and the copyright owner(s) are credited and that the original publication in this journal is cited, in accordance with accepted academic practice. No use, distribution or reproduction is permitted which does not comply with these terms.
*Correspondence: Gongchao Wang, d2FuZ2dvbmdjaGFvQDEyNi5jb20=
†These authors have contributed equally to this work and share first authorship
Disclaimer: All claims expressed in this article are solely those of the authors and do not necessarily represent those of their affiliated organizations, or those of the publisher, the editors and the reviewers. Any product that may be evaluated in this article or claim that may be made by its manufacturer is not guaranteed or endorsed by the publisher.
Research integrity at Frontiers
Learn more about the work of our research integrity team to safeguard the quality of each article we publish.