 Chenbei Li
 Chengyao Feng
 Ruiling Xu1,2
 Buchan Jiang
 Lan Li
 Yu He
Yu He Chao Tu
 Zhihong Li
95% of researchers rate our articles as excellent or good
Learn more about the work of our research integrity team to safeguard the quality of each article we publish.
Find out more
REVIEW article
Front. Oncol. , 06 February 2023
Sec. Pediatric Oncology
Volume 13 - 2023 | https://doi.org/10.3389/fonc.2023.1044177
Although the survival rate of pediatric cancer has significantly improved, it is still an important cause of death among children. New technologies have been developed to improve the diagnosis, treatment, and prognosis of pediatric cancers. Raman spectroscopy (RS) is a non-destructive analytical technique that uses different frequencies of scattering light to characterize biological specimens. It can provide information on biological components, activities, and molecular structures. This review summarizes studies on the potential of RS in pediatric cancers. Currently, studies on the application of RS in pediatric cancers mainly focus on early diagnosis, prognosis prediction, and treatment improvement. The results of these studies showed high accuracy and specificity. In addition, the combination of RS and deep learning is discussed as a future application of RS in pediatric cancer. Studies applying RS in pediatric cancer illustrated good prospects. This review collected and analyzed the potential clinical applications of RS in pediatric cancers.
Pediatric cancer is uncommon but represents a significant cause of disease-related death among children (1–3). Pediatric cancers represented only 2% of all reported cancer cases but accounted for 10% of child deaths (4, 5). Leukemia (30–40%), central nervous system (CNS) tumors (20%), lymphoma, and osteosarcoma (5%) are the most common pediatric cancers in children aged 0–19 years (6, 7). Two peak incidences of pediatric cancers occur before the age of two and during adolescence (8). Leukemia frequently occurs throughout childhood, while CNS tumors account for most diagnoses in children under two years. Meanwhile, the incidence of OS and lymphoma increases steeply after nine years (5, 9). In contrast to adult cancers, pediatric cancers have more significant influence on children in the long term (4). Pediatric cancer patients may die from cancers or their complications (10). Technologies focusing on pediatric cancer have significantly improved in the last few decades, and survival has increased by over 60% (11, 12). However, compared to adult cancer, there are approved treatments for pediatric cancer. Once the patients grow up, side effects and complications become more severe (13). Thus, new perspectives on pediatric cancer are urgently needed to address these challenges doctors face.
Raman spectroscopy (RS) is an optical spectroscopic technique using different frequencies of scattering light to characterize biological specimens (14, 15). It probes the vibrational modes related to chemical bonds in a sample and obtains the “Raman Spectrum”, which is a unique spectral fingerprint of the sample (16, 17). Different samples possess their chemical compositions, which give RS the ability to reveal changes in the components and structure of target samples in a non-destructive manner (18). It provides deep insights into biological activities, offering a new angle to analyze diseases and assisting in diagnosis, treatment, and prognostic evaluation (15, 19). In fact, vibrational spectroscopy has been quite active over the past two decades. It is considered to be used for both in vivo and ex vivo disease diagnosis (20). Moreover, it is applied in multitudinous areas, such as characterization of tumor margins in surgery (21, 22), disease detection using in vivo-endoscopic probe (23), and drug screening (24, 25). Therefore, RS is highly valued for clinical application in pediatric cancers and provides critical biological information for doctors (26). This review summarizes articles on RS and pediatric cancers within the last two decades and explores the clinical role of RS in pediatric cancers.
The Raman effect was first discovered by the physicist C.V. Raman and his team in 1928 (27, 28). They observed the absorption and scattering of photons passing through a medium. If a photon is absorbed by a molecule, the molecule will gain its energy. However, if a photon is scattered and its energy remains the same, it is called “elastic scattering”; otherwise, it is called “inelastic scattering”. In addition, the inelastically scattered photons with higher energy are called anti-Stokes Raman scattering, while those with lower energy are Stokes Raman scattering (29) (Figure 1).
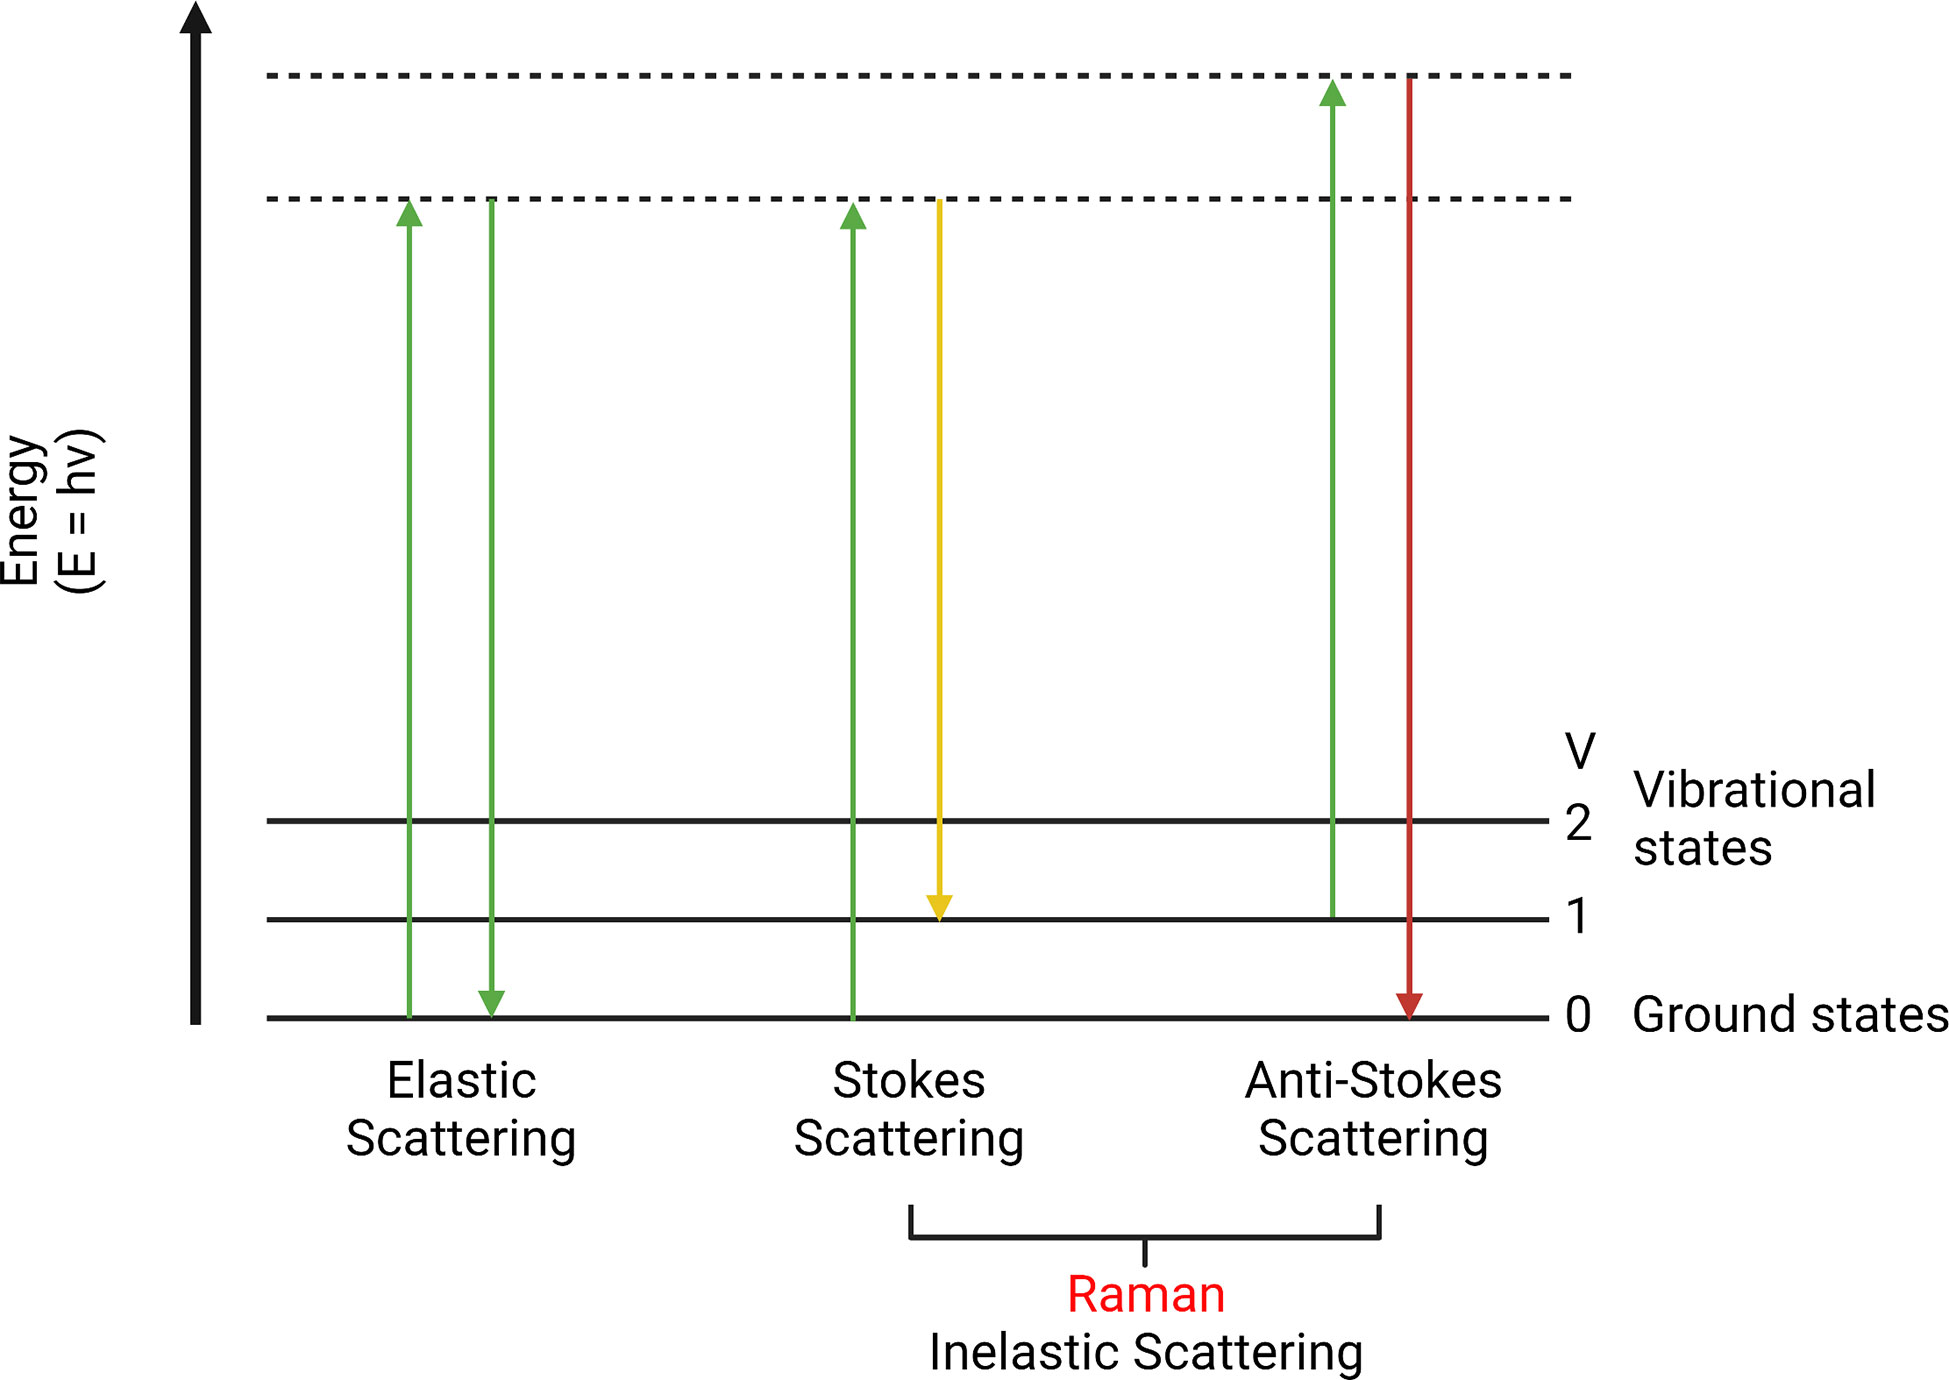
Figure 1 Elastic scattering, Stokes, and anti-Stokes Raman scattering. This is a scattering energy level diagram (molecular energy states). Stokes scattering leads to an energy shift from incident photons to chemical bonds. Anti-Stokes scattering moves vibrational excited chemical bonds to the incident light.
This little energy difference is known as the Raman effect (or shift). It is a rare phenomenon that only happens in approximately one in 107 of the incident photons (30, 31). This energy difference can be used to detect different chemical bonds to identify molecular structures (32, 33). Since the photon energy is inversely proportional to the wavelength, Raman shift can perform a color shift named the Raman spectrum. It is a plot of the intensity of the scattered light under different wavenumber (cm-1) (34). This plot is associated with a particular vibrational mode of the molecule and is directly proportional to its concentration. It is a summary of all Raman active molecules in a sample, such as proteins, lipids, etc. The range below 2000 cm-1 is usually called the fingerprint region, which is composed of unique Raman signals biological molecules (35, 36). By analyzing the Raman spectrum, it is possible to detect specific molecules and distinguish pathological tissues (37, 38). Moreover, biological activities inside normal or diseased tissues can also be revealed (39, 40).
RS has advantages in clinical application, although its function is restricted by some limitations. The key pros and cons of RS are listed below (Figure 2). The most common advantage is its non-destructive and label-free properties (41, 42). Since the influence of water in RS is less than in other spectroscopies, various samples can be investigated, including biological fluids, cell cultures, tissue sections, and organs (43). After the acquisition of samples, cellular biological activities and chemical components can be detected, which are suitable for chemical analysis or cell classification (44). In addition, RS can be applied to in vivo detection to monitor disease stage or the response of cells under different situations, including drugs and pH (45).
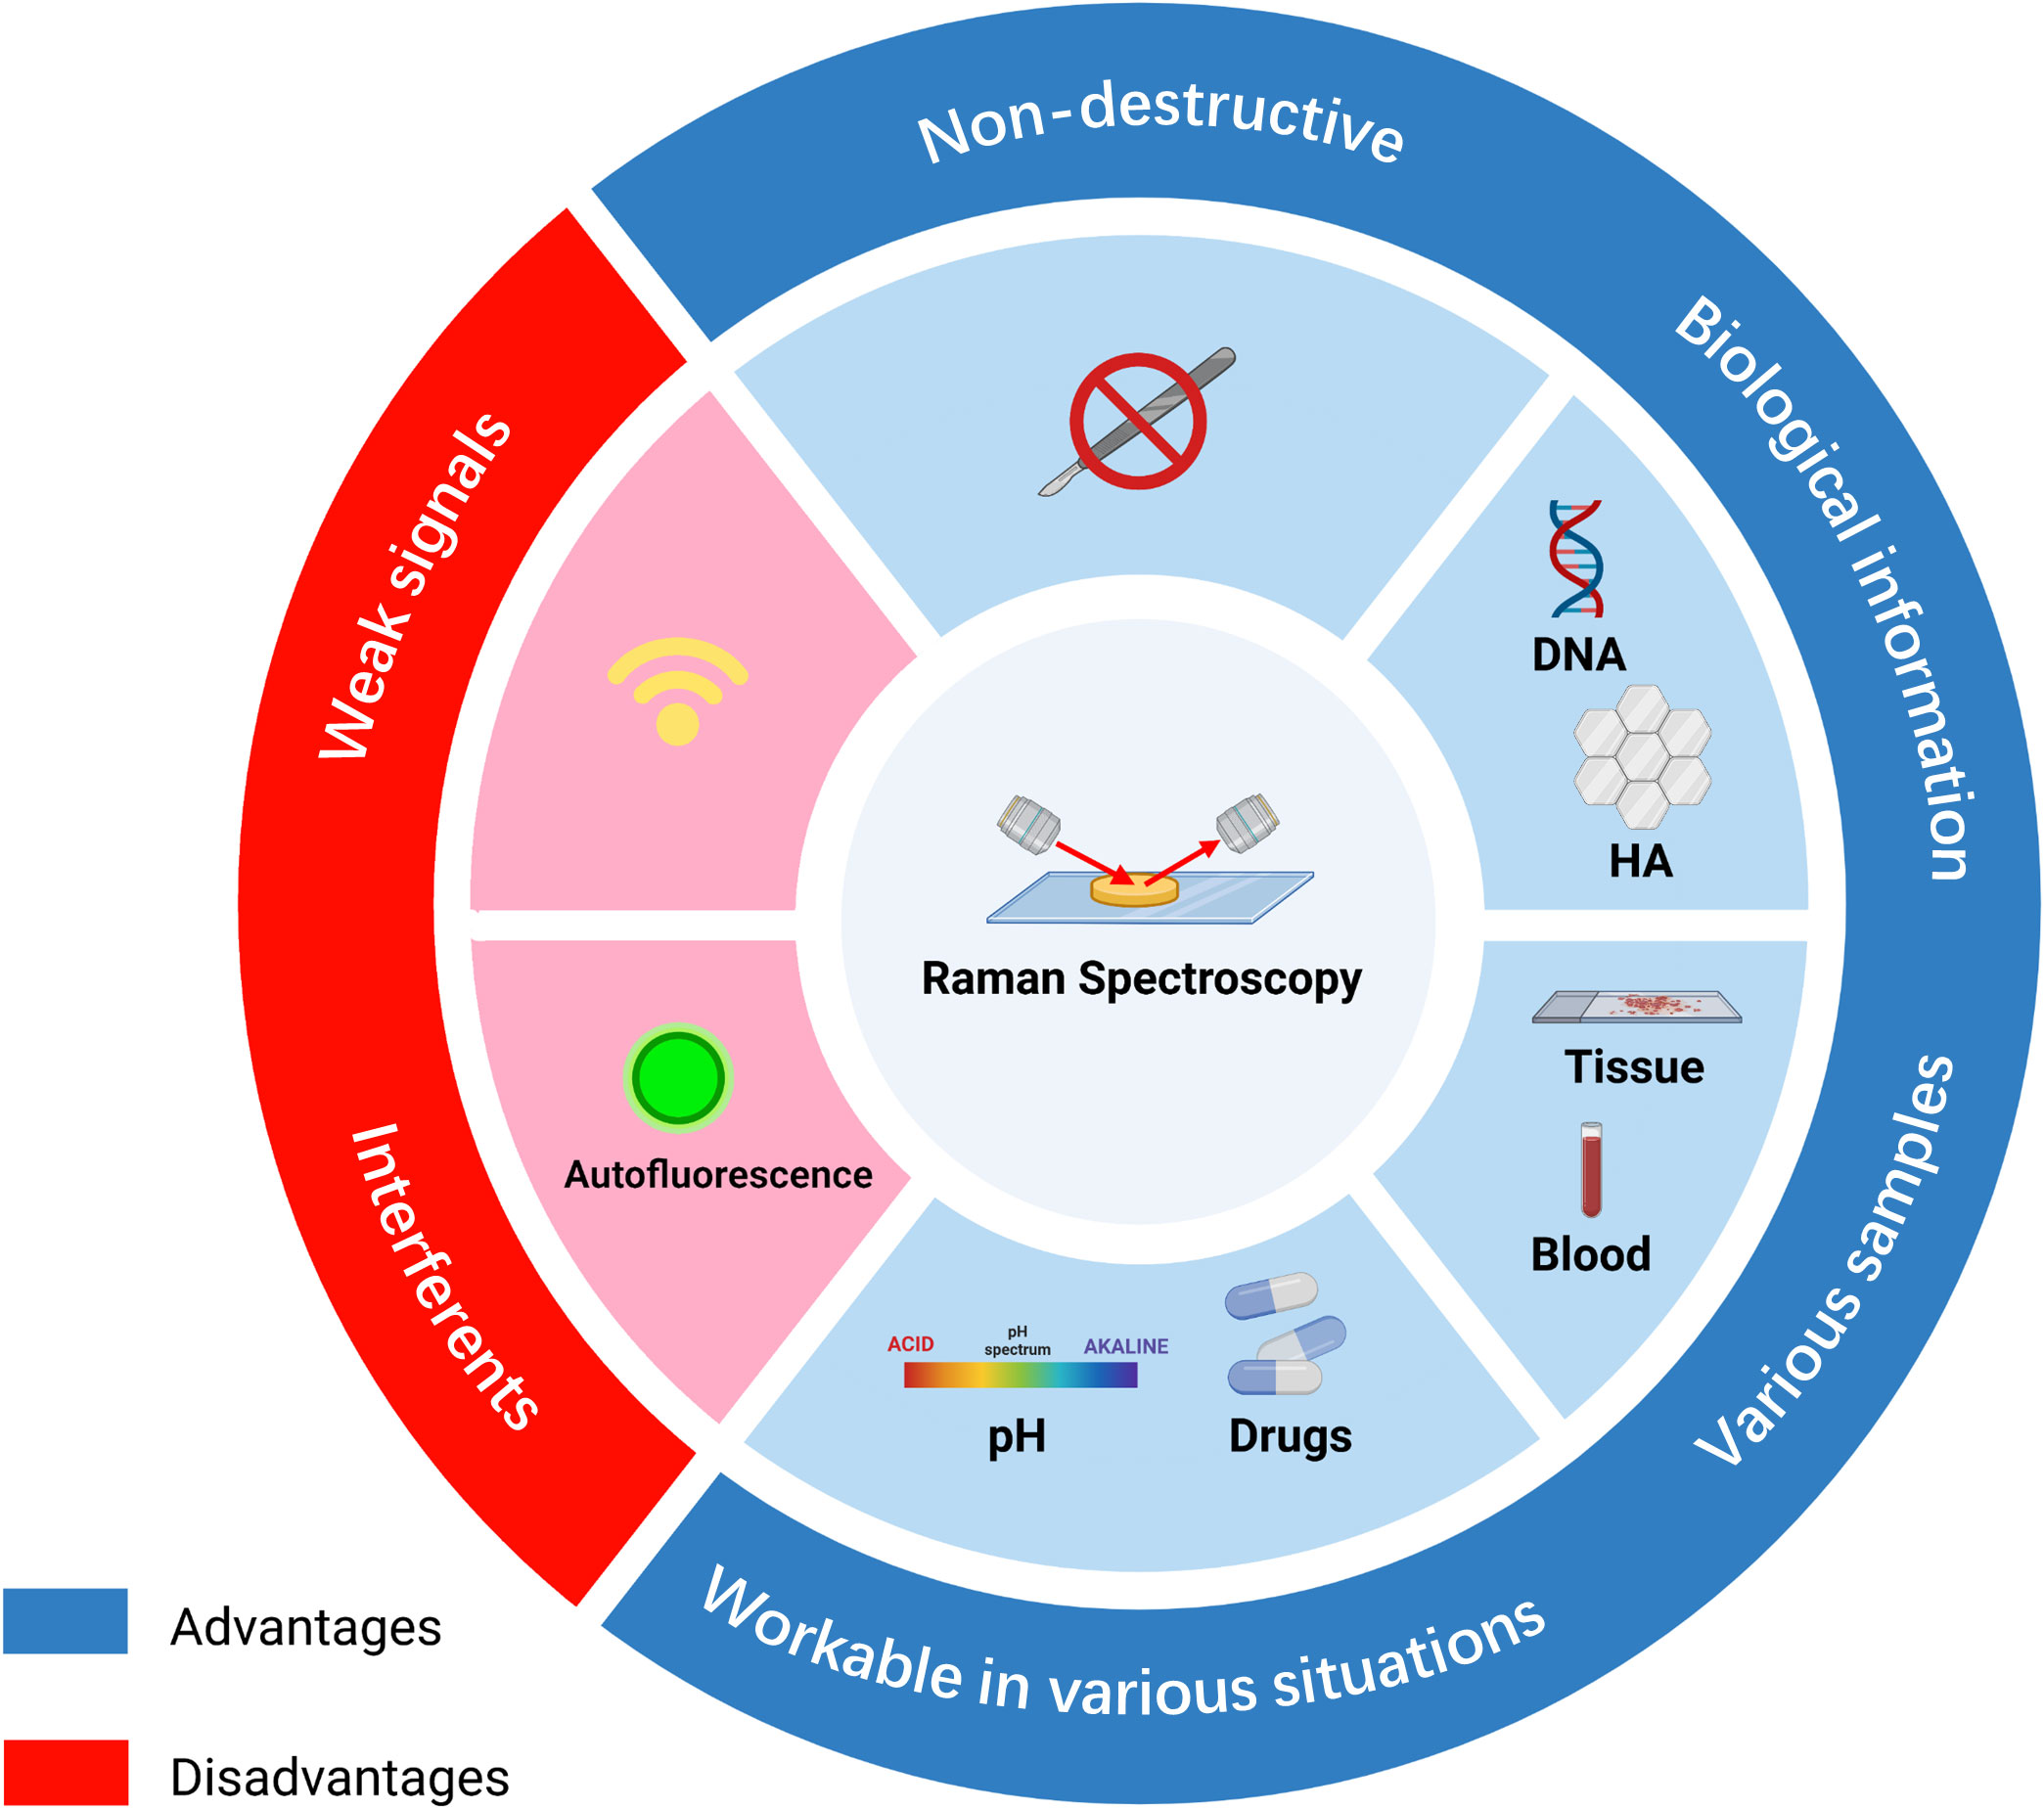
Figure 2 Summary of the advantages and disadvantages of Raman spectroscopy in diagnosis. RS possesses non-destructive properties and is workable under various environments, such as different pH or drug conditions. RS can be used to analyze tissue, blood, or supernatant samples and provides biomolecular information on DNA or biomarkers. However, signals of RS are weak and can be affected by other interferents, such as fluorescence. HA, hydroxyapatite.
Nevertheless, there are some shortcomings. Due to the low probability of occurrence of Raman scattering, the signals of RS are weak, limiting the sensitivity of RS (46). In addition, weak Raman signals lead to a long acquisition time, and the interference of autofluorescence may make the signal difficult to discern (47) (Schie et al.) RS results mostly depend on the identification of spectral peaks. The accuracy of the identification has a significant influence on the final results. Most researchers identified RS data based on previously published articles. Thus, without a database containing most of the required peaks in the spectral range, peak identification can be time-consuming (36). Unlike clinical biochemical examinations, RS requires both normal and abnormal tissue for comparison, and data on RS often require additional analysis (48).
Infrared spectroscopy (IRS) and fluorescence spectroscopy (FS) are powerful techniques in the clinical medical field. They have special characteristics compared to RS (Table 1).
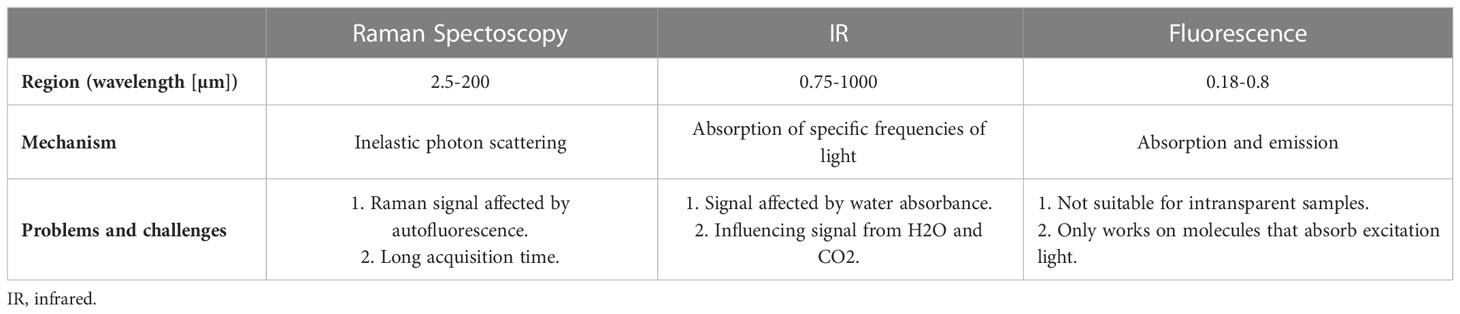
Table 1 Characteristics of different spectroscopy.
IRS and RS belong to a molecular vibration area. RS is based on photon scattering, while IRS measures regions where the discrete energy of molecules is related to vibration. The absorption of photons in the electromagnetic spectrum was monitored and can be used to discriminate different bonds in samples (49–51). In the IR region, water absorbance is so strong that it could affect the collection and analysis of IR spectra. However, Raman regions possess weak water signals, which are more accurate for in vivo analysis.
FS has been applied in various diseases, such as breast cancer (52) and cervical cancer (53, 54). It measures the concentration of a substance in a solution based on fluorescent properties, which is directly proportional to the intensity of emitted light (55, 56).
Various types of enhanced Raman techniques were developed to intensify the sensitivity of detection and speed up imaging production (57, 58) (Figure 3).
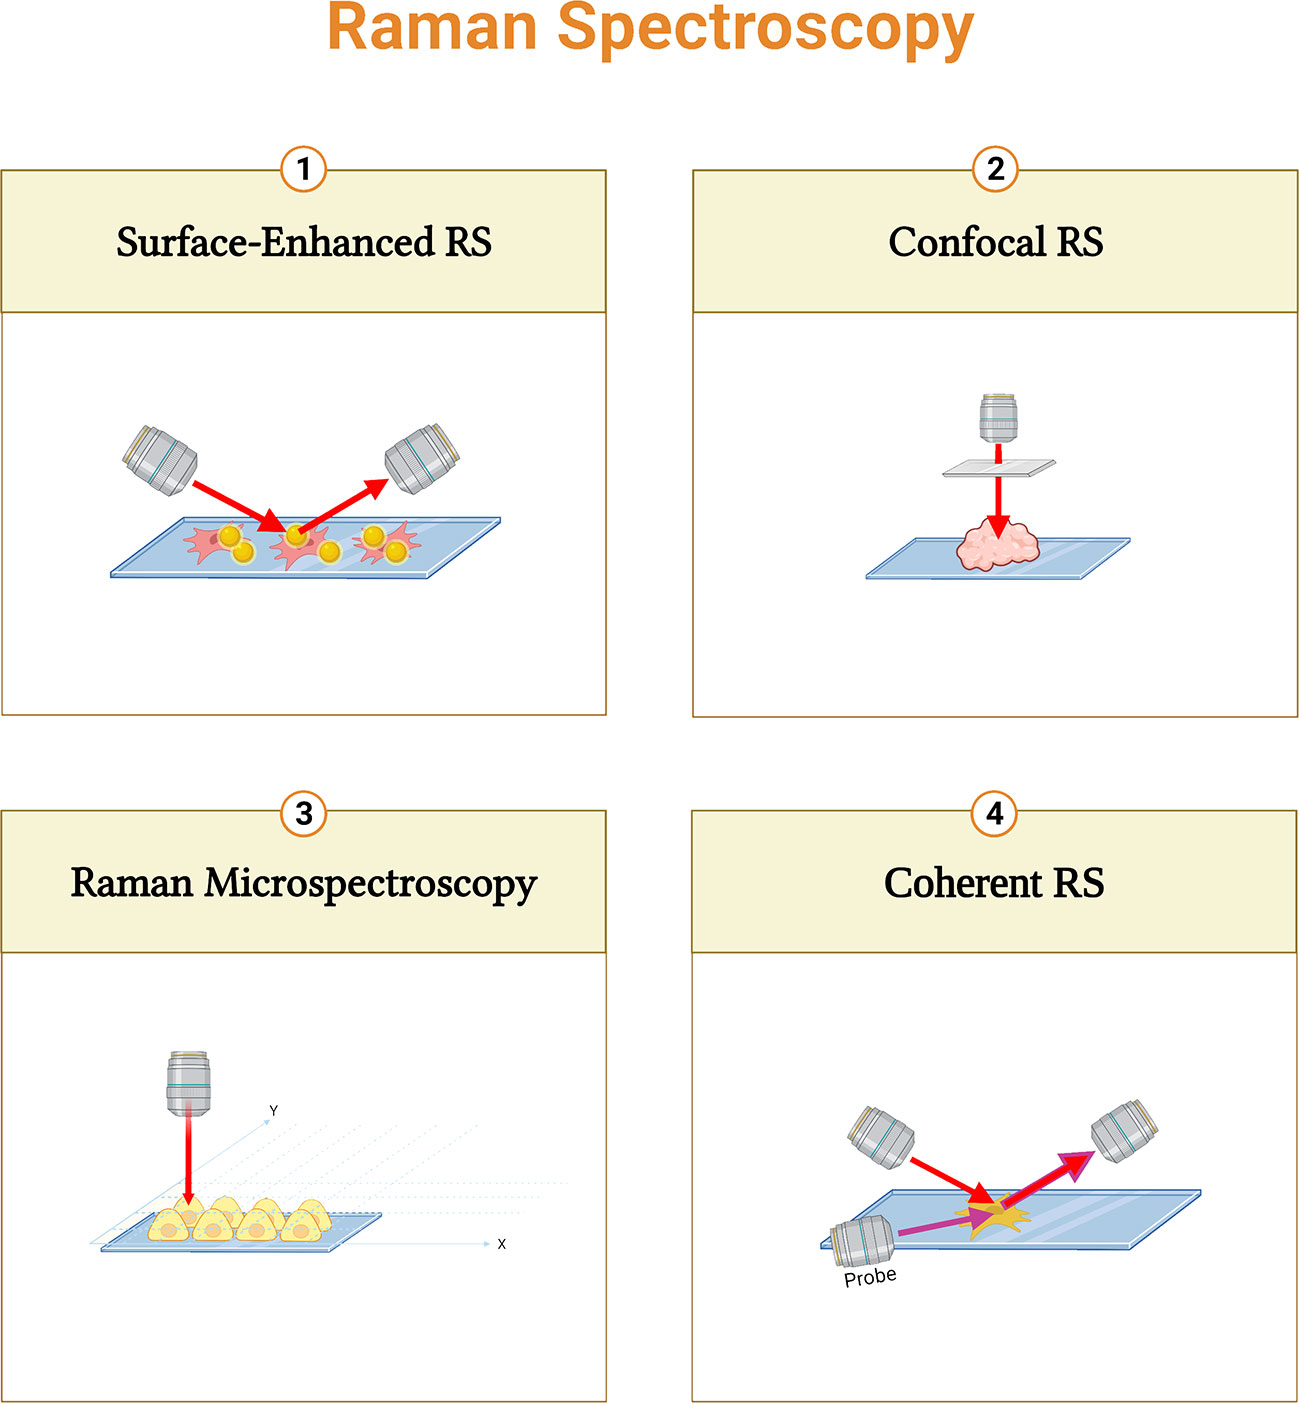
Figure 3 Summary of different Raman spectroscopy techniques. Surface-enhanced RS (SERS) performs enhanced signals with metal nanoparticles; Confocal RS is a combination of confocal microscope and RS; Raman micro-spectroscopy combines RS with microscope; and Coherent RS is RS with two light sources.
Raman micro-spectroscopy is a non-destructive technique that combines RS with an optical microscope. It provides correlations between biochemical and morphological properties (59, 60). Furthermore, the combination of a confocal microscope and RS can improve the depth of information. (61, 62). In Coherent RS, vibrational modes are generated by two light sources. It focuses on specific molecular bands that shorten the acquisition time (63). Moreover, surface-enhanced RS (SERS) performs enhanced signals with metal nanoparticles to increase the sensitivity (64, 65).
Suitable multivariate analysis is crucial to make a diagnosis more accurate. Data of Raman spectra are composed of multiple bands and peaks that represent different molecules. In addition, the dataset of Raman spectra contains intensity and wavenumber, and it is correlated with diseases and cell types (66). Therefore, multivariate analysis is necessary to simplify the data using statistical algorithms such as principle component analysis (PCA). PCA reduces the dimension of data, and most of the variation is unchanged (67, 68). This reduction is completed by identifying the principal components. It can simplify the data by presenting a few samples instead of a large number of redundant data. (69). Combining PCA with other statistical methods can be used for discriminating between diseases, cell states, and cell types (70). In general, multivariate analysis can be divided into two classes: supervised and unsupervised, based on targets and samples (71). Meanwhile, hierarchical clustering analysis (HCA) (72), k-means clustering (KMC) (73, 74), and linear discriminant analysis (LDA) (75, 76) are supervised methods. Their purpose is to explore, and no previous information about the samples is needed. On the other hand, unsupervised methods focus on pattern recognition based on existing labels like disease diagnosis or cell type classification. Unsupervised methods include algorithms like PCA, multiple linear regression (77, 78), and partial least squares (PLS) (79).
This review is a collection of articles from the PubMed database from 2012 to 2022 (Table 2). The search terms were Raman spectroscopy, osteosarcoma, acute lymphoblastic leukemia, acute myeloid leukemia, lymphoma, and glioma.
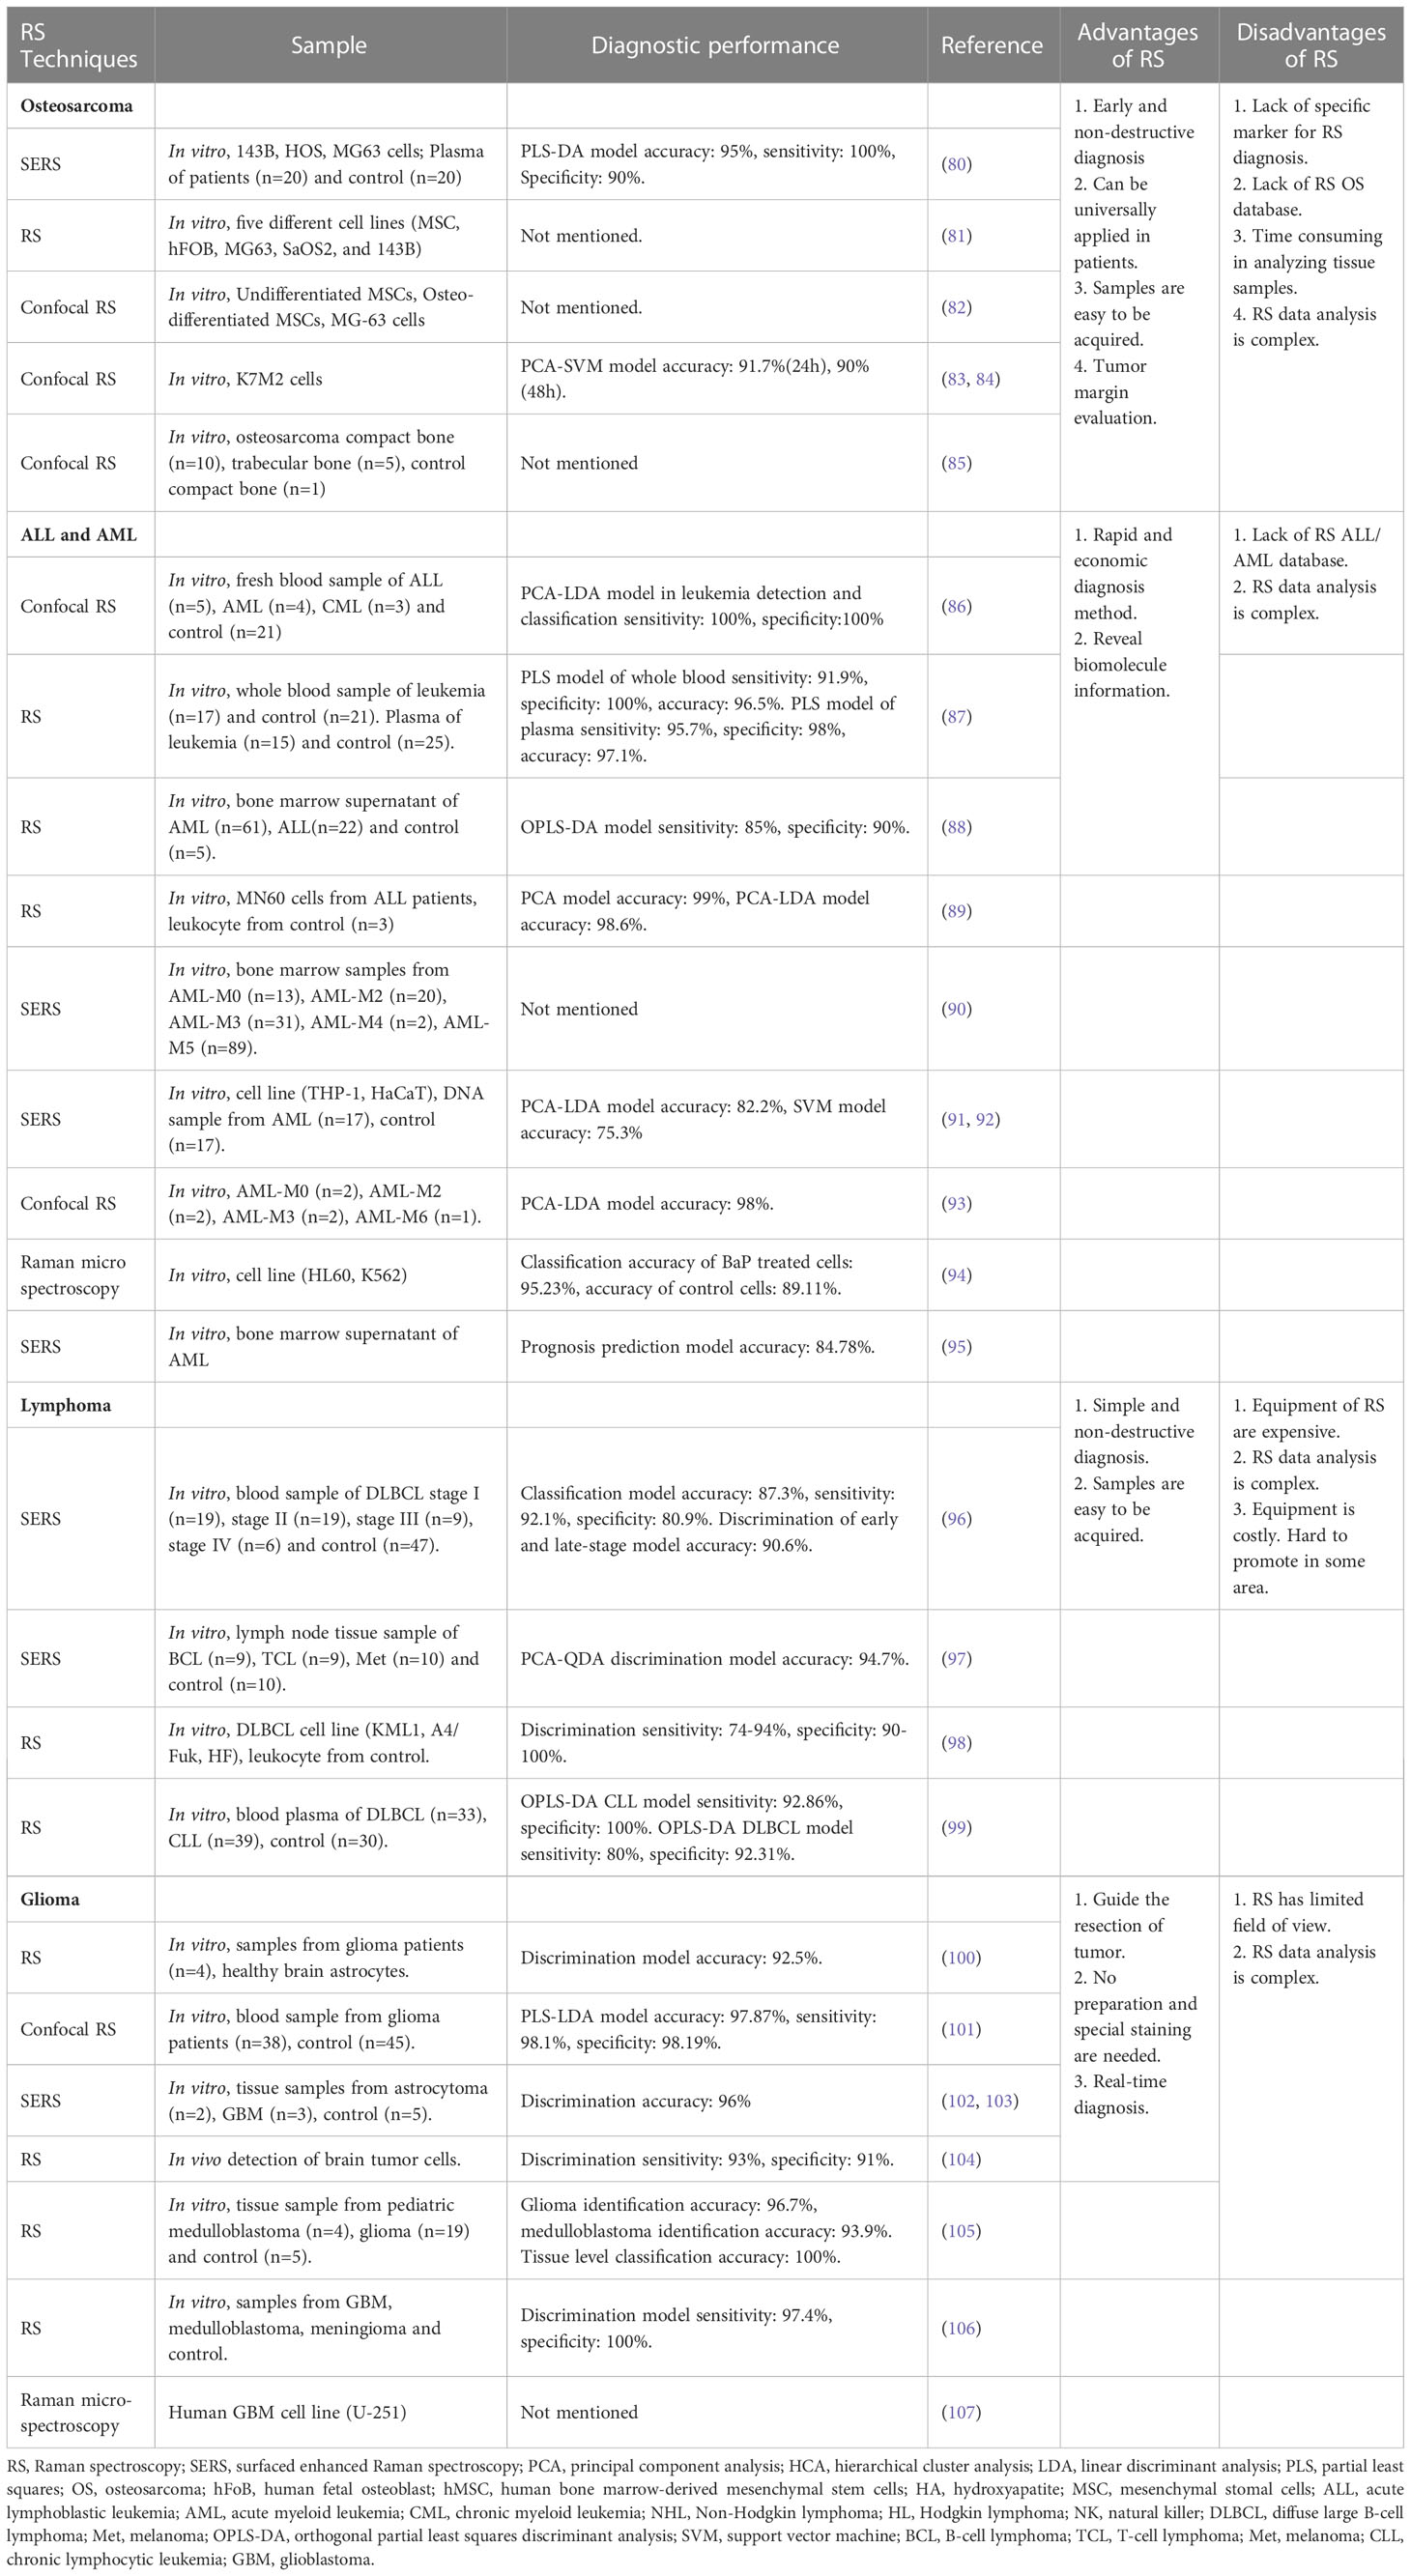
Table 2 Summary of RS studies on pediatric cancers.
Osteosarcoma is the most common malignant bone tumor in children (108, 109), accounting for 20% of all bone malignancies (110, 111) and 2.5% of pediatric malignancies (112). According to Surveillance, Epidemiology, and End Results (SEER) data from 1973 to 2004, the incidence of osteosarcoma has two peaks. The first peak occurs between 10 and 14 years of age, while the second peak is observed after 60 (113, 114). OS in adolescence commonly develops in the metaphysis of long bones, such as the distal femur and proximal tibia (115–117). With the improvement of technology, the survival rate of OS has significantly increased from less than 20% to around 70% (118). The number of studies exploring the clinical application of Raman spectroscopy in OS within the last few decades continues to increase. The applications of RS in OS are summarized in Figure 4.
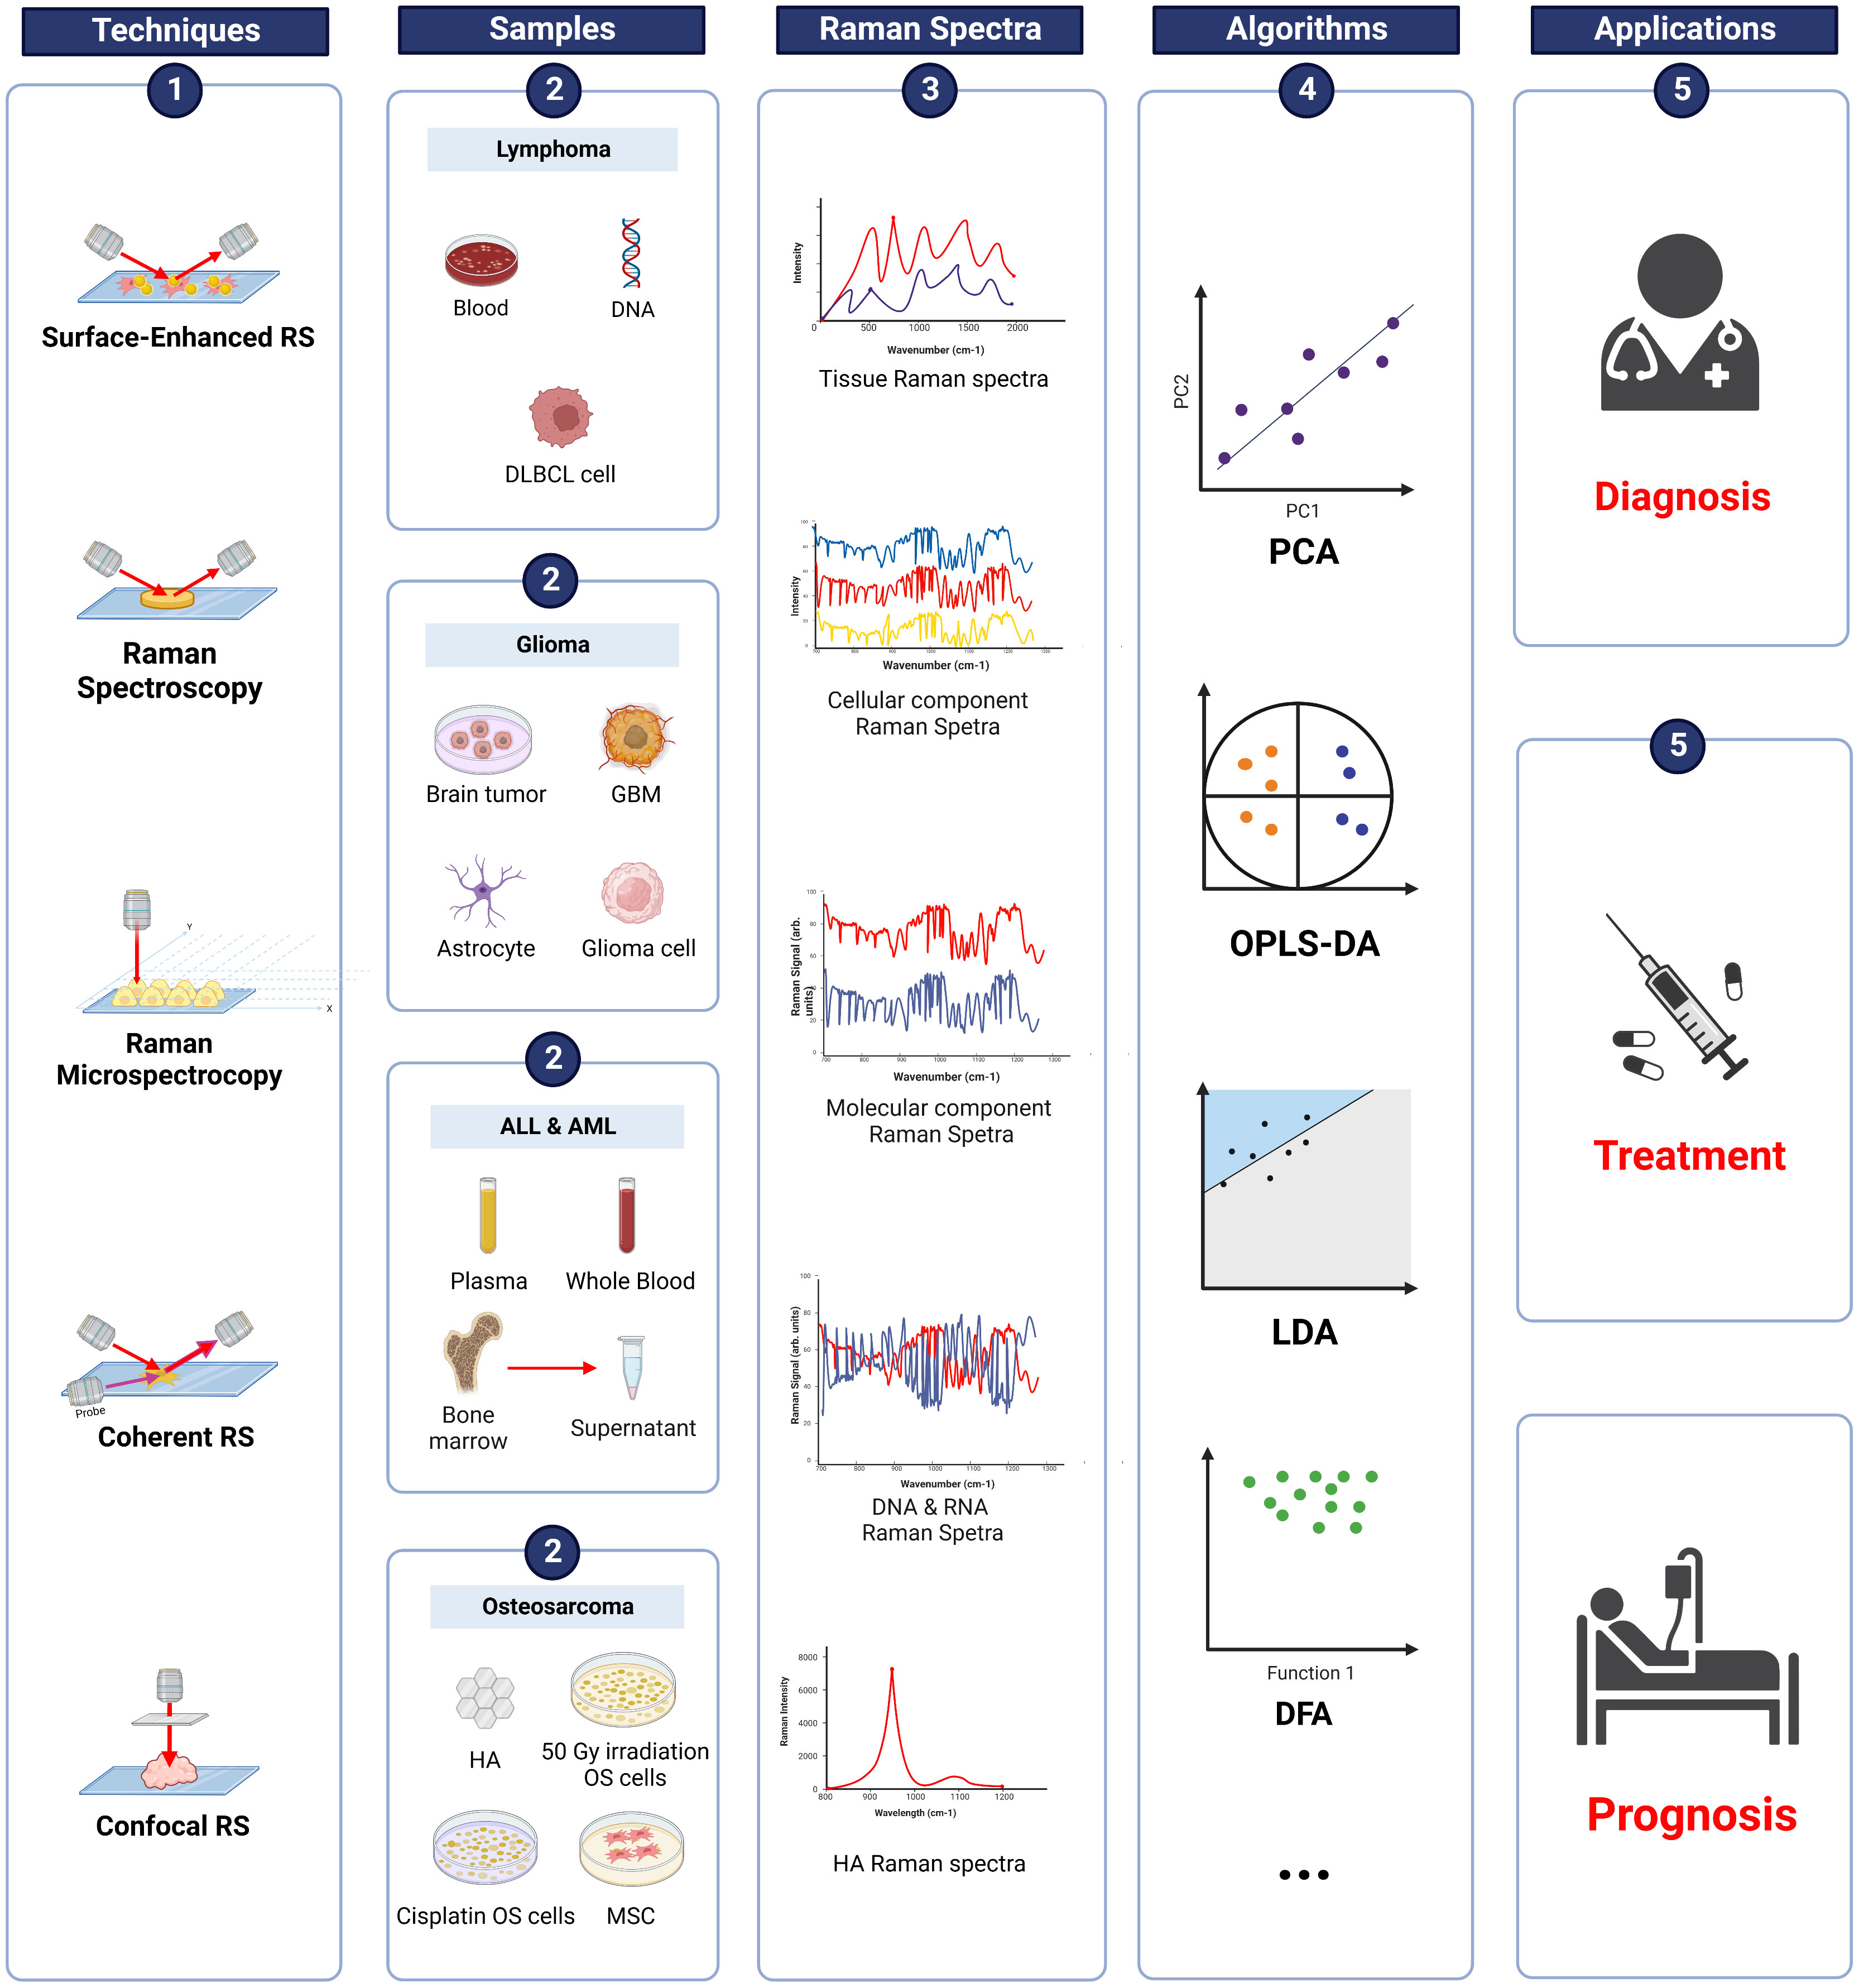
Figure 4 Raman spectroscopy techniques in pediatric cancers. Summary of information on RS in osteosarcoma, ALL, AML, lymphoma, and glioma. RS techniques were applied to various samples (blood, tissue, supernatant etc.) and produced Raman spectra. Data were analyzed using different algorithms, such as PCA, OPLS-DA, and LDA. The results demonstrated the potential of applying RS in the diagnosis, treatment, and prognosis of pediatric cancers. DLBCL, diffuse large B-cell lymphoma; GBM, glioblastoma; ALL, acute lymphoblastic leukemia; AML, acute myeloid leukemia; HA, hydroxyapatite; OS, osteosarcoma; MSC, mesenchymal stem cells; PCA, principal component analysis; OPLS-DA, orthogonal partial least squares discriminant analysis; LDA, linear discriminant analysis; DFA, discrimination function analysis.
Current pediatric osteosarcoma diagnosis, prognosis and treatment decisions are composed of clinical manifestation, CT, MRI scan, biopsy, and laboratory results (119). CT and MRI are considered the most common and convenient diagnostic techniques (120). A study indicated that the accuracy of CT and MRI in detecting bone lesions of pediatric osteosarcoma was 67% and 86% (121). Accurate clinical diagnosis of osteosarcoma requires biopsies. However, it takes time and requires complex operations to get precise the tumor tissue. To improve the efficiency of diagnosis, Han’s team isolated exosomes from plasma and profiled multiple biomarkers for the diagnosis of osteosarcoma (80). An exosome is a small vesicle that carries nucleic acids, proteins, and lipids (122, 123). It transmits information and plays an important role in tumorigenesis (124, 125). In Han’s study, Raman bands at 1000, 1075, and 1375 cm−1 (CD63, vimentin (VIM), and epithelial cell adhesion molecule (EpCAM)) in exosomes of osteosarcoma patients were significantly higher. The area under the receiver operating characteristic curve was 0.971, and the sensitivity, specificity, and accuracy of the model in identifying osteosarcoma was 100%, 90%, and 95% (80).
Osteosarcoma results from a disorder in the differentiation procedures of mesenchymal stem cells (MSC) (126). Minerals like hydroxyapatite (HA), a mineral form of calcium phosphate, are highly expressed in osteoblast differentiation of MSCs and can be measured using RS (127). Malignant cancer cells are immature and produce less HA (128). Thus, it is possible to use HA as a potential biomarker for grading differentiation. Chiang et al. developed an RS-based measurement to grade in vitro osteosarcoma cells based on HA level. A significant difference in the peak intensity of symmetric stretching of phosphate groups (around 960 cm-1), which represents the expression of HA in cells, was observed in Raman spectra of living human fetal osteoblast (hFoB), human bone marrow-derived mesenchymal stem cells (hMSC), low-grade (MG-63), and high-grade (SaOS2, 143B) osteosarcoma cells. Results showed that HA was highly expressed in MG63 cells but not in hMSC and SaOS2 and 143B cells (81). Based on a previous study, D’Acunto et al. also employed RS to detect HA in MG-63 cells and MSCs. The identification was based on HA Raman peaks (around 960 cm-1) with the support of multivariate analysis, and the results suggested that HA Raman peaks are greater in MG-63 cells (82). Moreover, the expression of matrix metalloproteinases (MMP2, MMP9) was rich in high-grade but negligible in low-grade osteosarcoma. MMP is an angiogenesis factor closely related to the invasion and metastasis of tumors (129). The upregulation of MMP is correlated with poor prognosis in osteosarcoma patients (130). Generally, MMP was measured using RT-PCR, and the expression level was positively correlated with HA levels. This may highlight the inverse correlation between the HA level and the prognosis of osteosarcoma. Current evaluation of the maturation of osteogenic differentiation is based on histochemical and molecular biological methods, such as Alizarin red staining, western blot, and RT-PCR (131, 132). However, these assays are time-consuming and cannot be applied on live cells. The detection of HA production using RS could be a rapid method for grading OS. During surgery, accurate resection of tumor is extremely crucial for patients’ prognosis. Yet, precise information of margin offered by biopsy is time-consuming. In addition, CT and MRI are unable to distinguish osteosarcoma cells from normal cells. In this case, RS is suitable for rapid detection of osteosarcoma cells in the resection margins.
A combination of chemotherapy and surgery is the conventional therapeutic approach for pediatric osteosarcoma (133). Cisplatin is a drug for osteosarcoma chemotherapy and the first platinum-based anti-tumor drug widely used to treat cancers (134). Drug resistance by osteosarcoma is a problem that affects patients’ prognosis (135). In this regard, a better understanding of cellular drug interactions is needed for therapeutic improvement. Wang et al. selected RS as an analytical technique for real-time extraction of biochemical information from living cells, and spectra of in vitro K7M2 osteosarcoma cells treated with 20 μm and 40 μm were measured. The results suggested that the major biochemical changes induced by cisplatin in osteosarcoma cells are on protein and nucleic acid. Raman bands of nucleic acids (766, 1096, 1248, and 1323 cm−1) were decreased after treatment with cisplatin. Meanwhile, Raman bands of cisplatin-induced apoptosis (657, 1002, 1248, 1450, and 1660 cm−1) showed the most significant spectral features. The results indicate that cisplatin mainly targets the nucleus and affects the secondary structure of proteins (83, 84).
Extra Corporeal irradiation and Reimplantation Therapy (ECRT) is an established biological reconstruction technique of limb salvage surgery that mainly focuses on the treatment of malignant bone tumors (osteosarcoma, Ewing sarcoma etc.) and presents good clinical outcomes (136, 137). Specifically, the resected bone of patients will be reimplanted after high-dose irradiation (50 Gy to 300 Gy). To enrich the understanding of compositional and structural changes of bone under high-dose irradiation, Chauhan and team investigated Raman spectra of human bone of fifteen osteosarcoma and Ewing sarcoma patients on osteosarcoma treatment with 50 Gy single-dose irradiation. Thirteen patients were under 18 years, and three were between 18 and 26 years. Pre- and post-irradiation samples were scanned by confocal Raman spectroscope using a 785 nm excitation laser at 50% laser power. Thirty accumulations were taken at the scan area, and the average was analyzed. The evaluation of bone quality was conducted using calcium content and mineral to matrix ratio, and change in collagen was quantified with the deconvolution of Amide I peak. The findings showed that a 50 Gy dose of radiation resulted in the loss of approximately 50% of mineral components. Thus, irradiation might cause changes in bone composition, which have negative effects on bone quality (85). This provides valuable insights for clinicians in predicting the outcome of high-dose irradiation and designing irradiation doses for treatment.
Early diagnosis of osteosarcoma mainly depends on imageology results. RS possesses advantages in screening patients using their biochemical information, and it is able to help doctors to determine resection margins, which can largely reduce recurrence. In addition, RS is universally applicable in pediatric patients since samples for RS analysis are easy to acquire. Tumor biopsy is a destructive and painful process for patients, and RS is an ideal replacement for biopsy. However, RS has its limitations. Current RS can only be the reference for clinicians as the accuracy of RS needs to be improved. Mineralization level is a biomarker of bone-related diseases. Thus, the future direction of RS can focus on detecting mineralization levels and discovering specific markers for osteosarcoma.
Acute lymphoblastic leukemia (ALL) is a malignancy derived from B/T cell lineage lymphatic progenitor cells during the transformation of B/T lymphocytes (138, 139). It is the most common malignancy of childhood and mainly develops in children aged 2–5 years (140). The 5-year survival rate of children with ALL is as high as 80–90% (141, 142). However, the prognosis of ALL recurrence is still very poor (143). Thus, a more accurate classification of ALL is needed to reduce recurrence and improve the clinical outcome of ALL. In recent years, studies have aimed at discovering the application of RS in ALL in multiple areas. The applications of RS in ALL are briefly summarized in Figure 4.
The diagnosis of acute leukemia, including ALL and acute myeloid leukemia (AML), mainly depends on clinical symptoms and peripheral blood or bone marrow aspiration examinations. Further classification is based on cell immunology, flow cytometry, and molecular biology. However, these diagnostic methods are time-consuming and costly (87). Therefore, low-cost and rapid diagnostic methods are needed for early definition and classification of leukemia (144, 145).
Confocal Raman microscope with a laser of 830 nm and power of 17 mW was applied on fresh blood serum from different types of leukemia patients (Ages 8–50 years) and healthy volunteers to detect and identify leukemia. The msain differences between leukemia and control spectra were at 1,338 (tryptophan (Trp), α-helix, and phospholipids), 1,447 (lipids), 1,523 (β-carotene), 1,556 (Trp)), 1,587 (protein, tyrosine (Tyr)), 1,603 (Tyr, phenylalanine (Phe)), and 1,654 (proteins, amide I, α-helix, phospholipids) cm−1. Spectral information was analyzed using PCA and LDA for discrimination and identification of leukemia, and the prediction outcome using RS was validated using pathological diagnosis. The results showed the sensitivity and specificity of leukemia detection and discrimination were 100%. (86). Current diagnosis of leukemia is mainly based on cytomorphology and immunophenotyping (146, 147). The accuracy of phenotyping diagnosis is 94% (146), and the specificity and sensitivity of flow cytometry are 98% and 95.7% (147). Diagnosis based on RS is close or even better. RS was applied to whole blood samples to identify spectral differences based on chemical components like proteins, amino acids, and lipids. PLS discrimination model based on whole blood spectra showed a sensitivity of 91.9%, specificity of 100%, and accuracy of 96.5% in discriminating leukemia from control. The classification of leukemia subtypes using plasma had a sensitivity, specificity, and accuracy of 95.7%, 98%, and 97.1% (87).
According to a previous study, Raman peaks of Trp, Tyr, Phe, phospholipid, and β-carotene contribute to the diagnosis of leukemia. For further diagnosis, Liang’s team established a detection method for AML and ALL, using bone marrow supernatant from 22 patients with ALL (aged 3–55 years), 61 patients with AML (aged 1–69 years) and five healthy donors (aged 1–40 years). Raman peaks of 1437, 1443, and 1579 cm-1 (cholesterol, high-density lipoprotein (HDL), low-density lipoprotein (LDL), adenosine deaminase (ADA), and hemoglobin) were used for diagnosis. The results indicated that the sensitivity of RS analysis was 85% and 90% specificity based on bone marrow supernatant (148). Another article published in 2018 used RS to identify leukocyte subpopulations of lymphocyte (B, T, and natural killer (NK) cells), monocyte, and granulocytes. Spectral differences between monocytes and lymphocytes were nucleic acid and protein bands. In addition, spectral differences around 833, 977, 1337, 1547, and 1617 cm−1 were found in granulocyte. Classification based on Raman data provides 99% accuracy. Moreover, they proved that RS can effectively monitor the cell response to low-dose chemotherapy. Methotrexate (MTX)-treated (0.01, 0.1, and 1 μm, 72 h) cells presented a decreasing trend of RS intensities. In addition, proteins and nucleic acids decreased as the concentration of MTX increased (89).
AML is a group of aggressive hematopoietic malignancies that arise from myeloid precursors (149). Although AML treatments have improved significantly in recent decades, relapses of AML and drug resistance are still the major challenges in the treatment of AML (150), with only 40% of young patients staying in remission at five years after treatment (151, 152). Therefore, more accurate classification and diagnosis are needed. Advanced technology such as RS can be applied in AML to improve outcome. A description of RS techniques in AML is summarized in Figure 4.
The most recent study of AML and RS was conducted in 2022. SERS with Ag nanoparticles was used to detect biochemical varieties of blood serum samples from patients aged 16–60 years. Significant differences were found in amino acids and proteins, which can be used as SERS biomarkers to differentiate AML subtypes. Raman bands at 495, 725, 1002, 1070, 1616, and 1653 cm−1 (amino acid, nucleic acid, and protein) demonstrated significant differences in samples. Quadruple detection of a combination of Raman band ratios 533/1002, 1070/1653, 725/1653, and 1616/1653 could be used as a biomarker for the primary diagnosis of AML (90). Besides, some articles mentioned above in the ALL section (86, 87, 148) also demonstrated the potential of RS in the diagnosis and classification AML.
Various diagnostic models have been established based on RS techniques to obtain a rapid and accurate classification of AML. Low methylation of DNA can be used to detect cancer (153). DNA from in vitro AML cells were extracted and compared to normal DNA. Raman spectra illustrated the 1005 cm-1 band of 5-methylcytosine decreased, and classification based on this band demonstrated 82% accuracy. Currently, next-generation sequencing (NGS) or flow cytometry is used for tumor burden monitoring (154, 155). Yet, the complexity of the AML gene and phenotype is challenging to monitor (156). RS showed high accuracy, specificity, and sensitivity in detection, which can be used as a valuable tool for follow-up (92). Raman image combined with HCA is able to automatically discriminate and localize cellular components, such as hemoglobin. In addition, the accuracy of PCA and LDA classification models based on RS reached 98%. Furthermore, typical vibration characteristics of myeloblasts, promyelocytes (normal/abnormal), and erythroblasts were demonstrated. However, the International Working Group on Morphology of Myelodysplastic Syndrome (IWGM-MDS) reported 72–85% accuracy of manual examination (93).
In addition, a better understanding of biochemical activities and cellular response to drugs can improve treatment. In 2017, Denbigh et al. performed vibrational spectroscopy (FTIR and RS) on regular AML cells and cells treated with a combination of bezafibrate and medroxyprogesterone acetate (BaP). Spectral differences revealed a significant change in cellular lipid composition, indicating that lipid biochemistry is a significant target for BaP. The accuracy of classification was 95.23% for BaP-treated cells and 89.11% for control cells (94). In order to predict patients’ prognosis, SERS was used to measure biomolecular differences in bone marrow supernatant fluid. The findings showed differences in amino acids, saccharides, and lipids between patients with good and poor prognosis. An AML prognostic model was established after multivariate analysis of SERS results and achieved a prediction accuracy of 84.78%. (95).
Traditional diagnosis of ALL and AML mostly rely on morphology, flow cytometry, polymerase chain reaction, and gene sequencing (157, 158), but these methods are either time-consuming or costly. In contrast, RS is rapid and economical in ALL/AML diagnosis. RS also reveals biomolecular information, which provides new perspectives in ALL/AML treatment. Since ALL and AML subtypes are numerous and hard to discriminate, abundant RS information on the different subtypes of ALL/AML is needed to make a more precise diagnosis. Establishing an RS database of ALL/AML is an effective way to improve the clinical applications of RS.
Lymphomas are one of the most common types of cancer in adolescents and can be classified into Non-Hodgkin (NHL) (90%) and Hodgkin (HL) (10%). Nearly 90% of lymphomas are derived from B-cell and T-cell, and natural killer cells (NK) origin accounts for only 10% (159). Lymphoma accounts for 22% of all cancers in patients aged between 15 and 24 years (16% of HL and 6% of NHL) (160, 161). Due to advances in treatment techniques, the overall survival five-year of lymphoma has improved from 80.4 to 93.4% for HL and 55.6 to 76.2% for NHL (162). More rapid and accurate diagnosis and classification of lymphoma are vital. The applications of RS in lymphoma are summarized in Figure 4.
In 2022, Katsara et al. suggested a rapid RS method for characterization and differentiation. This method provides a non-destructive strategy for early and accurate lymphoma classification (163). SERS can be a non-destructive diagnosis and staging diffuse large B-cell lymphoma (DLBCL) strategy on serum. Spectra of DLBCL in different stages were compared and provided different Raman spectral intensities. DLBCL serum samples had relatively higher intensities at Raman bands 725, 1093, 1329, 1371, and 1444 cm−1 (hypoxanthine, adenine, thymine, collagen, and phospholipids) and lower intensities at bands 493, 636, 888, 1003, 1133, 1580, and 1652 cm−1 (ergothioneine, uric acid, Tyr, lactose, Phe, acetoacetate, amide I, and α-Helix). Multivariate analysis methods were then used to establish DLBCL diagnosis and staging models. The accuracy, sensitivity, and specificity of k-nearest neighbors (kNN) classifier model was 87.3%, 92.1%, and 80.9%, respectively. As for the staging model, the discrimination accuracy of early (Stage I & II) and late (Stage III & IV) stages was 90.6% (96). In addition, the distinction between B-cell lymphoma (BCL), T-cell lymphoma (TCL), and lymph node metastasis of melanoma (Met) is vital in treatment. However, diagnosis through pathology or extensive immunohistochemistry staining is laborious (164). RS is a rapid and novel method of diagnosis. Two spectral differences were found in bands of 5-methylcytosine and adenine. The overall discriminatory accuracy between B-cell lymphoma (BCL), T-cell lymphoma (TCL), and lymph node metastasis of melanoma (Met) was 94.7% (97). In early 2003, SERS active substrates were used to detect cancer genes, such as BCL2. The SERS gene probes in this study can be used to detect DNA targets which possess the sensitivity and specificity to detect cancer genes (165).
Additionally, Agsalda-Garcia et al. performed standard RS to analyze 11 pediatric NHL and non-malignant tissue specimens from pediatric patients. However, pediatric NHL specimens consisted of 100% tumor tissues. The sensitivity of RS in samples comprised of more than just tumor remains unknown (166). Intraocular lymphoma is a special type of lymphoma that is difficult to diagnose (167). RS was selected to improve the diagnosis of intraocular lymphoma by analyzing spectra from intraocular inflammatory leukocytes and other samples using multivariate analysis. The sensitivity and specificity to discriminate between lymphoma cells and normal B cells ranged from 74–94% and 90–100% (98).
A study from 2020 reported in vitro blood plasma analysis of hematopoietic tumors based on RS. Spectral characteristics of plasma of DLBCL and chronic lymphocytic leukemia (CLL) were discovered, and models of DLBCL and CLL were built using orthogonal partial least squares discriminant analysis (OPLS-DA). Raman shifts at 1445 cm-1 and 1655 cm-1 were used to distinguish DLBCL and CLL, demonstrating high diagnostic sensitivity (92.86% and 80%) and specificity (100% and 92.31%) (99).
The current diagnosis of lymphoma is inclined to needle biopsy or surgical excision (168). These methods are destructive and complex. Compared to traditional diagnostic methods, RS is much simpler, and the samples for analysis are diverse and easy to acquire. Similar to other pediatric cancers, an accurate diagnosis requires the support of a large database. Studies that enlarge the RS database are needed in future to enhance the diagnosis. In addition, RS equipment is too expensive in some areas with high incidences of Burkitt lymphoma (169). Therefore, there is a need to invent economical and affordable RS equipment.
Glioma is a single-celled disease that occurs anywhere in the CNS, especially in the brain and glial tissue (170, 171). It is the most common primary CNS tumor, accounting for around 30% of CNS tumors and 80% of malignant tumors (172). The World Health Organization classifies gliomas into four grades based on malignant behaviors (173). Gliomas are generally classified into two typical types: Low-grade glioma (LGG), which includes grades I and II; and high-grade glioma (HGG), which includes grades III and IV (174). LGG and HGG accounts for nearly 33% and 62% of all gliomas, respectively (175). Besides, gliomas can also be divided into various kinds of tumors, from low-risk ependyma to the most dangerous glioblastoma (GBM), based on the histological features (176). The applications of RS in glioma are summarized in Figure 4.
LGG is the most common glioma during childhood and accounts for over 30% of CNS tumors (177, 178). The survival rate of glioma is high (20-years overall survival of 87 ± 0.8%) since it can be surgically removed (179). However, HGG is rare but very aggressive and fatal due to its high recurrence. The incidence of HGG in children is higher than in adults (180) and has a low survival rate of about 20% (181). Thus, the clinical application of optical technologies like RS is promising. The applications of RS in glioma are summarized in Figure 4.
Iturrioz-Rodríguez et al. compared GBM cells with healthy human astrocytes in vitro using RS. Their results revealed that spectral regions ranging from 1000–1300 cm-1 provide sufficient information for discrimination. Raman peaks related to DNA/RNA and cytochrome C are increased in cancer cells. Their model distinguished cancer cells from healthy cells with an average accuracy of 92.5% (100). Moreover, Ma et al. obtained Raman spectra of pediatric blood plasma and used feature engineering-based classification models for prediction. After fivefold cross-validation that measures the predictive performance between models, the results showed the sensitivity, specificity, and accuracy was 98.10%, 98.19%, and 97.87% (101). Furthermore, Kowalska’s team used SERS to distinguish glioma. Their results revealed the spectral regions of Try (1450, 1278 cm-1), protein (1300 cm-1), Phe, and Amide-I (1005, 1654 cm-1) have the greatest influence on the study, and the accuracy of discrimination was 96% (103).
Generally, visually distinguishing cancer from normal tissue is nearly impossible. Yet, it is crucial to CNS tumor surgery since the invasive cancer cells often remain after surgery, leading to disease recurrence (182). To solve this problem, Jermyn et al. developed a handheld RS probe technique for detecting brain tumor cells. This study was conducted during surgery in vivo and demonstrated an accurate discrimination of normal brain from dense cancer and normal brain invaded by cancer with a specificity and sensitivity of 91% and 93% (104). Additionally, Leslie’s team evaluated the diagnostic ability of RS based on pediatric samples. They performed routine pathology tests and RS to distinguish untreated pediatric medulloblastoma, glioma, and normal brain samples. The accuracy of identification based on tissue level was 100% (105).
Due to its aggressiveness, GBM can cause death shortly after diagnosis. Aguiar et al. built a model using PCA and Euclidean distance scores to discriminate cancer tissue from normal tissue. Characteristic Raman peaks were lipid/phospholipid cholesterols and proteins. The sensitivity and specificity of in vitro diagnosis was 97.4% and 100% (106). Furthermore, mutations in the isocitrate dehydrogenase 1 (IDH1) gene are genetic causes of glioma, leading to metabolic changes (183). Uckermann et al. showed increased intensities in spectral bands related to DNA in IDH1 mutant glioma, whereas bands related to lipids were decreased. Results demonstrated that RS could be used in a simple, rapid, and safe IDH1 gene mutation-detecting program (184). In addition, Ricci’s team used Raman micro-spectroscopy to detect the stress response of GBM cells that adhered to a silicon substrate and showed reductions in Raman signals of cytochrome C, lipid, nucleic acid, and protein. The results demonstrated the potential of RS in studying cell processes, which can improve the treatment (107).
Similar to osteosarcoma, the diagnosis of glioma mainly depends on imageology examination. RS detection of glioma reduces the level of complexity. Moreover, RS can be used for guidance during surgery by characterizing tissue margins, leading to precise resection (185). It needs no special staining or any preparation, making real-time diagnosis possible. However, RS surely has a limited field of view. In future, this limitation can be fixed by combining RS with complementary imaging techniques (104).
Pediatric cancers have significant differences compared to adult cancers. Most adult cancers are epithelial, composed of many somatic mutations, and are often influenced by environmental factors, such as smoking. In contrast, pediatric cancers are generally natural and possess few somatic mutations. Therefore, prevention and diagnosis are not as effective as in adult cancers (11, 186). Early and accurate diagnosis is crucial in pediatric cancers. Delayed diagnosis often leads to advanced diseases, complications, and increased risk of death (187–189). In some areas, the accuracy of diagnosis is limited by the lack of equipment (190–192).
RS techniques are often compared to traditional techniques. It is not meant to replace classic techniques but to fill the niches. Imagological examinations and biopsies are indispensable in pediatric cancer (193). They assist clinicians in making an accurate diagnosis. Early diagnosis of pediatric cancer is crucial since it influences the patient’s treatment and outcome. Although histological biopsy is generally applicable and is considered the gold diagnosis standard in many cancers (194), it is commonly applied after observing tumor-like structures using imagological examinations. Thus, histological biopsy cannot be applied for early cancer screening. In addition, it requires complex operations, which are highly destructive (195). In contrast, RS techniques are suitable for early diagnosis. RS is able to discriminate cancer cells from normal cells after profiling the characteristic Raman peaks. Whole blood, plasma, bone marrow supernatant fluid, and tissue samples can be used for diagnosis. Compared to laboratory tests in leukemia, RS is time-saving and accurate. During osteosarcoma or glioma surgery, precise information of margin offered by biopsies is time-consuming, and imagological examinations are unable to distinguish cancer cells from normal cells. Handheld RS techniques offer in vivo margin information to help tumor resection. Histological accuracy is not completely 100% as it depends on the professional level of clinicians and medical equipment. A study demonstrated the 75% accuracy of diagnosis of Burkitt lymphoma in Uganda. Most pathologists have not received specific training in the differential characteristics of NHL and HL due to limited resources (190). RS-based diagnostic models can assist pathologists in achieving higher accuracies.
Most studies are aimed at identifying cancer cells through characteristic Raman bands. They were performed in vitro, using samples and cells acquired from companies or patients. In vivo experiments are rare in pediatric cancer diagnosis. They mainly focused on evaluating therapy or guiding surgery. However, in vivo application of RS is vital in pediatric cancers and is the future direction of RS studies. In addition to its application in diagnosis, RS can reveal the deep interaction of drugs or biomolecules. Despite the significant differences between pediatric and adult cancers, some studies used samples from a wide age group of patients. This covers most age groups, resulting in low accuracy or sensitivity of diagnosis and misunderstanding of Raman fingerprints. There is a need to limit the age range of patients. In addition, during clinical practice, samples from patients always come with normal tissues. Thus, the accuracy, specificity, and sensitivity of models in studies that focus on analyzing 100% pure cancer cells are limited in clinical applications. The sensitivity and accuracy of RS in discriminating and classifying tissues composed of mixed cells need to be assessed.
Deep learning based on a large amount of Raman spectra is also popular nowadays. It provides a fast and accurate diagnosis of cancers. Furthermore, it can predict the aggressiveness of cancer and make better decisions for patients. However, it is essential to preprocess the spectra data before inputting it into deep learning training. This is important for selecting useful signals for deep learning and enhancing spectral features. A study aimed to classify melanocytes and melanoma by combining SERS with deep learning. Convolutional neural networks were constructed for classification and demonstrated an accuracy of over 98%. This study highlights the great potential of combining RS and deep learning in clinical applications (196). Studies have demonstrated that preprocessing of raw data can greatly affect the outcome of diagnosis (49, 197). Additionally, researchers have combined RS with other spectroscopies like IRS and FS to overcome the disadvantages of RS. They can complement the shortcomings of each other. IRS and RS were combined for oral cancer and breast cancer diagnosis (198, 199). Furthermore, RS was used in combination with Fourier Transform Infrared (FTIR) spectroscopy to identify endometrial cancer and atypical hyperplasia (200). This combination was also used in determining chemical changes in GBM (201). Besides IRS, the combination of RS with FS has been applied for breast cancer diagnosis (202).
Raman spectroscopy can provide molecular information on pediatric cancers, which demonstrates its potential in clinical applications of pediatric cancers. Raman fingerprints of different pediatric cancer were established for diagnosis, and diagnostic models were built and evaluated based on these characteristic Raman bands. A decent accuracy, specificity, and sensitivity indicate the potential role of RS in clinical diagnosis. As for treatment, RS can detect in vivo cancer cells in tumor resection margins and reveal interactions between drugs and cancer cells. In summary, Raman has the ability to provide a rapid and accurate early diagnosis of pediatric cancers, predict cancer prognosis, and improve treatment.
In order to obtain higher resolution, faster results, and better accuracy, it is necessary to develop enhanced Raman spectral databases, suitable algorithms, and advanced instruments. More studies on the applications of RS in pediatric cancer are needed to make RS a stable, effective tool against pediatric cancers.
CL made crucial contributions to conception and manuscript production. CF contributed to article collection. RX contributed to figure production. BJ participated in table production. LL and YH participated in the revising of the manuscript. CT provide oversight and leadership responsibility for the research activity planning and execution. ZL provide management and coordination responsibility for the research activity planning and execution. All authors read, revised, and approved this manuscript and agreed to be responsible for allaspects of the research to ensure the data accuracy and integrity of this work.
This work was supported by the National Natural Foundation of China (82272664, 81902745, 82172500), Hunan Provincial Natural Science Foundation of China (2022JJ30843), the Science and Technology Development Fund Guided by Central Government (2021Szvup169), Hunan Provincial Administration of Traditional Chinese Medicine Project (D2022117), the Scientific Research Program of Hunan Provincial Health Commission (B202304077077), and the Clinical Research Center for Medical Imaging in Hunan Province (2020SK4001).
The authors declare that the research was conducted in the absence of any commercial or financial relationships that could be construed as a potential conflict of interest.
All claims expressed in this article are solely those of the authors and do not necessarily represent those of their affiliated organizations, or those of the publisher, the editors and the reviewers. Any product that may be evaluated in this article, or claim that may be made by its manufacturer, is not guaranteed or endorsed by the publisher.
1. Stiller CA. Epidemiology and genetics of childhood cancer. Oncogene (2004) 23:6429–44. doi: 10.1038/sj.onc.1207717
2. Raab CP, Gartner JC Jr. Diagnosis of childhood cancer. Prim Care (2009) 36:671–84. doi: 10.1016/j.pop.2009.07.002
3. Aleassa EM, Xing M, Keijzer R. Nanomedicine as an innovative therapeutic strategy for pediatric cancer. Pediatr Surg Int (2015) 31:611–6. doi: 10.1007/s00383-015-3683-2
4. Kattner P, Strobel H, Khoshnevis N, Grunert M, Bartholomae S, Pruss M, et al. Compare and contrast: Pediatric cancer versus adult malignancies. Cancer Metastasis Rev (2019) 38:673–82. doi: 10.1007/s10555-019-09836-y
5. Chen Y, Miao L, Lin H, Zhuo Z, He J. The role of m6A modification in pediatric cancer. Biochim Biophys Acta Rev Cancer (2022) 1877:188691. doi: 10.1016/j.bbcan.2022.188691
6. Seth R, Singh A. Leukemias in children. Indian J Pediatr (2015) 82:817–24. doi: 10.1007/s12098-015-1695-5
7. Steliarova-Foucher E, Colombet M, Ries LAG, Moreno F, Dolya A, Bray F, et al. International incidence of childhood cancer 2001-10: A population-based registry study. Lancet Oncol (2017) 18:719–31. doi: 10.1016/S1470-2045(17)30186-9
8. Von Allmen D. Pediatric surgical oncology: A brief overview of where we have been and the challenges we face. Semin Pediatr Surg (2019) 28:150864. doi: 10.1016/j.sempedsurg.2019.150864
9. Parker SL, Tong T, Bolden S, Wingo PA. Cancer statistics 1997. CA Cancer J Clin (1997) 47:5–27. doi: 10.3322/canjclin.47.1.5
10. Horn SR, Stoltzfus KC, Mackley HB, Lehrer EJ, Zhou S, Dandekar SC, et al. Long-term causes of death among pediatric patients with cancer. Cancer (2020) 126:3102–13. doi: 10.1002/cncr.32885
11. Mcgregor LM, Metzger ML, Sanders R, Santana VM. Pediatric cancers in the new millennium: dramatic progress, new challenges. Oncol (Williston Park) (2007) 21:809–20. discussion 820, 823-4.
12. Askins MA, Moore BD 3rd. Psychosocial support of the pediatric cancer patient: Lessons learned over the past 50 years. Curr Oncol Rep (2008) 10:469–76. doi: 10.1007/s11912-008-0072-1
13. Hutzen B, Paudel SN, Naeimi Kararoudi M, Cassady KA, Lee DA, Cripe TP. Immunotherapies for pediatric cancer: Current landscape and future perspectives. Cancer Metastasis Rev (2019) 38:573–94. doi: 10.1007/s10555-019-09819-z
14. Gaba F, Tipping WJ, Salji M, Faulds K, Graham D, Leung HY. Raman spectroscopy in prostate cancer: Techniques, applications and advancements. Cancers (Basel) (2022) 14:1535. doi: 10.3390/cancers14061535
15. Zhang Y, Ren L, Wang Q, Wen Z, Liu C, Ding Y. Raman spectroscopy: A potential diagnostic tool for oral diseases. Front Cell Infect Microbiol (2022) 12:775236. doi: 10.3389/fcimb.2022.775236
16. Vašková H. A powerful tool for material identification: Raman spectroscopy. International Journal of Mathematical Models and Methods in Applied Sciences (2011) 5:1205–12.
17. Hanna K, Krzoska E, Shaaban AM, Muirhead D, Abu-Eid R, Speirs V. Raman spectroscopy: Current applications in breast cancer diagnosis, challenges and future prospects. Br J Cancer (2021) 126(8):1125–39. doi: 10.1038/s41416-021-01659-5
18. Harris AT, Rennie A, Waqar-Uddin H, Wheatley SR, Ghosh SK, Martin-Hirsch DP, et al. Raman spectroscopy in head and neck cancer. Head Neck Oncol (2010) 2:26. doi: 10.1186/1758-3284-2-26
19. Notingher I. Raman spectroscopy cell-based biosensors. Sensors (2007) 7:1343–58. doi: 10.3390/s7081343
20. Byrne HJ, Baranska M, Puppels GJ, Stone N, Wood B, Gough KM, et al. Spectropathology for the next generation: quo vadis? Analyst (2015) 140:2066–73. doi: 10.1039/C4AN02036G
21. Barroso EM, Smits RW, Bakker Schut TC, Ten Hove I, Hardillo JA, Wolvius EB, et al. Discrimination between oral cancer and healthy tissue based on water content determined by raman spectroscopy. Anal Chem (2015) 87:2419–26. doi: 10.1021/ac504362y
22. Barroso EM, Smits RW, Van Lanschot CG, Caspers PJ, Ten Hove I, Mast H, et al. Water concentration analysis by raman spectroscopy to determine the location of the tumor border in oral cancer surgery. Cancer Res (2016) 76:5945–53. doi: 10.1158/0008-5472.CAN-16-1227
23. Wang J, Lin K, Zheng W, Ho KY, Teh M, Yeoh KG, et al. Comparative study of the endoscope-based bevelled and volume fiber-optic raman probes for optical diagnosis of gastric dysplasia in vivo at endoscopy. Anal Bioanal Chem (2015) 407:8303–10. doi: 10.1007/s00216-015-8727-x
24. Farhane Z, Bonnier F, Byrne HJ. Monitoring doxorubicin cellular uptake and trafficking using in vitro raman microspectroscopy: Short and long time exposure effects on lung cancer cell lines. Anal Bioanal Chem (2017) 409:1333–46. doi: 10.1007/s00216-016-0065-0
25. Baker MJ, Byrne HJ, Chalmers J, Gardner P, Goodacre R, Henderson A, et al. Clinical applications of infrared and raman spectroscopy: State of play and future challenges. Analyst (2018) 143:1735–57. doi: 10.1039/C7AN01871A
26. Guevara E, Torres-Galván JC, Ramírez-Elías MG, Luevano-Contreras C, González FJ. Use of raman spectroscopy to screen diabetes mellitus with machine learning tools. BioMed Opt Express (2018) 9:4998–5010. doi: 10.1364/BOE.9.004998
28. Raman CV, Krishnan KS. A new type of secondary radiation. Nature (1928) 121:501–2. doi: 10.1038/121501c0
29. Le Ru EC, Etchegoin PG. Single-molecule surface-enhanced raman spectroscopy. Annu Rev Phys Chem (2012) 63:65–87. doi: 10.1146/annurev-physchem-032511-143757
30. Chase B. A new generation of raman instrumentation. Appl Spectrosc (1994) 48:14A–9A. doi: 10.1366/0003702944029848
31. Mcintyre J, Ryder A, Leger M, Hennessey K, Madden M. Qualitative and quantitative analysis of chlorinated solvents using raman spectroscopy and machine learning. (2005) 5826:131–42. doi: 10.1117/12.605056
32. Herzberg G, Crawford BL. Infrared and raman spectra of polyatomic molecules. J Phys Chem (1945) 50:288.
33. Krafft C, Steiner G, Beleites C, Salzer R. Disease recognition by infrared and raman spectroscopy. J Biophotonics (2009) 2:13–28. doi: 10.1002/jbio.200810024
34. Butler HJ, Ashton L, Bird B, Cinque G, Curtis K, Dorney J, et al. Using raman spectroscopy to characterize biological materials. Nat Protoc (2016) 11:664–87. doi: 10.1038/nprot.2016.036
35. Carey PR. Raman spectroscopy, the sleeping giant in structural biology, awakes. J Biol Chem (1999) 274:26625–8. doi: 10.1074/jbc.274.38.26625
36. Movasaghi Z, Rehman S, Rehman IU. Raman spectroscopy of biological tissues. Appl Spectrosc Rev (2007) 42:493–541. doi: 10.1080/05704920701551530
37. Abramczyk H, Brozek-Pluska B, Jarota A, Surmacki J, Imiela A, Kopec M. A look into the use of raman spectroscopy for brain and breast cancer diagnostics: Linear and non-linear optics in cancer research as a gateway to tumor cell identity. Expert Rev Mol Diagn (2020) 20:99–115. doi: 10.1080/14737159.2020.1724092
38. Rangan S, Schulze HG, Vardaki MZ, Blades MW, Piret JM, Turner RFB. Applications of raman spectroscopy in the development of cell therapies: State of the art and future perspectives. Analyst (2020) 145:2070–105. doi: 10.1039/C9AN01811E
39. Short MA, Lui H, Mclean D, Zeng H, Alajlan A, Chen XK. Changes in nuclei and peritumoral collagen within nodular basal cell carcinomas via confocal micro-raman spectroscopy. J BioMed Opt (2006) 11:34004. doi: 10.1117/1.2209549
40. Abramczyk H, Brozek-Pluska B. Raman imaging in biochemical and biomedical applications. diagnosis and treatment of breast cancer. Chem Rev (2013) 113:5766–81. doi: 10.1021/cr300147r
41. Cordero E, Latka I, Matthäus C, Schie I, Popp J. In-vivo raman spectroscopy: from basics to applications. J BioMed Opt (2018) 23:1–23. doi: 10.1117/1.JBO.23.7.071210
42. Pavlou E, Zhang X, Wang J, Kourkoumelis N. Raman spectroscopy for the assessment of osteoarthritis. Ann Joint. (2018) 3. doi: 10.21037/aoj.2018.09.10
43. Carlomagno C, Banfi PI, Gualerzi A, Picciolini S, Volpato E, Meloni M, et al. Human salivary raman fingerprint as biomarker for the diagnosis of amyotrophic lateral sclerosis. Sci Rep (2020) 10:10175. doi: 10.1038/s41598-020-67138-8
44. Shipp DW, Sinjab F, Notingher I. Raman spectroscopy: Techniques and applications in the life sciences. Adv Optics Photonics (2017) 9:315–428. doi: 10.1364/AOP.9.000315
45. Evans CL, Potma EO, Puoris'haag M, Côté D, Lin CP, Xie XS. Chemical imaging of tissue in vivo with video-rate coherent anti-stokes raman scattering microscopy. Proc Natl Acad Sci U.S.A. (2005) 102:16807–12. doi: 10.1073/pnas.0508282102
46. Wang Y, Li ZH, Zhang ZX, An DK. [Applications of raman spectroscopy in pharmaceutical analysis]. Yao Xue Xue Bao (2004) 39:764–8.
47. Schie I, Stiebing C, Popp J. Looking for a perfect match: Multimodal combinations of raman spectroscopy for biomedical applications. J Biomed Opt 26. doi: 10.1117/1.JBO.26.8.080601[doi]LID-080601
48. Eberhardt K, Stiebing C, Matthäus C, Schmitt M, Popp J. Advantages and limitations of raman spectroscopy for molecular diagnostics: An update. Expert Rev Mol Diagn (2015) 15:773–87. doi: 10.1586/14737159.2015.1036744
49. Auner GW, Koya SK, Huang C, Broadbent B, Trexler M, Auner Z, et al. Applications of raman spectroscopy in cancer diagnosis. Cancer Metastasis Rev (2018) 37:691–717. doi: 10.1007/s10555-018-9770-9
50. Beć KB, Grabska J, Huck CW. Biomolecular and bioanalytical applications of infrared spectroscopy – a review. Anal Chimica Acta (2020) 1133:150–77. doi: 10.1016/j.aca.2020.04.015
51. Beć KB, Grabska J, Huck CW. Near-infrared spectroscopy in bio-applications. Molecules (2020) 25:2948. doi: 10.3390/molecules25122948
52. Zhu C, Palmer GM, Breslin TM, Harter J, Ramanujam N. Diagnosis of breast cancer using fluorescence and diffuse reflectance spectroscopy: A Monte-carlo-model-based approach. J BioMed Opt (2008) 13:034015. doi: 10.1117/1.2931078
53. Chidananda SM, Satyamoorthy K, Rai L, Manjunath AP, Kartha VB. Optical diagnosis of cervical cancer by fluorescence spectroscopy technique. Int J Cancer (2006) 119:139–45. doi: 10.1002/ijc.21825
54. Jing Y, Wang Y, Wang X, Song C, Ma J, Xie Y, et al. Label-free imaging and spectroscopy for early detection of cervical cancer. J Biophotonics (2018) 11:e201700245. doi: 10.1002/jbio.201700245
55. Ries J, Schwille P. Fluorescence correlation spectroscopy. Bioessays (2012) 34:361–8. doi: 10.1002/bies.201100111
56. Ghosh A, Karedla N, Thiele JC, Gregor I, Enderlein J. Fluorescence lifetime correlation spectroscopy: Basics and applications. Methods (2018) 140-141:32–9. doi: 10.1016/j.ymeth.2018.02.009
57. Pappas D, Smith BW, Winefordner JD. Raman spectroscopy in bioanalysis. Talanta (2000) 51:131–44. doi: 10.1016/S0039-9140(99)00254-4
58. Keren S, Zavaleta C, Cheng Z, de la Zerda A, Gheysens O, Gambhir SS. Noninvasive molecular imaging of small living subjects using raman spectroscopy. Proc Natl Acad Sci U.S.A. (2008) 105:5844–9. doi: 10.1073/pnas.0710575105
59. Drazba JA. Introduction to confocal microscopy. Micros Microanal (2006) 12:1756–1757. doi: 10.1017/S1431927606068280
60. Elumalai S, Manago S, De Luca AC. Raman microscopy: Progress in research on cancer cell sensing. Sensors (Basel) (2020) 20:5525. doi: 10.3390/s20195525
61. Meister K, Schmidt DA, Bründermann E, Havenith M. Confocal raman microspectroscopy as an analytical tool to assess the mitochondrial status in human spermatozoa. Analyst (2010) 135:1370–4. doi: 10.1039/b927012d
62. Wood JJ, Kendall C, Hutchings J, Lloyd GR, Stone N, Shepherd N, et al. Evaluation of a confocal raman probe for pathological diagnosis during colonoscopy. Colorectal Dis (2014) 16:732–8. doi: 10.1111/codi.12664
63. Moura CC, Tare RS, Oreffo RO, Mahajan S. Raman spectroscopy and coherent anti-stokes raman scattering imaging: prospective tools for monitoring skeletal cells and skeletal regeneration. J R Soc Interface (2016) 13. doi: 10.1098/rsif.2016.0182
64. Schlücker S. Surface-enhanced raman spectroscopy: Concepts and chemical applications. Angew Chem Int Ed Engl (2014) 53:4756–95. doi: 10.1002/anie.201205748
65. Sloan-Dennison S, Laing S, Graham D, Faulds K. From raman to SESORRS: Moving deeper into cancer detection and treatment monitoring. Chem Commun (Camb) (2021) 57:12436–51. doi: 10.1039/D1CC04805H
66. Ember KJI, Hoeve MA, Mcaughtrie SL, Bergholt MS, Dwyer BJ, Stevens MM, et al. Raman spectroscopy and regenerative medicine: A review. NPJ Regener Med (2017) 2:12. doi: 10.1038/s41536-017-0014-3
67. Ellis DI, Goodacre R. Metabolic fingerprinting in disease diagnosis: Biomedical applications of infrared and raman spectroscopy. Anal (2006) 131 8:875–85. doi: 10.1039/b602376m
68. Jolliffe IT, Cadima J. Principal component analysis: A review and recent developments. Philos Trans A Math Phys Eng Sci (2016) 374:20150202. doi: 10.1098/rsta.2015.0202
69. Ringnér M. What is principal component analysis? Nat Biotechnol (2008) 26:303–4. doi: 10.1038/nbt0308-303
70. Chowdary MV, Kumar KK, Kurien J, Mathew S, Krishna CM. Discrimination of normal, benign, and malignant breast tissues by raman spectroscopy. Biopolymers (2006) 83:556–69. doi: 10.1002/bip.20586
71. Gautam R, Vanga S, Ariese F, Umapathy S. Review of multidimensional data processing approaches for raman and infrared spectroscopy. EPJ Tech Instrum (2015) 2:8. doi: 10.1140/epjti/s40485-015-0018-6
72. Goodswen SJ, Barratt JLN, Kennedy PJ, Kaufer A, Calarco L, Ellis JT. Machine learning and applications in microbiology. FEMS Microbiol Rev (2021) 45. doi: 10.1093/femsre/fuab015
73. Rousseeuw PJ. Silhouettes: A graphical aid to the interpretation and validation of cluster analysis. J Comput Appl Math (1987) 20:53–65. doi: 10.1016/0377-0427(87)90125-7
74. Kothari R, Jones V, Mena D, Bermúdez Reyes V, Shon Y, Smith JP, et al. Raman spectroscopy and artificial intelligence to predict the Bayesian probability of breast cancer. Sci Rep (2021) 11:6482. doi: 10.1038/s41598-021-85758-6
75. Dornaika F, Khoder A. Linear embedding by joint robust discriminant analysis and inter-class sparsity. Neural Netw (2020) 127:141–59. doi: 10.1016/j.neunet.2020.04.018
76. Gao N, Wang Q, Tang J, Yao S, Li H, Yue X, et al. Non-invasive SERS serum detection technology combined with multivariate statistical algorithm for simultaneous screening of cervical cancer and breast cancer. Anal Bioanal Chem (2021) 413:4775–84. doi: 10.1007/s00216-021-03431-3
77. Krzywinski M, Altman N. Multiple linear regression. Nat Methods (2015) 12:1103–4. doi: 10.1038/nmeth.3665
78. Li X, Yang T, Li CS, Song Y, Lou H, Guan D, et al. Surface enhanced raman spectroscopy (SERS) for the multiplex detection of braf, kras, and Pik3ca mutations in plasma of colorectal cancer patients. Theranostics (2018) 8:1678–89. doi: 10.7150/thno.22502
79. Rinnan Å., Andersson M, Ridder C, Engelsen SB. Recursive weighted partial least squares (rPLS): An efficient variable selection method using PLS. J Chemometr (2014) 28:439–47. doi: 10.1002/cem.2582
80. Han Z, Peng X, Yang Y, Yi J, Zhao D, Bao Q, et al. Integrated microfluidic-SERS for exosome biomarker profiling and osteosarcoma diagnosis. Biosens Bioelectron (2022) 217:114709. doi: 10.1016/j.bios.2022.114709
81. Chiang YH, Wu SH, Kuo YC, Chen HF, Chiou A, Lee OK. Raman spectroscopy for grading of live osteosarcoma cells. Stem Cell Res Ther (2015) 6:81. doi: 10.1186/s13287-015-0074-5
82. D'acunto M, Trombi L, D'alessandro D, Danti S. Raman spectroscopy of osteosarcoma cells. Phys Biol (2018) 16:016007. doi: 10.1088/1478-3975/aaefbf
83. Wang H, Li J, Qin J, Li J, Chen Y, Song D, et al. Confocal raman microspectral analysis and imaging of the drug response of osteosarcoma to cisplatin. Anal Methods (2021) 13:2527–36. doi: 10.1039/D1AY00626F
84. Wang H, Li J, Qin J, Li J, Chen Y, Song D, et al. Investigating the cellular responses of osteosarcoma to cisplatin by confocal raman microspectroscopy. J Photochem Photobiol B (2022) 226:112366. doi: 10.1016/j.jphotobiol.2021.112366
85. Chauhan S, Khan SA, Prasad A. Irradiation-induced compositional effects on human bone after extracorporeal therapy for bone sarcoma. Calcif Tissue Int (2018) 103:175–88. doi: 10.1007/s00223-018-0408-2
86. Gonzalez-Solis JL, Martinez-Espinosa JC, Salgado-Roman JM, Palomares-Anda P. Monitoring of chemotherapy leukemia treatment using raman spectroscopy and principal component analysis. Lasers Med Sci (2014) 29:1241–9. doi: 10.1007/s10103-013-1515-y
87. Da Silva AM, De Siqueira E. O. F. S. A., De Brito PL, Silveira L. Spectral model for diagnosis of acute leukemias in whole blood and plasma through raman spectroscopy. J BioMed Opt (2018) 23:1–11. doi: 10.1117/1.JBO.23.10.107002
88. Manago S, Valente C, Mirabelli P, Circolo D, Basile F, Corda D, et al. A reliable raman-spectroscopy-based approach for diagnosis, classification and follow-up of b-cell acute lymphoblastic leukemia. Sci Rep (2016) 6:24821. doi: 10.1038/srep24821
89. Manago S, Mirabelli P, Napolitano M, Zito G, De Luca AC. Raman detection and identification of normal and leukemic hematopoietic cells. J Biophotonics (2018) 11:e201700265. doi: 10.1002/jbio.201700265
90. Ye M, Chen Y, Wang Y, Xiao L, Lin Q, Lin H, et al. Subtype discrimination of acute myeloid leukemia based on plasma SERS technique. Spectrochim Acta A Mol Biomol Spectrosc (2022) 271:120865. doi: 10.1016/j.saa.2022.120865
91. Neugebauer U, Bocklitz T, Clement JH, Krafft C, Popp J. Towards detection and identification of circulating tumour cells using raman spectroscopy. Analyst (2010) 135:3178–82. doi: 10.1039/c0an00608d
92. Moisoiu V, Stefancu A, Iancu SD, Moisoiu T, Loga L, Dican L, et al. SERS assessment of the cancer-specific methylation pattern of genomic DNA: Towards the detection of acute myeloid leukemia in patients undergoing hematopoietic stem cell transplantation. Anal Bioanal Chem (2019) 411:7907–13. doi: 10.1007/s00216-019-02213-2
93. Vanna R, Ronchi P, Lenferink AT, Tresoldi C, Morasso C, Mehn D, et al. Label-free imaging and identification of typical cells of acute myeloid leukaemia and myelodysplastic syndrome by raman microspectroscopy. Analyst (2015) 140:1054–64. doi: 10.1039/C4AN02127D
94. Denbigh JL, Perez-Guaita D, Vernooij RR, Tobin MJ, Bambery KR, Xu Y, et alProbing the action of a novel anti-leukaemic drug therapy at the single cell level using modern vibrational spectroscopy techniques. Sci Rep (2017) 7:2649. doi: 10.1038/s41598-017-02069-5
95. Chen S, Wang C, Zhu R, Zhu S, Zhang G. Predicting prognosis in acute myeloid leukemia patients by surface-enhanced raman spectroscopy. Nanomed (Lond) (2021) 16:1873–85. doi: 10.2217/nnm-2021-0199
96. Chen X, Li X, Yang H, Xie J, Liu A. Diagnosis and staging of diffuse large b-cell lymphoma using label-free surface-enhanced raman spectroscopy. Spectrochim Acta A Mol Biomol Spectrosc (2022) 267:120571. doi: 10.1016/j.saa.2021.120571
97. Stefancu A, Moisoiu V, Desmirean M, Iancu SD, Tigu AB, Petrushev B, et al. SERS-based DNA methylation profiling allows the differential diagnosis of malignant lymphadenopathy. Spectrochim Acta A Mol Biomol Spectrosc (2022) 264:120216. doi: 10.1016/j.saa.2021.120216
98. Iwasaki Y, Kawagishi M, Takase H, Ohno-Matsui K. Discrimination of dissociated lymphoma cells from leukocytes by raman spectroscopy. Sci Rep (2020) 10:15778. doi: 10.1038/s41598-020-72762-5
99. Bai Y, Yu Z, Yi S, Yan Y, Huang Z, Qiu L. Raman spectroscopy-based biomarker screening by studying the fingerprint characteristics of chronic lymphocytic leukemia and diffuse large b-cell lymphoma. J Pharm BioMed Anal (2020) 190:113514. doi: 10.1016/j.jpba.2020.113514
100. Iturrioz-Rodríguez N, De Pasquale D, Fiaschi P, Ciofani G. Discrimination of glioma patient-derived cells from healthy astrocytes by exploiting raman spectroscopy. Spectrochim Acta A Mol Biomol Spectrosc (2022) 269:120773. doi: 10.1016/j.saa.2021.120773
101. Ma M, Tian X, Chen F, Ma X, Guo W, Lv X. The application of feature engineering in establishing a rapid and robust model for identifying patients with glioma. Lasers Med Sci (2022) 37:1007–15. doi: 10.1007/s10103-021-03346-6
102. Koljenovic S, Choo-Smith LP, Bakker Schut TC, Kros JM, Van Den Berge HJ, Puppels GJ. Discriminating vital tumor from necrotic tissue in human glioblastoma tissue samples by raman spectroscopy. Lab Invest (2002) 82:1265–77. doi: 10.1097/01.LAB.0000032545.96931.B8
103. Kowalska AA, Berus S, Szleszkowski L, Kaminska A, Kmiecik A, Ratajczak-Wielgomas K, et al. Brain tumour homogenates analysed by surface-enhanced raman spectroscopy: Discrimination among healthy and cancer cells. Spectrochim Acta A Mol Biomol Spectrosc (2020) 231:117769. doi: 10.1016/j.saa.2019.117769
104. Jermyn M, Mok K, Mercier J, Desroches J, Pichette J, Saint-Arnaud K, et al. Intraoperative brain cancer detection with raman spectroscopy in humans. Sci Transl Med (2015) 7:274ra19. doi: 10.1126/scitranslmed.aaa2384
105. Leslie DG, Kast RE, Poulik JM, Rabah R, Sood S, Auner GW, et al. Identification of pediatric brain neoplasms using raman spectroscopy. Pediatr Neurosurg (2012) 48:109–17. doi: 10.1159/000343285
106. Aguiar RP, Silveira L Jr., Falcao ET, Pacheco MT, Zangaro RA, Pasqualucci CA. Discriminating neoplastic and normal brain tissues in vitro through raman spectroscopy: A principal components analysis classification model. Photomed Laser Surg (2013) 31:595–604. doi: 10.1089/pho.2012.3460
107. Ricci M, Ragonese F, Gironi B, Paolantoni M, Morresi A, Latterini L, et al. Glioblastoma single-cell microRaman analysis under stress treatments. Sci Rep (2018) 8:7979. doi: 10.1038/s41598-018-26356-x
108. Damron TA, Ward WG, Stewart A. Osteosarcoma, chondrosarcoma, and ewing's sarcoma: National cancer data base report. Clin Orthop Relat Res (2007) 459:40–7. doi: 10.1097/BLO.0b013e318059b8c9
109. Sakamoto A, Iwamoto Y. Current status and perspectives regarding the treatment of osteo-sarcoma: Chemotherapy. Rev Recent Clin Trials (2008) 3:228–31. doi: 10.2174/157488708785700267
110. Longhi A, Errani C, De Paolis M, Mercuri M, Bacci G. Primary bone osteosarcoma in the pediatric age: State of the art. Cancer Treat Rev (2006) 32:423–36. doi: 10.1016/j.ctrv.2006.05.005
112. Duchman KR, Gao Y, Miller BJ. Prognostic factors for survival in patients with high-grade osteosarcoma using the surveillance, epidemiology, and end results (SEER) program database. Cancer Epidemiol (2015) 39:593–9. doi: 10.1016/j.canep.2015.05.001
114. Mirabello L, Troisi RJ, Savage SA. Osteosarcoma incidence and survival rates from 1973 to 2004: data from the surveillance, epidemiology, and end results program. Cancer (2009) 115:1531–43. doi: 10.1002/cncr.24121
115. Fraumeni JF Jr. Stature and malignant tumors of bone in childhood and adolescence. Cancer (1967) 20:967–73. doi: 10.1002/1097-0142(196706)20:6<967::AID-CNCR2820200606>3.0.CO;2-P
116. Kramárová E, Stiller CA. The international classification of childhood cancer. Int J Cancer (1996) 68:759–65. doi: 10.1002/(SICI)1097-0215(19961211)68:6<759::AID-IJC12>3.0.CO;2-W
117. Bielack S, Jürgens H, Jundt G, Kevric M, Kühne T, Reichardt P, et al. Osteosarcoma: The COSS experience. In: JAFFE N, BRULAND OS, BIELACK S, editors. Pediatric and adolescent osteosarcoma. Boston, MA: Springer US (2010).
118. Ritter J, Bielack SS. Osteosarcoma. Ann Oncol (2010) 21(Suppl 7):vii320–5. doi: 10.1093/annonc/mdq276
119. Gao X, Gao B, Li S. Extracellular vesicles: A new diagnostic biomarker and targeted drug in osteosarcoma. Front Immunol (2022) 13:1002742. doi: 10.3389/fimmu.2022.1002742
120. Sharp SE, Shulkin BL, Gelfand MJ, Mccarville MB. FDG PET/CT appearance of local osteosarcoma recurrences in pediatric patients. Pediatr Radiol (2017) 47:1800–8. doi: 10.1007/s00247-017-3963-1
121. Quartuccio N, Fox J, Kuk D, Wexler LH, Baldari S, Cistaro A, et al. Pediatric bone sarcoma: diagnostic performance of 18 F-FDG PET/CT versus conventional imaging for initial staging and follow-up. AJR Am J Roentgenol (2015) 204:153–60. doi: 10.2214/AJR.14.12932
122. Wu P, Zhang B, Ocansey DKW, Xu W, Qian H. Extracellular vesicles: A bright star of nanomedicine. Biomaterials (2021) 269:120467. doi: 10.1016/j.biomaterials.2020.120467
123. Li J, Li Y, Li P, Zhang Y, Du L, Wang Y, et al. Exosome detection via surface-enhanced raman spectroscopy for cancer diagnosis. Acta Biomater (2022) 144:1–14. doi: 10.1016/j.actbio.2022.03.036
124. Hu W, Liu C, Bi ZY, Zhou Q, Zhang H, Li LL, et al. Comprehensive landscape of extracellular vesicle-derived RNAs in cancer initiation, progression, metastasis and cancer immunology. Mol Cancer (2020) 19:102. doi: 10.1186/s12943-020-01199-1
125. Yan W, Jiang S. Immune cell-derived exosomes in the cancer-immunity cycle. Trends Cancer (2020) 6:506–17. doi: 10.1016/j.trecan.2020.02.013
126. Brown HK, Schiavone K, Gouin F, Heymann MF, Heymann D. Biology of bone sarcomas and new therapeutic developments. Calcif Tissue Int (2018) 102:174–95. doi: 10.1007/s00223-017-0372-2
127. Hung PS, Kuo YC, Chen HG, Chiang HH, Lee OK. Detection of osteogenic differentiation by differential mineralized matrix production in mesenchymal stromal cells by raman spectroscopy. PloS One (2013) 8:e65438. doi: 10.1371/journal.pone.0065438
128. Klein MJ, Siegal GP. Osteosarcoma: Anatomic and histologic variants. Am J Clin Pathol (2006) 125:555–81. doi: 10.1309/UC6KQHLD9LV2KENN
129. Ranuncolo SM, Armanasco E, Cresta C, Bal De Kier J, Puricelli L. Plasma MMP-9 (92 kDa-MMP) activity is useful in the follow-up and in the assessment of prognosis in breast cancer patients. Int J Cancer (2003) 106:745–51.
130. Zhou Q, Zhu Y, Deng Z, Long H, Zhang S, Chen X. VEGF and EMMPRIN expression correlates with survival of patients with osteosarcoma. Surg Oncol (2011) 20:13–9.
131. Shih Q, Chen Y, Tsai Z, Wang YJ, Lee OK. Growth of mesenchymal stem cells on electrospun type I collagen nanofibers. Stem Cells (2006) 24:2391–7.
132. Cheng MT, Yang HW, Chen TH, Lee OK. Modulation of proliferation and differentiation of human anterior cruciate ligament-derived stem cells by different growth factors. Tissue Eng Part A (2009) 15:3979–89.
133. Heymann MF, Brown HK, Heymann D. Drugs in early clinical development for the treatment of osteosarcoma. Expert Opin Investig Drugs (2016) 25:1265–80. doi: 10.1080/13543784.2016.1237503
134. García-Berrocal JR, Nevado J, Ramírez-Camacho R, Sanz R, González-García JA, Sánchez-Rodríguez C, et al. The anticancer drug cisplatin induces an intrinsic apoptotic pathway inside the inner ear. Br J Pharmacol (2007) 152:1012–20. doi: 10.1038/sj.bjp.0707405
135. Marques Da Costa ME, Marchais A, Gomez-Brouchet A, Job B, Assoun N, Daudigeos-Dubus E, et al. In-vitro and in-vivo establishment and characterization of bioluminescent orthotopic chemotherapy-resistant human osteosarcoma models in NSG mice. Cancers (Basel) (2019) 11:997. doi: 10.3390/cancers11070997
136. Hong A, Stevens G, Stalley P, Pendlebury S, Ahern V, Ralston A, et al. Extracorporeal irradiation for malignant bone tumors. Int J Radiat Oncol Biol Phys (2001) 50:441–7. doi: 10.1016/S0360-3016(01)01460-2
137. Poffyn B, Sys G, Mulliez A, Van Maele G, Van Hoorebeke L, Forsyth R, et al. Extracorporeally irradiated autografts for the treatment of bone tumours: Tips and tricks. Int Orthop (2011) 35:889–95. doi: 10.1007/s00264-010-1098-1
138. Pui CH, Evans WE. Acute lymphoblastic leukemia. N Engl J Med (1998) 339:605–15. doi: 10.1056/NEJM199808273390907
139. Parriott G, Kee BL. E protein transcription factors as suppressors of T lymphocyte acute lymphoblastic leukemia. Front Immunol (2022) 13:885144. doi: 10.3389/fimmu.2022.885144
140. Inaba H, Greaves M, MuLLIGHAN CG. Acute lymphoblastic leukaemia. Lancet (2013) 381:1943–55. doi: 10.1016/S0140-6736(12)62187-4
141. Kato M, Manabe A. Treatment and biology of pediatric acute lymphoblastic leukemia. Pediatr Int (2018) 60:4–12. doi: 10.1111/ped.13457
142. Inaba H, Mullighan CG. Pediatric acute lymphoblastic leukemia. Haematologica (2020) 105:2524–39. doi: 10.3324/haematol.2020.247031
143. Stanulla M, Schrappe M. Treatment of childhood acute lymphoblastic leukemia. Semin Hematol (2009) 46:52–63. doi: 10.1053/j.seminhematol.2008.09.007
144. Liu T, Wen L, Yuan H, Wang Y, Yao L, Xu Y, et al. Identification of novel recurrent CPSF6-RARG fusions in acute myeloid leukemia resembling acute promyelocytic leukemia. Blood (2018) 131:1870–3. doi: 10.1182/blood-2017-11-818716
145. Ouattara FO, Laskine M, Cheong NN, Birnbaum L, Wistaff R, Bertrand M, et al. Diagnostic precision of mentally estimated home blood pressure means. Blood Press Monit (2018) 23:198–202. doi: 10.1097/MBP.0000000000000323
146. Al-Mawali A, Gillis D, Hissaria P, Lewis I. Incidence, sensitivity, and specificity of leukemia-associated phenotypes in acute myeloid leukemia using specific five-color multiparameter flow cytometry. Am J Clin Pathol (2008) 129:934–45. doi: 10.1309/FY0UMAMM91VPMR2W
147. Paredes-Aguilera R, Romero-Guzman L, Lopez-Santiago N, Burbano-Ceron L, Camacho-Del Monte O, Nieto-Martinez S. Flow cytometric analysis of cell-surface and intracellular antigens in the diagnosis of acute leukemia. Am J Hematol (2001) 68:69–74. doi: 10.1002/ajh.1155
148. Liang H, Cheng X, Dong S, Wang H, Liu E, Ru Y, et al. Rapid and non-invasive discrimination of acute leukemia bone marrow supernatants by raman spectroscopy and multivariate statistical analysis. J Pharm BioMed Anal (2022) 210:114560. doi: 10.1016/j.jpba.2021.114560
149. Peloquin GL, Chen YB, Fathi AT. The evolving landscape in the therapy of acute myeloid leukemia. Protein Cell (2013) 4:735–46. doi: 10.1007/s13238-013-3057-2
150. Amin AH, Sharifi LMA, Kakhharov AJ, Opulencia MJC, Alsaikhan F, Bokov DO, et al. Role of acute myeloid leukemia (AML)-derived exosomes in tumor progression and survival. BioMed Pharmacother (2022) 150:113009. doi: 10.1016/j.biopha.2022.113009
151. Löwenberg B. Treatment of the elderly patient with acute myeloid leukaemia. Baillieres Clin Haematol (1996) 9:147–59. doi: 10.1016/S0950-3536(96)80041-2
152. Löwenberg B, DOWNING JR, BURNETT A. Acute myeloid leukemia. N Engl J Med (1999) 341:1051–62. doi: 10.1056/NEJM199909303411407
153. Ehrlich M. DNA Hypomethylation in cancer cells. Epigenomics (2009) 1:239–59. doi: 10.2217/epi.09.33
154. Orsmark-Pietras C, Lilljebjörn H, Rissler M, Lazarevic V, Arvanitakis A, Ehinger M, et al. Comprehensive prospective next generation sequencing of acute myeloid leukemia. Blood (2015) 126:3830–0. doi: 10.1182/blood.V126.23.3830.3830
155. Chen X, Cherian S. Acute myeloid leukemia immunophenotyping by flow cytometric analysis. Clin Lab Med (2017) 37:753–69. doi: 10.1016/j.cll.2017.07.003
156. Ley TJ, Miller C, Ding L, Raphael BJ, Mungall AJ, Robertson A, et al. Genomic and epigenomic landscapes of adult de novo acute myeloid leukemia. N Engl J Med (2013) 368:2059–74. doi: 10.1056/NEJMoa1301689
157. Short NJ, Rytting ME, Cortes JE. Acute myeloid leukaemia. Lancet (2018) 392:593–606. doi: 10.1016/S0140-6736(18)31041-9
158. Yang F, Anekpuritanang T, Press RD. Clinical utility of next-generation sequencing in acute myeloid leukemia. Mol Diagn Ther (2020) 24:1–13. doi: 10.1007/s40291-019-00443-9
159. Polyatskin IL, Artemyeva AS, Krivolapov YA. [Revised WHO classification of tumors of hematopoietic and lymphoid tissues 2017 (4th edition):lymphoid tumors]. Arkh Patol (2019) 81:59–65. doi: 10.17116/patol20198103159
160. Gatta G, Zigon G, Capocaccia R, Coebergh JW, Desandes E, Kaatsch P, et al. Survival of European children and young adults with cancer diagnosed 1995-2002. Eur J Cancer (2009) 45:992–1005. doi: 10.1016/j.ejca.2008.11.042
161. Brugières L, Brice P. Lymphoma in adolescents and young adults. Prog Tumor Res (2016) 43:101–14. doi: 10.1159/000447080
162. Pulte D, Gondos A, Brenner H. Trends in survival after diagnosis with hematologic malignancy in adolescence or young adulthood in the united states 1981-2005. Cancer (2009) 115:4973–9. doi: 10.1002/cncr.24548
163. Katsara K, Psatha K, Kenanakis G, Aivaliotis M, Papadakis VM. Subtyping on live lymphoma cell lines by raman spectroscopy. Mater (Basel) (2022) 15:546. doi: 10.3390/ma15020546
164. Wright JM, Vered M. Update from the 4th edition of the world health organization classification of head and neck tumours: Odontogenic and maxillofacial bone tumors. Head Neck Pathol (2017) 11:68–77. doi: 10.1007/s12105-017-0794-1
165. Culha M, Stokes D, Vo-Dinh T. Surface-enhanced raman scattering for cancer diagnostics: detection of the BCL2 gene. Expert Rev Mol Diagn (2003) 3:669–75. doi: 10.1586/14737159.3.5.669
166. Agsalda-Garcia M, Shieh T, Souza R, Kamada N, Loi N, Oda R, et al. Raman-enhanced spectroscopy (RESpect) probe for childhood non-Hodgkin lymphoma. SciMed J (2020) 2:1–7. doi: 10.28991/SciMedJ-2020-0201-1
167. Lobo A, Lightman S. Vitreous aspiration needle tap in the diagnosis of intraocular inflammation. Ophthalmology (2003) 110:595–9. doi: 10.1016/S0161-6420(02)01895-X
168. Rau JV, Marini F, Fosca M, Cippitelli C, Rocchia M, Di Napoli A. Raman spectroscopy discriminates malignant follicular lymphoma from benign follicular hyperplasia and from tumour metastasis. Talanta (2019) 194:763–70. doi: 10.1016/j.talanta.2018.10.086
169. Force LM, Abdollahpour I, Advani SM, Agius D, Ahmadian E, Alahdab F, et al. GBD 2017 Childhood Cancer
170. Ostrom QT, Gittleman H, Farah P, Ondracek A, Chen Y, Wolinsky Y, et al. CBTRUS statistical report: Primary brain and central nervous system tumors diagnosed in the united states in 2006-2010. Neuro Oncol (2013) 15(Suppl 2):ii1–56. doi: 10.1093/neuonc/not151
171. Masui K, Mischel PS, Reifenberger G. Molecular classification of gliomas. Handb Clin Neurol (2016) 134:97–120. doi: 10.1016/B978-0-12-802997-8.00006-2
172. Ostrom QT, Gittleman H, Liao P, Vecchione-Koval T, Wolinsky Y, Kruchko C, et al. CBTRUS statistical report: Primary brain and other central nervous system tumors diagnosed in the united states in 2010-2014. Neuro Oncol (2017) 19:v1–v88. doi: 10.1093/neuonc/nox158
173. Louis DN, Perry A, Reifenberger G, Von Deimling A, Figarella-Branger D, Cavenee WK, et al. The 2016 world health organization classification of tumors of the central nervous system: A summary. Acta Neuropathol (2016) 131:803–20. doi: 10.1007/s00401-016-1545-1
174. Bergthold G, Bandopadhayay P, Bi WL, Ramkissoon L, Stiles C, Segal RA, et al. Pediatric low-grade gliomas: how modern biology reshapes the clinical field. Biochim Biophys Acta (2014) 1845:294–307. doi: 10.1016/j.bbcan.2014.02.004
175. Davis ME. Epidemiology and overview of gliomas. Semin Oncol Nurs (2018) 34:420–9. doi: 10.1016/j.soncn.2018.10.001
176. Mcneill KA. Epidemiology of brain tumors. Neurol Clin (2016) 34:981–98. doi: 10.1016/j.ncl.2016.06.014
177. Van Den Bent MJ. Interobserver variation of the histopathological diagnosis in clinical trials on glioma: A clinician's perspective. Acta Neuropathol (2010) 120:297–304. doi: 10.1007/s00401-010-0725-7
178. Packer RJ, Pfister S, Bouffet E, Avery R, Bandopadhayay P, Bornhorst M, et al. Pediatric low-grade gliomas: implications of the biologic era. Neuro Oncol (2017) 19:750–61. doi: 10.1093/neuonc/now209
179. Bandopadhayay P, Bergthold G, London WB, Goumnerova LC, Morales La Madrid A, Marcus KJ, et al. Long-term outcome of 4,040 children diagnosed with pediatric low-grade gliomas: An analysis of the surveillance epidemiology and end results (SEER) database. Pediatr Blood Cancer (2014) 61:1173–9. doi: 10.1002/pbc.24958
180. Packer RJ. Primary central nervous system tumors in children. Curr Treat Options Neurol (1999) 1:395–408. doi: 10.1007/s11940-996-0003-0
181. Jones C, Karajannis MA, Jones DTW, Kieran MW, Monje M, Baker SJ, et al. Pediatric high-grade glioma: Biologically and clinically in need of new thinking. Neuro Oncol (2017) 19:153–61. doi: 10.1093/neuonc/now101
182. Lacroix M, Abi-Said D, Fourney DR, Gokaslan ZL, Shi W, Demonte F, et al. A multivariate analysis of 416 patients with glioblastoma multiforme: Prognosis, extent of resection, and survival. J Neurosurg (2001) 95:190–8. doi: 10.3171/jns.2001.95.2.0190
183. Balss J, Meyer J, Mueller W, Korshunov A, Hartmann C, Von Deimling A. Analysis of the IDH1 codon 132 mutation in brain tumors. Acta Neuropathol (2008) 116:597–602. doi: 10.1007/s00401-008-0455-2
184. Uckermann O, Yao W, Juratli TA, Galli R, Leipnitz E, Meinhardt M, et al. IDH1 mutation in human glioma induces chemical alterations that are amenable to optical raman spectroscopy. J Neurooncol (2018) 139:261–8. doi: 10.1007/s11060-018-2883-8
185. Daoust F, Nguyen T, Orsini P, Bismuth J, De Denus-Baillargeon MM, Veilleux I, et al. Handheld macroscopic raman spectroscopy imaging instrument for machine-learning-based molecular tissue margins characterization. J BioMed Opt (2021) 26. doi: 10.1117/1.JBO.26.2.022911
186. Sweet-Cordero EA, Biegel JA. The genomic landscape of pediatric cancers: Implications for diagnosis and treatment. Science (2019) 363:1170–5. doi: 10.1126/science.aaw3535
187. Moleti ML, Al-Hadad SA, Al-Jadiry MF, Al-Darraji AF, Al-Saeed RM, De Vellis A, et al. Treatment of children with b-cell non-Hodgkin lymphoma in a low-income country. Pediatr Blood Cancer (2011) 56:560–7. doi: 10.1002/pbc.22905
188. Cervio C, Barsotti D, Ibanez J, Paganini H, Sara Felice M, Chantada GL. Early mortality in children with advanced mature b-cell malignancies in a middle-income country. J Pediatr Hematol Oncol (2012) 34:e266–70. doi: 10.1097/MPH.0b013e31826226b1
189. Howard SC, Zaidi A, Cao X, Weil O, Bey P, Patte C, et al. The my child matters programme: effect of public-private partnerships on paediatric cancer care in low-income and middle-income countries. Lancet Oncol (2018) 19:e252–66. doi: 10.1016/S1470-2045(18)30123-2
190. Ogwang MD, Zhao W, Ayers LW, Mbulaiteye SM. Accuracy of burkitt lymphoma diagnosis in constrained pathology settings: importance to epidemiology. Arch Pathol Lab Med (2011) 135:445–50. doi: 10.5858/2009-0443-EP.1
191. Orem J, Sandin S, Weibull CE, Odida M, Wabinga H, Mbidde E, et al. Agreement between diagnoses of childhood lymphoma assigned in Uganda and by an international reference laboratory. Clin Epidemiol (2012) 4:339–47. doi: 10.2147/CLEP.S35671
192. Lam CG, Howard SC, Bouffet E, Pritchard-Jones K. Science and health for all children with cancer. Science (2019) 363:1182–6. doi: 10.1126/science.aaw4892
193. Meyer JS, Nadel HR, Marina N, Womer RB, Brown KL, Eary JF, et al. Imaging guidelines for children with Ewing sarcoma and osteosarcoma: A report from the children's oncology group bone tumor committee. Pediatr Blood Cancer (2008) 51:163–70. doi: 10.1002/pbc.21596
194. Abati S, Bramati C, Bondi S, Lissoni A, Trimarchi M. Oral cancer and precancer: A narrative review on the relevance of early diagnosis. Int J Environ Res Public Health (2020) 17:9160. doi: 10.3390/ijerph17249160
195. Zhang J, Shi J, Zhang H, Zhu Y, Liu W, Zhang K, et al. Localized fluorescent imaging of multiple proteins on individual extracellular vesicles using rolling circle amplification for cancer diagnosis. J Extracell Vesicles (2020) 10:e12025. doi: 10.1002/jev2.12025
196. Qiu X, Wu X, Fang X, Fu Q, Wang P, Wang X, et al. Raman spectroscopy combined with deep learning for rapid detection of melanoma at the single cell level. Spectrochim Acta A Mol Biomol Spectrosc (2023) 286:122029. doi: 10.1016/j.saa.2022.122029
197. Barton SJ, Ward TE, Bryan M. Algorithm for optimal denoising of raman spectra. Anal Methods (2018) 10:3759–69. doi: 10.1039/C8AY01089G
198. Depciuch J, Kaznowska E, Zawlik I, Wojnarowska R, Cholewa M, Heraud P, et al. Application of raman spectroscopy and infrared spectroscopy in the identification of breast cancer. Appl Spectrosc (2016) 70:251–63. doi: 10.1177/0003702815620127
199. Byrne HJ, Behl I, Calado G, Ibrahim O, Toner M, Galvin S, et al. Biomedical applications of vibrational spectroscopy: Oral cancer diagnostics. Spectrochim Acta A Mol Biomol Spectrosc (2021) 252:119470. doi: 10.1016/j.saa.2021.119470
200. Barnas E, Skret-Magierlo J, Skret A, Kaznowska E, Depciuch J, Szmuc K, et al. Simultaneous FTIR and raman spectroscopy in endometrial atypical hyperplasia and cancer. Int J Mol Sci (2020) 21:4828. doi: 10.3390/ijms21144828
201. Depciuch J, Tolpa B, Witek P, Szmuc K, Kaznowska E, Osuchowski M, et al. Raman and FTIR spectroscopy in determining the chemical changes in healthy brain tissues and glioblastoma tumor tissues. Spectrochim Acta A Mol Biomol Spectrosc (2020) 225:117526. doi: 10.1016/j.saa.2019.117526
Keywords: Raman spectroscopy, pediatric cancer, application, diagnosis, treatment
Citation: Li C, Feng C, Xu R, Jiang B, Li L, He Y, Tu C and Li Z (2023) The emerging applications and advancements of Raman spectroscopy in pediatric cancers. Front. Oncol. 13:1044177. doi: 10.3389/fonc.2023.1044177
Received: 15 September 2022; Accepted: 18 January 2023;
Published: 06 February 2023.
Edited by:
Shengwen Calvin Li, Children’s Hospital of Orange County, United StatesReviewed by:
Hugh James Byrne, Technological University Dublin, IrelandCopyright © 2023 Li, Feng, Xu, Jiang, Li, He, Tu and Li. This is an open-access article distributed under the terms of the Creative Commons Attribution License (CC BY). The use, distribution or reproduction in other forums is permitted, provided the original author(s) and the copyright owner(s) are credited and that the original publication in this journal is cited, in accordance with accepted academic practice. No use, distribution or reproduction is permitted which does not comply with these terms.
*Correspondence: Chao Tu, dHVjaGFvQGNzdS5lZHUuY24=; Zhihong Li, bGl6aGlob25nQGNzdS5lZHUuY24=
Disclaimer: All claims expressed in this article are solely those of the authors and do not necessarily represent those of their affiliated organizations, or those of the publisher, the editors and the reviewers. Any product that may be evaluated in this article or claim that may be made by its manufacturer is not guaranteed or endorsed by the publisher.
Research integrity at Frontiers
Learn more about the work of our research integrity team to safeguard the quality of each article we publish.