 Qinggan Ni
 Xia Li
 Hua Huang4
94% of researchers rate our articles as excellent or good
Learn more about the work of our research integrity team to safeguard the quality of each article we publish.
Find out more
ORIGINAL RESEARCH article
Front. Oncol., 24 March 2023
Sec. Skin Cancer
Volume 13 - 2023 | https://doi.org/10.3389/fonc.2023.1015358
This article is part of the Research Topic365 Days of Progress In Skin CancerView all 4 articles
Background: It has been established that the scavenger receptor class A member 5 (SCARA5) functions as a tumor suppressor gene in various cancer types. To our knowledge, no comprehensive study has hitherto investigated the expression and function of SCARA5 in melanoma. This study aimed to determine the association between SCARA5 and melanoma.
Methods: Analysis of SCARA5 mRNA expression was performed using The Cancer Genome Atlas (TCGA) data sets. To evaluate the clinical significance of SCARA5, the clinical data of 93 patients with melanoma were collected. The role of SCARA5 expression in prognosis was also analyzed. In this study, survival was evaluated by Kaplan–Meier analysis and compared using the log-rank test. Univariate and multivariate Cox proportional hazard regression analyses were used to identify independent predictors. The Kyoto Encyclopedia of Genes and Genomes, Gene Ontology, and gene set enrichment analysis (GSEA) were used to perform gene set functional annotations. Protein–protein interaction (PPI) networks were constructed to illustrate gene–gene interactions. The Tumor IMmune Estimation Resource (TIMER) database was used to explore the association between SCARA5 and immune infiltration levels.
Results: The results showed that the SCARA5 mRNA expression in melanoma was significantly lower than in adjacent normal skin tissue (p < 0.001). Moreover, decreased expression of SCARA5 in melanoma correlated with the tumor, node, and metastasis (TNM) stage and recurrence (p < 0.05). The overall survival (OS) was significantly higher in melanoma with high SCARA5 expression compared with low SCARA5 expression (p < 0.001). During univariate analysis, SCARA5 expression, tumor (T) stage, node (N) stage, metastasis (M) stage, and recurrence correlated with OS (p < 0.05). Further multivariate Cox regression analysis showed that SCARA5 expression (p = 0.012) could be an independent prognostic factor for OS in cutaneous malignant melanoma. GSEA analysis showed that SCARA5 was significantly enriched in various pathways, such as response to developmental biology and response to antimicrobial peptides. Correlation analysis showed a positive correlation with CD8+ T cells, CD4+ T cells, macrophages, neutrophils, and dendritic cells (p < 0.05), and a negative correlation with tumor purity (p < 0.05)
Conclusion: SCARA5 has significant potential as a prognostic biomarker and as a promising therapeutic target in melanoma. Furthermore, SCARA5 expression in melanoma is related to the level of immune infiltration.
Malignant melanoma (MM) is a highly malignant tumor originating from epidermal melanocytes that has the characteristics of early metastasis, a high degree of malignancy, rapid development, poor prognosis, and high mortality (1). Over the past 30 years, the incidence of melanoma in the world has risen rapidly, and diagnoses tend to occur in younger people (2, 3). Although malignant melanoma accounts for less than 5% of total skin cancer incidence, it has an extremely high mortality rate, accounting for approximately 75% of all skin cancer mortality (4). U.S. researchers predicted 100,350 new melanoma diagnoses by 2020, with an estimated 6,850 deaths from the disease (5). At present, the pathogenesis of malignant melanoma remains unclear. The treatment approach for malignant melanoma is mainly based on local surgical resection combined with systemic radiotherapy, chemotherapy, immunotherapy, and tumor-targeted gene therapy (6). However, the overall treatment effect is not ideal, owing to the risk of early metastasis in malignant melanoma and the poor sensitivity of radiotherapy and chemotherapy (7, 8). With the rapid development of modern biomedicine, the application of new effective treatment methods such as biomedical approaches and tumor-targeted therapy has broadened the therapeutic landscape for treating malignant melanoma. Therefore, effective molecular markers and biological therapeutic targets can play an important role in diagnosing and treating malignant melanoma (9).
Scavenger receptor class A member 5 (SCARA5) is a member of the scavenger receptor (SR) family. The full-length gene is 3.644kb, encoding 495 amino acids and located on chromosome 8 (10). SCARA5 is a type II transmembrane glycoprotein that binds to a variety of anionic ligands including low-density lipoprotein, serum ferritin, polynucleotides, bacterial metabolites, and modified extracellular matrix proteins. SCARA5 is a kind of tumor suppressor gene, and its expression is downregulated in many kinds of tumor cells and tissues. Upregulation of SCARA5 can significantly inhibit the proliferation, cloning, invasion, and migration of the tumor cell (11–16). In addition, SCARA5 is involved in iron metabolism and plays an important role in autoimmune diseases (17, 18). Huang et al. found that overexpression of SCARA5 in liver cancer cells can inhibit tumorigenicity, cell invasion, and metastasis (11). Furthermore, SCARA5 inhibits breast cancer cell proliferation, colony formation, invasion, and migration by inhibiting the phosphorylation of AKT, STAT3, and ERK1/2 and also induces breast cancer cell apoptosis (19). Therefore, the application of SCARA5 has significant potential as a tumor suppressor.
No study has hitherto reported the effect of SCARA5 on malignant melanoma. Accordingly, our current study focused on the association of SCARA5 with prognosis in cutaneous malignant melanoma. We studied and analyzed three microarray data sets from the Gene Expression Omnibus (GEO) containing expression data from melanoma cancer tissue and adjacent normal skin tissue. Differentially expressed genes (DEGs) were identified by Gene Expression Omnibus 2 Recovery (GEO2R), and protein–protein interaction (PPI) networks were subsequently constructed to identify highly connected hub genes. Then, pathway analysis was performed by Gene Ontology (GO), gene set enrichment analysis (GSEA), and the Kyoto Encyclopedia of Genes and Genomes (KEGG). The relationship between SCARA5 expression and tumor-infiltrating immune cells was analyzed using the Tumor IMmune Estimation Resource (TIMER). We found that high SCARA5 expression correlated with longer overall survival (OS) in melanoma patients, and SCARA5 was an independent prognostic factor for OS in melanoma patients. This study suggests that SCARA5 may serve as a therapeutic target and prognostic indicator for cutaneous melanoma.
The data analyzed in this study were downloaded from the GEO database (http://www.ncbi.nlm.nih.gov/geo) (20), a global gene expression database created by NCBI that contains high-throughput gene expression from research institutions’ gene expression data. We selected three RNA arrays, GSE7553 (21), GSE15605 (22), and GSE100050 (23), as data sets from the GEO database GLP570 platform [(HG-U133_Plus_2) Affymetrix Human Genome U133 Plus 2.0 Array]. The GSE7553 data set consisted of 87 samples (including 82 tumor samples and five normal skin tissue samples), the GSE15605 data set consisted of 74 samples (including 46 primary melanoma, 12 metastatic lesions, and 16 normal skin samples for full genome expression profiling), and there were 12 samples in the GSE100050 data set (including six tumor samples and six normal skin tissues). The number of patients in The Cancer Genome Atlas (TCGA)-Genotype-Tissue Expression (GTEx)-Skin cutaneous melanoma (SKCM) data set was 1,282, comprising normal GTEx (n = 812), TCGA para-cancer (n = 1), and TCGA tumors (n = 469).
Differentially expressed genes between cutaneous malignant melanoma cancer tissue samples and non-cancer samples were screened using the GEO2R tool (http://www.ncbi.nlm.nih.gov/geo/geo2r). GEO2R is an interactive web tool that can compare two or more GEO data sets. To identify DEGs, we applied adjusted (adj.) p-values and thresholds to the Benjamini and Hochberg false discovery rates to balance the limitations of finding (statistically) significant genes and false positives. Probe sets that lacked corresponding gene symbols were eliminated, and genes that exhibited multiple probe sets were eliminated. The criteria for significant DEGs included a log-fold change (FC) <1 and adj. p <0.01.
Driver and Vehicle Information Database (DAVID) (http://david.ncifcrf.gov) (version 6.7) (24), an online bioinformatics database with comprehensive analysis tools, was used to conduct KEGG/GO and GSEA analyses of the DEGs. The biological information was extracted by conducting functional annotation of genes and proteins. KEGG is a database that can be used to better understand the biological functions of DEGs (25). GO analysis was used to gain biological insights into the functional role of genes. GSEA enrichment results were visualized using the ggplot2 package.
Interactions among differential genes and PPI network predictions in this study were performed using the Search Tool for the Retrieval of Interacting Genes/Proteins (STRING; http://string-db.org) (26) online database. The functions of and interactions between proteins were further analyzed by predicting related PPI networks, which can be used to elucidate the pathogenesis of various diseases.
We constructed a PPI network of related DEGs using the online STRING database, and only protein interactions with a composite score of >0.4 were considered statistically significant. The open-source bioinformatics software Cytoscape (version 3.4.0) was used to visualize the molecular interaction network mapping (27). It has been established that the Molecular Complex Detection (MCODE v1.4.2) plug-in from Cytoscape can cluster a given network based on the topology to find densely connected regions (28). Cytoscape was used to draw the PPI network and MCODE to identify the most important modules in the network. The selection criteria were MCODE score >5, degree cutoff = 2, node score cutoff = 0.2, max depth = 100, and k-score = 2. Finally, KEGG and GO analyses were performed on the genes using DAVID.
To verify SCARA5 expression in human skin cutaneous melanoma (SKCM), tissue samples from 93 SKCM patients who had not received chemotherapy or radiotherapy were harvested in the Department of Pathology, Nantong University Affiliated Hospital, including paired adjacent non-tumor and tumor SKCM specimens. Fresh samples of resected SKCM tumor tissue and adjacent non-tumor tissue were harvested and stored in liquid nitrogen. Two professional pathologists independently confirmed the tumor grade and histological type of all tissue samples. All patients with cutaneous malignant melanoma provided informed consent, and this study was approved by the Human Research Ethics Committee of the Affiliated Hospital of Nantong University (Nantong, China).
We used the tissue microarray (TMA) system (Quick-Ray, UT06; UNITMA, Seoul, Korea) of the Department of Clinical Pathology, Affiliated Hospital of Nantong University, based on immunohistochemical staining to assess the expression of SCARA5 in SKCM. Pathological biopsies of core tissue approximately 2 mm in diameter were obtained from individual paraffin-embedded sections and sequentially arranged in recipient paraffin blocks. TMA blocks were sectioned with a microtome to obtain 4 μm-thick sections placed on glass slides. Hematoxylin and eosin staining was used for quality control in the TMA analysis. Tissue sections were fractionally deparaffinized and rehydrated in graded concentrations of ethanol. Antigen retrieval was performed by boiling the sections in an ethylenediaminetetraacetic acid (EDTA) buffer (pH 6.0) in a pressure cooker for 3 min. Endogenous peroxidase activity was then quenched with 3% hydrogen peroxide for 30 minutes. Sections were then incubated with a SCARA5-specific polyclonal antibody (1:50 dilution; Abcam) overnight at 4°C, followed by the biotinylated anti-rabbit secondary antibody for 30 minutes at 37°C. The slides were then treated with a horseradish peroxidase solution and 3,3-diaminobenzidine chromogen, followed by counterstaining with hematoxylin. Tumor and non-tumor tissues were examined for SCARA5 staining in a blinded fashion. Three fields of view were selected to examine the proportion of positive cells and the intensity of cell staining. Immunohistochemical staining was assessed based on the immunoreactivity score (IRS), assessed by the staining intensity and the proportion of positive cells. Intensity scores were as follows: 0 (negative), 1 (weakly positive), 2 (moderately positive), and 3 (strongly positive). Quantitative scores for the proportion of SCARA5-positive cells were recorded according to four categories: 1 (0%–25%), 2 (26%–50%), 3 (51%–75%), and 4 (76%–100%). The IRS (product of intensity score and numerical score) ranged from 0 to 12: an IRS of 0–3 and 4–12 represented low and high SCARA5 expression, respectively.
Statistical analysis was performed using Statistical Product and Service Solutions (SPSS) 20.0 and GraphPad Prism 8.0 software. Differences between the two groups were analyzed by a two-tailed Student’s t-test, and quantitative data were presented as mean ± SD. Categorical data were analyzed using a Chi-squared test. A p-value of <0.05 was considered statistically significant.
Data sets GSE7553, GSE15605, and GSE100050 were downloaded from the GEO database through the GEO query package, and the probes corresponding to multiple molecules were removed (29–31). Only the probe with the largest signal value was retained when encountering probes corresponding to the same molecule. After filtering the data, we used the ComBat function of the sva package to eliminate the inter-batch difference. The 173 samples from the three data sets were divided into two groups, comprising 146 samples in the tumor group and 27 samples in the normal group. Volcano plots were used to visualize the significant differential genes with a threshold of |log FC| ≥1 and a p-value ≤0.05. First, the DEGs were analyzed by the “Limma” software package and visualized in a volcano plot where SCARA5 was marked (Figure 1A). The two groups of samples were clearly separated, indicating significant differences between both groups (Figure 1B). A total of 48 DEGs were identified in the three data sets, consisting of nine downregulated and 39 upregulated genes (Figure 1C).
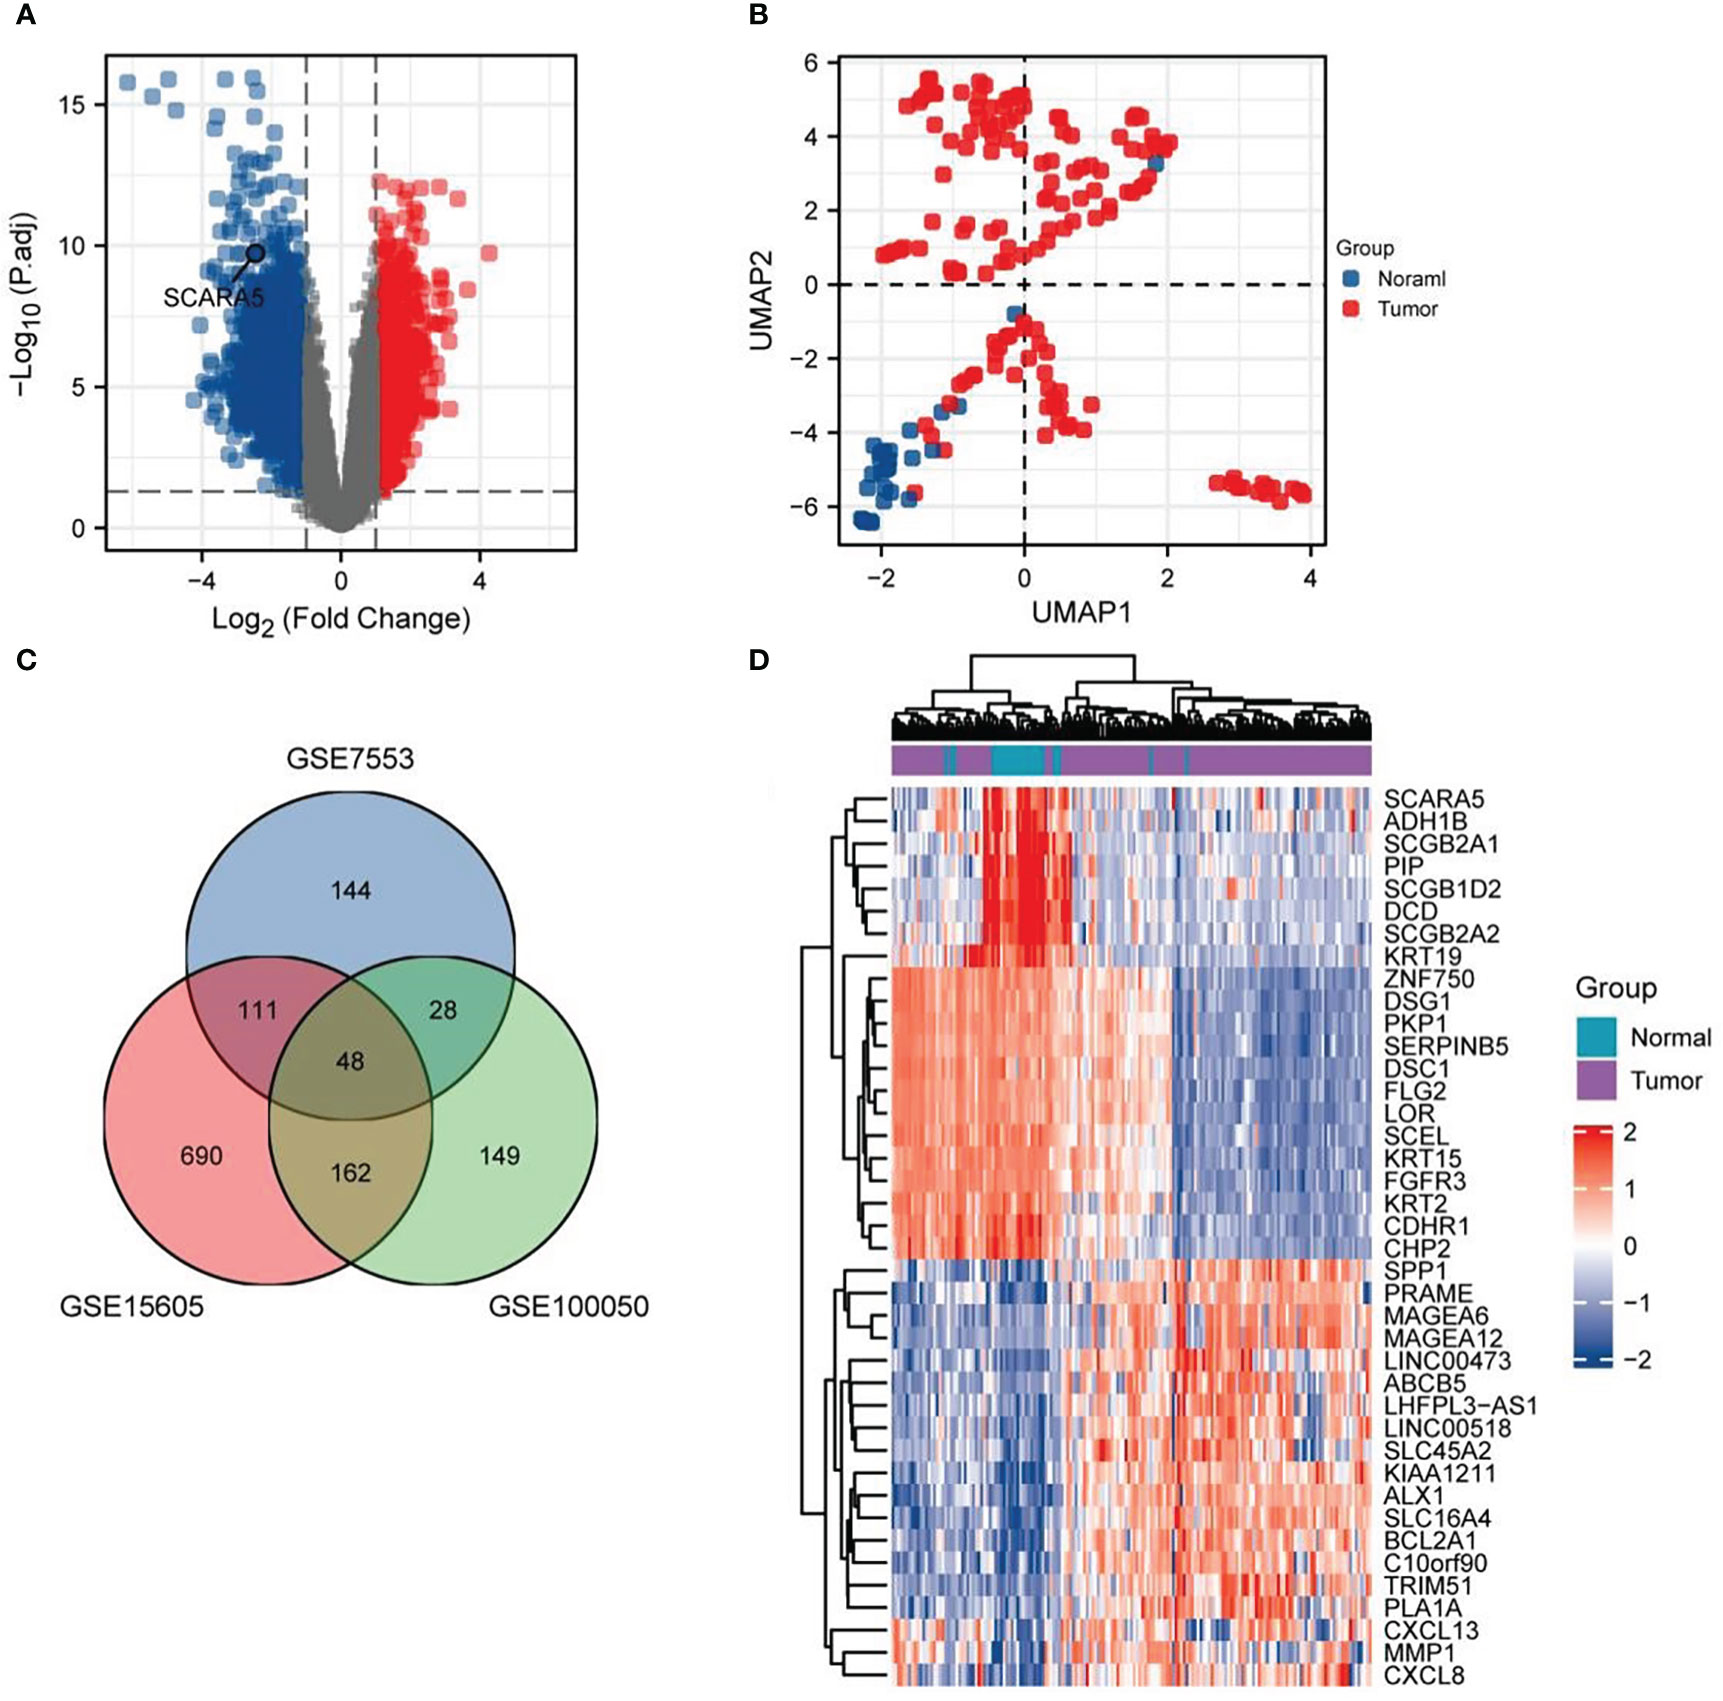
Figure 1 Difference analysis. Volcano plots were used to select differential genes with a threshold oflog FC≥ 1 and a p-value ≤ 0.05. Firstly, the differentially expressed gene (DEG) is analyzed by the “Limma” software package, the classic volcano diagram is presented in the form of a volcano diagram, and the location of scavenger receptor class A member 5 (SCARA5) is marked (A). Two groups of samples are separated, indicating that the differences between groups is significant, and the subsequent difference analysis is meaningful (B). There are 48 DEGs in the three data sets, comprising nine downregulated and 39 upregulated genes (C). Using the differential expression analysis tool DESeq2, we analyzed the top 20 upregulated and downregulated genes in both cancer tissues and adjacent normal tissues (D).
The R package “cluster Profiler” was used for the enrichment analysis of the 48 DEGs. Using the screening criteria adj. p ≤0.05 and q-value ≤0.2, significantly enriched biological processes (BPs, n = 5), cellular components (CCs, n = 4), molecular functions (MFs, n = 5), and KEGG pathways (n = 2) were identified (Figure 2A). Significantly enriched BPs comprised positive regulation of lymphocyte migration, keratinocyte differentiation, regulation of lymphocyte chemotaxis, positive regulation of lymphocyte chemotaxis, and skin development (Figure 2B). Moreover, the DEGs were significantly enriched in CCs, including the extracellular matrix component, keratin filament, apicolateral plasma membrane, and cornified envelope (Figure 2C). In terms of MF, oxidoreductase activity, acting on single donors with incorporation of molecular oxygen, incorporation of two atoms of oxygen, cytokine activity, chemokine activity, chemokine receptor binding, and receptor–ligand activity were enriched (Figure 2D). Finally, the DEGs were involved in two KEGG signaling pathways: viral protein interaction with cytokine and cytokine receptor, and ECM-receptor interaction (Figure 2E). Subsequently, the ggplot2 package was used to visualize the GSEA enrichment results (Figures 2F–I) using the threshold false discovery rate (FDR) of <0.25 and adjusted p-value of <0.05. The enrichment scores of the GSEA gene sets can be visualized in the enrichment plots (Figures 2J–W).
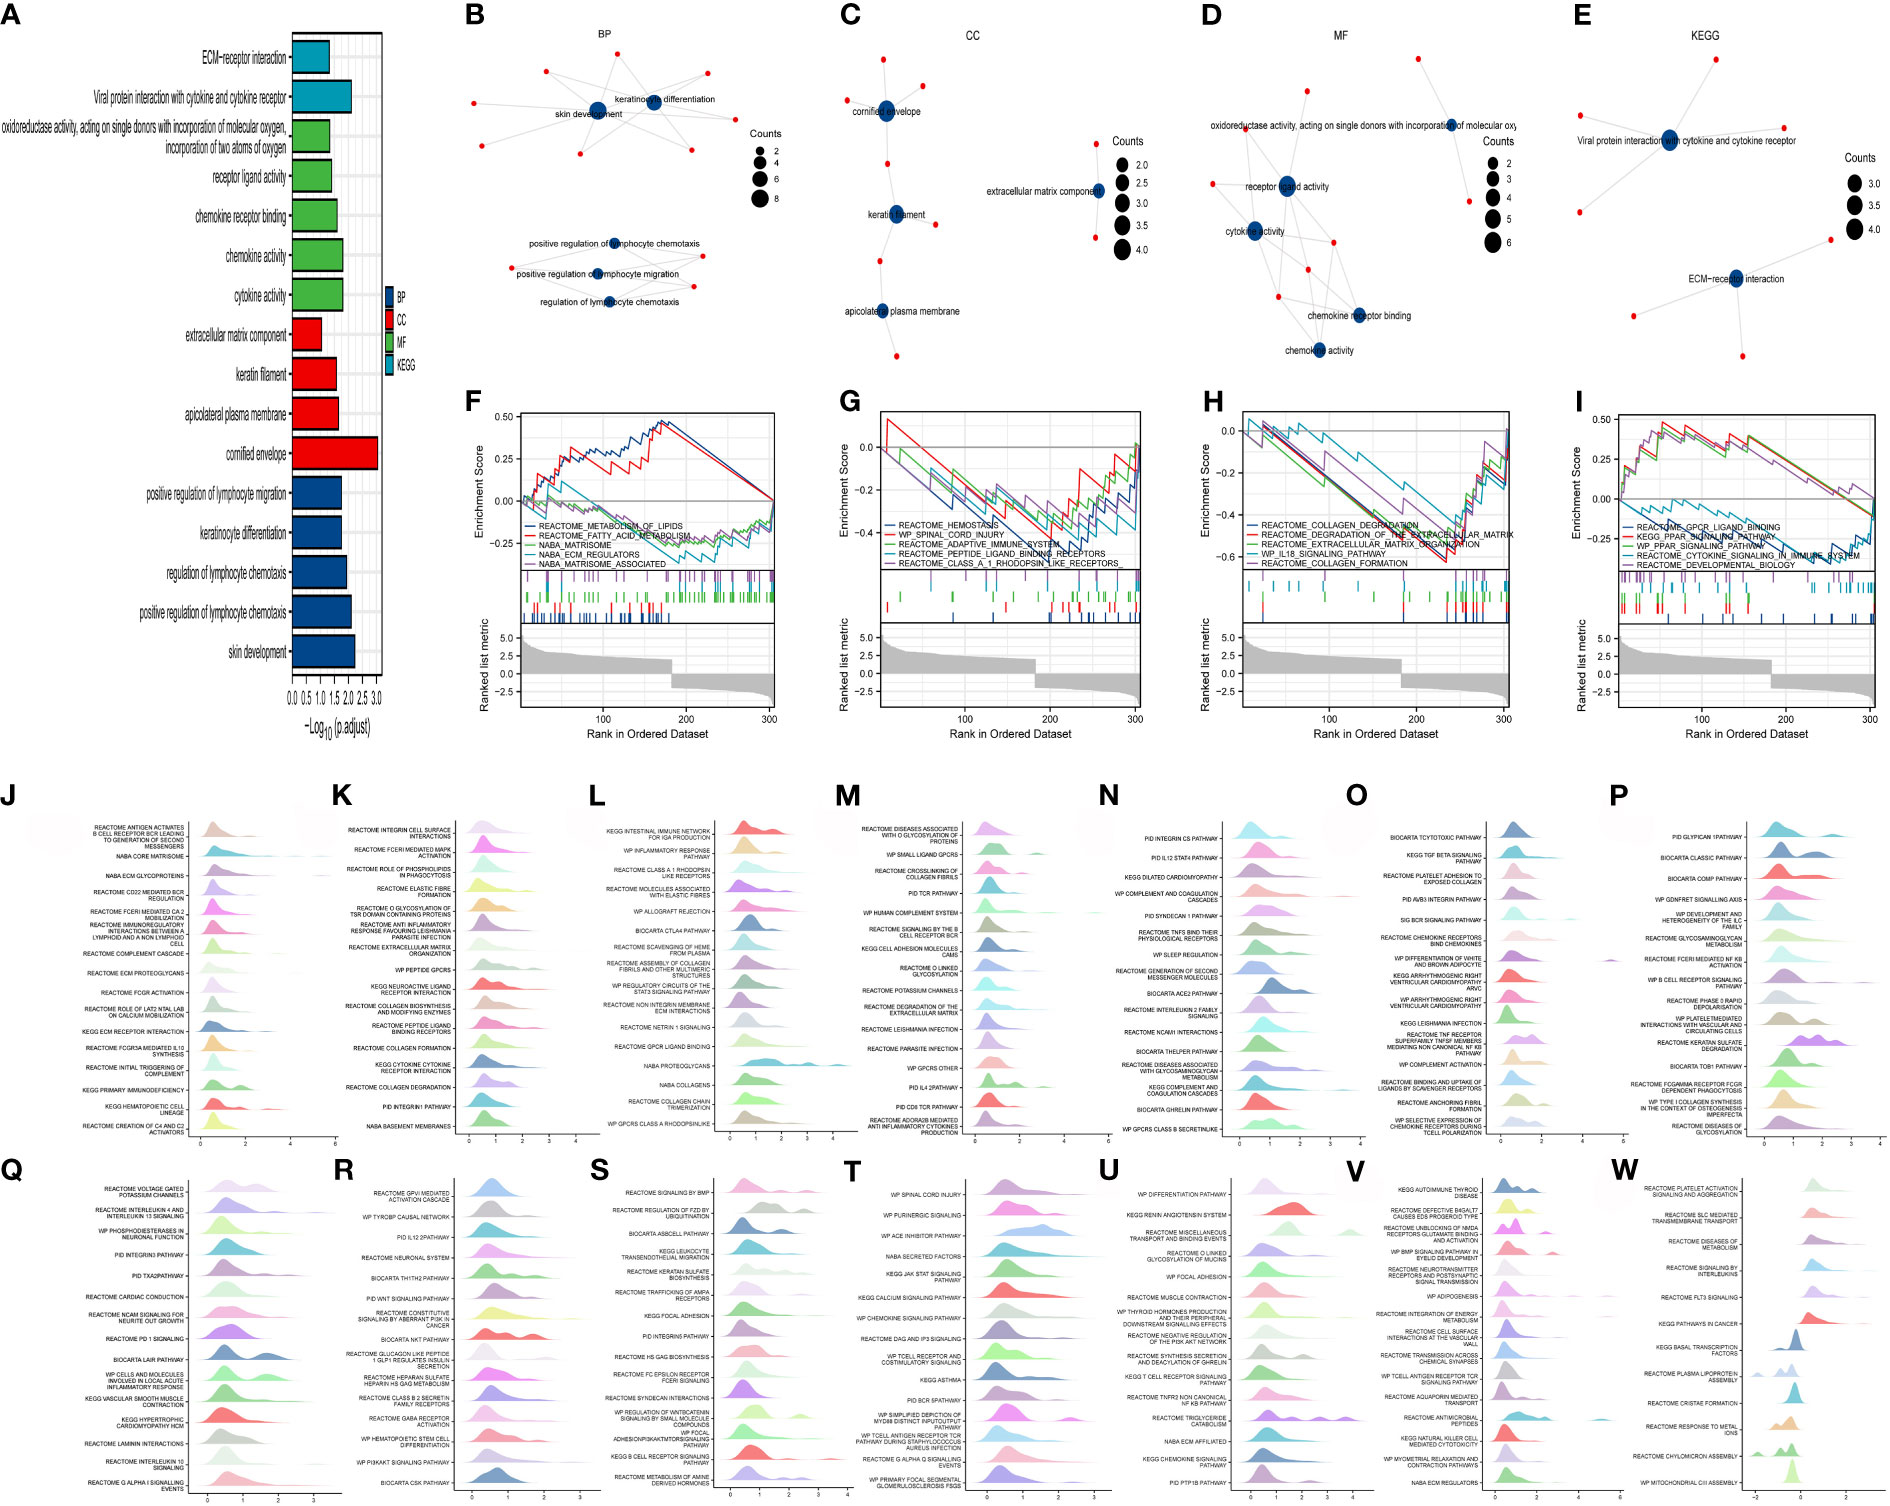
Figure 2 Perform enrichment analysis on 48 differentially expressed genes using the “Cluster Profiler” R package. Under the conditions of adjusted (adj.) p ≤ 0.05 and q-value ≤ 0.2, there are five biological processes (BPs), four CCs, five molecular functions (MFs), and two Kyoto Encyclopedia of Genes and Genomes (KEGG) pathways (A). The BPs are positive regulation of lymphocyte migration, keratinocyte differentiation, regulation of lymphocyte chemotaxis, positive regulation of lymphocyte chemotaxis, and skin development (B). The CCs are extracellular matrix component, keratin filament, apicolateral plasma membrane, and cornified envelope (C). The MFs are oxidoreductase activity, acting on single donors with incorporation of molecular oxygen, incorporation of two atoms of oxygen, cytokine activity, chemokine activity, chemokine receptor binding, and receptor ligand activity (D). The two KEGG pathways are viral protein interaction with cytokine and cytokine receptor, and ECM–receptor interaction (E). The ggplot2 package was used for gene set enrichment analysis (GSEA). The top 20 pathways mainly enriched by the differentially expressed genes. (F–I), and “ggplot2” was used to set the threshold for significant enrichment as follows: false discovery rate (FDR) < 0.25 and adjust. p < 0.05 GSEA gene sets are listed in the form of mountain plots (J–W).
The established DEG-related PPI networks were visualized using the R packages igraph and ggraph (32) (Figure 3A), with the most important module shown in Figure 3B. Genes with high correlation coefficients were significantly enriched in skin development, positive regulation of lymphocyte chemotaxis, regulation of lymphocyte chemotaxis, keratinocyte differentiation, positive regulation of lymphocyte migration, cornified envelope, apicolateral plasma membrane, keratin filament, extracellular matrix component, cytokine activity, chemokine activity, chemokine receptor binding, receptor–ligand activity, oxidoreductase activity, acting on single donors with incorporation of molecular oxygen, incorporation of two atoms of oxygen, viral protein interaction with cytokine and cytokine receptor, and ECM–receptor interaction (Table 1).
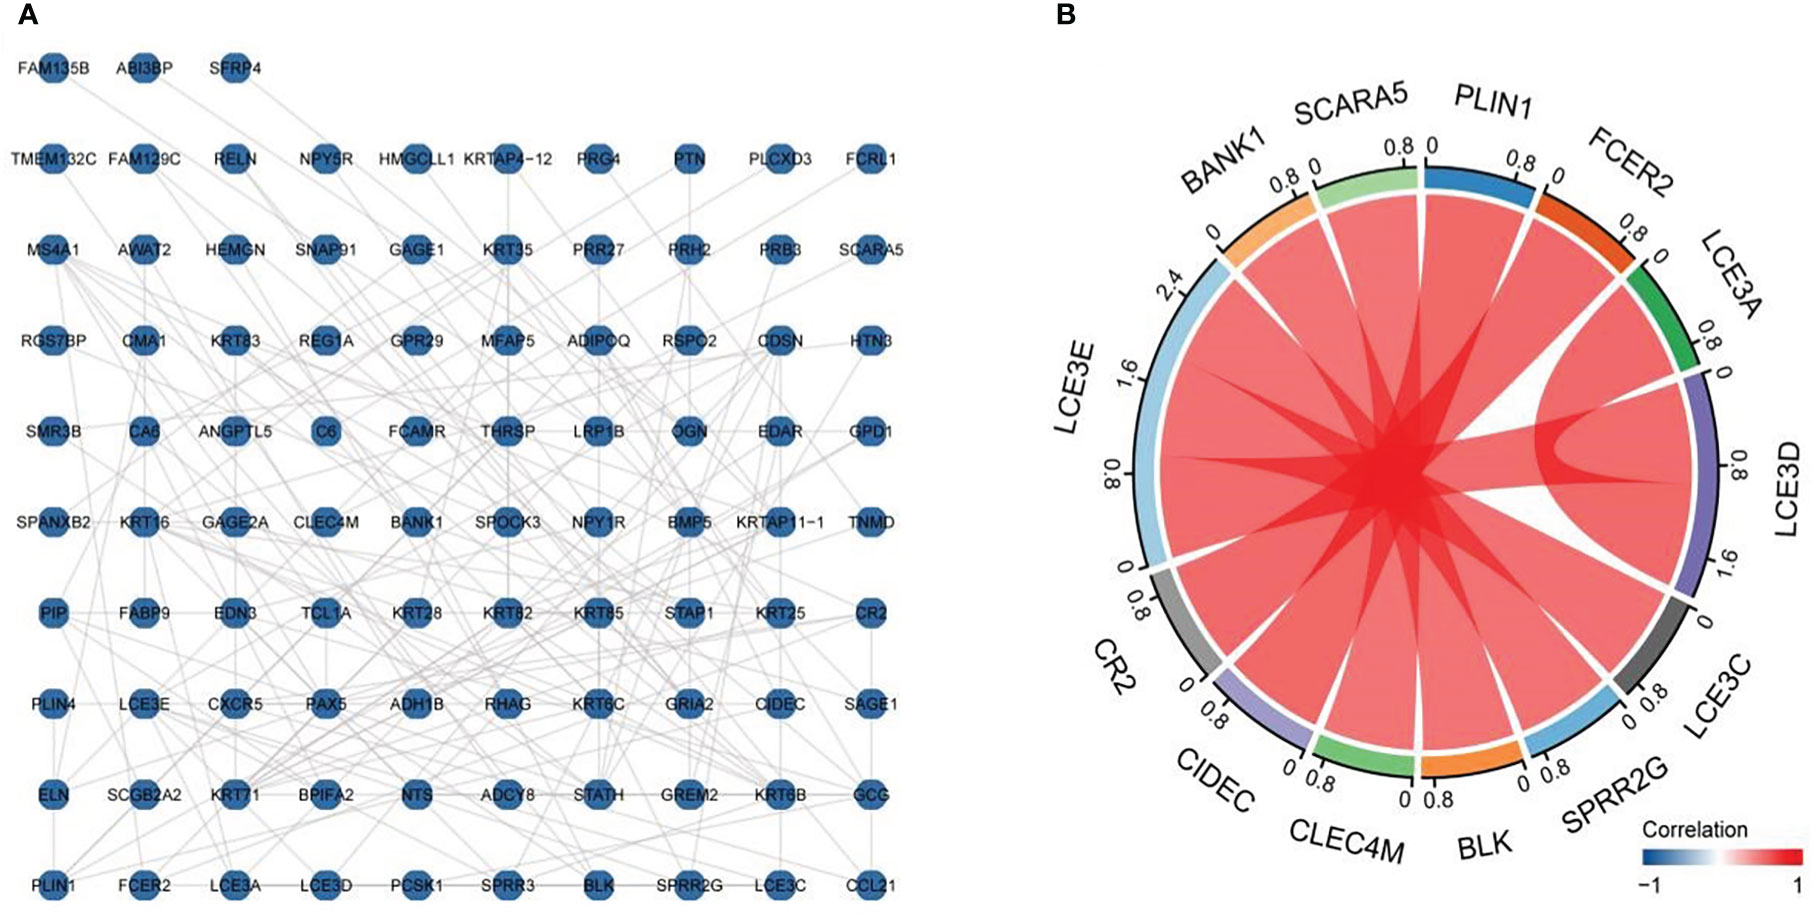
Figure 3 Protein–protein interaction (PPI) network diagram and important modules. The established differentially expressed gene (DEG)-related PPI networks were visualized using the igraph and ggraph packages (A), with the most important module shown in (B).
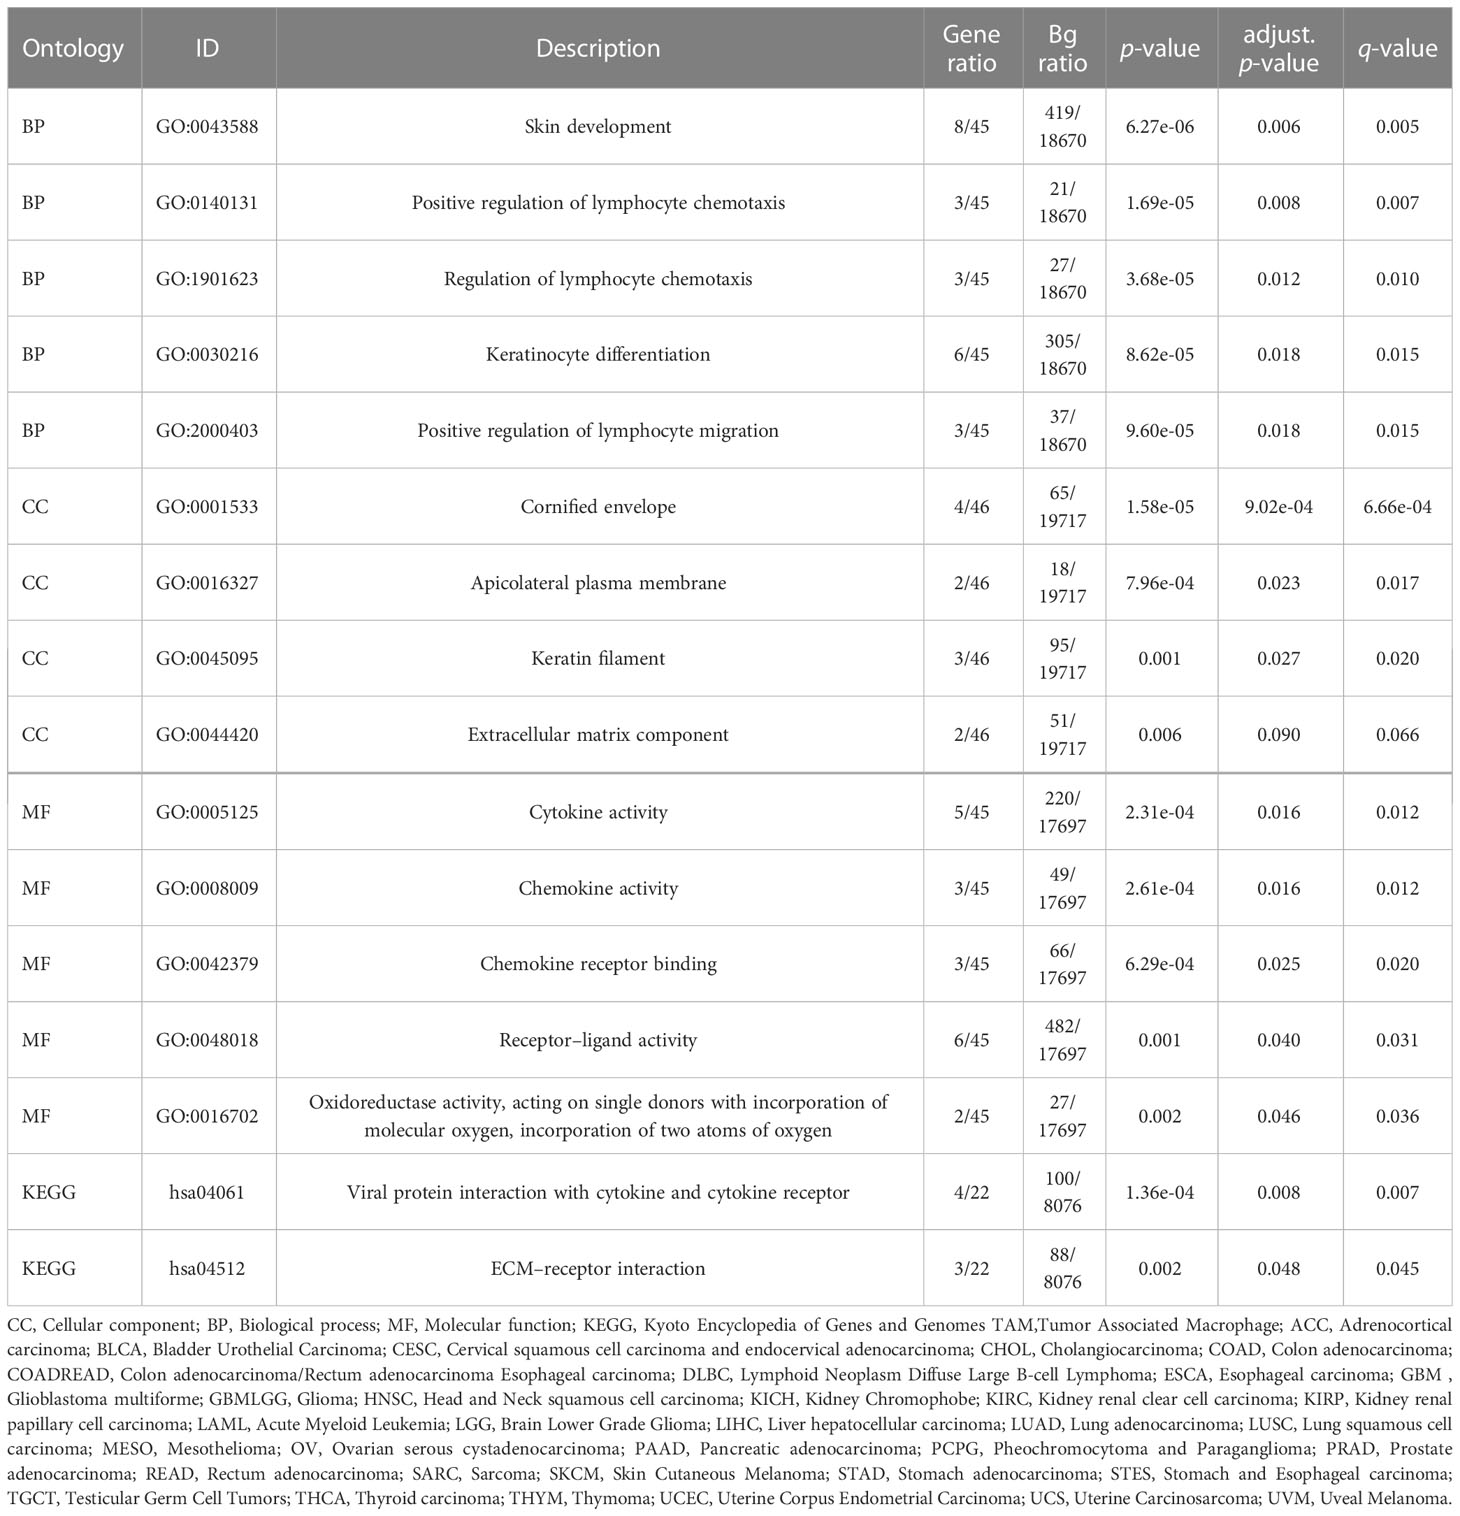
Table 1 Gene Ontology (GO)/Kyoto Encyclopedia of Genes and Genomes (KEGG) enrichment analysis of 48 overlapping genes.
Using the differential expression analysis tool DESeq2, we analyzed the top 20 upregulated and downregulated genes in both cancer tissues and adjacent normal tissues (Figure 1D). In addition, the R package “ggplot2” was used to analyze the differential expression of SCARA5 in pan-cancer tissues and corresponding adjacent tissues (1), and the following groups were retained: ACC, BLCA, BRCA, CESC, CHOL, COAD, DLBC, ESCA, GBM, HNSC, KICH, KIRC, KIRP, LAML, LGG, LIHC, LUAD, LUSC, MESO, OV, PAAD, PCPG, PRAD, READ, SARC, SKCM, STAD, TGCT, THCA, THYM, UCEC, UCS, and UVM. The following significance markers were used: ns, p ≥0.05; *, p ≤0.05; **, p ≤0.01; ***, p ≤0.001 (Figure 4A). Radar charts were generated using the “ggradar” and “ggplot2” packages to analyze the expression of SCARA5 in pan-cancer tissues (Figure 4B) and normal tissues adjacent to pan-cancerous tumors (Figure 4C). The RNA sequencing (RNA-seq) data, given in transcripts per million reads (TPM), were analyzed and compared after log2 transformation, and the following groups were retained for analysis of differences in SCARA5 in paired samples (Figure 4D): BLCA, BRCA, CHOL, COAD, ESCA, HNSC, KICH, KIRC, KIRP, LIHC, LUAD, LUSC, PAAD, PRAD, READ, STAD, THCA, and UCEC.
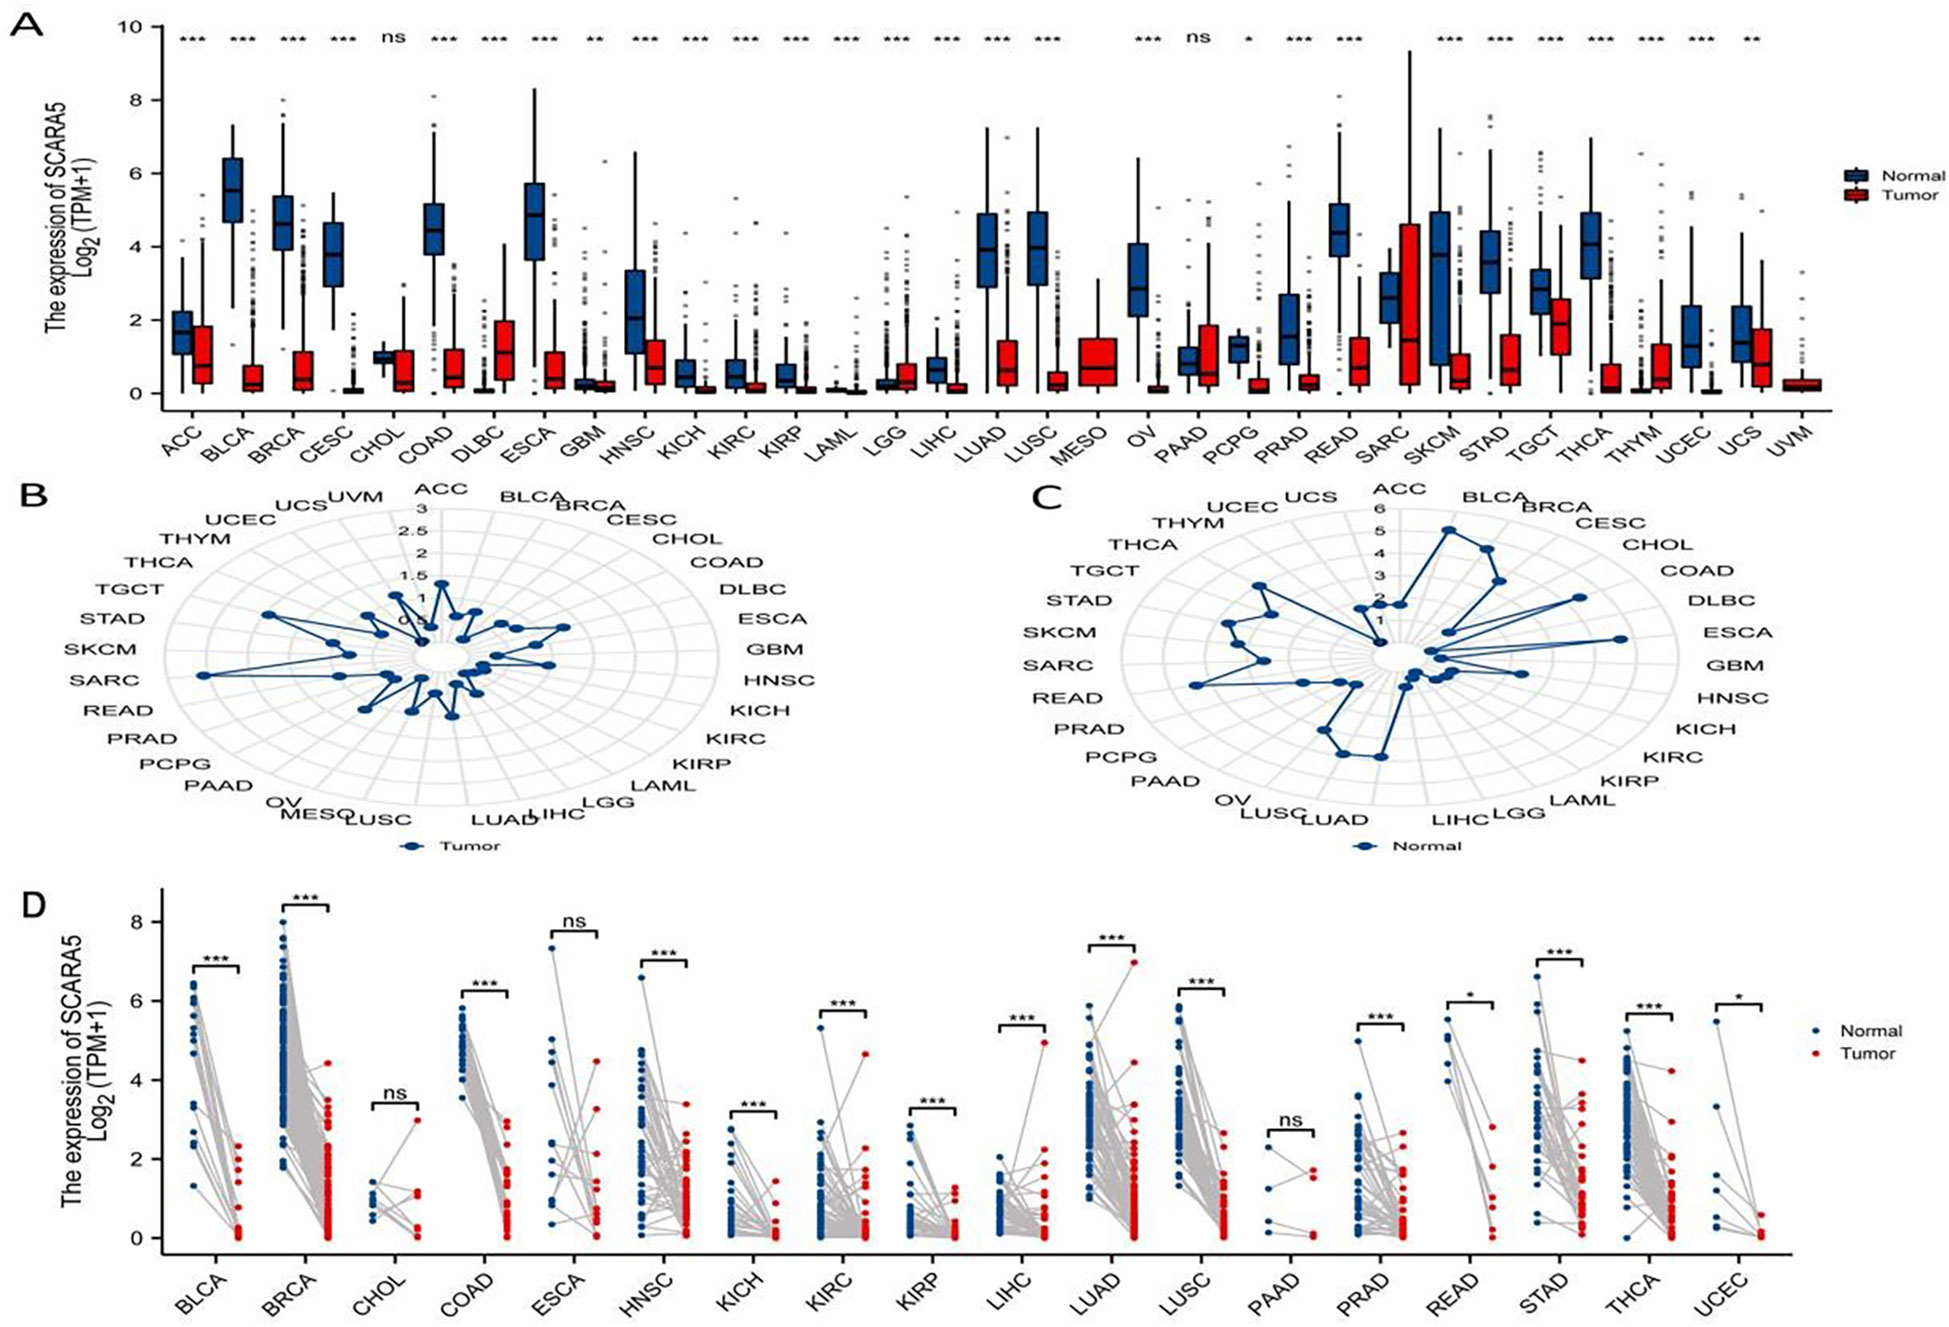
Figure 4 Pan-cancer analysis of scavenger receptor class A member 5 (SCARA5). The “ggplot2” package was used to analyze the differential expression of SCARA5 in pan-cancer cancer tissues and corresponding adjacent tissues: ns, p ≥ 0.05; *, p ≤ 0.05; **, p ≤ 0.01; ***, p ≤ 0.001 (A).Radar visualization with “ggradar” and “ggplot2” packages was used to analyze the expression of SCARA5 in pan-cancer cancer tissues (B) and the expression of SCARA5 in normal tissues adjacent to pan-cancerous tumors (C). The RNA sequencing (RNAseq) data in transcripts per million reads (TPM) format was analyzed and compared after log2 transformation and analysis of differences in SCARA5 in paired samples. Significance: ns, p ≥ 0.05; *, p ≤ 0.05; **, p ≤ 0.01; ***, p ≤ 0.001 (D).
The pan-cancer survival data from the TCGA database were divided into high-SCARA5 expression (50%–100%) and low-SCARA5 expression (0%–50%) groups (https://portal.gdc.cancer.gov/). The log-rank test showed that the difference in survival between SCARA5 groups in ACC, CESC, ESCA, GBM, KIRC, SKCM, MESO, STAD, and UVM tumors was statistically significant (Figures 5A–I).
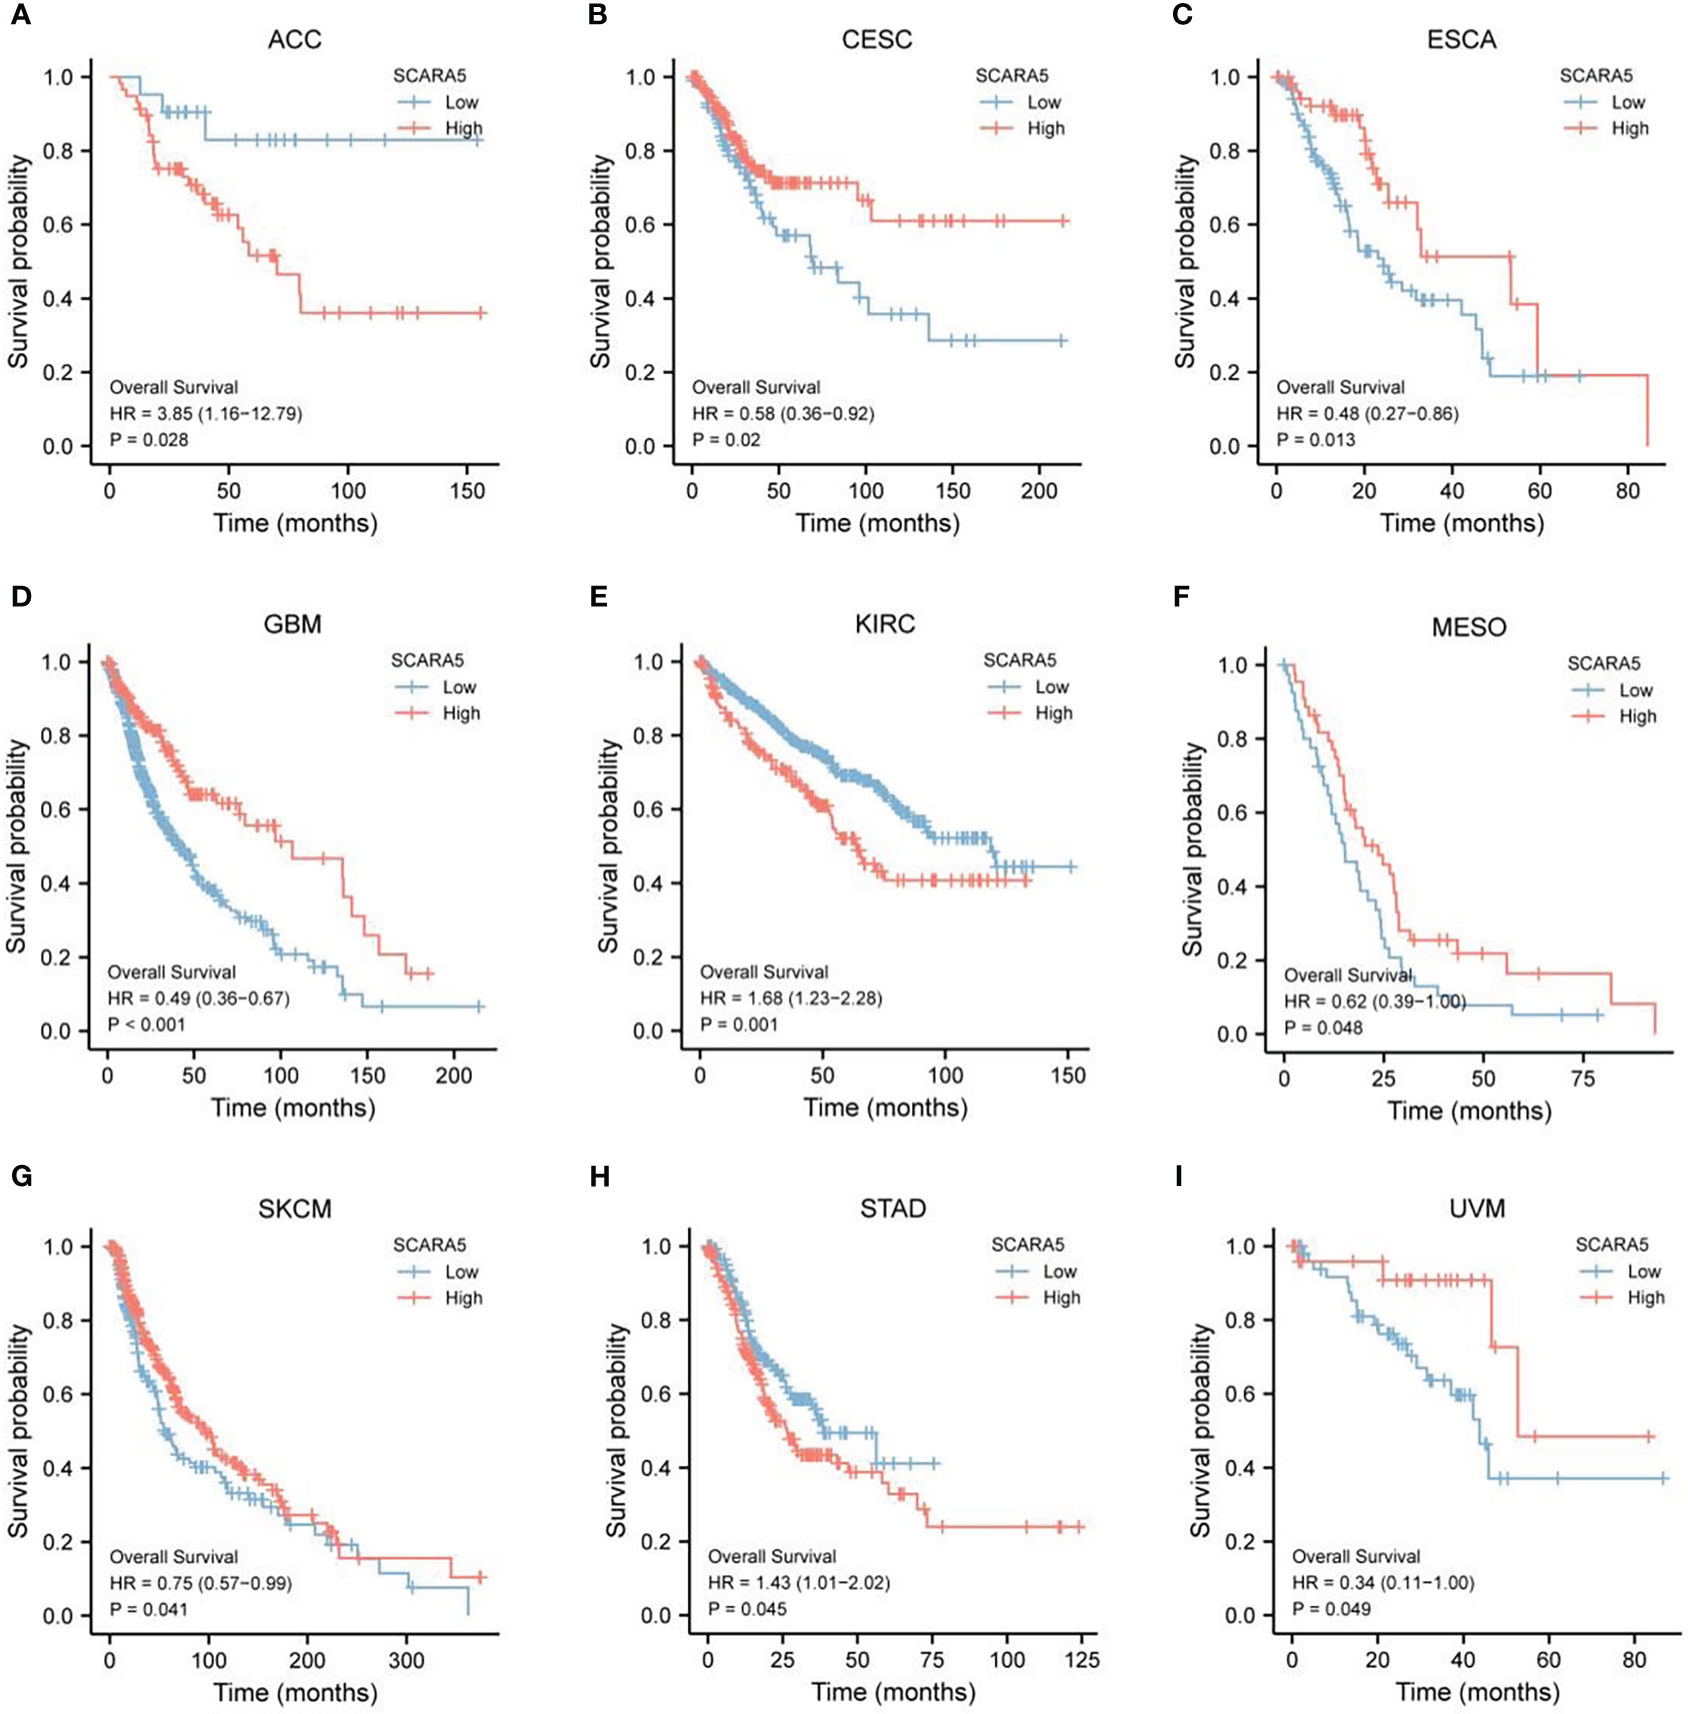
Figure 5 The Cancer Genome Atlas (TCGA)database https://portal.gdc.cancer.gov/) pan-cancer survival data for scavenger receptor class A member 5 (SCARA5) expression was divided into a high expression group (50–100) and a low expression group (0–50). Log-rank test statistical method analysis, “survminer” was used for visualization, and it was found that the difference in survival time between SCARA5 groups in ACC, CESC, ESCA, GBM, KIRC, Skin cutaneous melanoma (SKCM), MESO, STAD, and UVM tumors was statistically significant (A–I).
The Tumor IMmune Estimation Resource (TIMER) website (https://cistrome.shinyapps.io/timer/) was used to assess the correlation between SCARA5 levels, tumor purity, and immune infiltration levels in ACC, CESC, ESCA, GBM, KIRC, SKCM, MESO, STAD, and UVM (Figure 6). Table 2 shows the results of the correlation analysis between SCARA5 expression and immune cell-related genes and biomarkers. In ACC, SCARA5 expression was positively correlated with purity, B cells, CD8+T cells, neutrophils, and dendritic cells (ps < 0.05). In CESC, SCARA5 expression was positively correlated with B cells, CD4+T cells, macrophages, and dendritic cells (ps < 0.05) and negatively correlated with purity (p < 0.05). In ESCA, SCARA5 expression was positively correlated with B cells, CD4+T cells, macrophages, and neutrophils (ps < 0.05) and negatively correlated with purity (p < 0.05). In GBM, no significant correlations were found between SCARA5 expression and immune infiltration levels. In contrast, in KIRC, SCARA5 expression was positively correlated with B cells, CD4+T cells, macrophages, neutrophils, and dendritic cells (ps < 0.05) and negatively correlated with purity (p < 0.05). In MESO, SCARA5 expression was positively correlated with purity (p < 0.05). In SKCM, SCARA5 expression was positively correlated with CD8+T cells, CD4+T cells, macrophages, neutrophils, and dendritic cells (ps < 0.05) and negatively correlated with purity (p < 0.05). In STAD, SCARA5 expression was positively correlated with B cells, CD8+T cells, CD4+T cells, macrophages, neutrophils, and dendritic cells (ps < 0.05). In UVM, SCARA5 expression was positively correlated with macrophages and neutrophils (ps < 0.05). We further found significant correlations with immune infiltration in CESC, ESCA, KIRC, SKCM, STAD, and specific immune molecules (CD86, CSF1R, CCL2, CD68, NOS2, IRF5, PTGS2, CD163, VSIG4, and MS4A4A) (Figure 7). In CESC, SCARA5 expression was positively correlated with CD163, VSIG4, and MS4A4A (ps < 0.05). In ESCA, SCARA5 expression was positively correlated with CD86, CSF1R, CCL2, CD68, CD163, VSIG4, and MS4A4A (ps < 0.05). Moreover, in KIRC, SCARA5 expression was positively correlated with CD86, CSF1R, CD68, NOS2, IRF5, PTGS2, CD163, VSIG4, and MS4A4A (ps < 0.05). In SKCM, SCARA5 expression was positively correlated with CD86, CSF1R, CCL2, CD68, NOS2, IRF5, PTGS2, CD163, VSIG4, and MS4A4A (ps < 0.05). Finally, in STAD, SCARA5 expression was positively correlated with CD86, CSF1R, CCL2, CD68, IRF5, PTGS2, CD163, VSIG4, and MS4A4A (ps < 0.05). Table 3 shows the correlation analysis between SCARA5 and immune cell-related genes and markers in Gene Expression Profiling Interactive Analysis (GEPIA) (cancer-pku.cn). The results are consistent with previous searches in the TIMER database.
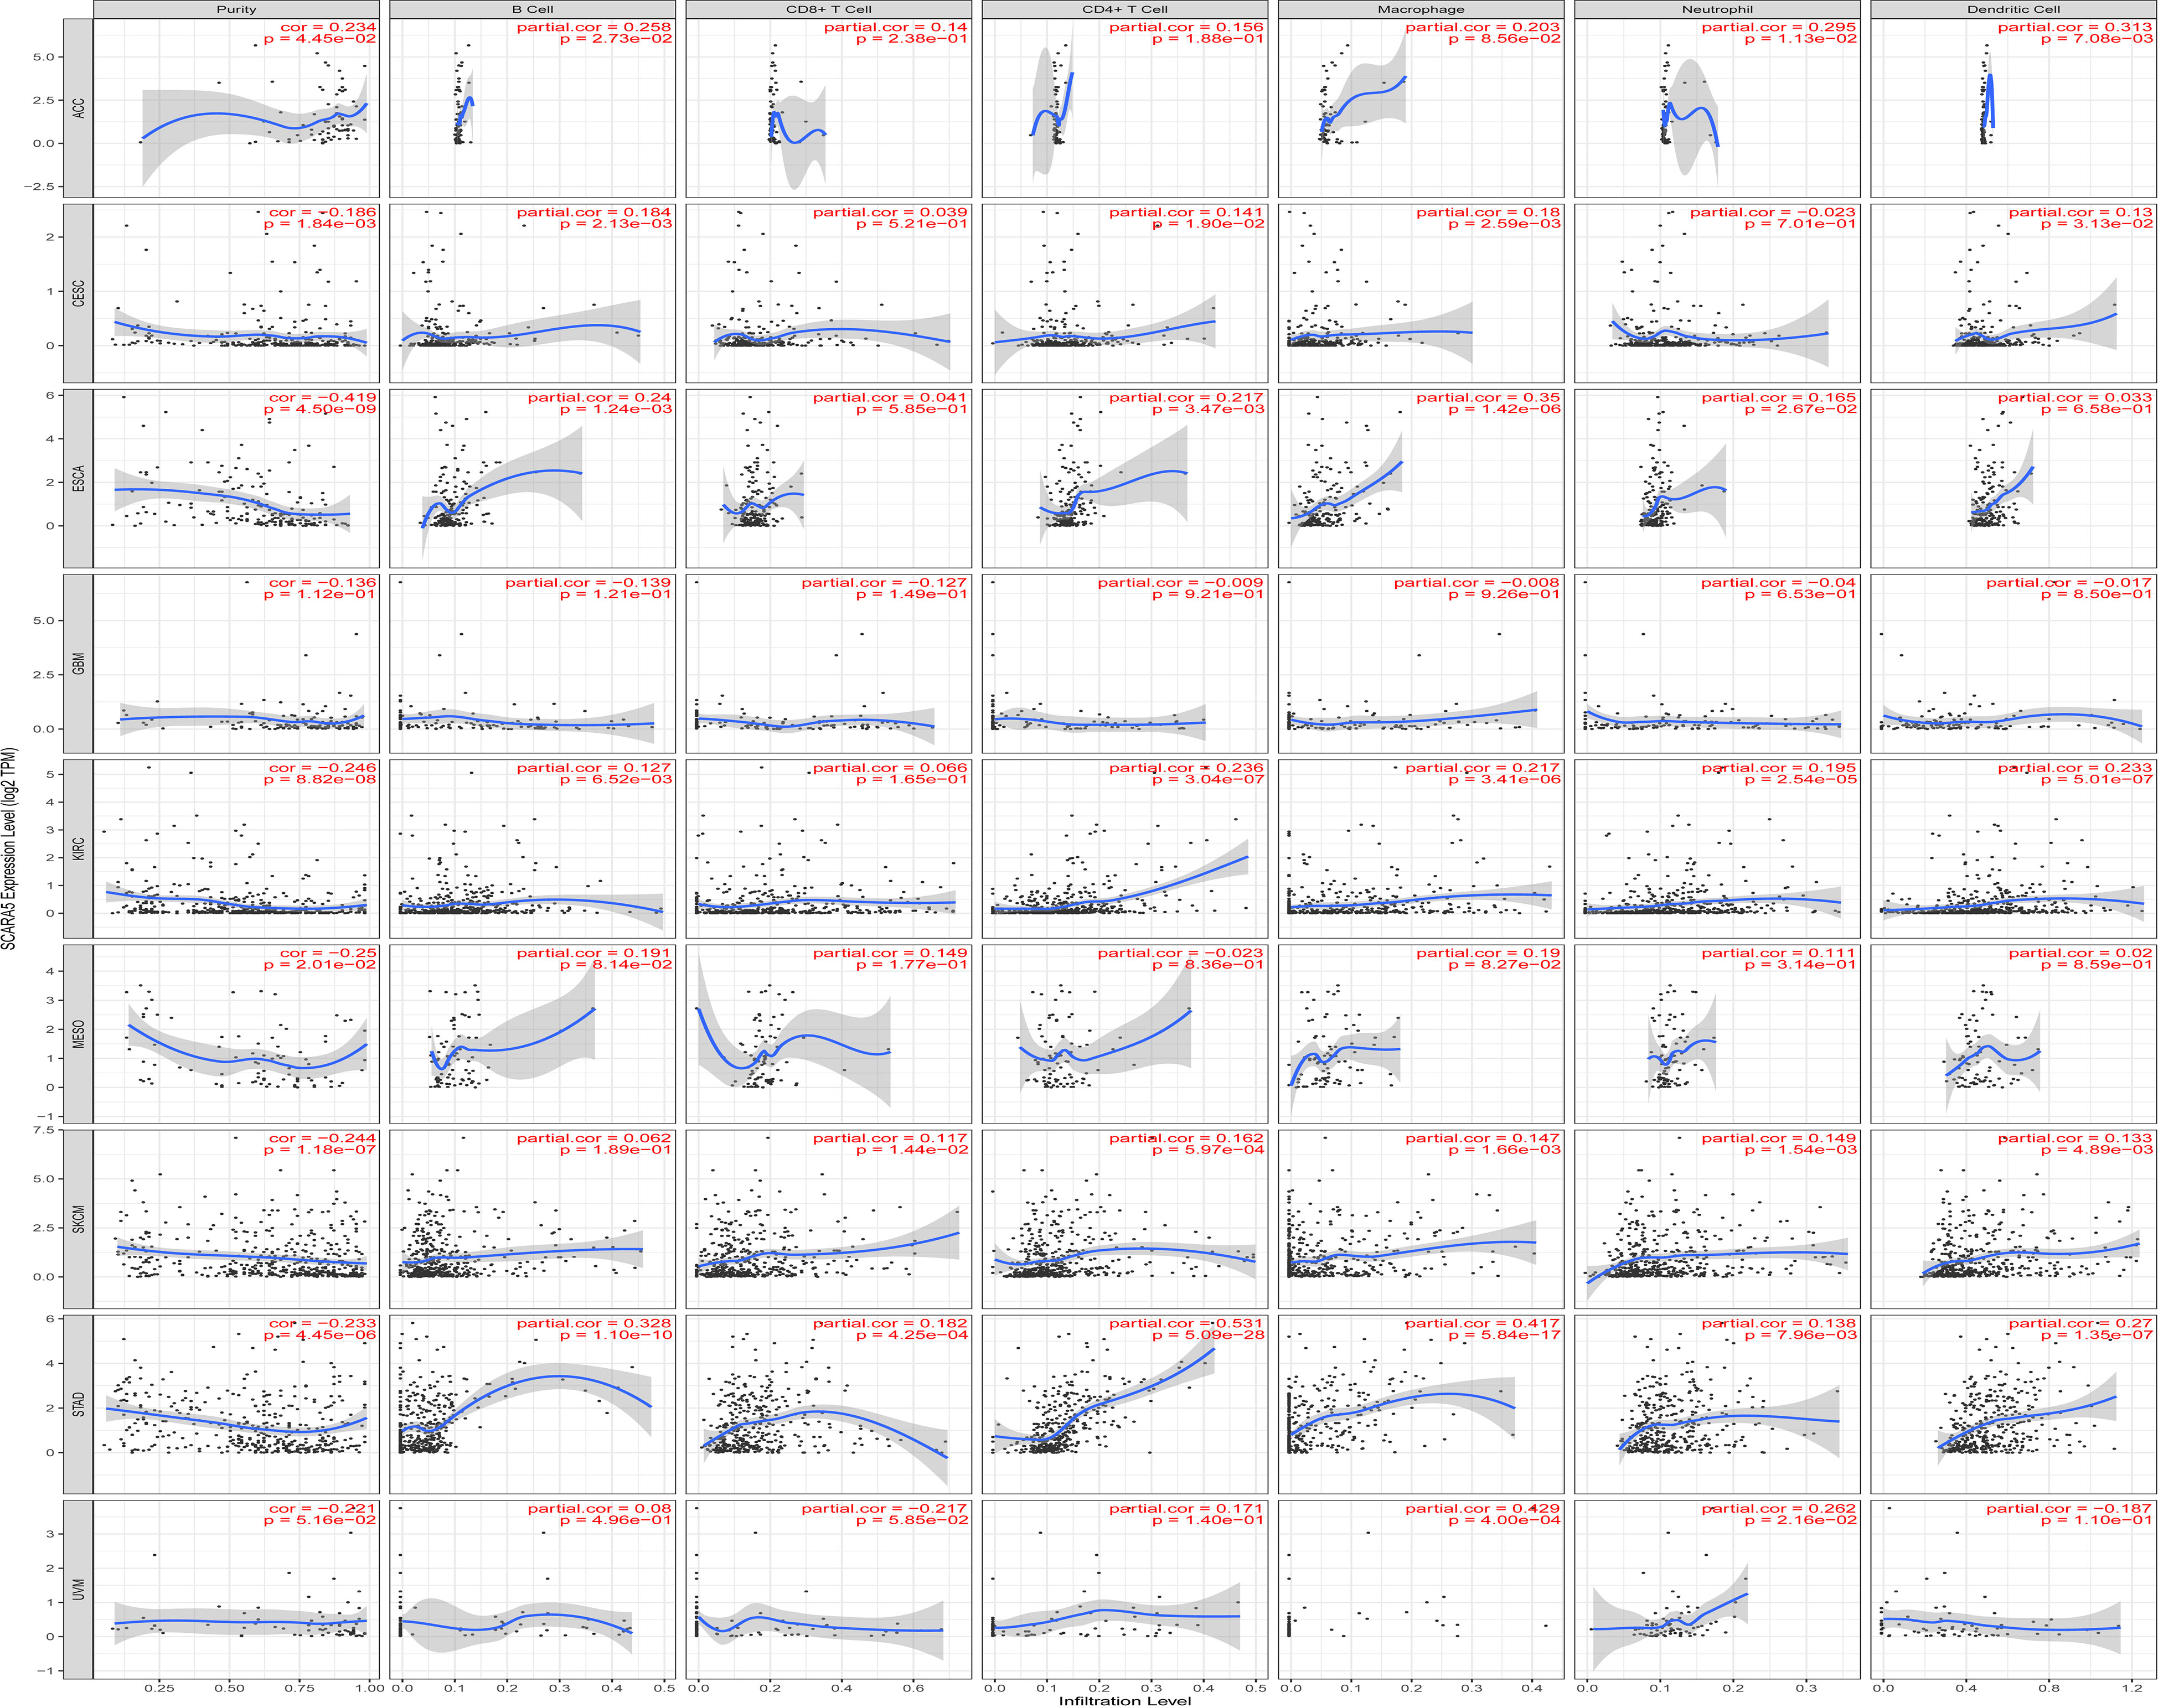
Figure 6 The Tumor IMmune Estimation Resource (TIMER) website https://cistrome.shinyapps.io/timer/) is used to view The Cancer Genome Atlas (TCGA) database for ACC, CESC, ESCA, GBM, KIRC, SKCM, MESO, STAD, and UVM in immune cells and the correlation of tumor purity and scavenger receptor class A member 5 (SCARA5) levels.
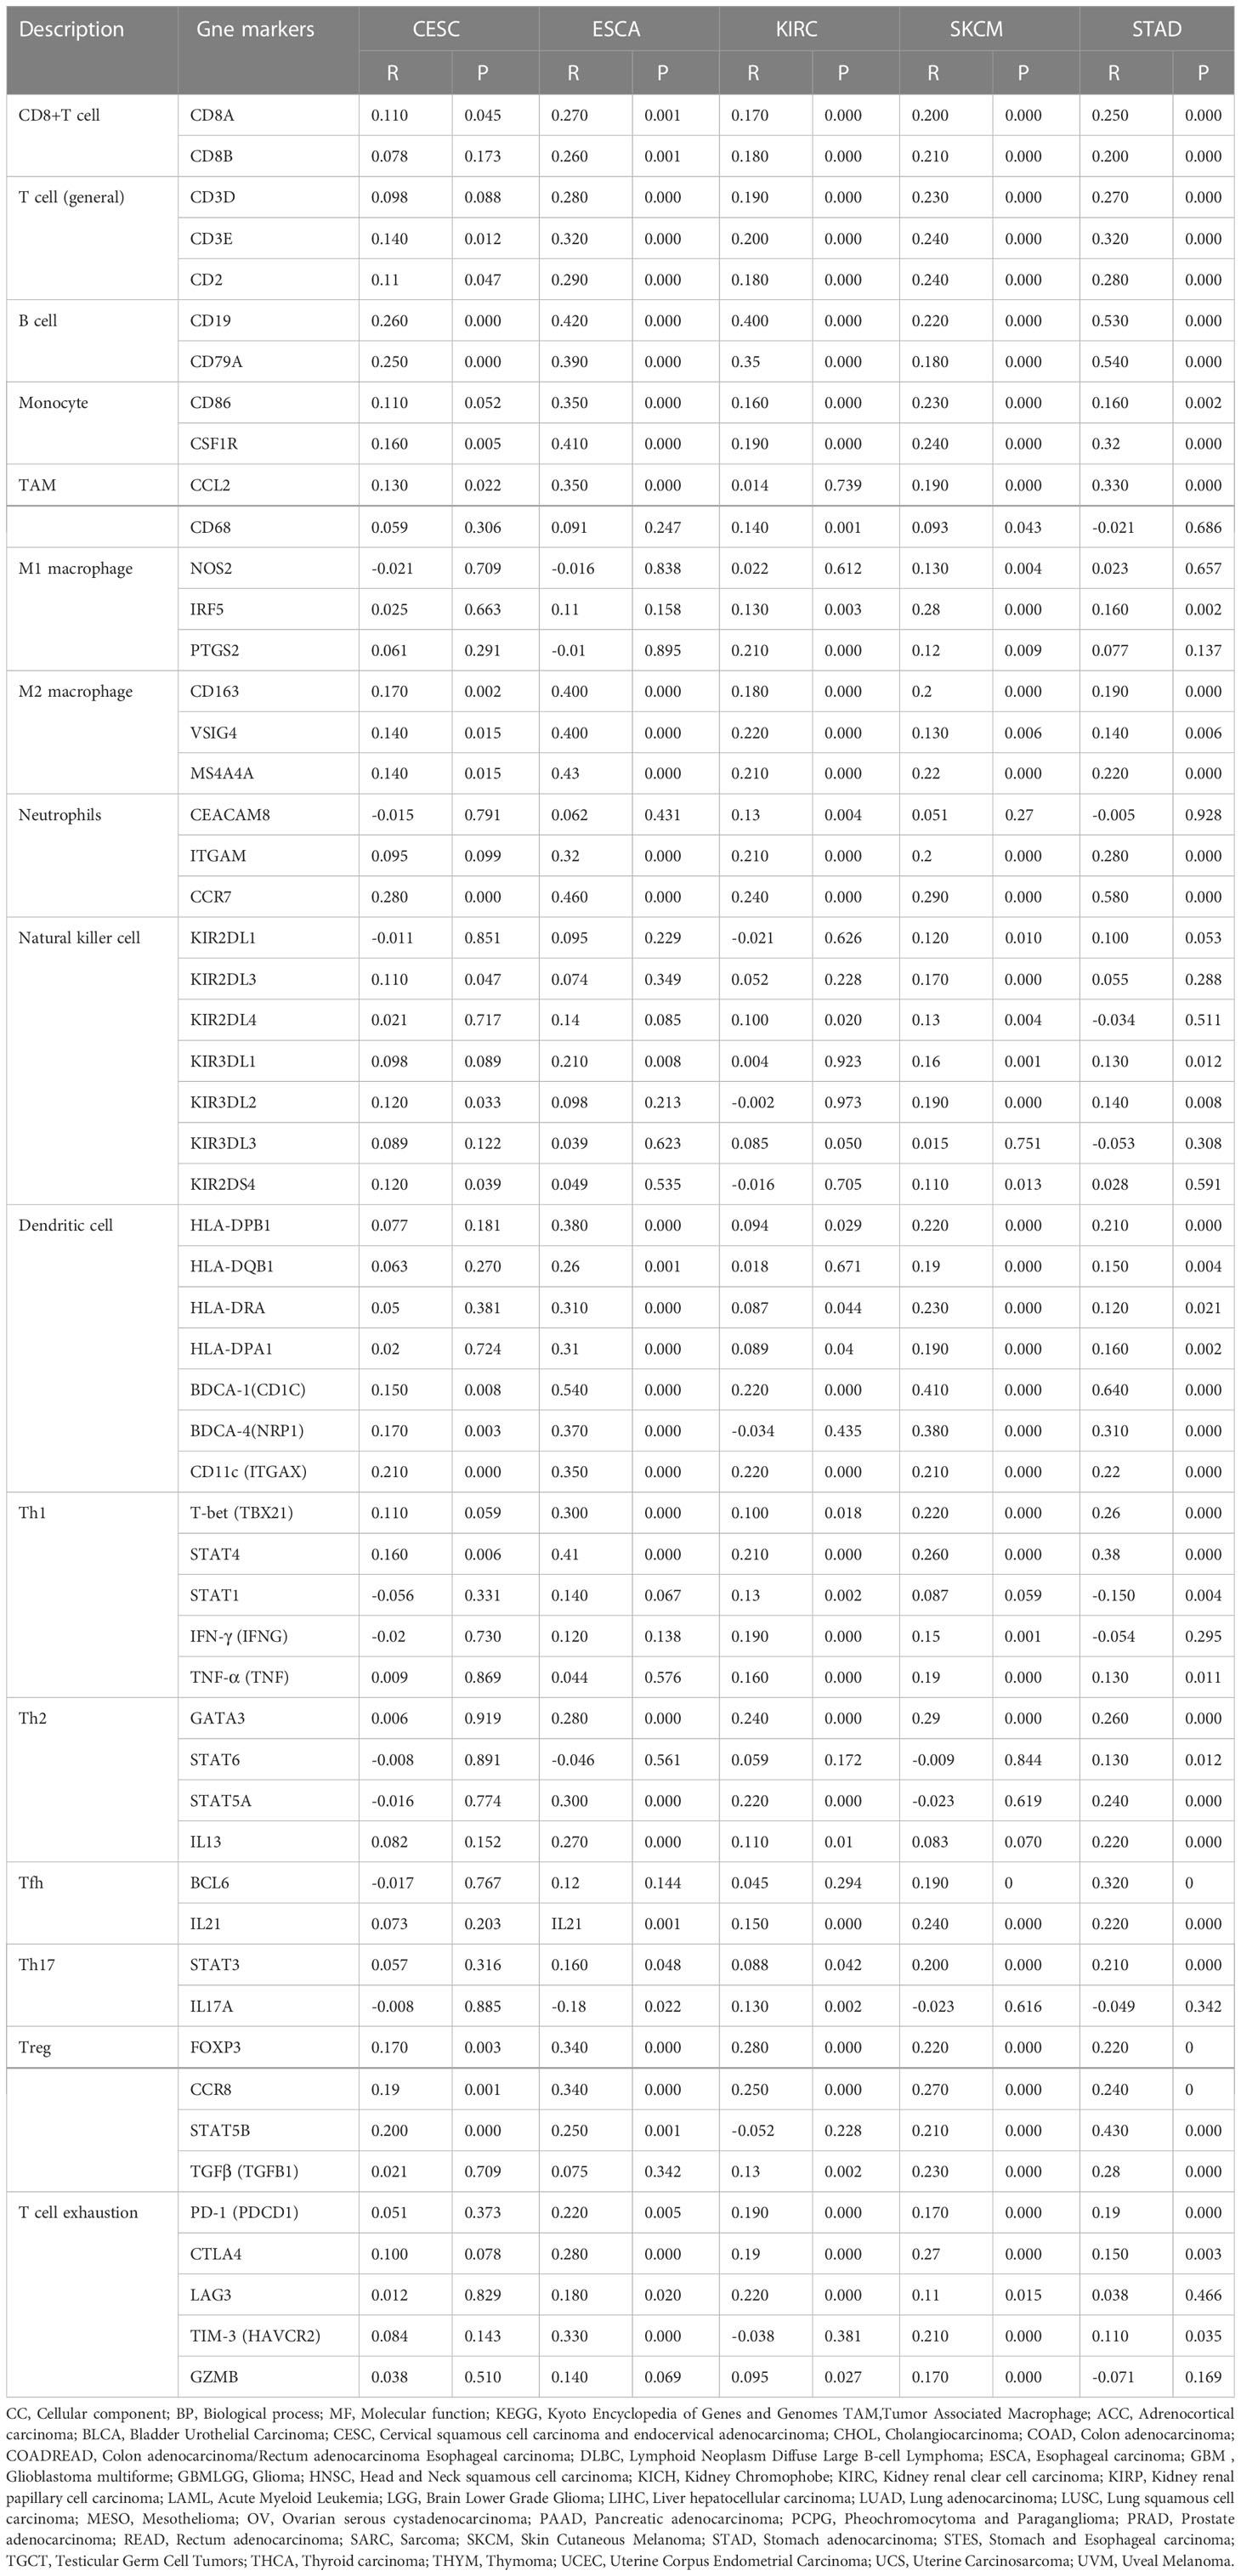
Table 2 Correlation analysis between scavenger receptor class A member 5 (SCARA5) and immune cell-related genes and markers in Tumor IMmune Estimation Resource (TIMER).

Figure 7 Further analysis of immune infiltration correlations with statistical significance in CESC, ESCA, KIRC, SKCM, STAD, and specific immune molecules (CD86, CSF1R, CCL2, CD68, NOS2, IRF5, PTGS2, CD163, VSIG4, and MS4A4A) (A–T).
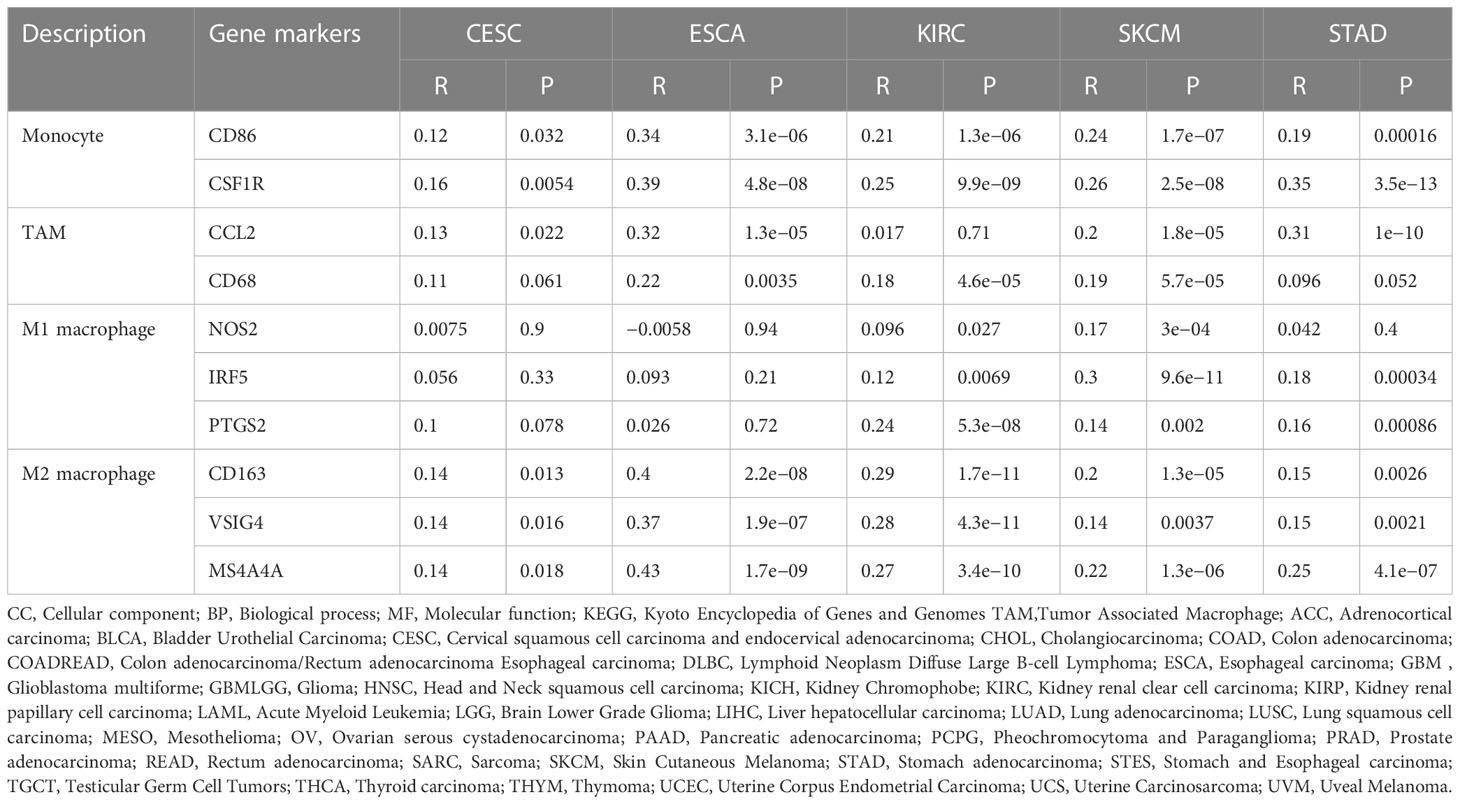
Table 3 Correlation analysis between scavenger receptor class A member 5 (SCARA5) and immune cell-related genes and markers in Gene Expression Profiling Interactive Analysis (GEPIA).
University of California Santa Cruz Xena (UCSC XENA) Tools is an R package for accessing genomics data from the UCSC Xena platform, from cancer multi-omics to single-cell RNA-seq (33). GTEx data from TCGA and the corresponding normal tissue data in SKCM (skin melanoma) were extracted for the present study. The Wilcoxon rank-sum test showed that the expression of SCARA5 was significantly lower in tumors than in normal subjects (p < 0.001) and the results were visualized using “ggplot2” (Figure 8A). The “pROC” package was used to analyze the diagnostic value of SCARA5 in the SKCM tumor group and the normal group, and the “ggplot2” package was used to draw the receiver operating characteristic (ROC) curve. The abscissa is the false positive rate (FPR) and the ordinate is the true positive rate (TPR). SCARA5 expression exhibited good diagnostic performance in differentiating tumor and normal tissues (Figure 8B). The difference in survival time in SKCM was statistically significant (p = 0.04, Figure 8C). The R package “DESeq2” (34) was used to analyze the RNAseq data in the High-throughout sequencing Counts (HTSeq-Counts) format in TCGA (https://portal.gdc.cancer.gov/) SKCM, and the molecules KRT71, HAPLN1, C14orf180, PLIN1, PI16, TRARG1, SERTM1, CR2, PLIN4, STATH, TNMD, and ADIPOQ, with higher differences in SCARA5 expression, selected to draw a correlation heatmap (Figure 8D) and single-gene co-expression heatmap (Figure 8E). The GSEA enrichment plots (Figures 8F, G) of the 12 molecules, including SCARA5, were analyzed, and significant enrichment in Reactome developmental biology, Reactome antimicrobial peptides, Reactome metabolism of lipids, Reactome formation of the cornified envelope, and Reactome keratinization was observed. Based on multiple regression analyses, the scale score was set to represent each variable in the multiple regression model, and the probability of event occurrence was predicted by calculating the final total score (35). The “rms” package and the “survival” package were used to predict the prognostic value of SCARA5 at 1, 3, and 5 years after the onset of SKCM (Figure 9A). Figure 9B shows the calibration curve. The abscissa is the survival probability predicted by the model, the ordinate is the actual survival probability, and the gray diagonal line is the ideal line. The differential genes in the GSE100050 data set were used to generate the Lasso coefficient profile and plot the Lasso variable trajectory (Figures 9C, D). The Gene Set Variation Analysis (GSVA) package and the immune infiltration algorithm ssGSEA (GSVA package built-in algorithm) were used to map SCARA5 and SKCM with 24 kinds of immune cells [aDC (activated DC); B cells; CD8 T cells; cytotoxic cells; DC; eosinophils; iDC (immature DC); macrophages; mast cells; neutrophils; NK CD56 bright cells; NK CD56 dim cells; NK cells; pDC (plasmacytoid DC); T cells; T helper cells; Tcm (T central memory); Tem (T effector memory); Tfh (T follicular helper); Tgd (T gamma delta); Th1 cells; Th17 cells; Th2 cells; and Treg] (Figures 9E, F) (36, 37).
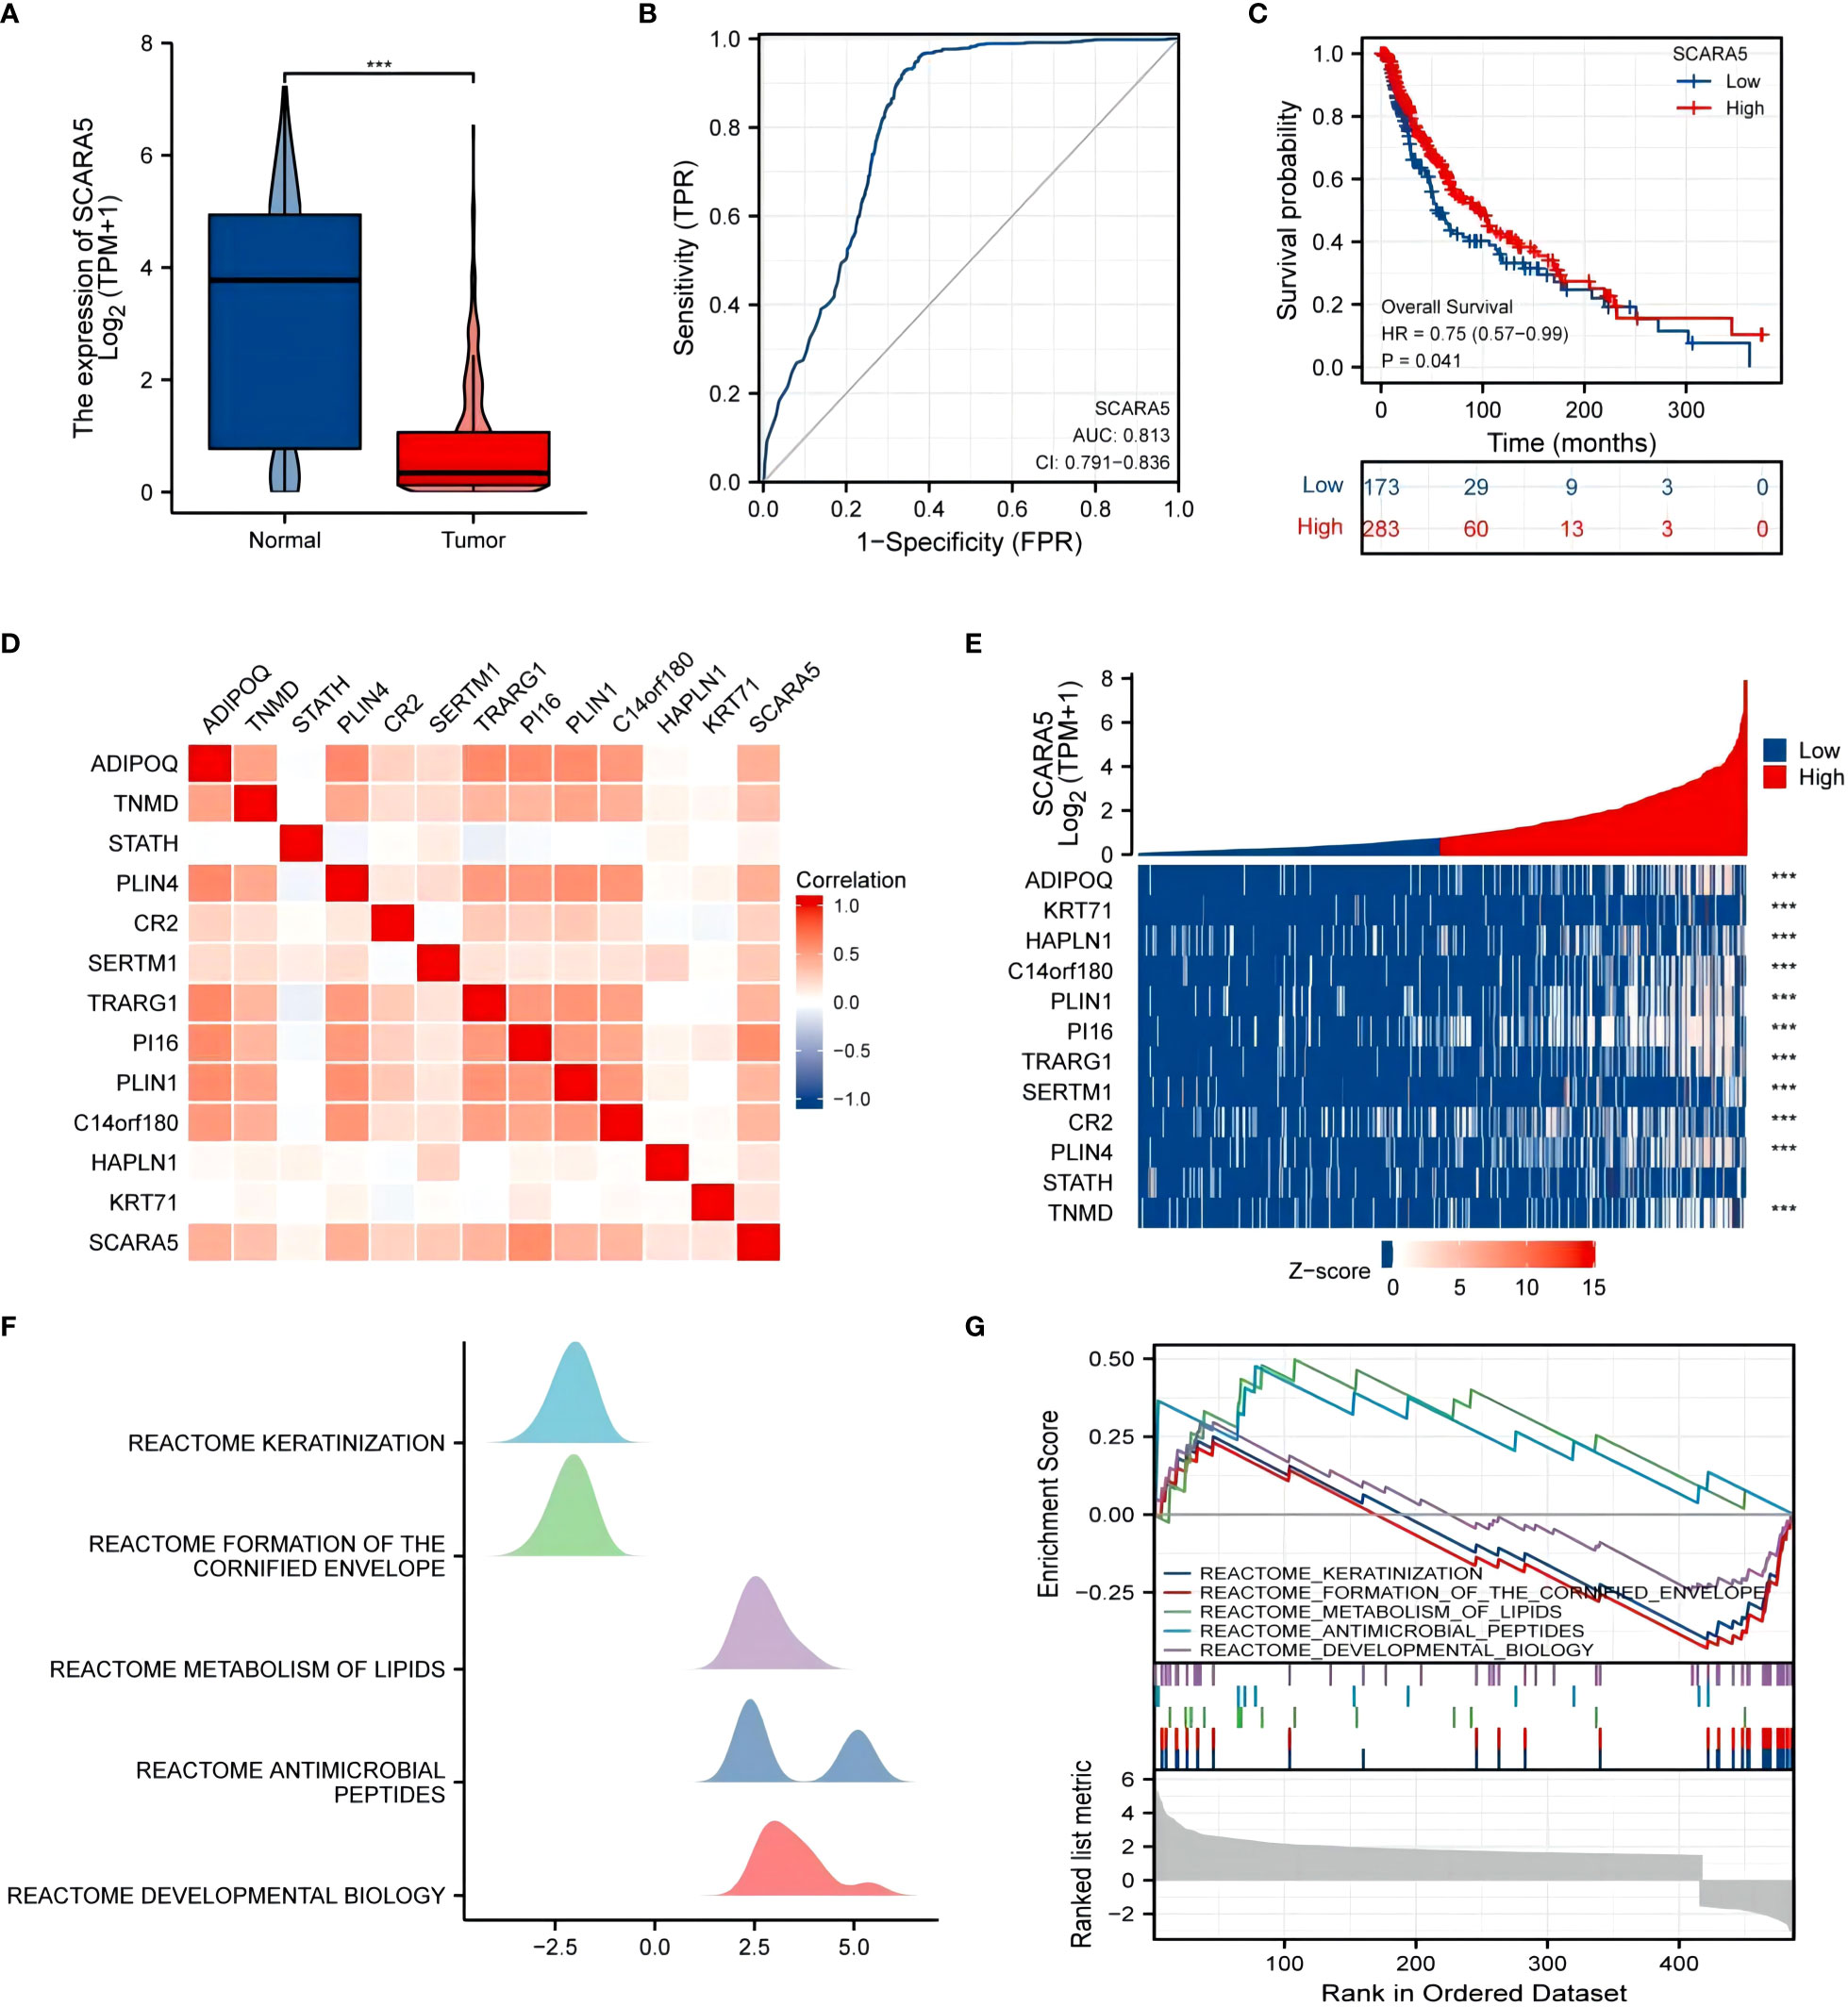
Figure 8 UCSC XENA (https://xenabrowser.net/datapages/) unified RNA sequencing (RNAseq) data of The Cancer Genome Atlas (TCGA) and Genotype-Tissue Expression (GTEx) in transcripts per million reads (TPM) showed that scavenger receptor class A member 5 (SCARA5) levels in tumor tissue were lower than those in normal tissue, and the difference was statistically significant (***p < 0.001), using “ggplot2” for visualization (A). The “pROC” package was used to analyze the diagnostic value of SCARA5 in the SKCM tumor group and the normal group, and the “ggplot2” package was used to draw the receiver operating characteristic (ROC) curve (B). The difference in survival time distribution in SKCM was statistically significant (p = 0.04) (C). The “DESeq2” package was used to analyze the RNAseq data in the level 3 High-throughout sequencing Counts (HTSeq-Counts) format in TCGA (https://portal.gdc.cancer.gov/) SKCM and select molecules (KRT71, HAPLN1, C14orf180, PLIN1, PI16, TRARG1, SERTM1, CR2, PLIN4, STATH, TNMD, and ADIPOQ) with higher differences with SCARA5 used to draw a correlation heatmap (D) and single-gene co-expression heatmap (E). The gene set enrichment analysis (GSEA) mountain map (F) and GSEA enrichment map (G).
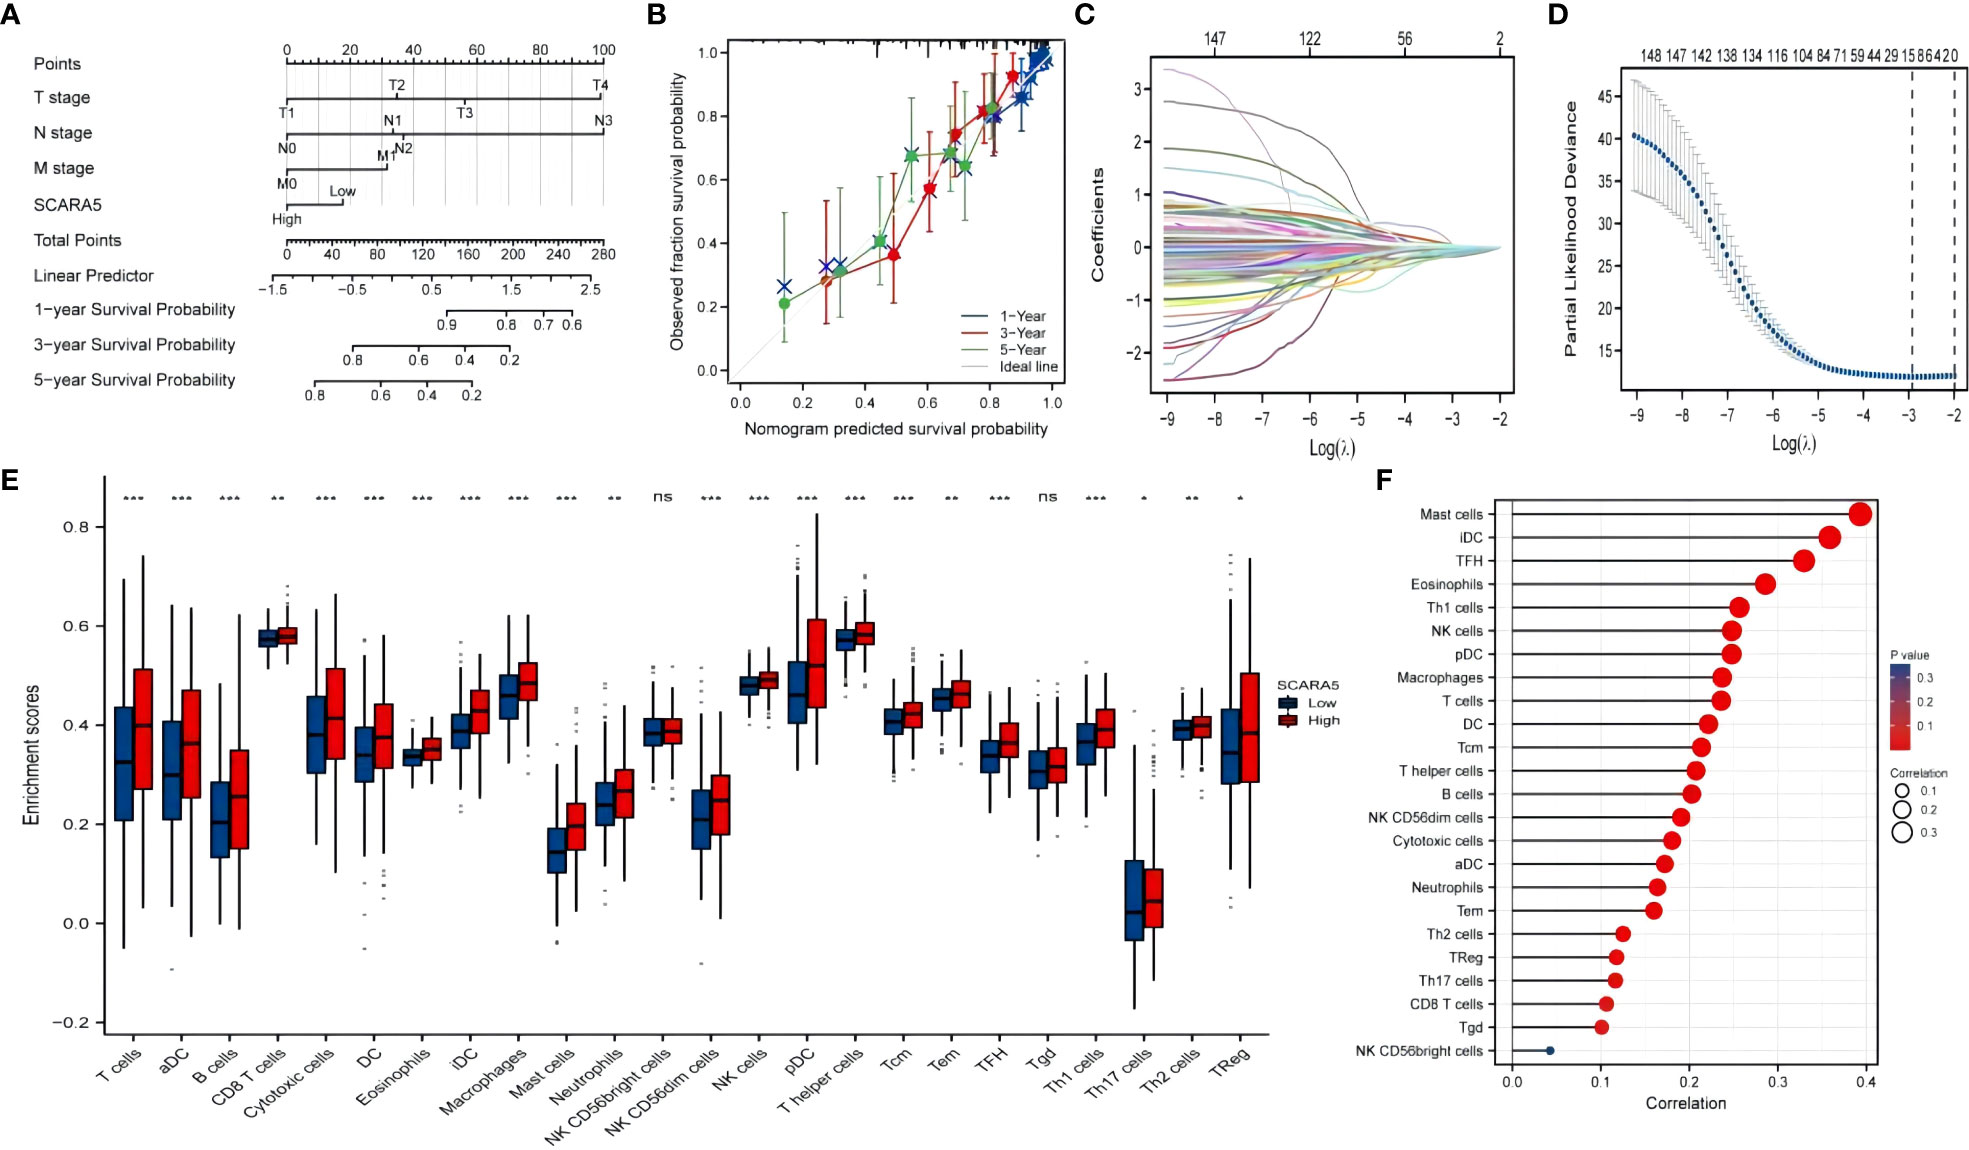
Figure 9 Bioinformatics were used to analyze the prognosis of scavenger receptor class A member 5 (SCARA5) and its correlation with immune infiltration. The “rms” package and the “survival” package were used to predict the prognosis of SCARA5 at 1, 3, and 5 years after the onset of SKCM (A). (B) shows calibration visualization. The abscissa is the survival probability predicted by the model, the ordinate is the actual observed survival probability, and the gray diagonal line is the ideal line. The lines and points of different colors (except for the gray diagonal line) represent the predictions of the model at different time points. When the lines of different colors are closer to the ideal gray line, and the error bar is smaller (stable), this indicates that at this time point the prediction effect is better. Differential genes in the GSE100050 data set were selected and the “glmnet” package used to draw a Lasso coefficient screening diagram and simultaneously plot the Lasso variable trajectory (C, D). Gene Set Variation Analysis (GSVA) package and immune infiltration algorithm ssGSEA (GSVA package built-in algorithm) were used to map SCARA5 and SKCM with 24 kinds of immune cells [aDC (activated DC); B cells; CD8 T cells; cytotoxic cells; DC; eosinophils; iDC (immature DC); macrophages; mast cells; neutrophils; NK CD56bright cells; NK CD56dim cells; NK cells; pDC (Plasmacytoid DC); T cells; T helper cells; Tcm (T central memory); Tem (T effector memory); Tfh (T follicular helper); Tgd (T gamma delta); Th1 cells; Th17 cells; Th2 cells; Treg] [*P<0.05, **P<0.01, ***P<0.001, and ns (no significant)] (E, F).
We further investigated whether SCARA5 affects the progression of SKCM by studying the correlation between SCARA5 expression and clinicopathological characteristics in our sample tissues. According to the Immunohistochemistry (IHC) results of SCARA5 expression, SKCM patients were divided into high expression (IRS 4–12) (Figure 10A) and low expression (IRS 0–3) (Figure 10B) groups. High SCARA5 expression was detected in 39/93 tumor tissues (41.9%) and low SCARA5 expression in 54/93 tumor samples (58%). The association between SCARA5 expression and clinicopathological findings in our samples is shown in Table 2. High SCARA5 expression levels were associated with tumor, node, and metastasis (TNM) stage (T: p = 0.033, N: p = 0.029, M: p = 0.036), and metastasis/recurrence (p = 0.03), while low SCARA5 expression was associated with patient age, sex and tumor location. There was no significant correlation between SCARA5 expression and tumor size. These results suggest that SCARA5 is lowly expressed in SKCM and SCARA5 has tumor-suppressive functions in SKCM (Table 4). To further verify the results of the previous analysis, we verified the RNA and protein expression of SCARA5 in SKCM using Western blotting and reverse transcription PCR (Figures 11A, B), which showed that SCARA5 expression levels are significantly reduced in SKCM tissues compared with matched normal tissues.
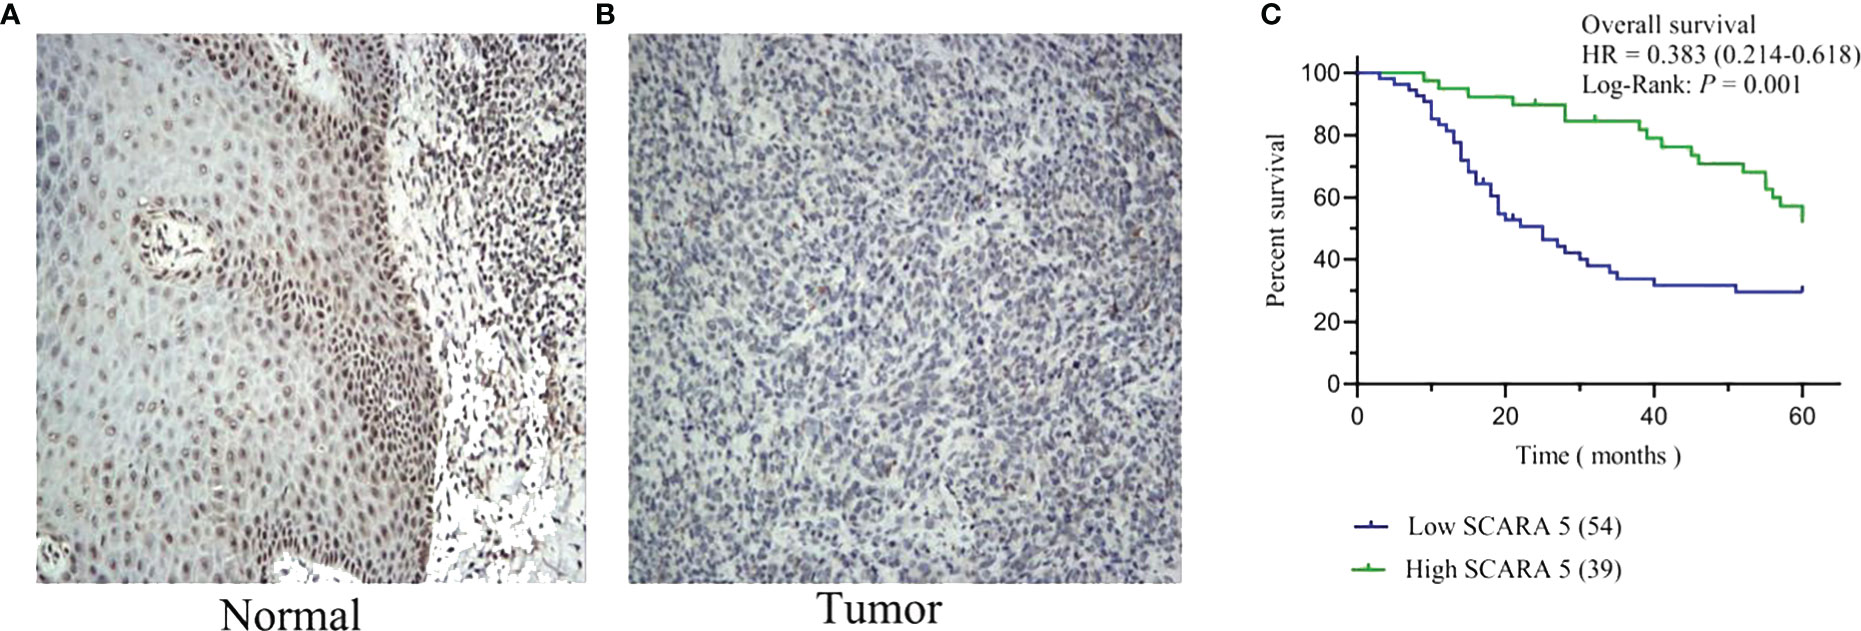
Figure 10 Expression of scavenger receptor class A member 5 (SCARA5) in SKCM and survival analysis of our cases. High SCARA5 expression (IRS 4–12) (A) and low expression (IRS 0–3) (B). Through Kaplan–Meier curve assessment, patients with low SCARA5 expression were shown to have a significantly lower 5-year survival rate than those with high SCARA5 expression ((C) p = 0.001, log-rank test).
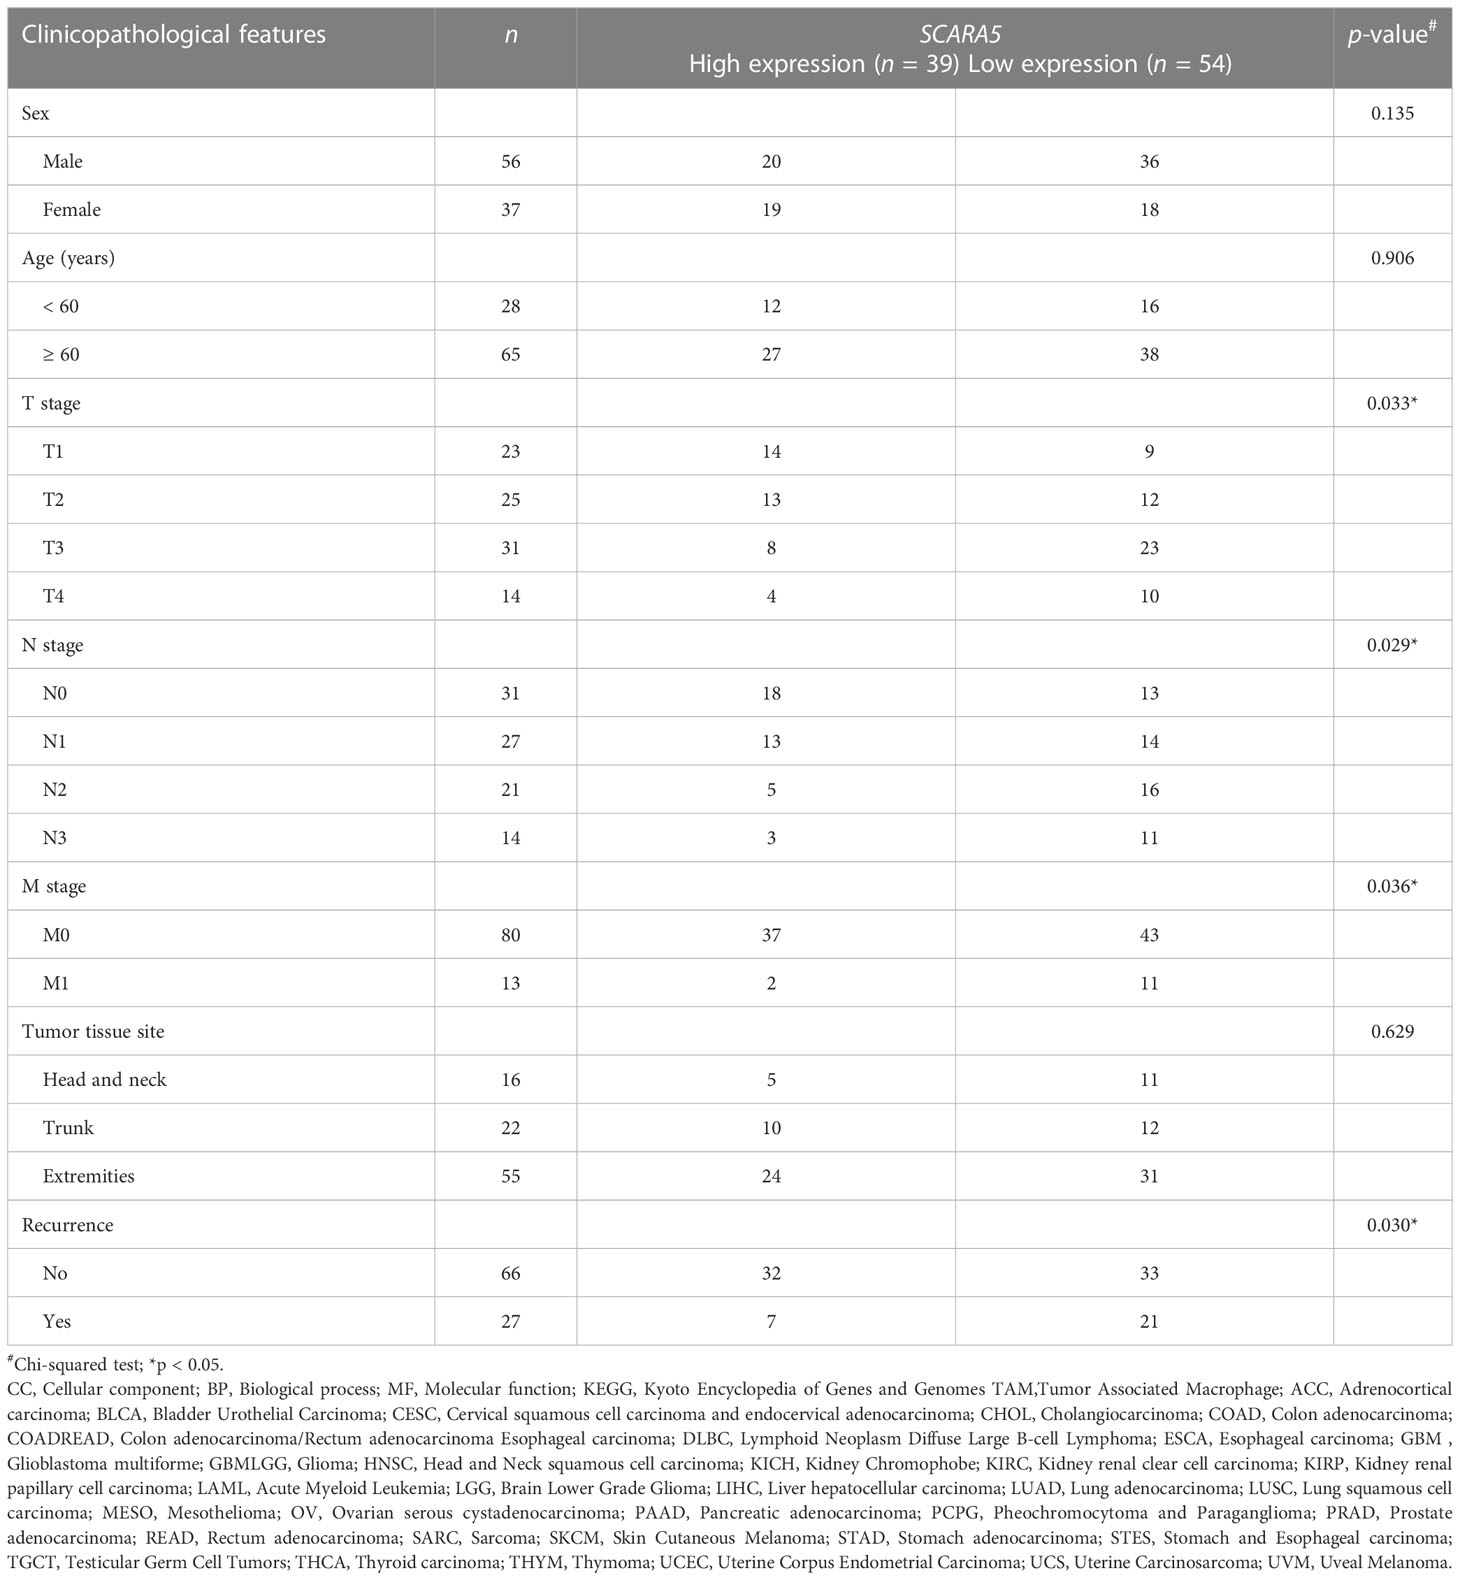
Table 4 Association of scavenger receptor class A member 5 (SCARA5) expression and clinicopathological features in melanoma.
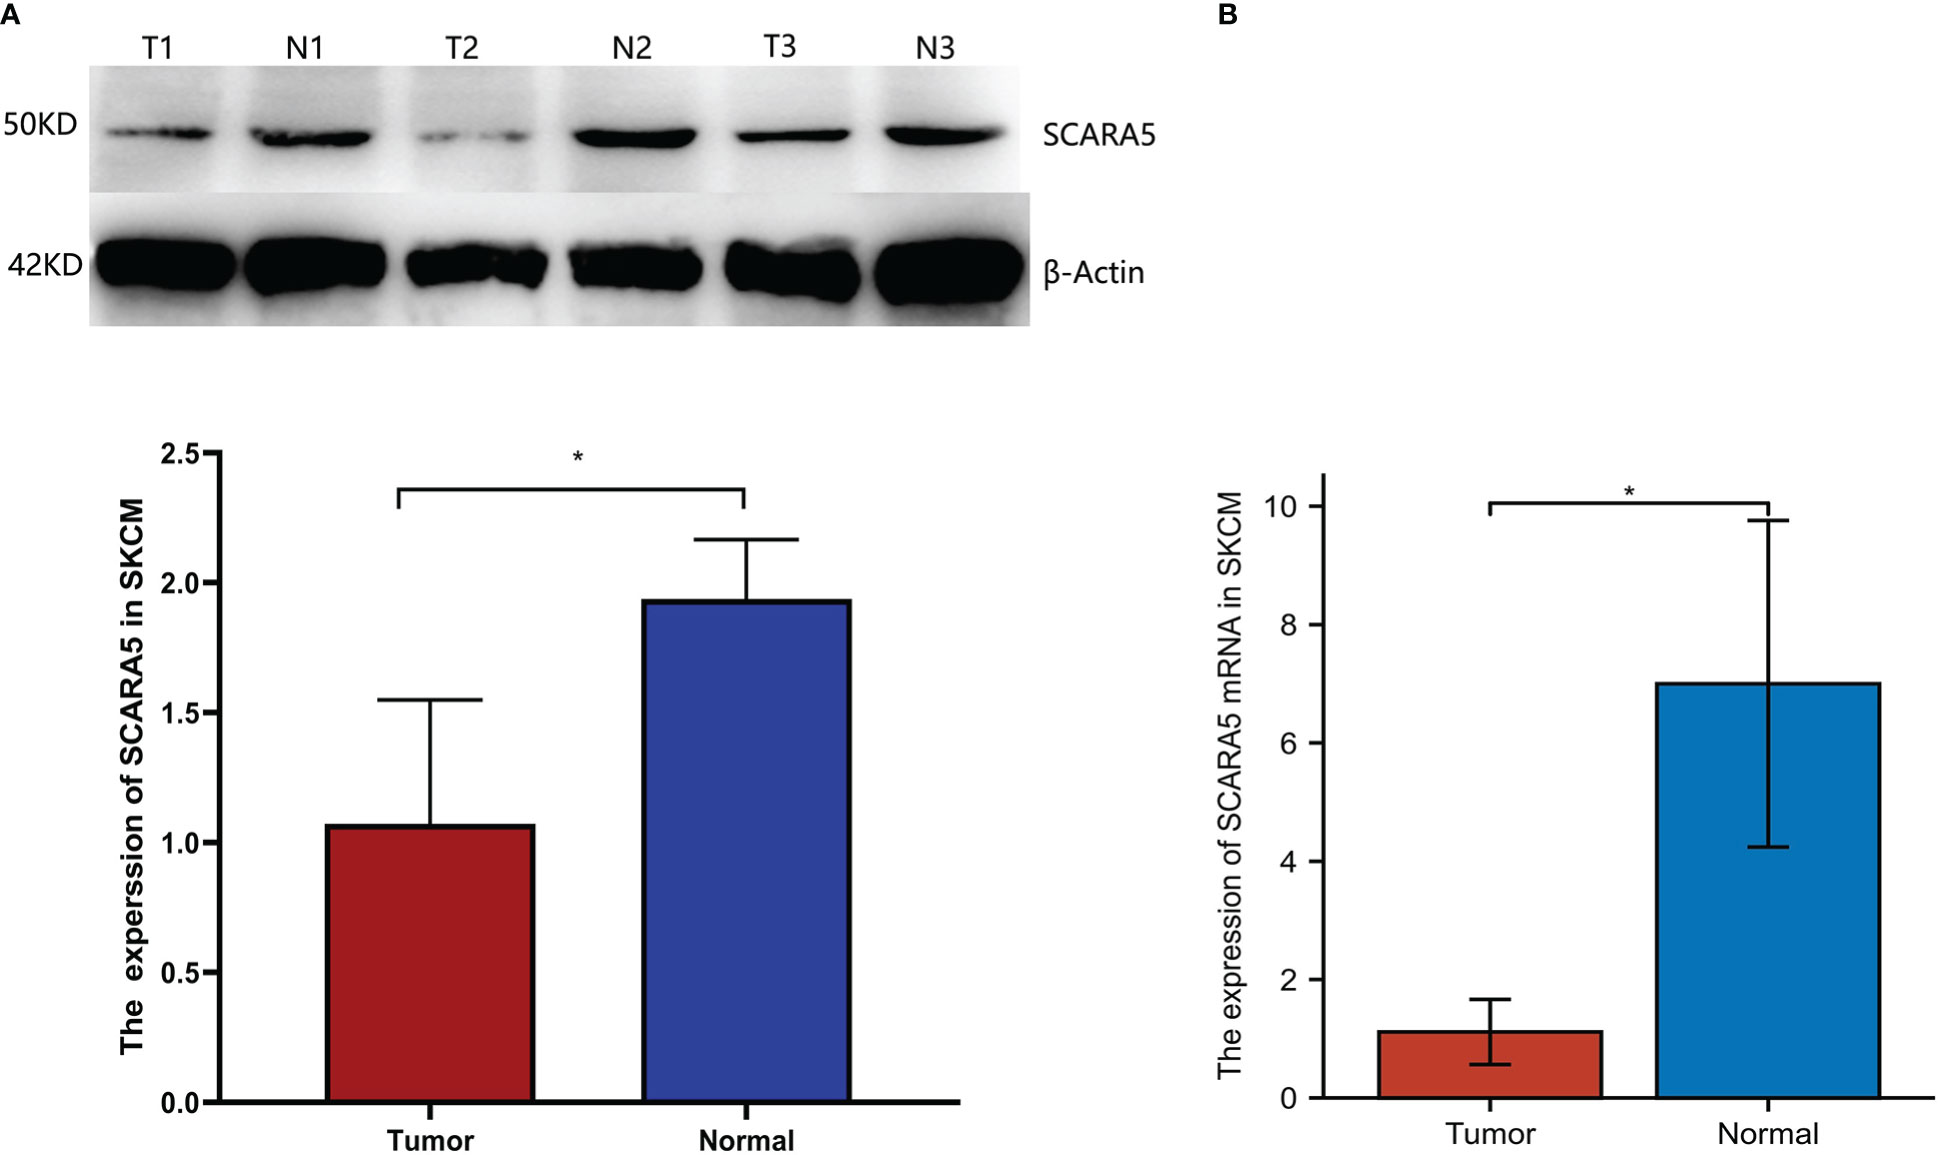
Figure 11 Expression of scavenger receptor class A member 5 (SCARA5) in SKCM. Western blotting showing expression of SCARA5 in three SKCM tissues and adjacent normal tissues. Glyceraldehyde-3-Phosphate Dehydrogenase (GADPH) added as a loading control (A). *p < 0.05. Reverse transcription PCR detection of SCARA5 mRNA expression in three SKCM tissues and adjacent normal tissues (B). N, normal tissue; T, tumor.
Kaplan–Meier analysis was conducted to assess the difference in overall survival (OS) in SKCM patients between patients with high and low SCARA5 expression. The results showed that the 5-year survival rate of patients with low SCARA5 expression was significantly lower than that of patients with high SCARA5 expression (Figure 10C, log-rank test p = 0.001).
We performed a univariate analysis of each variable according to the OS of SKCM patients to investigate variables with potential prognostic significance. Differences in prognosis were assessed by determining each variable’s hazard ratio (HR) and p-value. The relative importance of each variable was then examined using a Cox proportional hazards model. Multiple stepwise regression analysis confirmed that SCARA5 expression and histological stage were significant prognostic factors for OS in SKCM patients. Finally, multivariate analysis showed that SCARA5 protein expression was significantly associated with poor prognosis in SKCM patients and was an independent prognostic factor (Table 5).
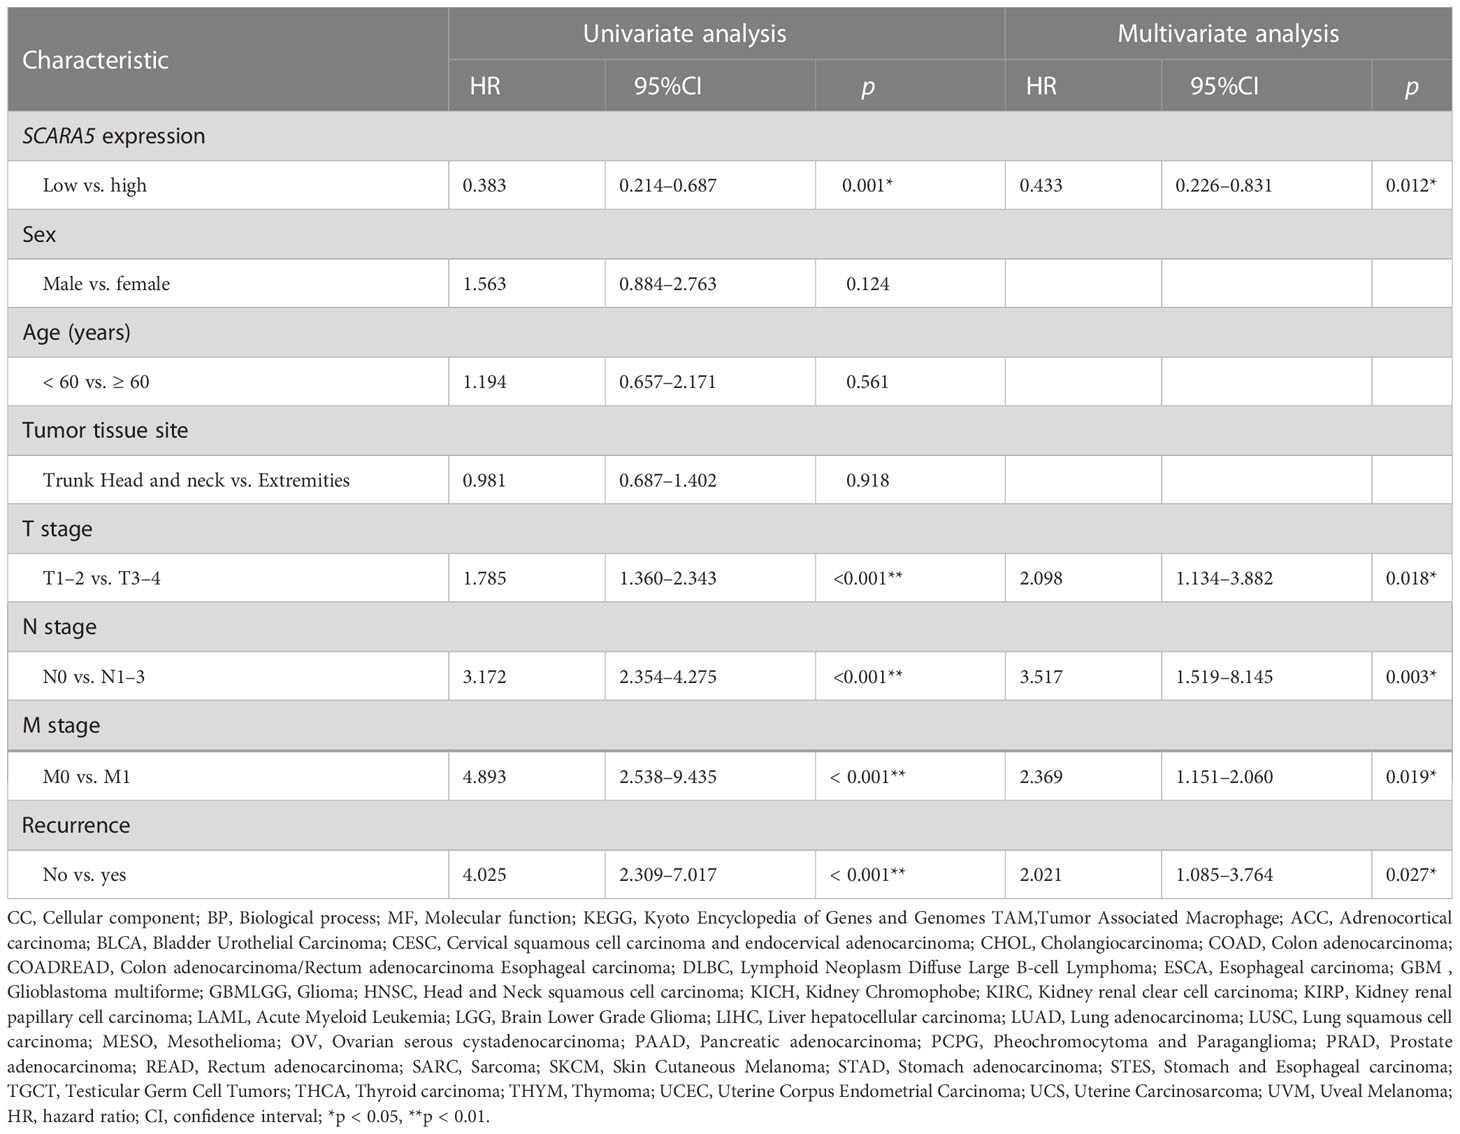
Table 5 Univariate and multivariate analysis of prognostic factors of 5-year overall survival in scavenger receptor class A member 5 (SCARA5) patients.
Malignant melanoma is one of the malignancies with the highest metastatic potential and is the most lethal skin cancer worldwide (38). The high mortality of malignant melanoma is associated with the occurrence of melanoma metastases. Metastatic melanoma is very aggressive and resistant to currently available chemotherapy and immunotherapy (39). Given that T-cell infiltration is often found in malignant melanoma tumors, inhibition of immune checkpoints is a potential therapeutic modality (40). Identifying novel epitopes from oncogenic mutations, such as tumor vaccines and adoptively transferred tumor-reactive T cells, is important for improving immunotherapy’s efficacy. Moreover, checkpoint blockade therapy in immunotherapy can stimulate cytotoxic T lymphocytes to recognize these neo-epitopes in patients (41).
SCARA5 is a member of the scavenger receptor family located on chromosome 8p21 (a region frequently deleted in human cancers). SCARA5 has been shown to act as a tumor suppressor gene to suppress various cancers (42). For instance, Yan et al. found that SCARA5 significantly inhibited gastric cancer cells, with an inhibitory effect of 69.4%, tumor proliferation index of 23.3%, apoptotic index of 47.3%, and reduced tumor angiogenesis (43). Huang et al. documented methylation in the SCARA5 promoter region of Hepatocellular carcinoma (HCC) cells, accounting for low SCARA5 expression and hence enhanced in vivo tumorigenicity, cell invasion, and tumor metastasis. In contrast, SCARA5 overexpression inhibits tumorigenicity, cell invasion, and metastasis (11). In addition, Zhang et al. showed that SCARA5 inhibits the invasive function of gastric cancer cells by affecting the initiation of Epithelial-mesenchymal transition (EMT) (14). However, its role in skin malignant melanoma remains unclear.
In human organs, SCARA5 is mainly found in the airways, developing aorta, and muscle bundles, and is abundantly expressed in gonadal epithelial cells (10). Interestingly, SCARA5 acts as a ferritin receptor to mediate non-transferrin iron transmission (44). Extracellular ferritin, a non-transferrin siderophore that various cells can endocytose, was shown by in situ hybridization to be specifically located at the cell edge. Significant upregulation of SCARA5 was observed, while ferritin uptake was observed in both embryos (44). Together, these findings indicate that SCARA5 has a relatively broad tissue distribution and can internalize ferritin to remove ferritin or transport iron. There is a rich body of literature available suggesting that the degradation of ferritin by autophagy can promote ferroptosis (45–48). Therefore, SCARA5 with ferritin recognition and uptake functions may be involved in regulating ferritin homeostasis and cell death, suggesting that SCARA5 may be a potential target for therapeutic strategies in cancer and other diseases (49). Ferroptosis is closely related to immune infiltration, and its damage-associated molecular patterns (DAMPs) can release proinflammatory mediators, such as HMGB1. Ferroptosis has recently been associated with T cell-mediated antitumor immunity and the efficacy of tumor immunotherapy. Importantly, ferroptosis contributes to the antitumor effect of CD8+ T cells and determines the efficacy of anti-PD-1/PD-L1 immunotherapy. It is widely thought that immunotherapy combined with ferroptosis-promoting modalities, such as radiation therapy and targeted therapy, can have a synergistic effect through ferroptosis of promoting tumor control. According to the previous literature, SCARA5 is highly correlated with immune infiltration, suggesting that SCARA5 has great potential as a target for ferroptosis when combined with immunotherapy, which has important biological and clinical significance.
In this study, we conducted bioinformatics analysis on high-throughput RNA sequencing data from TCGA to show that SCARA5 exhibited significantly lower expression in SKCM tissues than in paired normal tissues. Moreover, SCARA5 can play an inhibitory role in the occurrence and progression of SKCM. ROC analysis yielded an AUC of 0.813, suggesting that SCARA5 may be a potential diagnostic biomarker of SKCM. Subsequently, we further studied the relationship between SCARA5, immune cells, and immune molecules, and found that SCARA5 is highly correlated with immunity. A review of the literature yielded few studies on the relationship between SCARA5 and SKCM, and its prognostic value. We constructed a prognostic gene signature model based on the SCARA5 Kaplan–Meier curve, which yielded a good performance for SKCM survival prediction. We found that the OS, Pulmonary Functional Imaging (PFI), and Disease-Specific Survival (DSS) were poorer in SKCM patients in the low-SCARA5-expression group. Multivariate analysis showed that SCARA5 is an independent factor affecting the survival of SKCM patients (p < 0.05) and can be used as a biomarker of SKCM.
We found that SCARA5 expression in malignant melanoma was significantly correlated with immune infiltration levels. Overwhelming evidence indicates that the malignant melanoma microenvironment contributes to the immunological changes during SKCM progression, suggesting that SCARA5 may play an important role in the immune system. Therefore, this study compared the differences in immune cell infiltration between patients with high and low expression of SCARA5. In recent years, much emphasis has been placed on better understanding the tumor microenvironment. It is widely thought that the tumor microenvironment can promote the occurrence, development, recurrence, and metastasis of tumors and is an important structure in the body (50, 51). A comprehensive analysis of tumor-infiltrating cells, cytokines/chemokines, gene expression, etc. to formulate individualized and precise immunotherapy for patients with malignant melanoma is of great significance for effectively evaluating and predicting the efficacy of immunotherapy.
Moreover, we demonstrated the clinical prognostic value of SCARA5. It has been shown that the expression of SCARA5 is related to malignant melanoma, with a significant correlation with TNM stage and recurrence. Based on TCGA database analysis, our prognostic model showed that SCARA5 expression has a high prognostic value. Based on our integrated analysis of the GEO and TCGA databases, we believe that SCARA5 can be used as an effective prognostic indicator, playing an important role in guiding the individualized treatment of SKCM patients.
Some limitations in the present study should be acknowledged. First, we only preliminarily investigated the role of SCARA5 expression in SKCM. Further validation through in vitro and in vivo experiments is warranted to investigate the underlying molecular mechanisms and their biological functions to deepen our understanding of the direct effects of SCARA5 on SKCM. Indeed, more clinical information on tumor progression and prognosis is warranted to better understand the relationship between SCARA5 and SKCM.
In this study, we found that low expression of SCARA5 was significantly associated with poor prognosis in SKCM patients and could promote the progression of SKCM, suggesting its value as a potential biomarker for SKCM. Through immune infiltration analysis and GSEA, we demonstrated that SCARA5 also plays a very important role in the tumor immune microenvironment, providing a foothold for future studies on precise and individualized treatment of malignant melanoma. Finally, more population-based studies with larger sample sizes and functional studies are required to confirm our findings.
The original contributions presented in the study are included in the article/Supplementary Material. Further inquiries can be directed to the corresponding author.
The studies involving human participants were reviewed and approved by the Affiliated Hospital of Nantong University. The patients/participants provided their written informed consent to participate in this study.
ZG contributed to the conception and design of the review. QN and XL wrote the manuscript. HH collected clinical patient data and completed immunohistochemical experiments. QN and XL were co-first authors. All authors contributed to the article and approved the submitted version.
This study was supported in part by a grant from the 2021 Yancheng Medical Science and Technology Development Plan Project (YK2021022).
The authors declare that the research was conducted in the absence of any commercial or financial relationships that could be construed as a potential conflict of interest.
All claims expressed in this article are solely those of the authors and do not necessarily represent those of their affiliated organizations, or those of the publisher, the editors and the reviewers. Any product that may be evaluated in this article, or claim that may be made by its manufacturer, is not guaranteed or endorsed by the publisher.
The Supplementary Material for this article can be found online at: https://www.frontiersin.org/articles/10.3389/fonc.2023.1015358/full#supplementary-material
1. Huang YX, Song H, Tao Y, Shao XB, Zeng XS, Xu XL, et al. Ovostatin 2 knockdown significantly inhibits the growth, migration, and tumorigenicity of cutaneous malignant melanoma cells. PloS One (2018) 13(4):e0195610. doi: 10.1371/journal.pone.0195610
2. Naidoo C, Kruger CA, Abrahamse H. Simultaneous photodiagnosis and photodynamic treatment of metastatic melanoma. Molecules (2019) 24(17):3153. doi: 10.3390/molecules24173153
3. Bomar L, Senithilnathan A, Ahn C. Systemic therapies for advanced melanoma. Dermatol Clin (2019) 37(4):409–23. doi: 10.1016/j.det.2019.05.001
4. Liu K, Zhang L, Li X, Zhao J. High expression of lncRNA HSD11B1–AS1 indicates favorable prognosis and is associated with immune infiltration in cutaneous melanoma. Oncol Lett (2022) 23(2):54. doi: 10.3892/ol.2021.13172
5. Song M, Xia W, Tao Z, Zhu B, Zhang W, Liu C, et al. Self–assembled polymeric nanocarrier–mediated co–delivery of metformin and doxorubicin for melanoma therapy. Drug Deliv. (2021) 28(1):594–606. doi: 10.1080/10717544.2021.1898703
6. Li J, Jia Y, Zhang P, Yang H, Cong X, An L, et al. Celastrol self–stabilized nanoparticles for effective treatment of melanoma. Int J Nanomed (2020) 15:1205–14. doi: 10.2147/IJN.S232603
7. Feng Q, Guo P, Kang S, Zhao F. High expression of TAZ/YAP promotes the progression of malignant melanoma and affects the postoperative survival of patients. Pharmazie (2018) 73(11):662–5. doi: 10.1691/ph.2018.8499
8. Yang C, Xia Z, Zhu L, Li Y, Zheng Z, Liang J, et al. MicroRNA–139–5p modulates the growth and metastasis of malignant melanoma cells via the PI3K/AKT signaling pathway by binding to IGF1R. Cell Cycle (2019) 18(24):3513–24. doi: 10.1080/15384101.2019.1690881
9. Zhao F, Jia Z, Feng Y, Li Z, Feng J. Circular RNA circ_0079593 enhances malignant melanoma progression by the regulation of the miR–573/ABHD2 axis. J Dermatol Sci (2021) 102(1):7–15. doi: 10.1016/j.jdermsci.2021.01.008
10. Jiang Y, Oliver P, Davies KE, Platt N. Identification and characterization of murine SCARA5, a novel class a scavenger receptor that is expressed by populations of epithelial cells. J Biol Chem (2006) 281(17):11834–45. doi: 10.1074/jbc.M507599200
11. Huang J, Zheng DL, Qin FS, Cheng N, Chen H, Wan BB, et al. Genetic and epigenetic silencing of SCARA5 may contribute to human hepatocellular carcinoma by activating FAK signaling. J Clin Invest. (2010) 120(1):223–41. doi: 10.1172/JCI38012
12. Zheng C, Xia EJ, Quan RD, Bhandari A, Wang OC, Hao RT. Scavenger receptor class a, member 5 is associated with thyroid cancer cell lines progression via epithelial–mesenchymal transition. Cell Biochem Funct (2020) 38(2):158–66. doi: 10.1002/cbf.3455
13. Liu H, Hu J, Wei R, Zhou L, Pan H, Zhu H, et al. SPAG5 promotes hepatocellular carcinoma progression by downregulating SCARA5 through modifying β–catenin degradation. J Exp Clin Cancer Res (2018) 37(1):229. doi: 10.1186/s13046-018-0891-3
14. Zhang H, Liu C, Wang X, Wang Y, Zheng J. SCARA5 inhibits gastric cancer progression via epithelial–mesenchymal transition suppression. J Cancer. (2021) 12(8):2412–21. doi: 10.7150/jca.52426
15. Liu J, Zeng ML, Shi PC, Cao YP, Zhang JL, Xie YP. SCARA5 is a novel biomarker in colorectal cancer by comprehensive analysis. Clin Lab (2020) 66(7). doi: 10.7754/Clin.Lab.2019.191015
16. Wen X, Wang N, Zhang F, Dong C. Overexpression of SCARA5 inhibits tumor proliferation and invasion in osteosarcoma via suppression of the FAK signaling pathway. Mol Med Rep (2016) 13(3):2885–91. doi: 10.3892/mmr.2016.4857
17. Troadec MB, Ward DM, Kaplan J. A tf–independent iron transport system required for organogenesis. Dev Cell (2009) 16(1):3–4. doi: 10.1016/j.devcel.2008.12.013
18. Cheng C, Zheng E, Yu B, Zhang Z, Wang Y, Liu Y, et al. Recognition of lipoproteins by scavenger receptor class a members. J Biol Chem (2021) 297(2):100948. doi: 10.1016/j.jbc.2021.100948
19. You K, Su F, Liu L, Lv X, Zhang J, Zhang Y, et al. SCARA5 plays a critical role in the progression and metastasis of breast cancer by inactivating the ERK1/2, STAT3, and AKT signaling pathways. Mol Cell Biochem (2017) 435(1–2):47–58. doi: 10.1007/s11010-017-3055-4
20. Edgar R, Domrachev M, Lash AE. Gene expression omnibus: NCBI gene expression and hybridization array data repository. Nucleic Acids Res (2002) 30(1):207–10. doi: 10.1093/nar/30.1.207
21. Riker AI, Enkemann SA, Fodstad O, Liu S, Ren S, Morris C, et al. The gene expression profiles of primary and metastatic melanoma yields a transition point of tumor progression and metastasis. BMC Med Genomics (2008) 1:13. doi: 10.1186/1755-8794-1-13
22. Raskin L, Fullen DR, Giordano TJ, Thomas DG, Frohm ML, Cha KB, et al. Transcriptome profiling identifies HMGA2 as a biomarker of melanoma progression and prognosis. J Invest Dermatol (2013) 133(11):2585–92. doi: 10.1038/jid.2013.197
23. Nirschl CJ, Suárez–Fariñas M, Izar B, Prakadan S, Dannenfelser R, Tirosh I, et al. IFNγ–dependent tissue–immune homeostasis is Co–opted in the tumor microenvironment. Cell (2017) 170(1):127–141.e15. doi: 10.1016/j.cell.2017.06.016
24. Huang DW, Sherman BT, Tan Q, Collins JR, Alvord WG, Roayaei J, et al. The DAVID gene functional classification tool: a novel biological module–centric algorithm to functionally analyze large gene lists. Genome Biol (2007) 8(9):R183. doi: 10.1186/gb-2007-8-9-r183
25. Kanehisa M. The KEGG database. Novartis Found Symp (2002) 247:91–101. doi: 10.1002/0470857897.ch8
26. Franceschini A, Szklarczyk D, Frankild S, Kuhn M, Simonovic M, Roth A, et al. STRING v9.1: protein–protein interaction networks, with increased coverage and integration. Nucleic Acids Res (2013) 41(Database issue):D808–15. doi: 10.1093/nar/gks1094
27. Smoot ME, Ono K, Ruscheinski J, Wang PL, Ideker T. Cytoscape 2.8: new features for data integration and network visualization. Bioinformatics (2011) 27(3):431–2. doi: 10.1093/bioinformatics/btq675
28. Bandettini WP, Kellman P, Mancini C, Booker OJ, Vasu S, Leung SW, et al. MultiContrast delayed enhancement (MCODE) improves detection of subendocardial myocardial infarction by late gadolinium enhancement cardiovascular magnetic resonance: a clinical validation study. J Cardiovasc Magn Reson (2012) 14(1):83. doi: 10.1186/1532-429X-14-83
29. Clark NR, Hu KS, Feldmann AS, Koou Y, Chen EY, Duan Q, et al. The characteristic direction: A geometrical approach to identify differentially expressed genes. BMC Bioinf (2014) 15:79. doi: 10.1186/1471-2105-15-79
30. Davis S, Meltzer PS. GEOquery: a bridge between the gene expression omnibus (GEO) and BioConductor. Bioinformatics (2007) 23(14):1846–7. doi: 10.1093/bioinformatics/btm254
31. Gu Z, Eils R, Schlesner M. Complex heatmaps reveal patterns and correlations in multidimensional genomic data. Bioinformatics (2016) 32(18):2847–9. doi: 10.1093/bioinformatics/btw313
32. Mora A, Donaldson IM. iRefR: an r package to manipulate the iRefIndex consolidated protein interaction database. BMC Bioinf (2011) 12:455. doi: 10.1186/1471-2105-12-455
33. Vivian J, Rao AA, Nothaft FA, Ketchum C, Armstrong J, Novak A, et al. Toil enables reproducible, open source, big biomedical data analyses. Nat Biotechnol (2017) 35(4):314–6. doi: 10.1038/nbt.3772
34. Love MI, Huber W, Anders S. Moderated estimation of fold change and dispersion for RNA–seq data with DESeq2. Genome Biol (2014) 15(12):550. doi: 10.1186/s13059-014-0550-8
35. Liu J, Lichtenberg T, Hoadley KA, Poisson LM, Lazar AJ, Cherniack AD, et al. An integrated TCGA pan–cancer clinical data resource to drive high–quality survival outcome analytics. Cell (2018) 173(2):400–416.e11. doi: 10.1016/j.cell.2018.02.052
36. Hänzelmann S, Castelo R, Guinney J. GSVA: Gene set variation analysis for microarray and RNA–seq data. BMC Bioinf (2013) 14:7. doi: 10.1186/1471-2105-14-7
37. Bindea G, Mlecnik B, Tosolini M, Kirilovsky A, Waldner M, Obenauf AC, et al. Spatiotemporal dynamics of intratumoral immune cells reveal the immune landscape in human cancer. Immunity (2013) 39(4):782–95. doi: 10.1016/j.immuni.2013.10.003
38. Pietrobono S, Anichini G, Sala C, Almada LL, Pepe S, Carr RM, et al. ST3GAL1 is a target of the SOX2–GLI1 transcriptional complex and promotes melanoma metastasis through AXL. Nat Commun (2020) 11(1):5865. doi: 10.1038/s41467-020-19575-2
39. Yang J, Guo H, Gallazzi F, Berwick M, Padilla RS, Miao Y. Evaluation of a novel arg–Gly–Asp–conjugated α–melanocyte stimulating hormone hybrid peptide for potential melanoma therapy. Bioconjug Chem (2009) 20(8):1634–42. doi: 10.1021/bc9001954
40. Merchant MS, Wright M, Baird K, Wexler LH, Rodriguez-Galindo C, Bernstein D, et al. Phase I clinical trial of ipilimumab in pediatric patients with advanced solid tumors. Clin Cancer Res (2016) 22(6):1364–70. doi: 10.1158/1078-0432.CCR-15-0491
41. Chang TC, Carter RA, Li Y, Wang H, Edmonson MN, Chen X, et al. The neoepitope landscape in pediatric cancers. Genome Med (2017) 9(1):78. doi: 10.1186/s13073-017-0468-3
42. Ulker D, Ersoy YE, Gucin Z, Muslumanoglu M, Buyru N. Downregulation of SCARA5 may contribute to breast cancer via promoter hypermethylation. Gene (2018) 673:102–6. doi: 10.1016/j.gene.2018.06.036
43. Yan N, Zhang S, Yang Y, Cheng L, Li C, Dai L, et al. Therapeutic upregulation of class a scavenger receptor member 5 inhibits tumor growth and metastasis. Cancer Sci (2012) 103(9):1631–9. doi: 10.1111/j.1349-7006.2012.02350.x
44. Li JY, Paragas N, Ned RM, Qiu A, Viltard M, Leete T, et al. SCARA5 is a ferritin receptor mediating non–transferrin iron delivery. Dev Cell (2009) 16(1):35–46. doi: 10.1016/j.devcel.2008.12.002
45. Gao M, Monian P, Pan Q, Zhang W, Xiang J, Jiang X. Ferroptosis is an autophagic cell death process. Cell Res (2016) 26(9):1021–32. doi: 10.1038/cr.2016.95
46. Hou W, Xie Y, Song X, Sun X, Lotze MT, Zeh HJ 3rd, et al. Autophagy promotes ferroptosis by degradation of ferritin. Autophagy (2016) 12(8):1425–8. doi: 10.1080/15548627.2016.1187366
47. Latunde–Dada GO. Ferroptosis: Role of lipid peroxidation, iron and ferritinophagy. Biochim Biophys Acta Gen Subj. (2017) 1861(8):1893–900. doi: 10.1016/j.bbagen.2017.05.019
48. Tang M, Chen Z, Wu D, Chen L. Ferritinophagy/ferroptosis: Iron–related newcomers in human diseases. J Cell Physiol (2018) 233(12):9179–90. doi: 10.1002/jcp.26954
49. Yu B, Cheng C, Wu Y, Guo L, Kong D, Zhang Z, et al. Interactions of ferritin with scavenger receptor class a members. J Biol Chem (2020) 295(46):15727–41. doi: 10.1074/jbc.RA120.014690
50. Hui L, Chen Y. Tumor microenvironment: Sanctuary of the devil. Cancer Lett (2015) 368(1):7–13. doi: 10.1016/j.canlet.2015.07.039
Keywords: SCARA5, melanoma, tumor-infiltrating, immunohistochemistry, bioinformatics analysis
Citation: Ni Q, Li X, Huang H and Ge Z (2023) Decreased expression of SCARA5 predicts a poor prognosis in melanoma using bioinformatics analysis. Front. Oncol. 13:1015358. doi: 10.3389/fonc.2023.1015358
Received: 09 August 2022; Accepted: 24 February 2023;
Published: 24 March 2023.
Edited by:
Vladimir Spiegelman, Penn State Milton S. Hershey Medical Center, United StatesReviewed by:
Viviana Bazan, University of Palermo, ItalyCopyright © 2023 Ni, Li, Huang and Ge. This is an open-access article distributed under the terms of the Creative Commons Attribution License (CC BY). The use, distribution or reproduction in other forums is permitted, provided the original author(s) and the copyright owner(s) are credited and that the original publication in this journal is cited, in accordance with accepted academic practice. No use, distribution or reproduction is permitted which does not comply with these terms.
*Correspondence: Zili Ge, Z2V6bEAxNjMuY29t
†These authors have contributed equally to this work and share first authorship
Disclaimer: All claims expressed in this article are solely those of the authors and do not necessarily represent those of their affiliated organizations, or those of the publisher, the editors and the reviewers. Any product that may be evaluated in this article or claim that may be made by its manufacturer is not guaranteed or endorsed by the publisher.
Research integrity at Frontiers
Learn more about the work of our research integrity team to safeguard the quality of each article we publish.