 Jing Chen
 Yibing Liu
 Ke Xu
Ke Xu Fei Ren3
 Hong Sun
- 1Hebei Key Laboratory for Chronic Diseases, School of Basic Medical Sciences, North China University of Science and Technology, Tangshan, China
- 2The Third Bethune Clinical Medical College, Jilin University, Changchun, China
- 3The Second Bethune Clinical Medical College, Jilin University, Changchun, China
Background: Gastroenteropancreatic neuroendocrine carcinomas (GEP-NECs) are a rare, highly malignant subset of gastroenteropancreatic neuroendocrine neoplasms (GEP-NENs). However, how to predict the prognosis of GEP-NECs by clinical features is still under study. This study aims to establish and validate a nomogram model of overall survival (OS) in patients with GEP-NECs for predicting their prognosis.
Methods: We selected patients diagnosed with GEP-NECs from the Surveillance, Epidemiology, and End Results (SEER) database and two Chinese hospitals. After randomization, we divided the data in the SEER database into the train cohort and the test cohort at a ratio of 7:3 and used the Chinese cohort as the validation cohort. The Cox univariate and multivariate analyses were performed to incorporate statistically significant variables into the nomogram model. We then established a nomogram and validated it by concordance index (C-index), calibration curve, receiver operating characteristic (ROC) curve, the area under the curve (AUC), and the decision curve analysis (DCA) curve.
Results: We calculated the nomogram C-index as 0.797 with a 95% confidence interval (95% CI) of 0.783–0.815 in the train cohort, 0.816 (95% CI: 0.794–0.833) in the test cohort and 0.801 (95% CI: 0.784–0.827) in the validation cohort. Then, we plotted the calibration curves and ROC curves, and AUCs were obtained to verify the specificity and sensitivity of the model, with 1-, 3- and 5-year AUCs of 0.776, 0.768, and 0.770, respectively, in the train cohort; 0.794, 0.808, and 0.799 in the test cohort; 0.922, 0.925, and 0.947 in the validation cohort. The calibration curve and DCA curves also indicated that this nomogram model had good clinical benefits.
Conclusions: We established the OS nomogram model of GEP-NEC patients, including variables of age, race, sex, tumor site, tumor grade, and TNM stage. This model has good fitting, high sensitivity and specificity, and good clinical benefits.
Introduction
Neuroendocrine carcinomas (NECs) are a rare, highly malignant subgroup of neuroendocrine neoplasms (NENs), while the gastroenteropancreatic system is one of the most common areas from which NECs can originate (1, 2). With the improvement of diagnostic techniques of the gastroenteropancreatic system, such as the wide use of gastroscopy, colonoscopy, and ultrasonic examination, an increasing number of patients with early gastroenteropancreatic NECs (GEP-NECs) can be diagnosed. Therefore, the incidence of GEP-NECs has increased gradually in recent years (3–5). The incidence of NECs is less well defined due to changes in WHO classification over the past 10 years (6), but epidemiological studies estimate the rate to be approximately 0.4 per 100,000 person-years (5, 7). In the United States, a total of 6,291 cases with GEP-NECs were diagnosed between 1973 and 2012 (8). To get things worse, the prognosis is poor, with a median survival of only 19 months (9, 10). The ever-increasing number of cases and poor prognosis have also pushed researchers to develop better models to better understand the disease.
At present, few studies focus only on GEP-NECs, while more studies concentrate on gastroenteropancreatic neuroendocrine tumors (GEP-NETs), another subtype of gastroenteropancreatic NENs (GEP-NENs) that are less malignant and have more cases and a wider range. It is generally believed that the factors affecting the prognosis of GEP-NETs mainly include the patient’s age, tumor grade, pathological stage, and primary tumor site (1, 11–13). However, the existing models only analyze the influence of a single factor on the prognosis of the disease, so the prediction effect can be very limited. At present, there is no prognostic model for GEP-NECs alone. Since GEP-NECs and GEP-NETs are different subtypes of GEP-NENs, it is questionable whether the prognostic prediction model of GEP-NETs is fully applicable to GEP-NECs. Therefore, we want to take cases from a larger database and integrate these potential prognostic factors to build a better model focusing on GEP-NECs that can be used by a large number of clinicians.
For this purpose, we retrieved and collected the data of patients with GEP-NECs from the Surveillance, Epidemiology, and End Results (SEER) database and two Chinese hospitals and constructed and validated a nomogram based on clinicopathological information.
Methods
Database and study population from the SEER database
We reviewed patients diagnosed with GEP-NECs between 1988 and 2019 from the SEER database, which was established in the United States to provide first-hand information for clinical work worldwide (14, 15). All data were downloaded from SEER*Stat 8.4.0.1. The inclusion and exclusion criteria for the data are as follows 1): They all had a definite diagnosis according to the 2003 WHO diagnostic criteria for NECs 2). Patients with benign tumors or tumors suspicious for malignancy without confirmation were excluded from this study 3). The tumor must have originated in the gastroenteropancreatic system rather than metastatic cancer 4). We excluded patients with unknown survival time, race, M stage, or tumor grade. Through the above criteria, we finally selected 4251 patients to be included in our study and randomly divided the population into a train cohort and a test cohort at a ratio of 7:3. The data filtering process is shown in Figure 1.
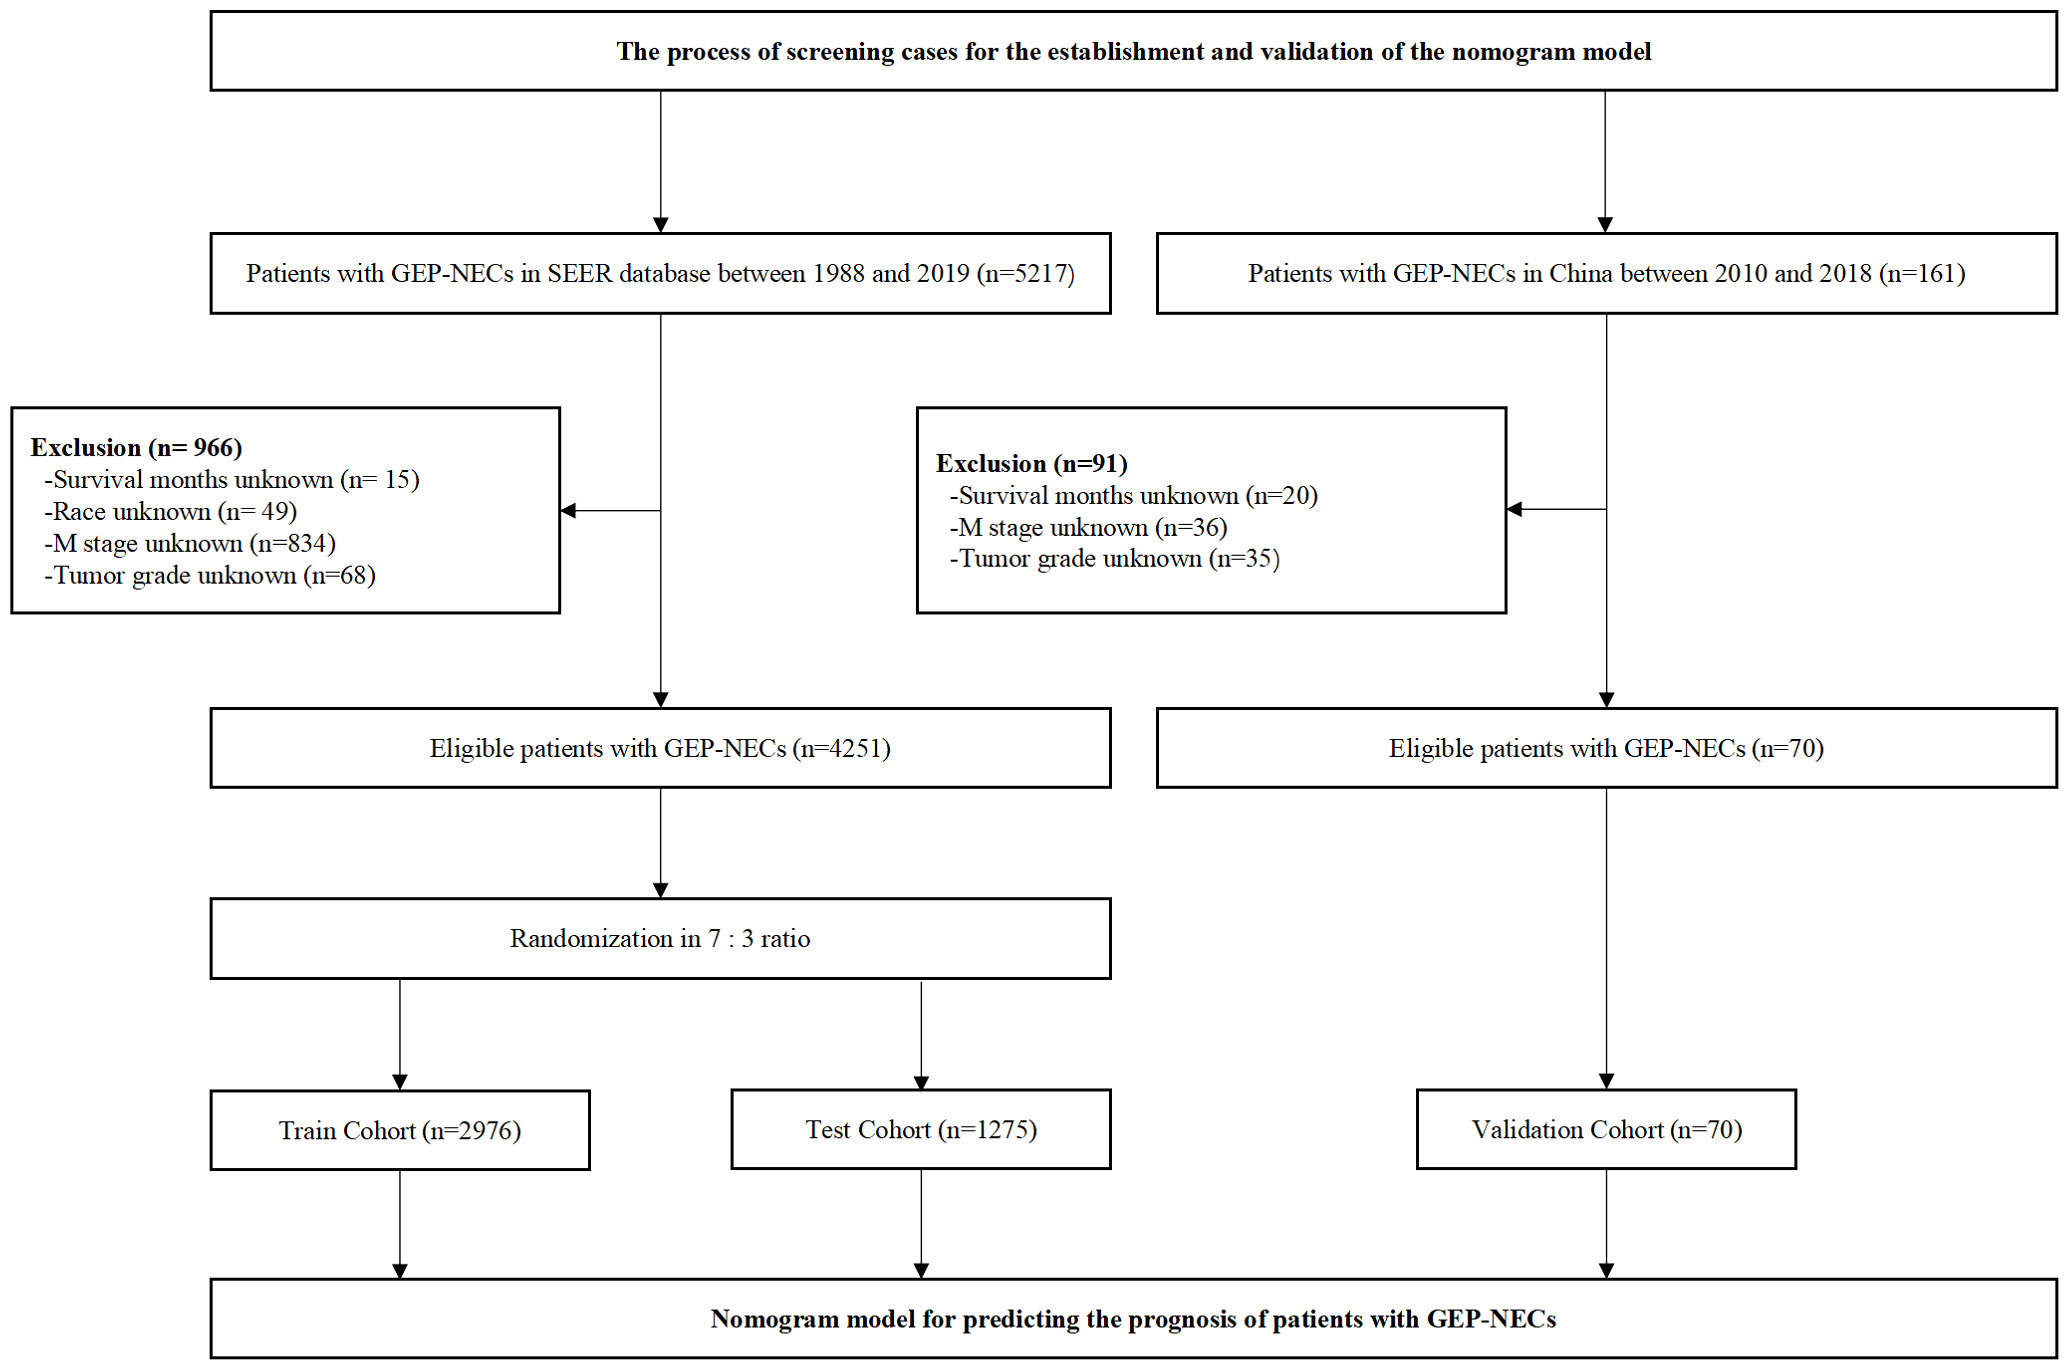
Figure 1 Flow chart of data filtering. SEER, Surveillance, Epidemiology, and End Results; GEP-NECs, gastroenteropancreatic neuroendocrine carcinomas.
Database and study population from two Chinese hospitals
To better verify the applicability of the constructed nomogram model in Chinese patients, we reviewed patients of the Second Hospital of Jilin University and China-Japan Union Hospital of Jilin University between 2010 and 2018. The screening criteria were consistent with those patients from the SEER database, which are described above. Finally, 70 patients with GEP-NECs were selected as the validation cohort. The data filtering process is shown in Figure 1.
Selection of clinical variables
While the prognostic factors of GEP-NECs are still uncertain, prognostic factors of GEP-NETs were used as variables to be included in the nomogram model. Existing studies have shown that older age, male sex, high tumor stage, and low tumor differentiation are markers of poor tumor prognosis, and tumors originating in the pancreas have the worst prognosis (16–23). Therefore, we identified several factors, including age, sex, tumor site, tumor grade, and tumor-node-metastasis (TNM) stage. In the variable of tumor site, we included tumors originating from the large intestine, pancreas, small intestine and stomach, in which the large intestine includes colon, rectum, anus, anal canal and anorectum. In addition, race was also included in the nomogram model as one of the variables, since our data involved different ethnic groups. All the above variables were included in the nomogram model. For clinical outcomes, overall survival (OS) was selected as the endpoint.
Establishment and validation of the nomogram model
We used IBM SPSS Statistic to perform univariate and multivariate Cox regression models in the train cohort to determine variables that would be output for the establishment of the nomogram model. Once we obtained these variables, we used R software 4.2.1 to build a nomogram model. Then, the test and validation cohorts were used to evaluate the newly established nomogram. The comparison between nomogram prediction and actual observation was assessed by the concordance index (C-index) and the calibration curve. The receiver operating characteristic (ROC) curve and area under the curve (AUC) were used to evaluate the sensitivity and specificity of the model. In addition, we plotted the decision curve analysis (DCA) curve of this nomogram model to verify the clinical benefits. All analyses were completed with R software 4.2.1 and IBM SPSS software, and the analysis was statistically significant only when P<0.05.
Results
Clinicopathological data of included cases
According to the inclusion and exclusion criteria, a total of 4251 cases in the SEER database were eventually included in this study, of which 2976 were assigned to the train cohort and 1275 were randomly assigned to the test cohort. Among all patients, 46.72% were younger than 60 years old, 53.28% were older than 60 years old, 53.94% were male, and 46.06% were female; 11.79% were black, 76.55% were white, and 11.67% were other races; 32.96% had large intestine cancer, 20.63% had small intestine cancer, 38.37% had pancreatic cancer, and 8.05% had stomach cancer. No significant differences were found between the train and test cohorts in each contained variable. Furthermore, we also selected 70 cases from the two qualified Chinese hospitals as the validation cohort, among which 52.86% were younger than 60 years old, 47.14% were older than 60 years old, 70% were male, and 30% were female. Since these cases were from the colorectal surgery departments of two hospitals in China, none of the patients were white or black, and the primary tumor site was in the large intestine. All results are shown in Table 1.
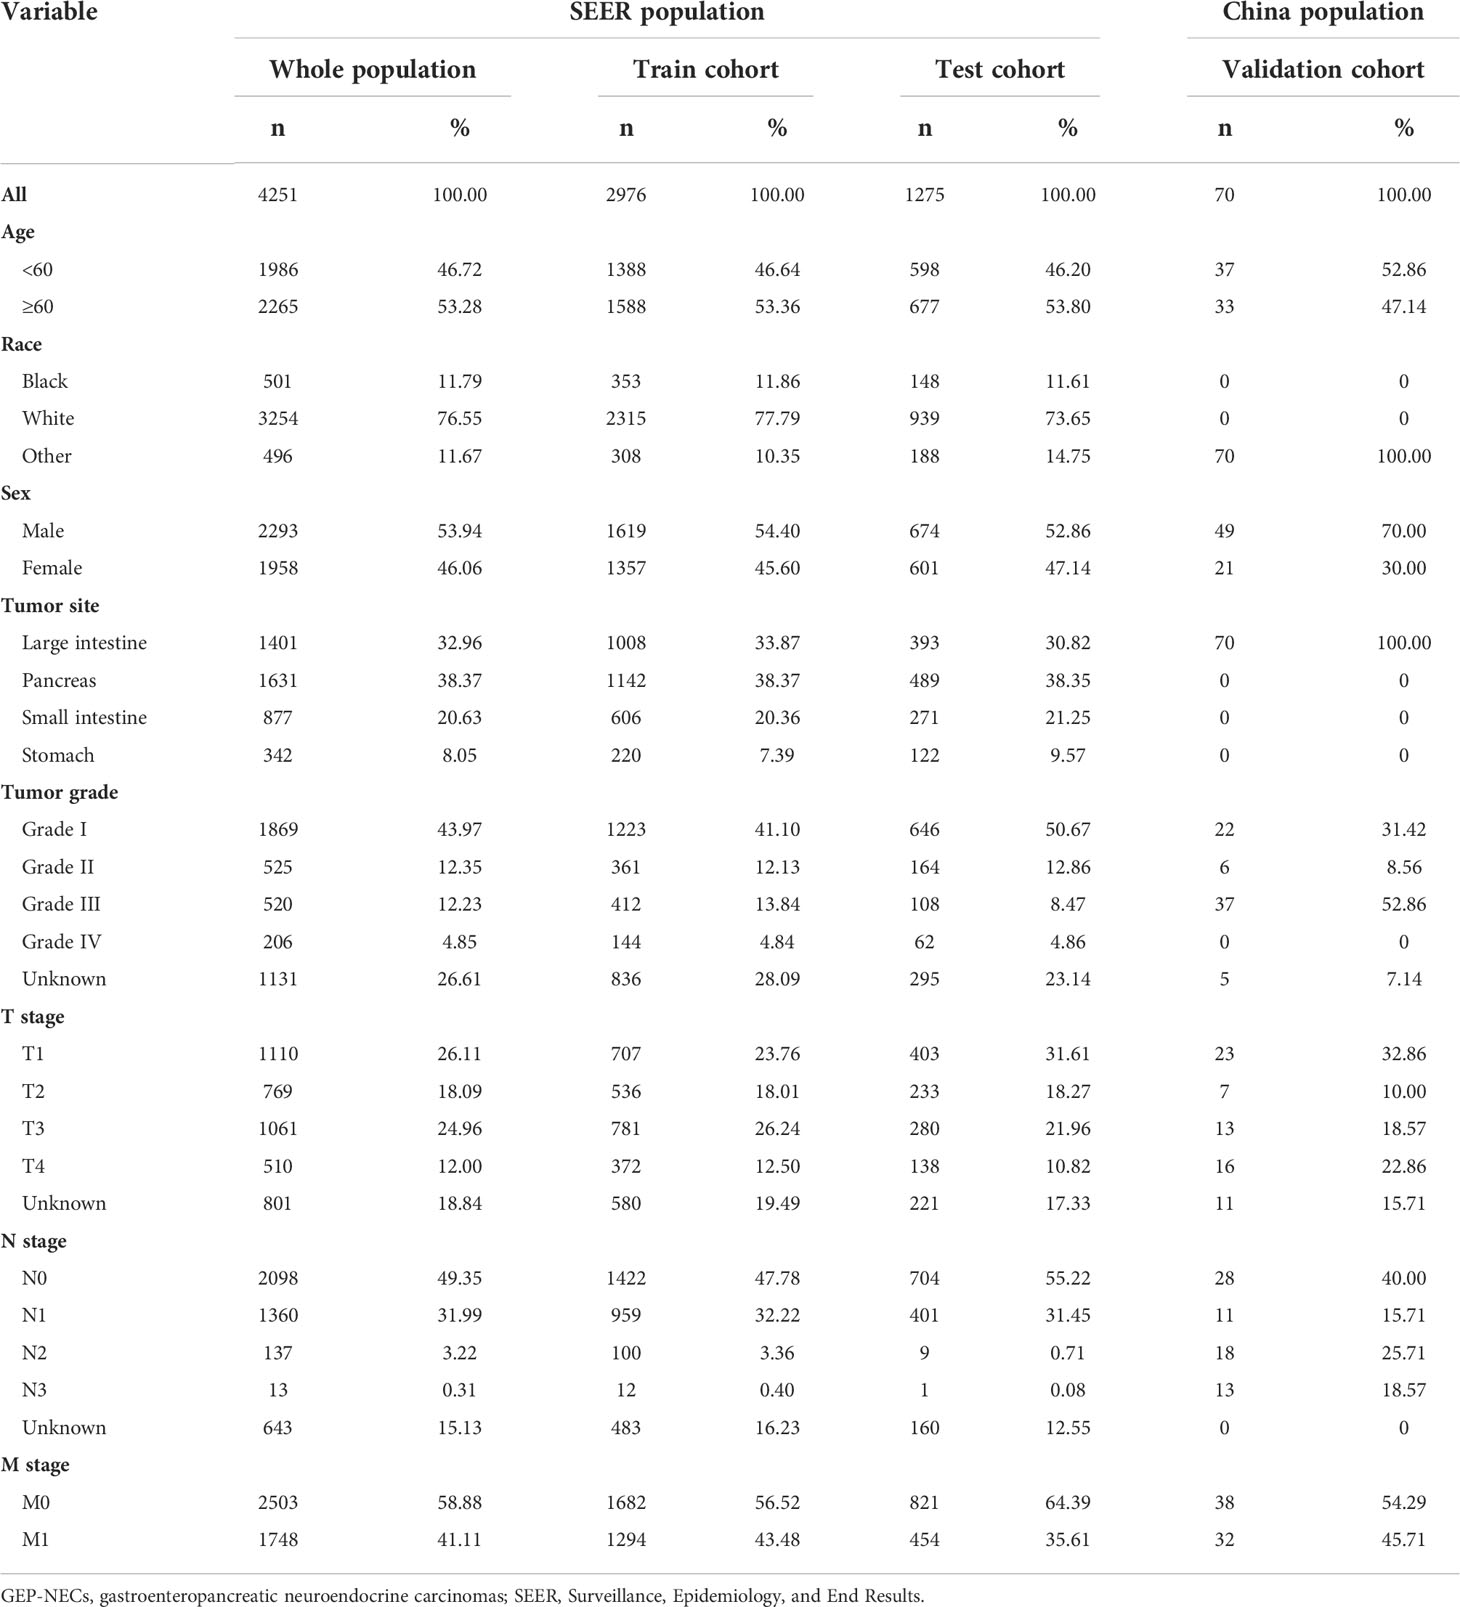
Table 1 Clinicopathological and demographic characteristics of patients with GEP-NECs.
Establishment of the nomogram model
The results of univariate and multivariate analyses are shown in Table 2. According to the results of univariate Cox analysis, age, sex, tumor site, tumor grade, and TNM stage all showed highly significant differences. In the multifactorial Cox analysis, age, race, sex, tumor site, tumor grade, and TNM stage were all significantly identified. Therefore, all the above variables were incorporated into the models, establishing 1-, 3-, and 5-year nomogram models. The result is shown in Figure 2.
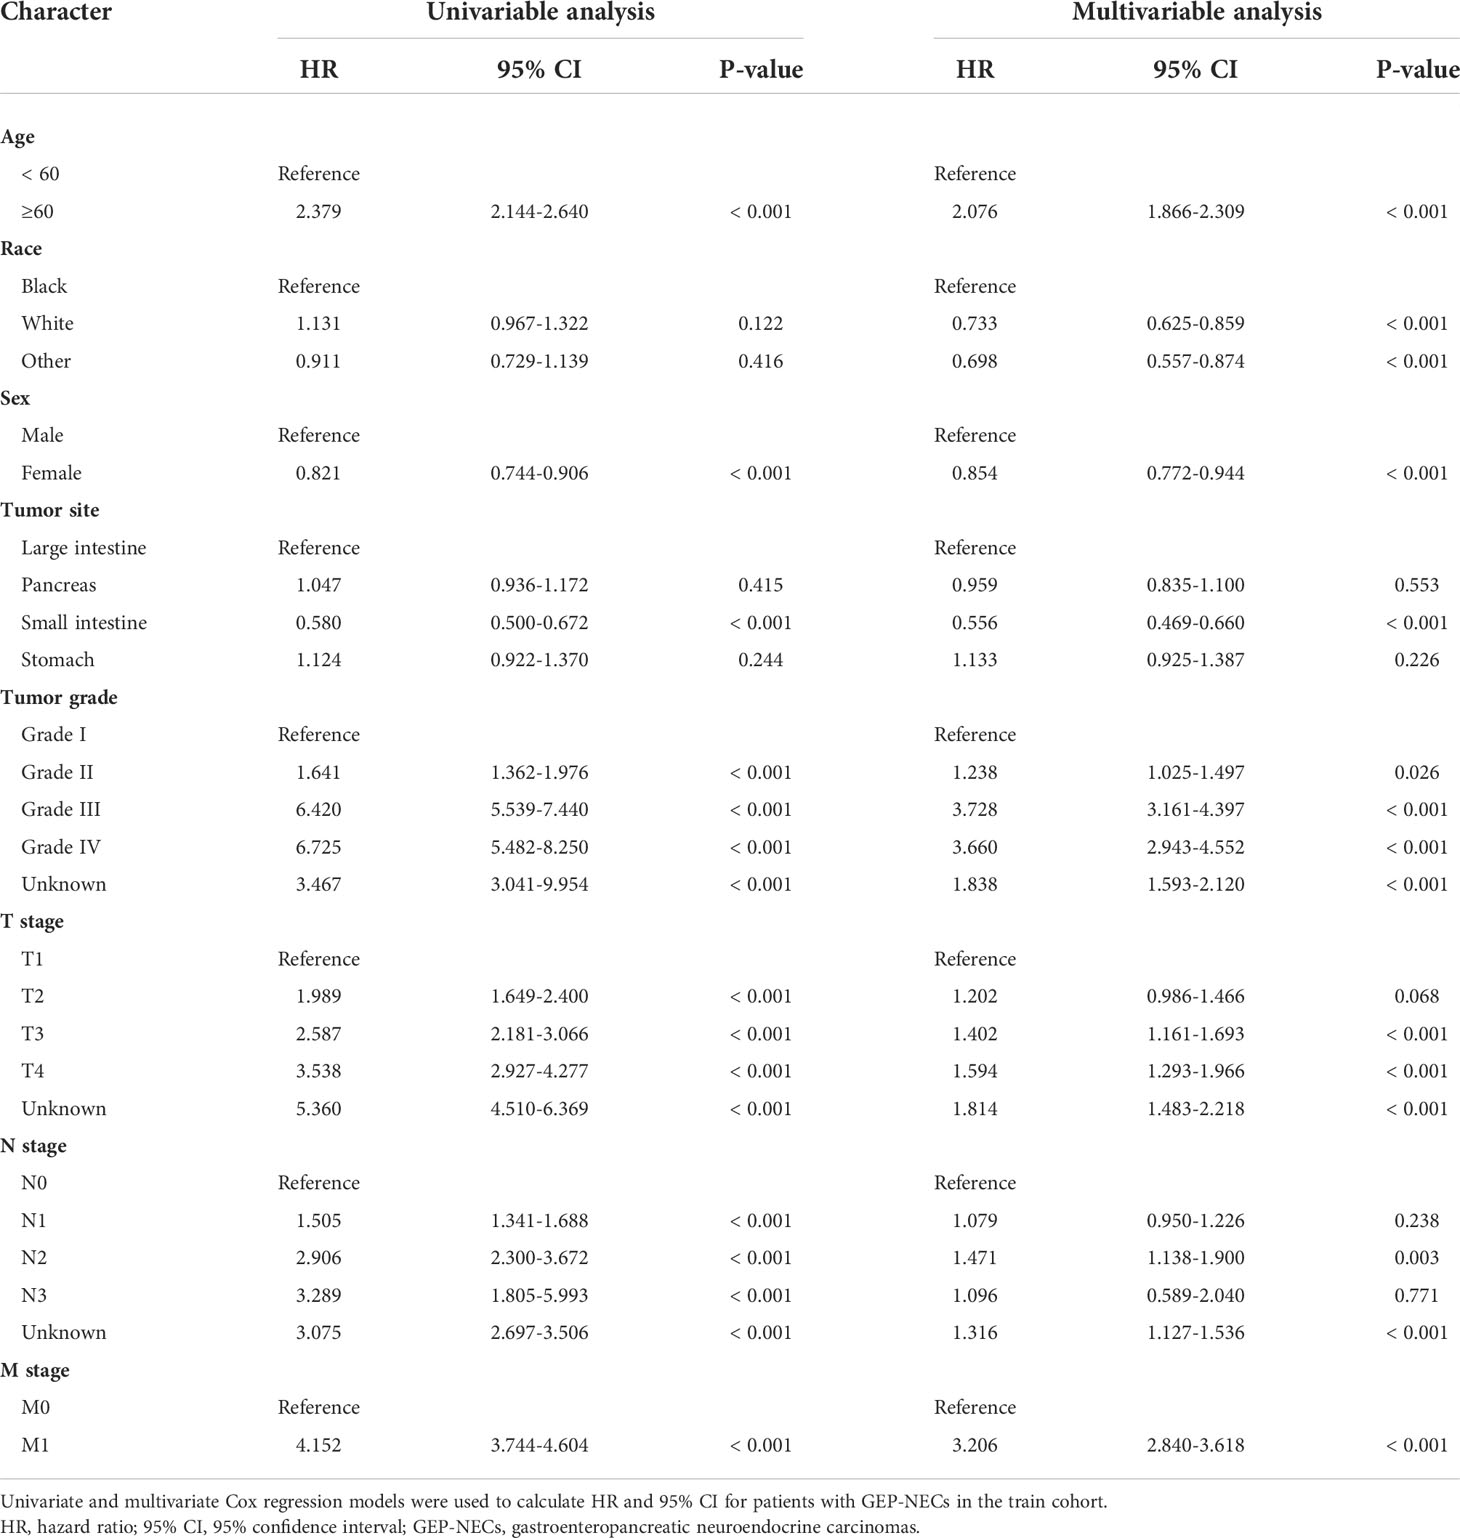
Table 2 Univariate and multivariate analysis of overall survival in the train cohort.
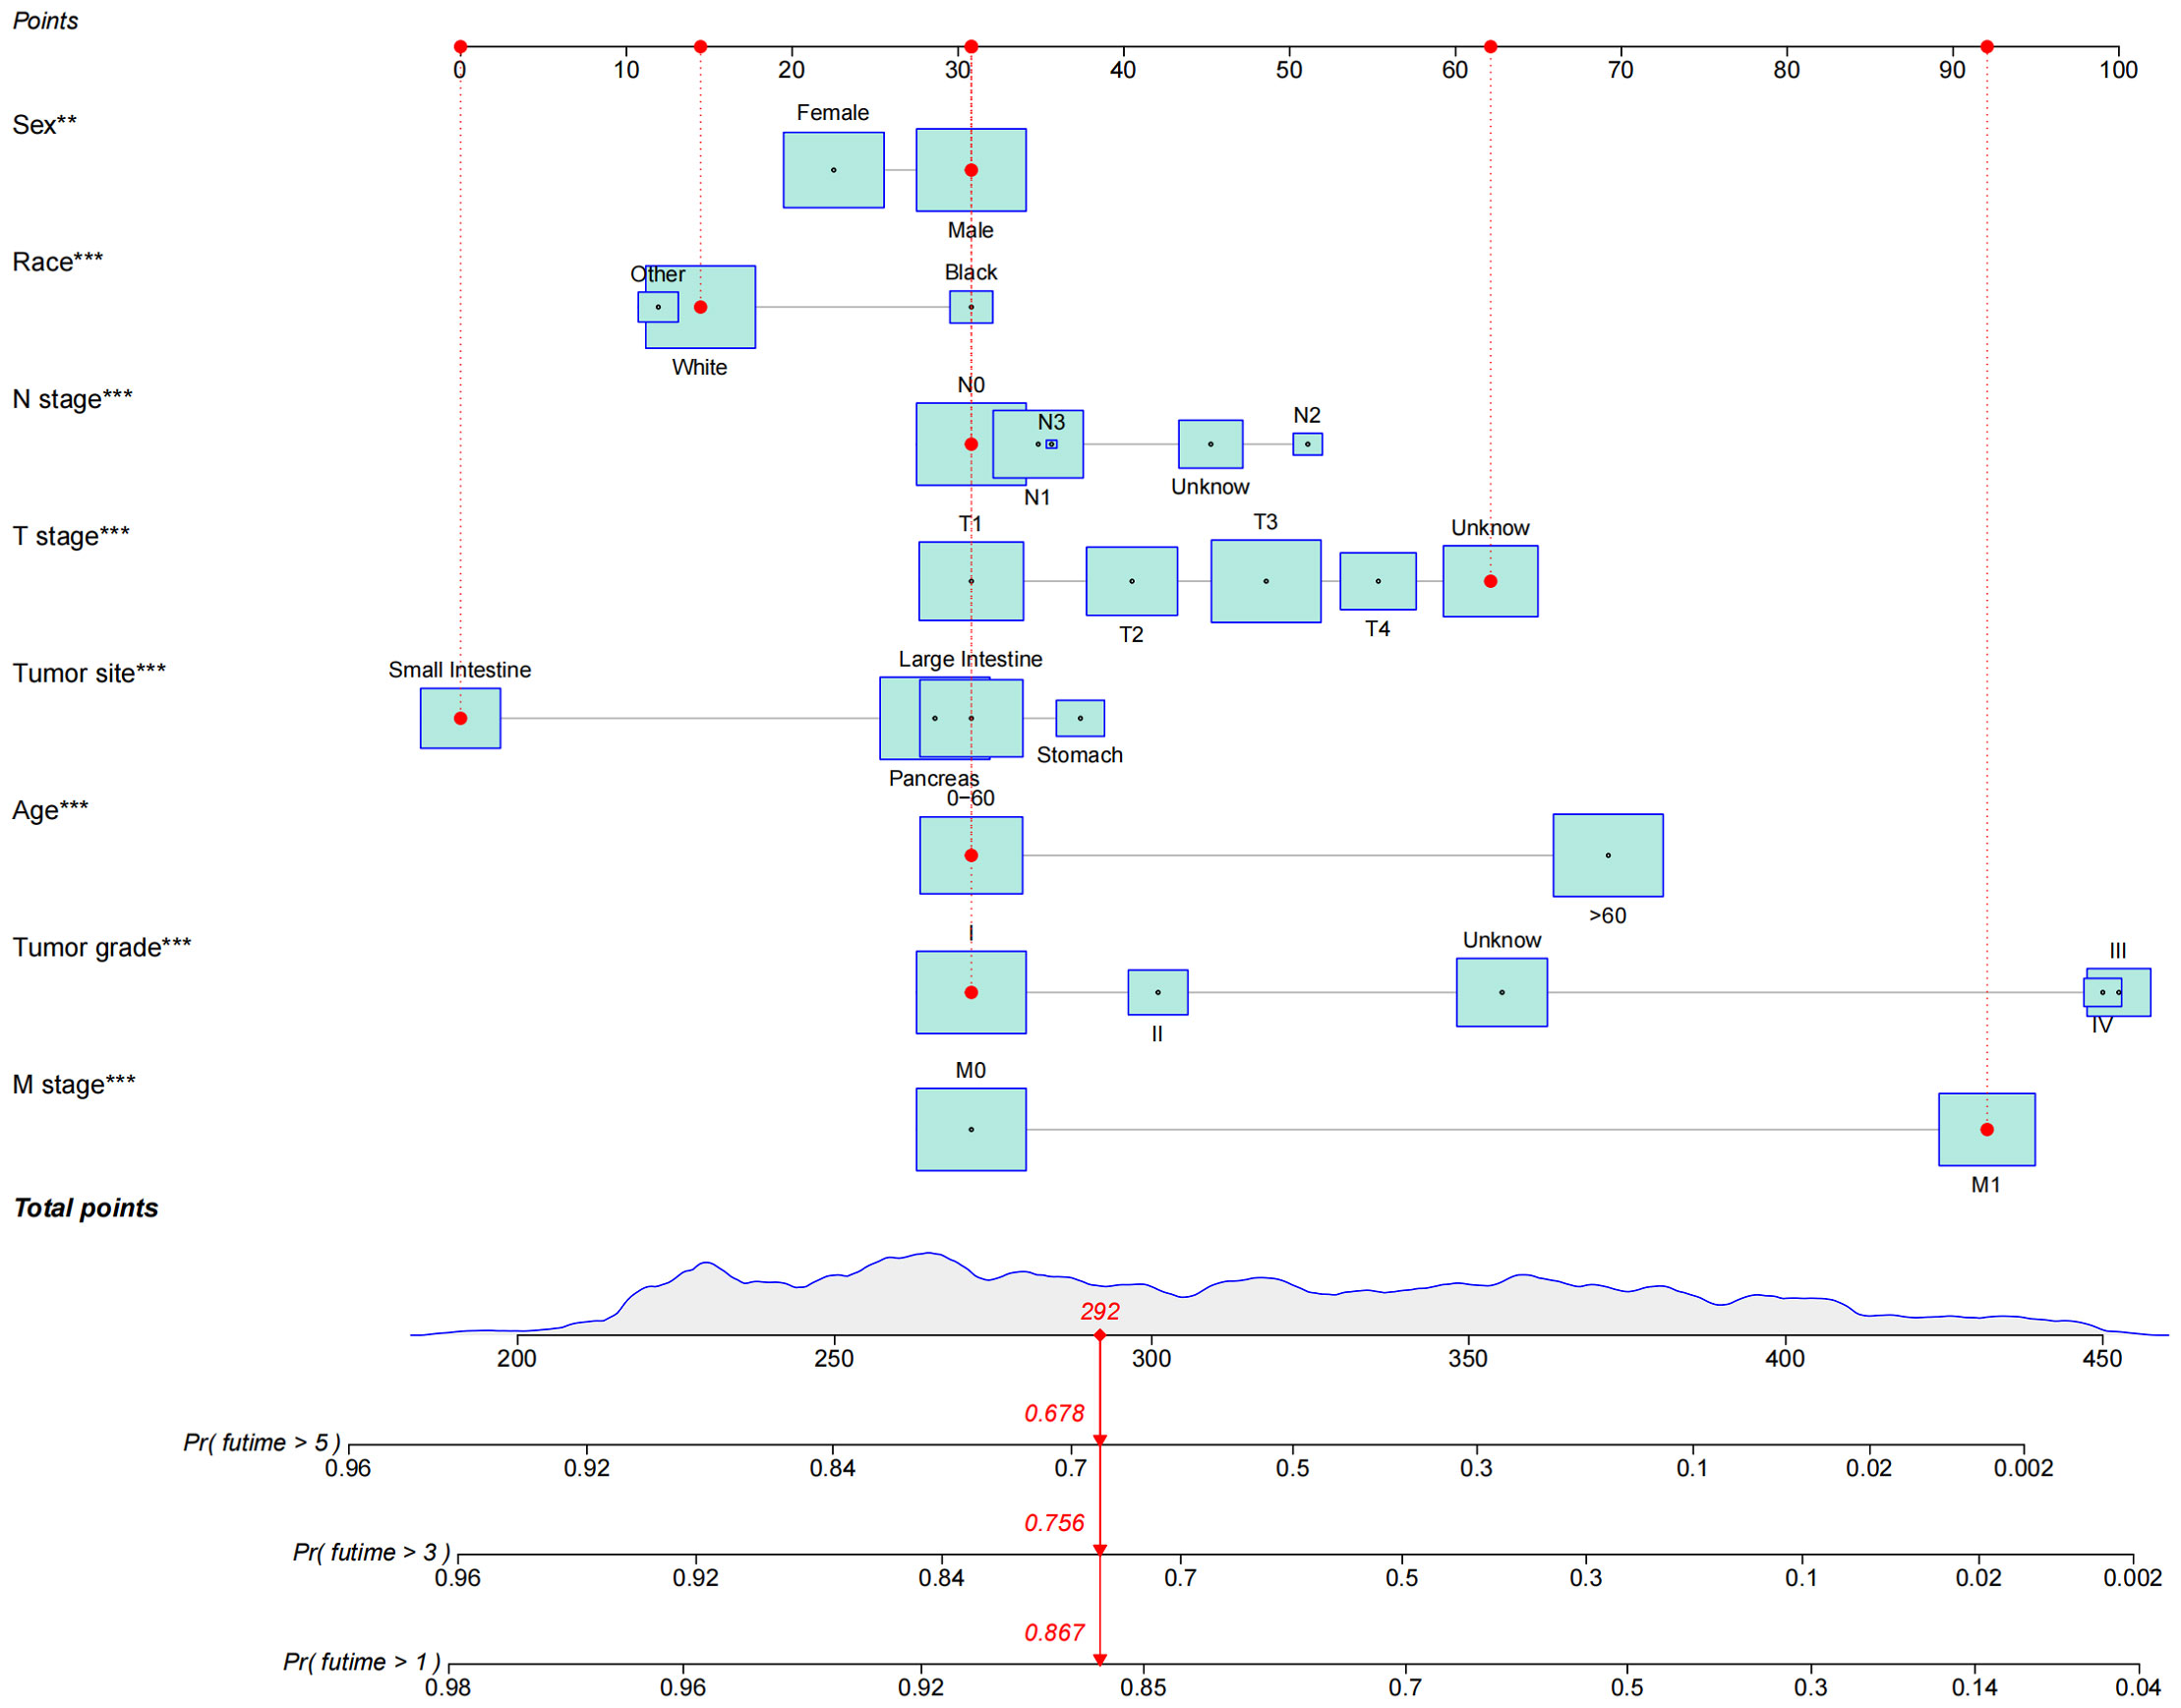
Figure 2 Nomogram of OS established to predict prognosis of patients with GEP-NECs. The red dots and red lines in the figure represent a random example. The patient was a white male younger than 60 years old with small intestine neuroendocrine carcinoma whose T stage was unknown, N stage was N0, M stage was M1, and tumor grade was G1. According to the rotors, the total score of the patients was 292; thus, the 1-, 3- and 5-year survival rates were 86.7%, 75.6%, and 67.8%, respectively.OS, overall survival; GEP-NECs, gastroenteropancreatic neuroendocrine carcinomas. ** P<0.01, *** P<0.001.
Nomogram validation
The validation process was carried out internally and externally using the C-index and calibration curves as validation tools. Specifically, the C-index of the OS nomogram was 0.797, with a 95% confidence interval (95% CI) of 0.783–0.815 in the train cohort and 0.816 (95% CI: 0.794–0.833) in the test cohort, as shown in Table 3 and Figure 3. At the same time, the calibration curve showed that the prediction results of the OS nomogram model were of high quality (Figure 4). Next, to verify the sensitivity and specificity of the nomogram model, we performed ROC analysis of the OS nomogram, as shown in Figure 5. From the figure, we can see that the 1-, 3- and 5-year AUCs in the train cohort are 0.776, 0.768, and 0.770, respectively, while they are 0.794, 0.808, and 0.799 in the test cohort, which shows that the model has high sensitivity and specificity. To further verify the clinical benefit of the nomogram, DCA was carried out on OS. The result is shown in Figure 6. In the DCA curves, the nomogram for OS showed good clinical benefit.
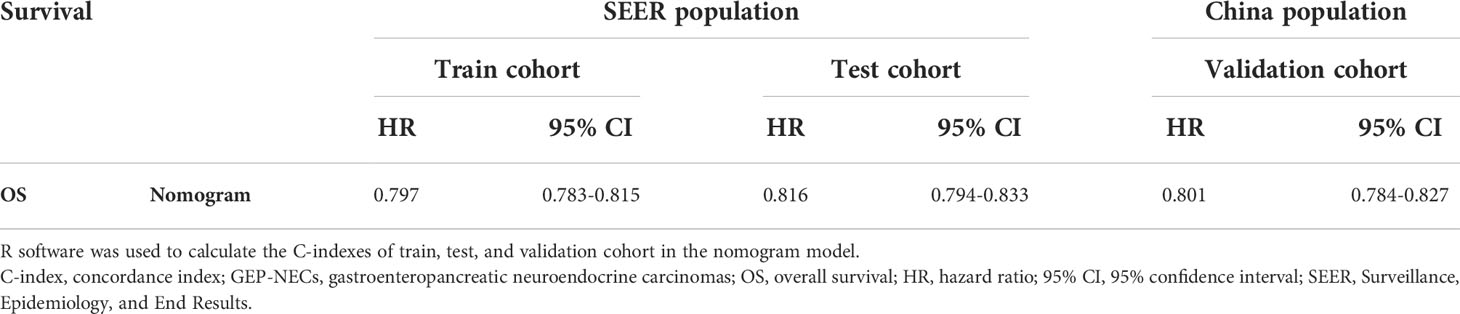
Table 3 C-indexes for the nomogram in patients with GEP-NECs.
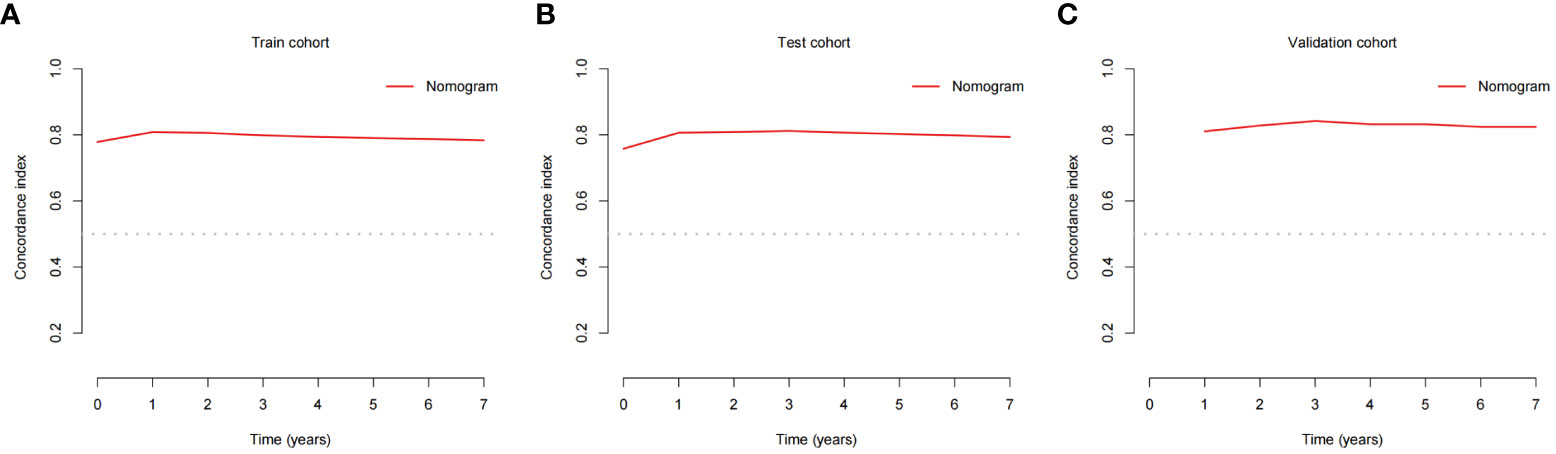
Figure 3 C-indexes for the nomogram in patients with GEP-NECs. (A) C-index for the nomogram in the train cohort. (B) C-index for the nomogram in the test cohort. (C) C-index for the nomogram in the validation cohort. C-index, concordance index; GEP-NECs, gastroenteropancreatic neuroendocrine carcinomas.
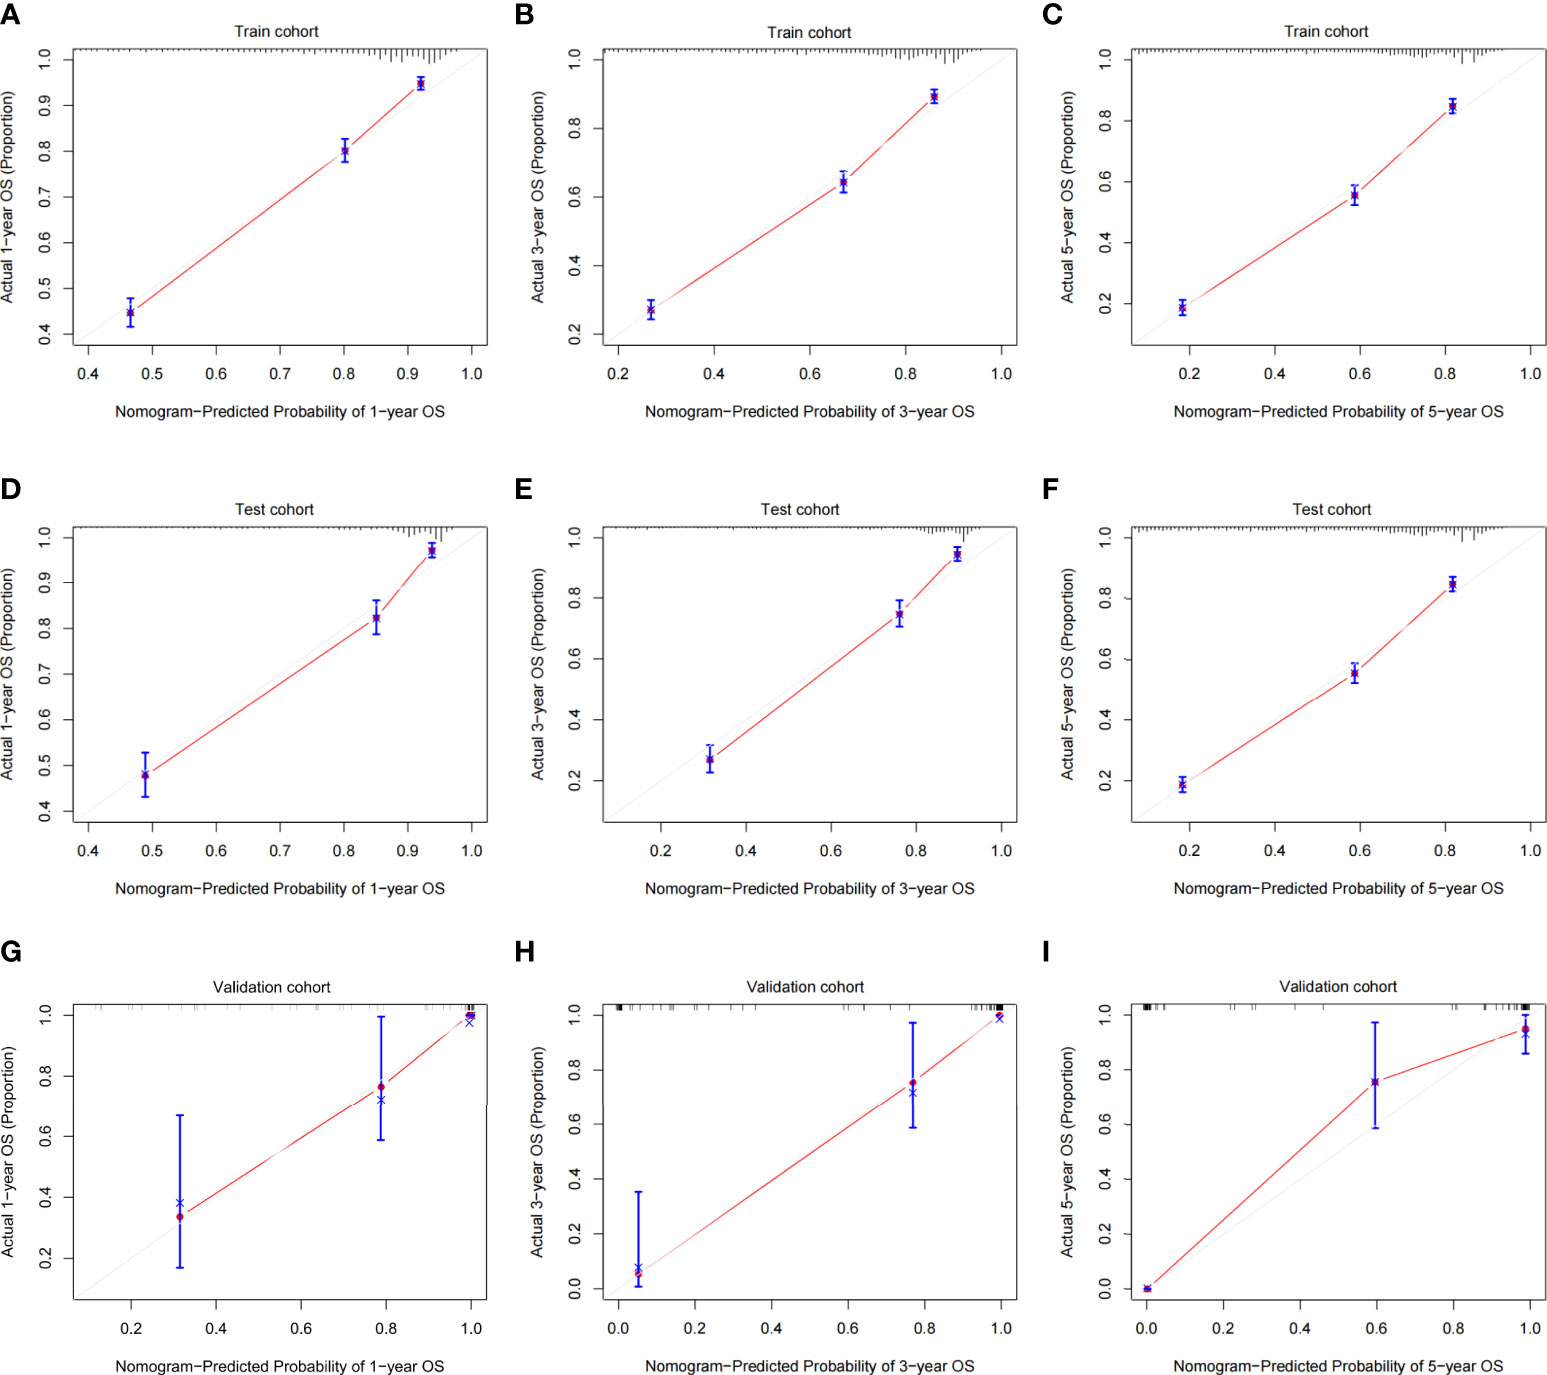
Figure 4 Calibration plots of the OS nomogram model. (A) 1-year calibration plot of OS using the train cohort. (B) 3-year calibration plot of OS using the train cohort. (C) 5-year calibration plot of OS using the train cohort. (D) 1-year calibration plot of OS using the test cohort. (E) 3-year calibration plot of OS using the test cohort. (F) 5-year calibration plot of OS using the test cohort. (G) 1-year calibration plot of OS using the validation cohort. (H) 3-year calibration plot of OS using the validation cohort. (I) 5-year calibration plot of OS using the validation cohort. OS, overall survival.
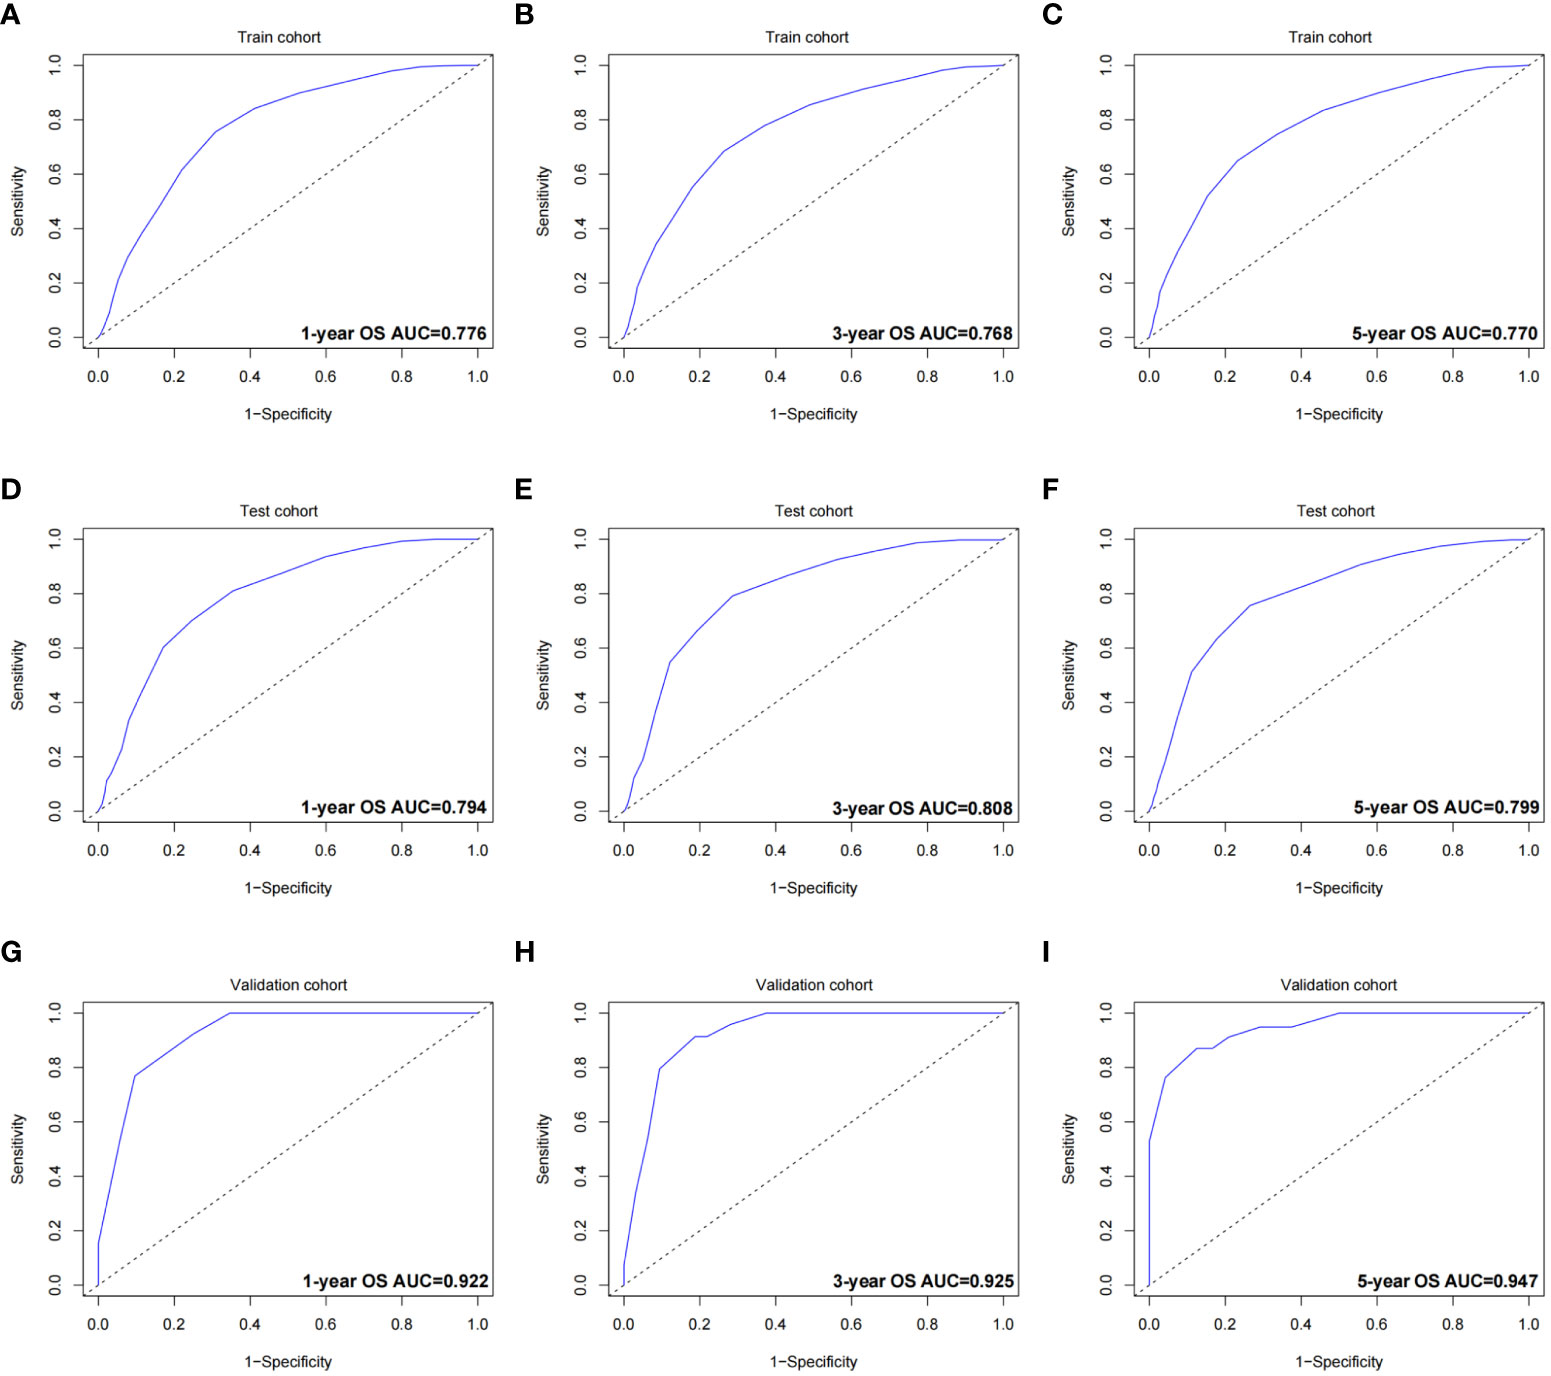
Figure 5 ROC curves of the OS nomogram. (A) 1-year ROC curve of the OS nomogram using train cohort. (B) 3-year ROC curve of the OS nomogram using train cohort. (C) 5-year ROC curve of the OS nomogram using train cohort. (D) 1-year ROC curve of the OS nomogram using the test cohort. (E) 3-year ROC curve of the OS nomogram using the test cohort. (F) 5-year ROC curve of the OS nomogram using the test cohort. (G) 1-year ROC curve of the OS nomogram using the validation cohort. (H) 3-year ROC curve of the OS nomogram using the validation cohort. (I) 5-year ROC curve of the OS nomogram using the validation cohort. ROC, receiver operating characteristic curve; OS, overall survival; AUC, area under the curve.
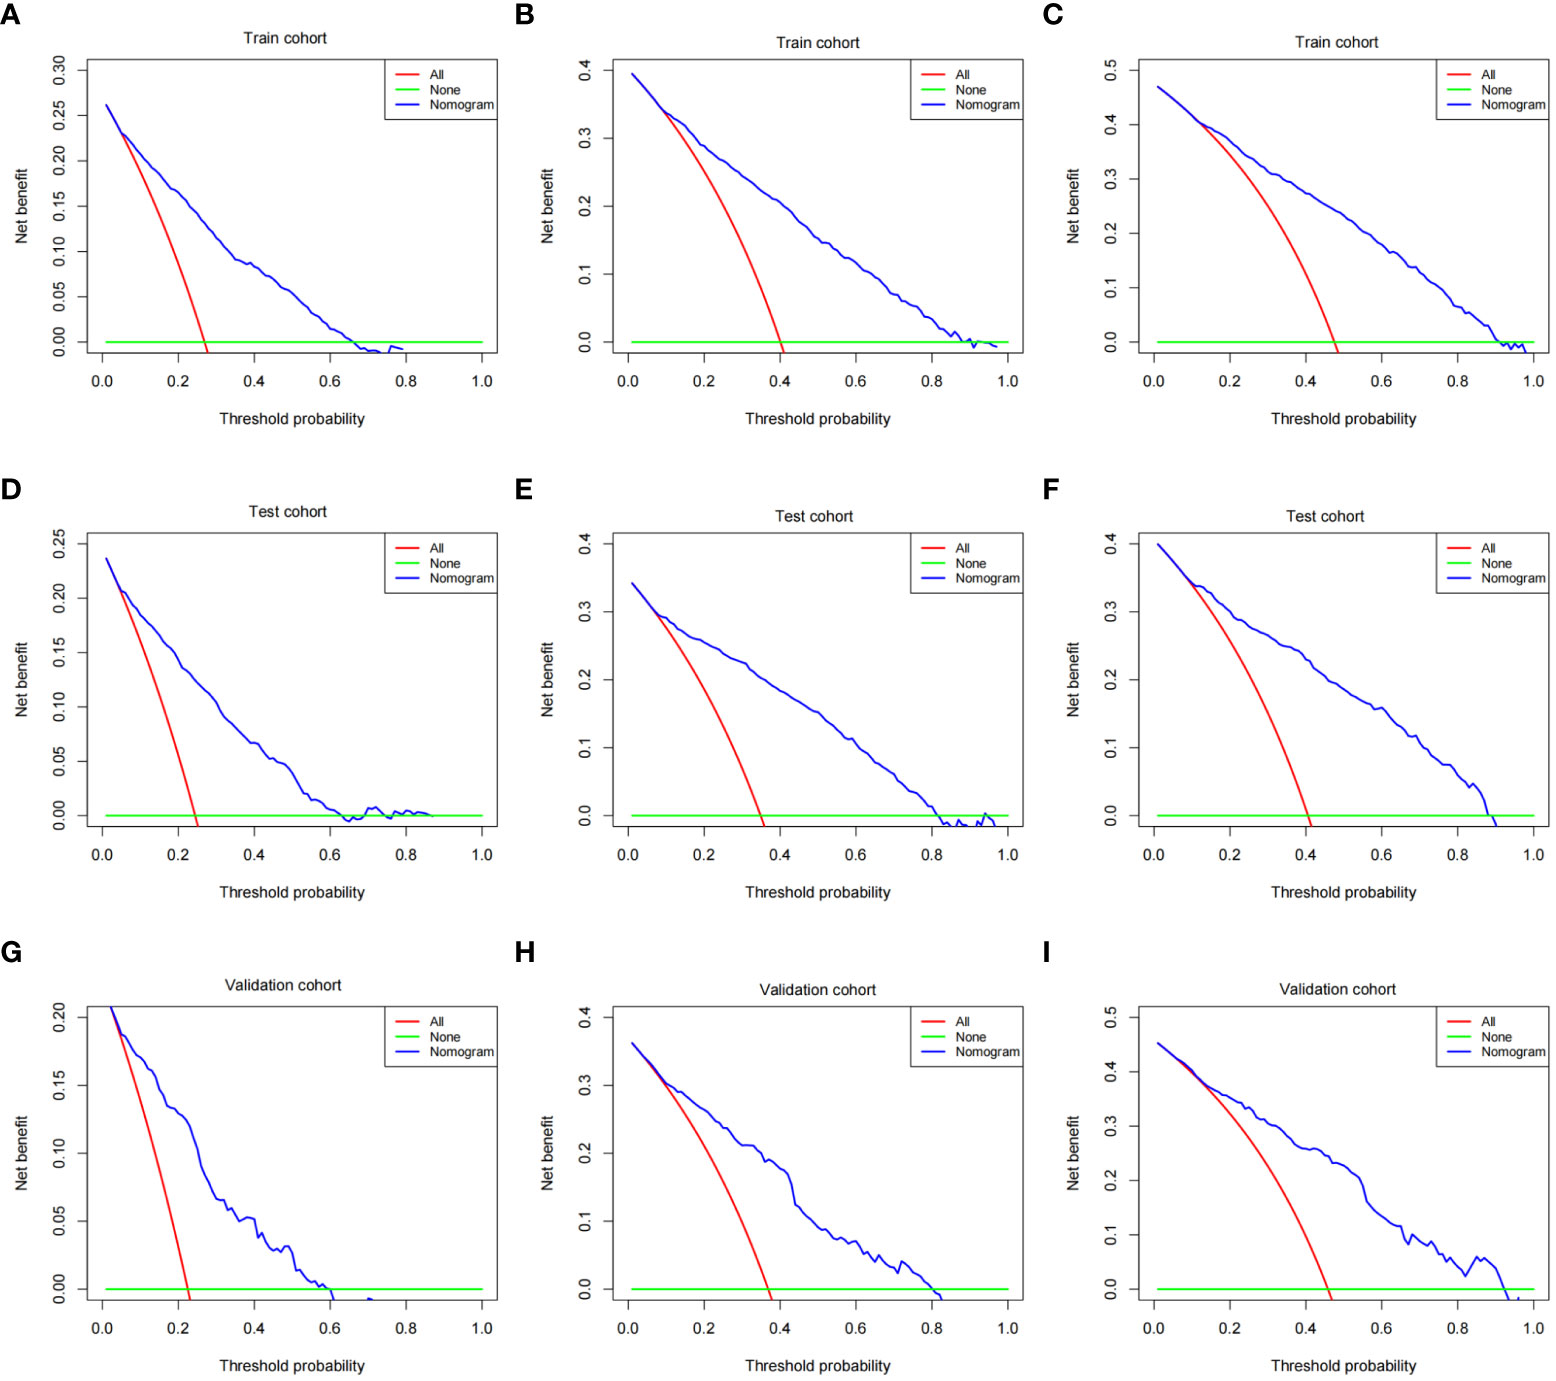
Figure 6 DCA of the OS nomogram. (A) 1-year DCA of the OS nomogram using train cohort. (B) 3-year DCA of the OS nomogram using train cohort. (C) 5-year DCA of the OS nomogram using train cohort. (D) 1-year DCA of the OS nomogram using the test cohort. (E) 3-year DCA of the OS nomogram using the test cohort. (F) 5-year DCA of the OS nomogram using the test cohort. (G) 1-year DCA of the OS nomogram using the validation cohort. (H) 3-year DCA of the OS nomogram using the validation cohort. (I) 5-year DCA of the OS nomogram using the validation cohort. DCA, decision curve analysis; OS, overall survival.
The same process was also performed in the validation cohort. The C-index was 0.801 (95% CI: 0.784-0.827) in the nomogram model (Table 3 and Figure 3). The calibration curve also shows that the prediction results of the OS nomogram model are of high quality (Figure 4). For the ROC curve and AUC, we obtained 1-, 3-, and 5-year AUCs of 0.922, 0.925, and 0.947, respectively (Figure 5). Furthermore, the DCA curves also show that the nomogram for OS has good clinical benefits. (Figure 6).
Discussion
According to the above description, we constructed a nomogram model based on age, race, sex, tumor site, tumor grade, and TNM stage, and the validation showed that the model fitting effect was good. Regardless of the train cohort, the test cohort, or the validation cohort, the C-index was greater than 0.7, and the slope of the calibration curve was close to 1. This indicates that the constructed nomogram model has a good prediction effect and is close to the actual situation. For the ROC curve, the AUCs were all greater than 0.7, showing higher accuracy and specificity of the model. Meanwhile, the DCA curves showed good clinical benefit in all three cohorts. The above verification process proves that the nomogram model constructed has a good fitting effect, and all the introduced variables can be used as prognostic factors for GEP-NECs, which is that male sex, older age, high tumor stage and grade are markers of poor tumor prognosis. The results are also similar to existing research (24), which also established a nomogram model for predicting the prognosis of rectal NECs and found that age, sex, TNM stage and grade of the tumor can be clinical prognostic factors.
At present, due to the rarity of GEP-NECs, few studies have focused on the prognosis of GEP-NECs alone and the construction of a prognosis prediction model, while papers have concentrated more on the construction of prediction models using larger datasets of GEP-NETs. The study by Zi-Han Xu et al. included GEP-NETs in the SEER database and constructed a nomogram model based on age, sex, race, marital status, tumor grade and stage, radiotherapy, chemotherapy, and surgery, obtaining the C-indexes for OS prediction in the nomogram as 0.893 (95% CI, 0.883–0.903) and 0.880 (95% CI, 0.866–0.894), respectively, in the train cohort and validation cohort, with the AUCs of the nomogram predicting the 3-year and 5-year OS rates as 0.908 and 0.893, respectively, which shows an effective function of prediction (25). The variables included and the predicted effects in this study are similar to our research results, which can also prove the validity of our research results and the feasibility of clinical application. Similar studies have been performed on patients with GEP-NETs with similar predictive effects (26, 27). These studies are based on a much larger cohort of patients with GEP-NETs, while our study focused on a subset of GEP-NENs with higher malignancy and shorter survival — GEP-NECs — which has more clinical guiding significance in the specific part of patients.
Currently, with the continuous expansion of genomic information, research using genomic information to construct a prognostic model is emerging. The study by Nobuyoshi Takizawa et al. proved the similarity between colorectal neuroendocrine carcinomas and adenocarcinoma by gene sequencing analysis (28). Shinichi yachida et al. confirmed the genetic similarity between large cell and small cell neuroendocrine carcinoma of the pancreas through immunohistochemical and exogenous targeted sequencing (29). Moritz jesinghaus et al. proved that colorectal mixed adenocarcinoma neuroendocrine carcinoma and neuroendocrine carcinoma are genetically closely related to colorectal adenocarcinoma through gene sequencing (30). Gene technology is also widely used not only in the research of neuroendocrine tumors but also in other disease fields (31–33). The advantage of prediction models related to genomic information is that they can more accurately combine certain diseases with a single gene to achieve the purpose of precise treatment. If a less expensive and time-consuming clinical prediction model (such as the nomogram model) could be used to narrow down the range of related genes, this may kill two birds with one stone.
Based on the above, it may be possible to integrate clinicopathological information and genomic information into model construction in the future. Through this model, we can correlate clinicopathological information and genetic information that affect the prognosis of diseases to achieve accurate control of diseases and treat diseases from the root.
To our knowledge, this study is one of the largest and most recent studies focusing on GEP-NECs, providing comprehensive epidemiological and survival data for GEP-NECs, constructing a complete nomogram model, and yielding good predictive results. However, there are some limitations to our study. For example, as Ki-67 and the mitotic index, which are absent in the SEER database, are very important for tumor grading (34), these factors are not taken into account in tumor classification. Moreover, our study is a retrospective study, and if it can be combined with a prospective study, the results will be more perfect. Large-scale multicenter studies will be necessary in the future to remedy these problems.
Conclusion
We established the OS nomogram model of GEP-NEC patients, including variables of age, race, sex, tumor site, tumor grade, and TNM stage. This model has good fitting, high sensitivity and specificity, and good clinical benefits.
Data availability statement
The original contributions presented in the study are included in the article/supplementary material. Further inquiries can be directed to the corresponding author.
Author contributions
JC, YL, and HS designed the study. JC and KX performed the research. YL and FR analyzed the data. JC and YL wrote the paper. BL and HS revised the manuscript for final submission. All authors contributed to the article and approved the submitted version.
Conflict of interest
The authors declare that the research was conducted in the absence of any commercial or financial relationships that could be construed as a potential conflict of interest.
Publisher’s note
All claims expressed in this article are solely those of the authors and do not necessarily represent those of their affiliated organizations, or those of the publisher, the editors and the reviewers. Any product that may be evaluated in this article, or claim that may be made by its manufacturer, is not guaranteed or endorsed by the publisher.
References
1. Ilett EE, Langer SW, Olsen IH, Federspiel B, Kjær A, Knigge U. Neuroendocrine carcinomas of the gastroenteropancreatic system: A comprehensive review. Diagn. (Basel Switzerland) (2015) 5:119–76. doi: 10.3390/diagnostics5020119
2. Ohmoto A, Fujiwara Y, Horita N, Nakano K, Takahashi S. Platinum-doublet chemotherapy for advanced gastroenteropancreatic neuroendocrine carcinoma: A systematic review and meta-analysis. Discover Oncol (2022) 13:40. doi: 10.1007/s12672-022-00499-w
3. Cho MY, Kim JM, Sohn JH, Kim MJ, Kim KM, Kim WH, et al. Current trends of the incidence and pathological diagnosis of gastroenteropancreatic neuroendocrine tumors (GEP-NETs) in Korea 2000-2009: Multicenter study. Cancer Res Treat (2012) 44:157–65. doi: 10.4143/crt.2012.44.3.157
4. Lepage C, Rachet B, Coleman MP. Survival from malignant digestive endocrine tumors in England and Wales: A population-based study. Gastroenterology (2007) 132:899–904. doi: 10.1053/j.gastro.2007.01.006
5. Korse CM, Taal BG, van Velthuysen ML, Visser O. Incidence and survival of neuroendocrine tumours in the Netherlands according to histological grade: Experience of two decades of cancer registry. Eur J Cancer (Oxford Engl 1990) (2013) 49:1975–83. doi: 10.1016/j.ejca.2012.12.022
6. Tran CG, Borbon LC, Mudd JL, Abusada E, AghaAmiri S, Ghosh SC, et al. Establishment of novel neuroendocrine carcinoma patient-derived xenograft models for receptor peptide-targeted therapy. Cancers (2022) 14:1910. doi: 10.3390/cancers14081910
7. Dasari A, Shen C, Halperin D, Zhao B, Zhou S, Xu Y, et al. Trends in the incidence, prevalence, and survival outcomes in patients with neuroendocrine tumors in the united states. JAMA Oncol (2017) 3:1335–42. doi: 10.1001/jamaoncol.2017.0589
8. Dasari A, Mehta K, Byers LA, Sorbye H, Yao JC. Comparative study of lung and extrapulmonary poorly differentiated neuroendocrine carcinomas: A SEER database analysis of 162,983 cases. Cancer (2018) 124:807–15. doi: 10.1002/cncr.31124
9. Thomas KEH, Voros BA, Boudreaux JP, Thiagarajan R, Woltering EA, Ramirez RA. Current treatment options in gastroenteropancreatic neuroendocrine carcinoma. Oncologist (2019) 24:1076–88. doi: 10.1634/theoncologist.2018-0604
10. Fazio N, Spada F, Giovannini M. Chemotherapy in gastroenteropancreatic (GEP) neuroendocrine carcinomas (NEC): a critical view. Cancer Treat Rev (2013) 39:270–4. doi: 10.1016/j.ctrv.2012.06.009
11. Sorbye H, Welin S, Langer SW, Vestermark LW, Holt N, Osterlund P, et al. Predictive and prognostic factors for treatment and survival in 305 patients with advanced gastrointestinal neuroendocrine carcinoma (WHO G3): the NORDIC NEC study. Ann Oncol Off J Eur Soc Med Oncol (2013) 24:152–60. doi: 10.1093/annonc/mds276
12. Yoon SE, Kim JH, Lee SJ, Lee J, Park SH, Park JO, et al. The impact of primary tumor site on outcomes of treatment with etoposide and cisplatin in grade 3 gastroenteropancreatic neuroendocrine carcinoma. J Cancer (2019) 10:3140–4. doi: 10.7150/jca.30355
13. Pape UF, Jann H, Müller-Nordhorn J, Bockelbrink A, Berndt U, Willich SN, et al. Prognostic relevance of a novel TNM classification system for upper gastroenteropancreatic neuroendocrine tumors. Cancer (2008) 113:256–65. doi: 10.1002/cncr.23549
14. Yu C, Zhang Y. Establishment of prognostic nomogram for elderly colorectal cancer patients: A SEER database analysis. BMC gastroenterol. (2020) 20:347. doi: 10.1186/s12876-020-01464-z
15. Hankey BF, Ries LA, Edwards BK. The surveillance, epidemiology, and end results program: A national resource. Cancer Epidemiol. Biomarkers Prev Publ Am Assoc Cancer Res Cosponsored by Am Soc Prev Oncol (1999) 8:1117–21.
16. Milione M. Prognostic factors for gastroenteropancreatic neuroendocrine neoplasms (GEP-NENs): What’s better? Endocrine (2018) 59:1–3. doi: 10.1007/s12020-017-1299-0
17. Andreasi V, Partelli S, Muffatti F, Manzoni MF, Capurso G, Falconi M. Update on gastroenteropancreatic neuroendocrine tumors. Digestive liver Dis Off J Ital Soc Gastroenterol Ital Assoc Study Liver (2021) 53:171–82. doi: 10.1016/j.dld.2020.08.031
18. Abdel-Rahman O, Fazio N. Sex-based differences in prognosis of patients with gastroenteropancreatic-neuroendocrine neoplasms: A population-based study. Pancreas (2021) 50:727–31. doi: 10.1097/MPA.0000000000001821
19. Sekerci A, Turk HM, Demir T, Seker M, Akcakaya A, Arici DS. Clinicopathological features of gastroenteropancreatic neuroendocrine neoplasms. J Coll Physicians Surgeons–Pakistan JCPSP (2020) 30:863–7. doi: 10.29271/jcpsp.2020.08.863
20. Huang PY, Tsai KL, Liang CM, Tai WC, Rau KM, Wu KL, et al. Prognostic factors of patients with gastroenteropancreatic neuroendocrine neoplasms. Kaohsiung J Med Sci (2018) 34:650–6. doi: 10.1016/j.kjms.2018.05.009
21. Poleé IN, Hermans BCM, van der Zwan JM, Bouwense SAW, Dercksen MW, Eskens F, et al. Long-term survival in patients with gastroenteropancreatic neuroendocrine neoplasms: A population-based study. Eur J Cancer (Oxford Engl 1990). (2022) 172:252–63. doi: 10.1016/j.ejca.2022.06.003
22. Pu N, Habib JR, Bejjani M, Yin H, Nagai M, Chen J, et al. The effect of primary site, functional status and treatment modality on survival in gastroenteropancreatic neuroendocrine neoplasms with synchronous liver metastasis: a US population-based study. Ann Trans Med (2021) 9:329. doi: 10.21037/atm-20-5348
23. Fang C, Wang W, Feng X, Sun J, Zhang Y, Zeng Y, et al. Nomogram individually predicts the overall survival of patients with gastroenteropancreatic neuroendocrine neoplasms. Br J Cancer. (2017) 117:1544–50. doi: 10.1038/bjc.2017.315
24. Lv Y, Pu N, Mao W, Chen W, Wang H, Han X, et al. Development of predictive prognostic nomogram for NECs of rectum on population-based exploration. Endocr Connect (2018) 7:1178–85. doi: 10.1530/EC-18-0353
25. Xu Z, Wang L, Dai S, Chen M, Li F, Sun J, et al. Epidemiologic trends of and factors associated with overall survival for patients with gastroenteropancreatic neuroendocrine tumors in the united states. JAMA Network Open (2021) 4:e2124750. doi: 10.1001/jamanetworkopen.2021.24750
26. Merath K, Bagante F, Beal EW, Lopez-Aguiar AG, Poultsides G, Makris E, et al. Nomogram predicting the risk of recurrence after curative-intent resection of primary non-metastatic gastrointestinal neuroendocrine tumors: An analysis of the U.S. neuroendocrine tumor study group. J Surg Oncol (2018) 117:868–78. doi: 10.1002/jso.24985
27. Lv Y, Han X, Xu XF, Ji Y, Zhou YH, Sun HC, et al. Risk factors affecting prognosis in metachronous liver metastases from WHO classification G1 and G2 gastroenteropancreatic neuroendocrine tumors after initial R0 surgical resection. BMC Cancer (2019) 19:335. doi: 10.1186/s12885-019-5457-z
28. Takizawa N, Ohishi Y, Hirahashi M, Takahashi S, Nakamura K, Tanaka M, et al. Molecular characteristics of colorectal neuroendocrine carcinoma; similarities with adenocarcinoma rather than neuroendocrine tumor. Hum Pathol (2015) 46:1890–900. doi: 10.1016/j.humpath.2015.08.006
29. Yachida S, Vakiani E, White CM, Zhong Y, Saunders T, Morgan R, et al. Small cell and large cell neuroendocrine carcinomas of the pancreas are genetically similar and distinct from well-differentiated pancreatic neuroendocrine tumors. Am J Surg Pathol (2012) 36:173–84. doi: 10.1097/PAS.0b013e3182417d36
30. Jesinghaus M, Konukiewitz B, Keller G, Kloor M, Steiger K, Reiche M, et al. Colorectal mixed adenoneuroendocrine carcinomas and neuroendocrine carcinomas are genetically closely related to colorectal adenocarcinomas. Modern Pathol an Off J United States Can Acad Pathol Inc (2017) 30:610–9. doi: 10.1038/modpathol.2016.220
31. Wu Z, Lu Z, Li L, Ma M, Long F, Wu R, et al. Identification and validation of ferroptosis-related LncRNA signatures as a novel prognostic model for colon cancer. Front Immunol (2021) 12:783362. doi: 10.3389/fimmu.2021.783362
32. Cui T, Guo J, Sun Z. A computational prognostic model of lncRNA signature for clear cell renal cell carcinoma with genome instability. Expert Rev Mol Diagn (2022) 22:213–22. doi: 10.1080/14737159.2021.1979960
33. Li XY, You JX, Zhang LY, Su LX, Yang XT. A novel model based on necroptosis-related genes for predicting prognosis of patients with prostate adenocarcinoma. Front Bioeng Biotechnol (2021) 9:814813. doi: 10.3389/fbioe.2021.814813
Keywords: gastroenteropancreatic neuroendocrine carcinomas, nomogram, overall survival, SEER database, clinicopathologic feature
Citation: Chen J, Liu Y, Xu K, Ren F, Li B and Sun H (2022) Establishment and validation of a clinicopathological prognosis model of gastroenteropancreatic neuroendocrine carcinomas. Front. Oncol. 12:999012. doi: 10.3389/fonc.2022.999012
Received: 20 July 2022; Accepted: 08 September 2022;
Published: 26 September 2022.
Edited by:
Qi Xue, National Cancer Center, ChinaReviewed by:
Marta Opalińska, University Hospital in Krakow, PolandQiuya Li, Beijing Jishuitan Hospital, China
Xuhui Yuan, Nanchang University, China
Copyright © 2022 Chen, Liu, Xu, Ren, Li and Sun. This is an open-access article distributed under the terms of the Creative Commons Attribution License (CC BY). The use, distribution or reproduction in other forums is permitted, provided the original author(s) and the copyright owner(s) are credited and that the original publication in this journal is cited, in accordance with accepted academic practice. No use, distribution or reproduction is permitted which does not comply with these terms.
*Correspondence: Hong Sun, eHN1bjFAaG90bWFpbC5jb20=
†These authors have contributed equally to this work