 Xiaoshan Hu1†
 Jian Zhang
94% of researchers rate our articles as excellent or good
Learn more about the work of our research integrity team to safeguard the quality of each article we publish.
Find out more
ORIGINAL RESEARCH article
Front. Oncol., 17 November 2022
Sec. Molecular and Cellular Oncology
Volume 12 - 2022 | https://doi.org/10.3389/fonc.2022.997702
This article is part of the Research TopicInduced Cell Senescence as a Therapeutic Strategy for Cancer TreatmentView all 8 articles
Background: Lung cancer is one of the top causes of cancer-related death worldwide. Cellular senescence is a characteristic of cell cycle arrest that plays a role in carcinogenesis and immune microenvironment modulation. Despite this, the clinical and immune cell infiltration features of senescence in lung squamous cell carcinoma (LUSC) are unknown.
Methods: The Cancer Genome Atlas (TCGA) and Gene Expression Omnibus (GEO) were used to get RNA-seq data and clinical information for LUSC. The least absolute shrinkage and selection operator (LASSO)-Cox regression, receiver operating characteristic (ROC), and Kaplan-Meier analysis were used to evaluate a risk model for predicting overall survival based on six differentially expressed genes. The tumor microenvironment (TME) and immunotherapy response were also studied.
Results: To discriminate LUSC into high- and low-risk subgroups, a risk model comprised of six cellular senescence-related genes (CDKN1A, CEBPB, MDH1, SIX1, SNAI1, and SOX5) was developed. The model could stratify patients into high-risk and low-risk groups, according to ROC and Kaplan-Meier analysis. In the TCGA-LUSC and GSE73403 cohorts, the high-risk group had a worse prognosis (P<0.05), and was associated with immune cell inactivation and being insensitive to immunotherapy in IMvigor210.
Conclusions: We discovered a new LUSC classification based on six cellular senescence-related genes, which will aid in identifying patients who will benefit from anti-PD-1 treatment. Targeting senescence-related genes appears to be another option for improving clinical therapy for LUSC.
Lung cancer ranks as one of the major causes of cancer-related mortalities globally, with an approximate 5-year survival rate of 16.6% (1, 2). Non-small-cell lung cancer (NSCLC) and small-cell lung cancer (SCLC) are the two most common types of lung cancer (3–5). One subtype of NSCLC is lung squamous cell carcinoma (LUSC), which accounts for about 40% of lung cancer cases (6–8). LUSC is associated with poor outcome and lacks accessible targeted therapies as compared to lung adenocarcinoma (9). As a result, finding possible biomarkers and elucidating their mechanisms in the development and progression of LUSC is critical.
Cellular senescence is a stress-induced process that results in irreversible cell cycle arrest. Recent studies have also identified that various processes, including oncogene activation (10–12), radiation (13, 14), chemotherapy (15, 16), and mitochondrial dysfunction (17, 18), were associated with the development and progression of cellular senescence. Apart from physiological roles for cellular senescence during tissue development, accumulating evidence have revealed that senescence was also related to pathological process, including atherosclerosis (19, 20), wound healing (21, 22), tumor progression (23, 24). However, despite several beneficial effects on the organism, cellular senescence has been reported to contribute to immune escape, drive therapeutic resistance and hamper therapeutic efficacy of cancer treatments (25–27). Thus, clarifying the senescence related biomarkers may be a promising way for the diagnosis and treatment of LUSC.
In this study, the Cancer Genome Atlas (TCGA) and Gene Expression Omnibus (GEO) databases were used to collect and evaluate RNA data and clinical information from LUSC. To create a risk model, six cellular senescence-related differentially expressed genes (DEGs) were discovered. The TCGA and GEO databases were used to divide patients into high- and low-risk groups. The high-risk group had a worse prognosis, was related with immune cell inactivation, and was less susceptible to immunotherapy, according to ROC and Kaplan-Meier analyses.
In this study, the TCGA database (https://portal.gdc.cancer.gov/repository) was used to retrieve the RNA-Seq dataset (n=551), mutation data (n=549), and clinical characteristics data (n=504) for LUSC. The GEO database (https://www.ncbi.nlm.nih.gov/geo/GSE73403) was used to download RNA-seq data and clinical information (n=69) for the external validation cohort.The clinical and prognostic information of immunotherapy cohort (n=348) was downloaded form IMvigor210 database (http://research-pub.gene.com/IMvigor210CoreBiologies/).
TCGA and GEO expression data were normalized to values of fragments per kilobase millions (FPKM), the sample’s tumor mutational load was computed as follows: the number of mutationsper million genes in each sample and the number of mutations in the sample where the gene is located were combined, a collection of senescence genes related to cell aging were downloaded from the website (https://genomics.senescence.info/cells). TCGA and GEO data were analyzed using R “limma” package, and the expression levels of overlapping genes were extracted. According to the differential expression level between normal and tumor samples of LUSC (Fold change = 1.5 and p < 0.05), 141 differentially expressed genes (DEGs) were identified.
To investigate the protein expression levels of the DEGs, as per the strategy described by our previous studies (28, 29), the expression of DEGs in lung cancer samples was further revealed based on the Human Protein Atlas database (https://www.proteinatlas.org/). All captured pictures were physically clarified by certified pathologists. To validate the expression of hub genes and immune microenvironment, the CDKN1A and SOX2 were further analyzed by anti-CDKN1A (CST, #2947) and anti-SOX2 (CST, #14962) in LUSC (n=4), immune cell infiltration by anti-PD-L1 (CST, #13684) and anti-FOXP3 (CST, #12653) between benign pulmonary nodule and LUSC.
The gene data and clinical data of TCGA were merged using the R “limma” “survival” packages, and the genes were cycled to screen out the genes related to clinical prognosis. P < 0.05 indicated that it was a prognostic gene. The expression levels of significant genes were extracted and analyzed by univariate analysis. The HR>1 was identified as a high-risk gene, otherwise it was considered as a low-risk gene, and a total of 21 prognosis-related genes were obtained. At last, 9 genes were obtained after the intersection with 141 DEGs.
To evaluate the prognostic value of cellular senescence-related genes, LASSO regression was used to construct the clinical model using R “glmnet” “survival” packages, the model formula is output and cross-validated, and six prognostic genes were retained. The risk score was listed as following: Risk Score=∑i6Xi ×Yi (X: coefficients, Y: gene expression level). According to the risk score, high and low risk groups were identified in TCGA as the experimental group and GEO as the verification group.
To compare the survival curves of low and high risk groups, Kaplan-Meier was used. A ROC curve for the 1/3/5 years survival rate was also evaluated. Univariate and multivariate Cox regression models were used to reveal the age, stage and gender variables in the TCGA cohort. Sub-group analysis was further used to explore the risk model.
Based on 59,428 genes and 495 samples in both the high and low risk groups, expression data and phenotypic data were collected. Using the GSEA software (http://www.gsea-msigdb.org/gsea/login.jsp), the top 100 enriched pathways in the genome were displayed. Normalized Enrichment Score > 0 was identified as high risk group, < 0 was identified as low risk group, and the low risk group was used as the control group. A total of 247 high-risk group pathway samples and 248 low-risk group pathway samples were extracted, and the top 5 standardized scores were reserved (5 in each of the high-low risk groups). R language “GGplot2” “Grid” “gridExtra” was used to evaluate the pathway activity. The chemokines, growth factors and regulators, proteases and regulators, soluble or shed receptors or ligands and interleukins were further annotated and classified.
Prognosis-related cellular senescence genes and tumor mutation burden (TMB) data were processed through “ggpubr”, “survival” and “survminer”, and the intersection of the two data was taken and merged to compare the correlation between high and low risk groups, the optimal cutoff of tumor mutation burden and the difference between groups were further obtained. The survival difference and the survival curve of TMB combined with risk score were further analyzed.
Immune cell infiltration files (http://timer.cistrome.org) and literature summaries of immune checkpoint-related genes were downloaded the TCGA (30, 31). The immune cell infiltration, the correlation analysis, immune checkpoint gene expression, the survival analysis were analyzed useing R-packages “scales”, “ggplot2”, “ggtext”, “tidyverse”, “ggpubr”.
To validate immunotherapy value of risk score, the expression data and survival status from the IMvigor210 cohort were screen out using the R language “survival” “caret” “glmnet” “survminer” packages. The risk score according to the formula of the model were calculated, the clinical benefit status and survival difference were obtained.
Two or more groups were compared by Wilcoxon, while differences among three or more groups were compared using Kruskal-Wallis tests and one-way analysis of variance (ANOVA). By LASSO Cox regression, receiver operating characteristic curve (ROC) analysis, and Kaplan-Meier analysis, the risk score model was constructed and evaluated. Statistical significance was determined by P<0.05 and all P values were two-sided. All data were processed using R 4.0.3 software (R Foundation for Statistical Computing, Vienna, Austria).
The NSCLC data from TCGA-LUSC (n = 551) and GSE13213 (n = 69) were analyzed and shown in Figure S1 and Table S1. As shown in Figures 1A, B, 141 DEGs between tumor (n=502) and adjacent normal tissues (n=49) and 21 prognostic genes in tumor samples were identified. Intersection analysis showed that CCN1, CDKN1A, CEBPB, MDH1, PDCD10, SIX1, SNAI1, SOX2 and SOX5 were the significant senescence-related genes (Figure 1C). Correlation analysis indicated that nine senescence-related genes showed a close association, such as CCN1 and SNAI1 (R=0.41), CEBPB and SOX2 (R=-0.37) (Figure 1D and Table S2).
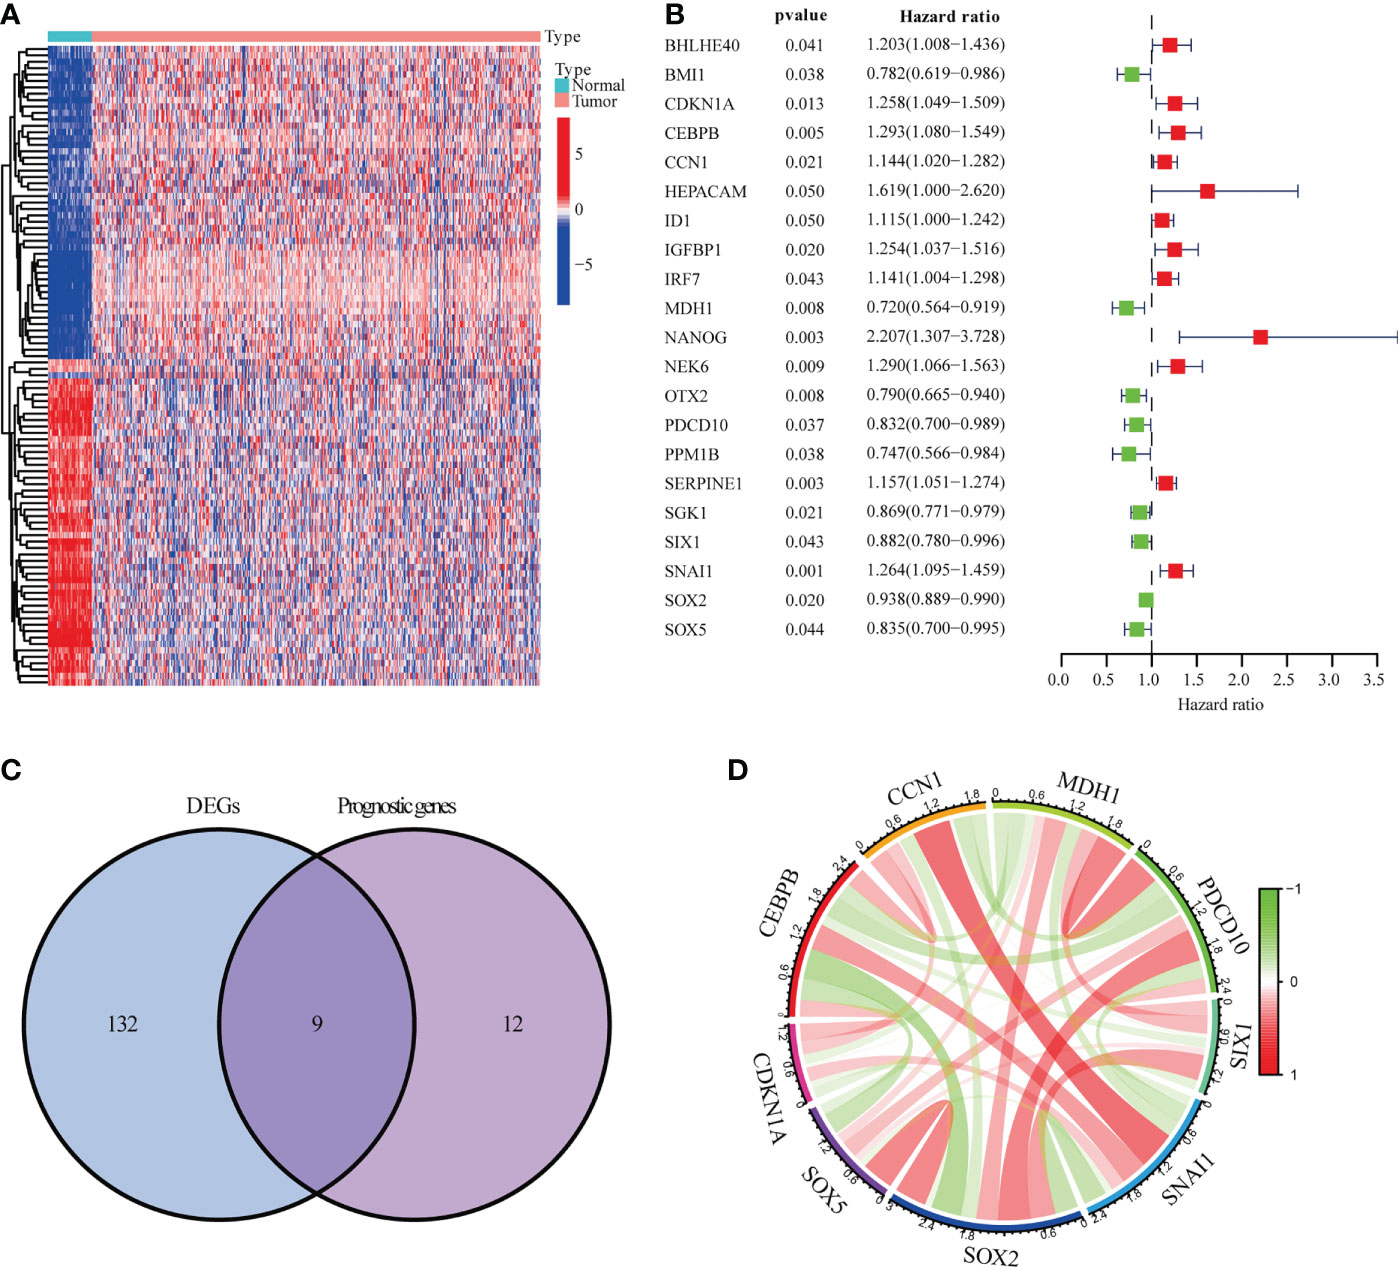
Figure 1 Genes linked to prognostic senescence. (A) The TCGA-LUSC heatmap of 141 DEGs. (B) The study of 21 hub genes using Univariate Cox regression. (C) A Venn diagram depicting DEGs linked to OS. (D) Correlation network of genes linked to cellular senescence.
To know the genetic alternation of the nine senescence-related genes, we firstly evaluated the copy number variations, as shown in Figure S2A, three copy number variations were identified in LUSC, CDKN1A, SOX5, SNAIL, CEBPB, MDH1, PACD10 and SOX2 were heterozygous amplification, while CCN1 and SIX1 were heterozygous deletion. Single nucleotide variation analysis showed the SNV frequency of the regulators was 100% among 38 LUSC samples. Variant type analysis showed that missense mutations were the main SNP type. SNV percentage analysis indicated that the mutation percentages of SOX5, SNAIL, PDCD10, SIX1, CDKN1A, SOX2 and MDH1 were 47%, 16%, 11%, 11%, 8%, 8% and 5%, respectively (Figure S2B). Methylation analysis indicated that SIX1, SNAIL, CCN1, CEBPB, MDH1, PDCD10 and SOX5 were significantly hypermethylated in LUSC and CDKN1A and SOX2 were significantly hypomethylated (Figure S3). These results indicated that the genetic alternation of senescence-related genes are mainly involve in regulating senescence in LUSC.
We further explored the protein expression of CCN1, CDKN1A, CPBEB, MDH1, PDCD10, SIX1, SNAI1, SOX2 and SOX5. However, as there was no pathological expression of SOX5 in the human protein altas (THPA). Consistent the results of Figure 1B, as shown in Figures 2A, B, SNAI1 (n=10; 100%), CCN1 (n=11; 81.8%), CEBPB (n=12; 86.7%), CDKN1A (n=12; 58.3%) were upregulated in lung cancer, while SOX2 (n=12; 41.7%), PDCD10 (n=11; 36.4%), SIX1 (n=12; 86.7%) and MDH1 (n=11; 18.2%) were downregulated in lung cancer. Further immunohistochemistry analysis found that CDKN1A (n=4; 75%) and SOX2 (n=4; 100%) were significantly up-regulated in LUSC (Figure 2C). Using the LASSO analysis, Several risk (CDKN1A, CEBPB, SNAI1) and protective (MDH1, SIX1, SOX5) mRNAs were identified in patients with LUSC. Thus, a prognostic risk score formula was developed as follows: risk score = (0.103*CDKN1A exp.)+(0.057*CEBPB exp.)+(0.118* SNAI1 exp.)+(-0.127* MDH1 exp.)+(-0.044*SIX1 exp.)+ (-0.072* SOX5 exp.) (Figures 2D, E).
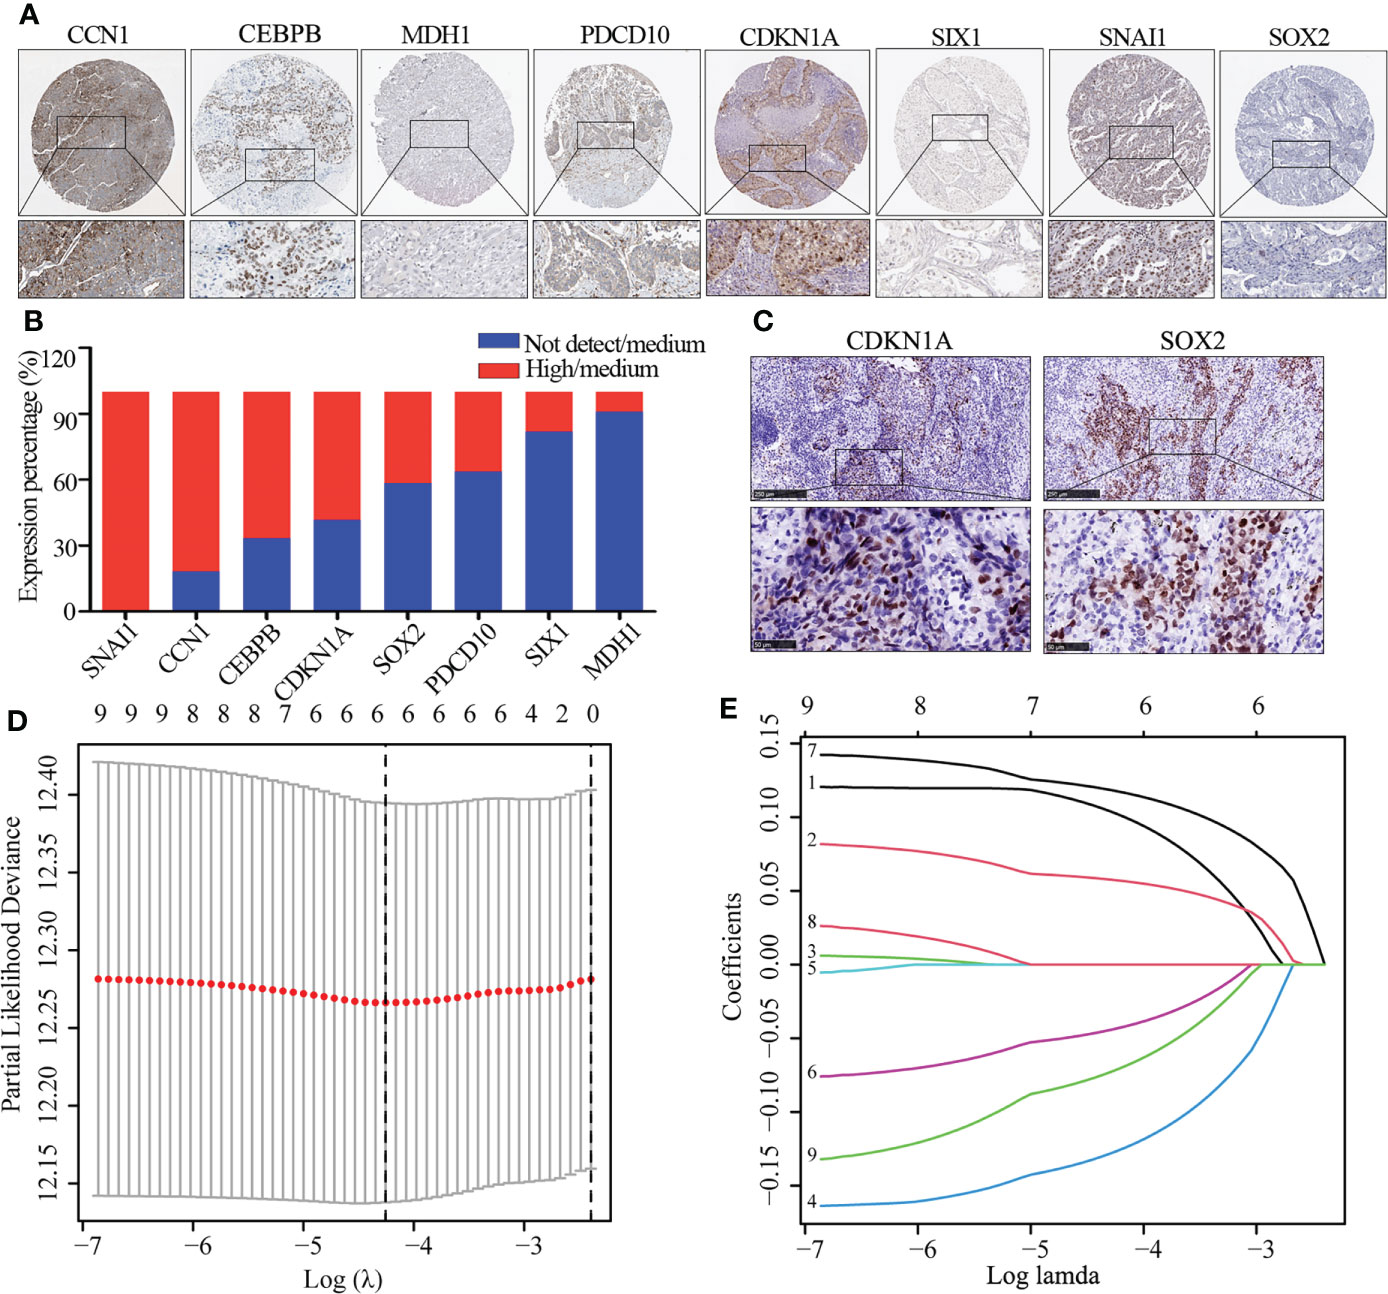
Figure 2 The expression of DEG and identification of hub gene. (A, B) Immunohistochemistry image of eight cellular senescence-related genes (A) and quantitative analysis (B), the high and medium expression means positive expression and low and not detect means negative expression. (C) Immunohistochemistry image of CDKN1A and SOX2. (D) Regression of the six OS-related genes using LASSO. (E) In the LASSO regression, cross-validation is used to fine-tune the parameter selection.
Risk scores were calculated for TCGA-LUSC using median scores as a cutoff value for classifying patients as high-risk (n = 247) or low-risk (n = 248). As shown in Figures 3A–C, the distribution of risk scores and the survival status of patients. Survival analysis showed that TCGA-LUSC in the low-risk group displayed better OS than those in the high-risk group (P < 0.001; Figure 3D). To determine the prognostic capacity of the formula, ROC analyses were performed, with areas under the ROC curve for 1-, 3-, and 5-year OS of 0.620, 0.65, and 0.630, respectively, implying that the risk score could be used as a biomarker of prognosis in LUSC (Figure 3E).
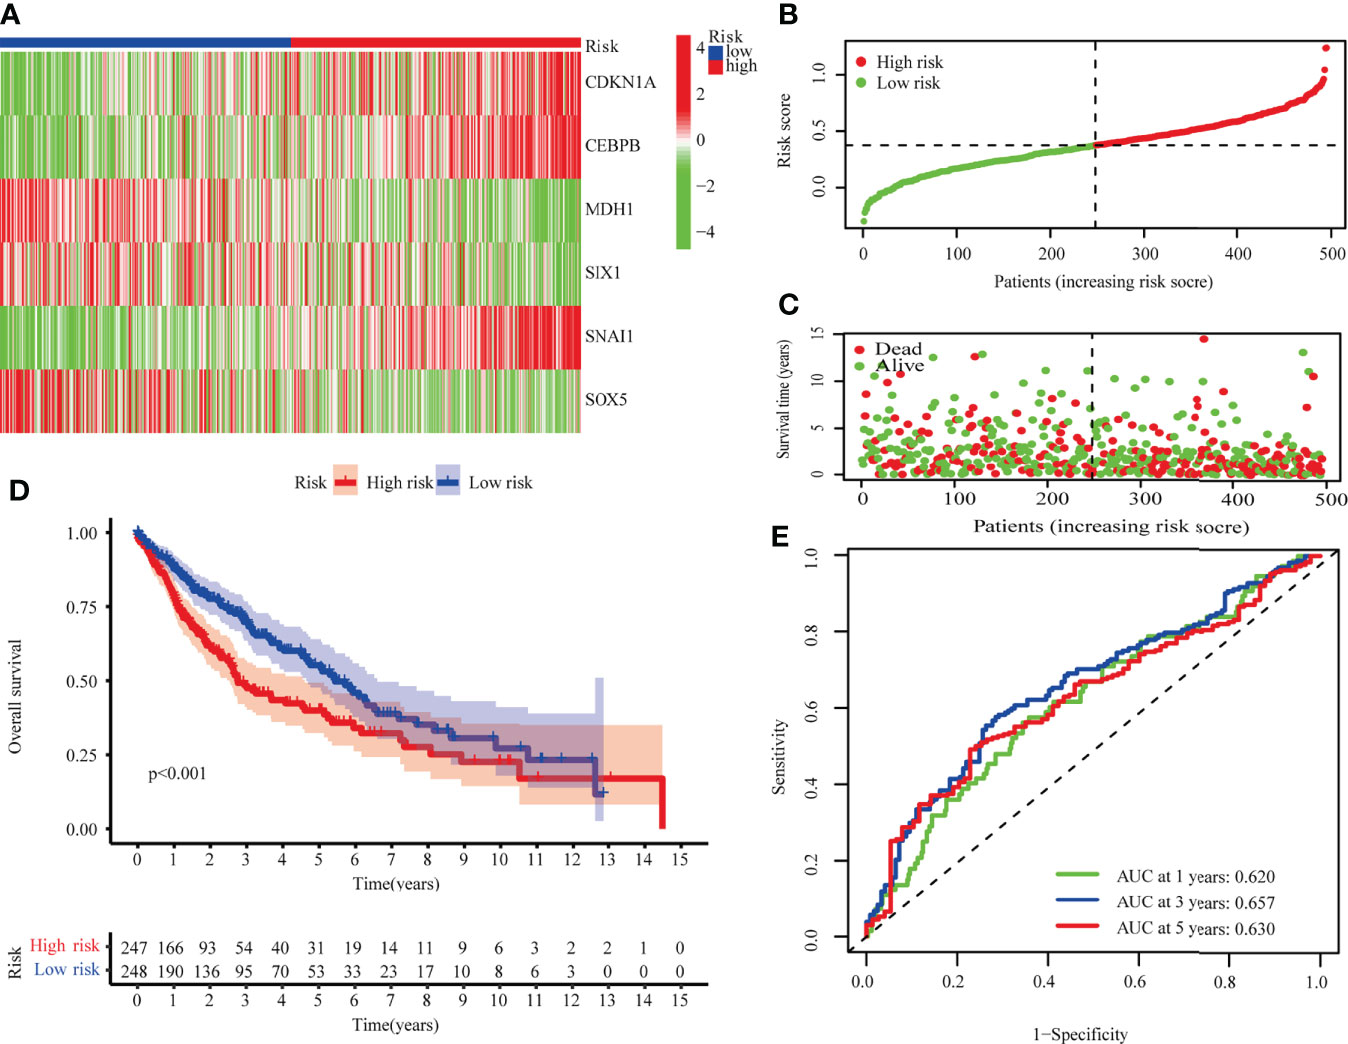
Figure 3 The TCGA-LUSC cohort was used to develop a risk model. (A) A heatmap of six hub genes involved in cellular senescence. (B) The TCGA cohort’s risk scores. (C) Survival status distribution. (D) Survival analysis of high and low risk groups. (E) The risk model’s AUC.
LUSC from GSE73403 were analyzed in order to validate the senescence-related risk model. Patients were classified into high (n=38) and low risk (n = 31) groups, whose distributions are shown in Figures 4A–C. A survival analysis revealed that GSE13213 patients in the low-risk group experienced a better overall survival than their high-risk counterparts (P < 0.001; Figure 4D). ROC analysis showed the areas under the ROC curve for 1-, 3-, and 5-year OS were 0.786, 0.780, and 0.675 (Figure 4E). These result suggested the risk score could be a prognostic biomarker in patients with LUSC.
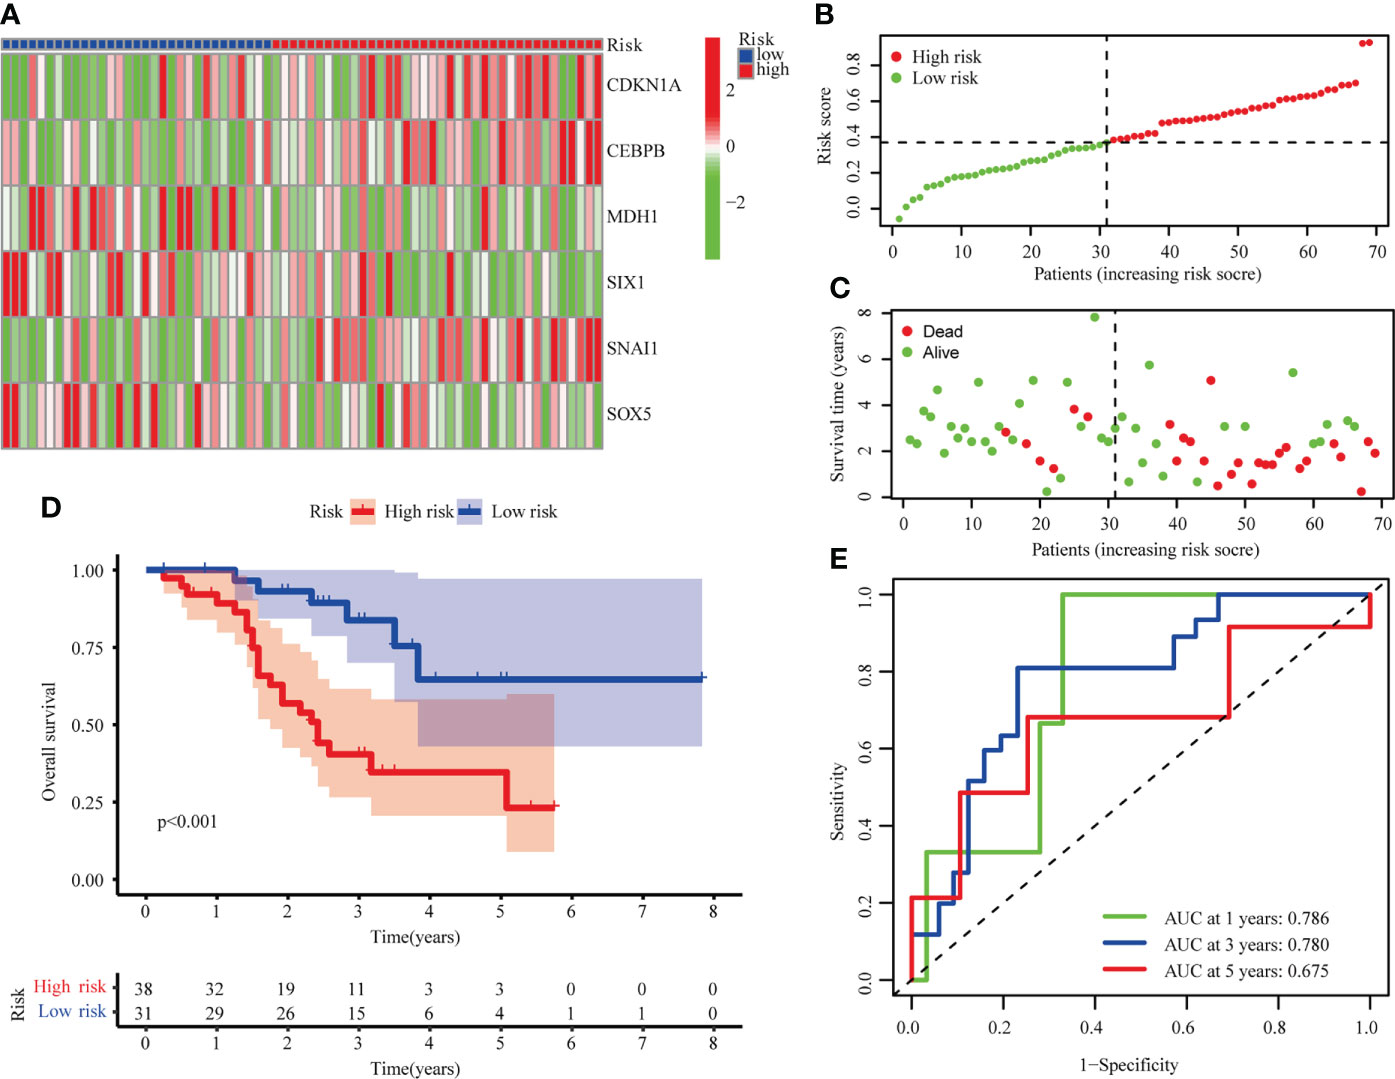
Figure 4 Validation of risk model in the GSE73403 cohort. (A) The heatmap of 6 hub cellular senescence-related genes. (B) The risk scores in GSE73403 cohort. (C) Distribution of survival status. (D) Survival analysis in the high risk and low risk groups. (E) AUC of the risk model.
Additionally, the risk score could be used independently to predict OS by using both univariate (HR: 3.175; 95% CI: 1.744–5.782; P < 0.001) and multivariate Cox regression (HR: 2.878; 95% CI: 1.569–5.278; P < 0.001) analysis (Figures 5A, B). To evaluate the clinical characteristics of the TCGA-LUSC cohort, the patients were stratified by clinical stage (I–II/III–IV), T stage (T1–2/T3–4), age (≤65/> 65). The senescence-related risk model was significantly divided into high- and low-risk subgroups based on multiple clinical characteristics, particularly I–II (P = 0.004; Figures 5C, D), T1–2 (P = 0.003; Figures 5E, F), > 65 (P < 0.001; Figures 5G, H). The results revealed that senescence-related risk models can be impacted by multiple clinical characteristics, leading to the heterogeneity of senescence in LUSC.
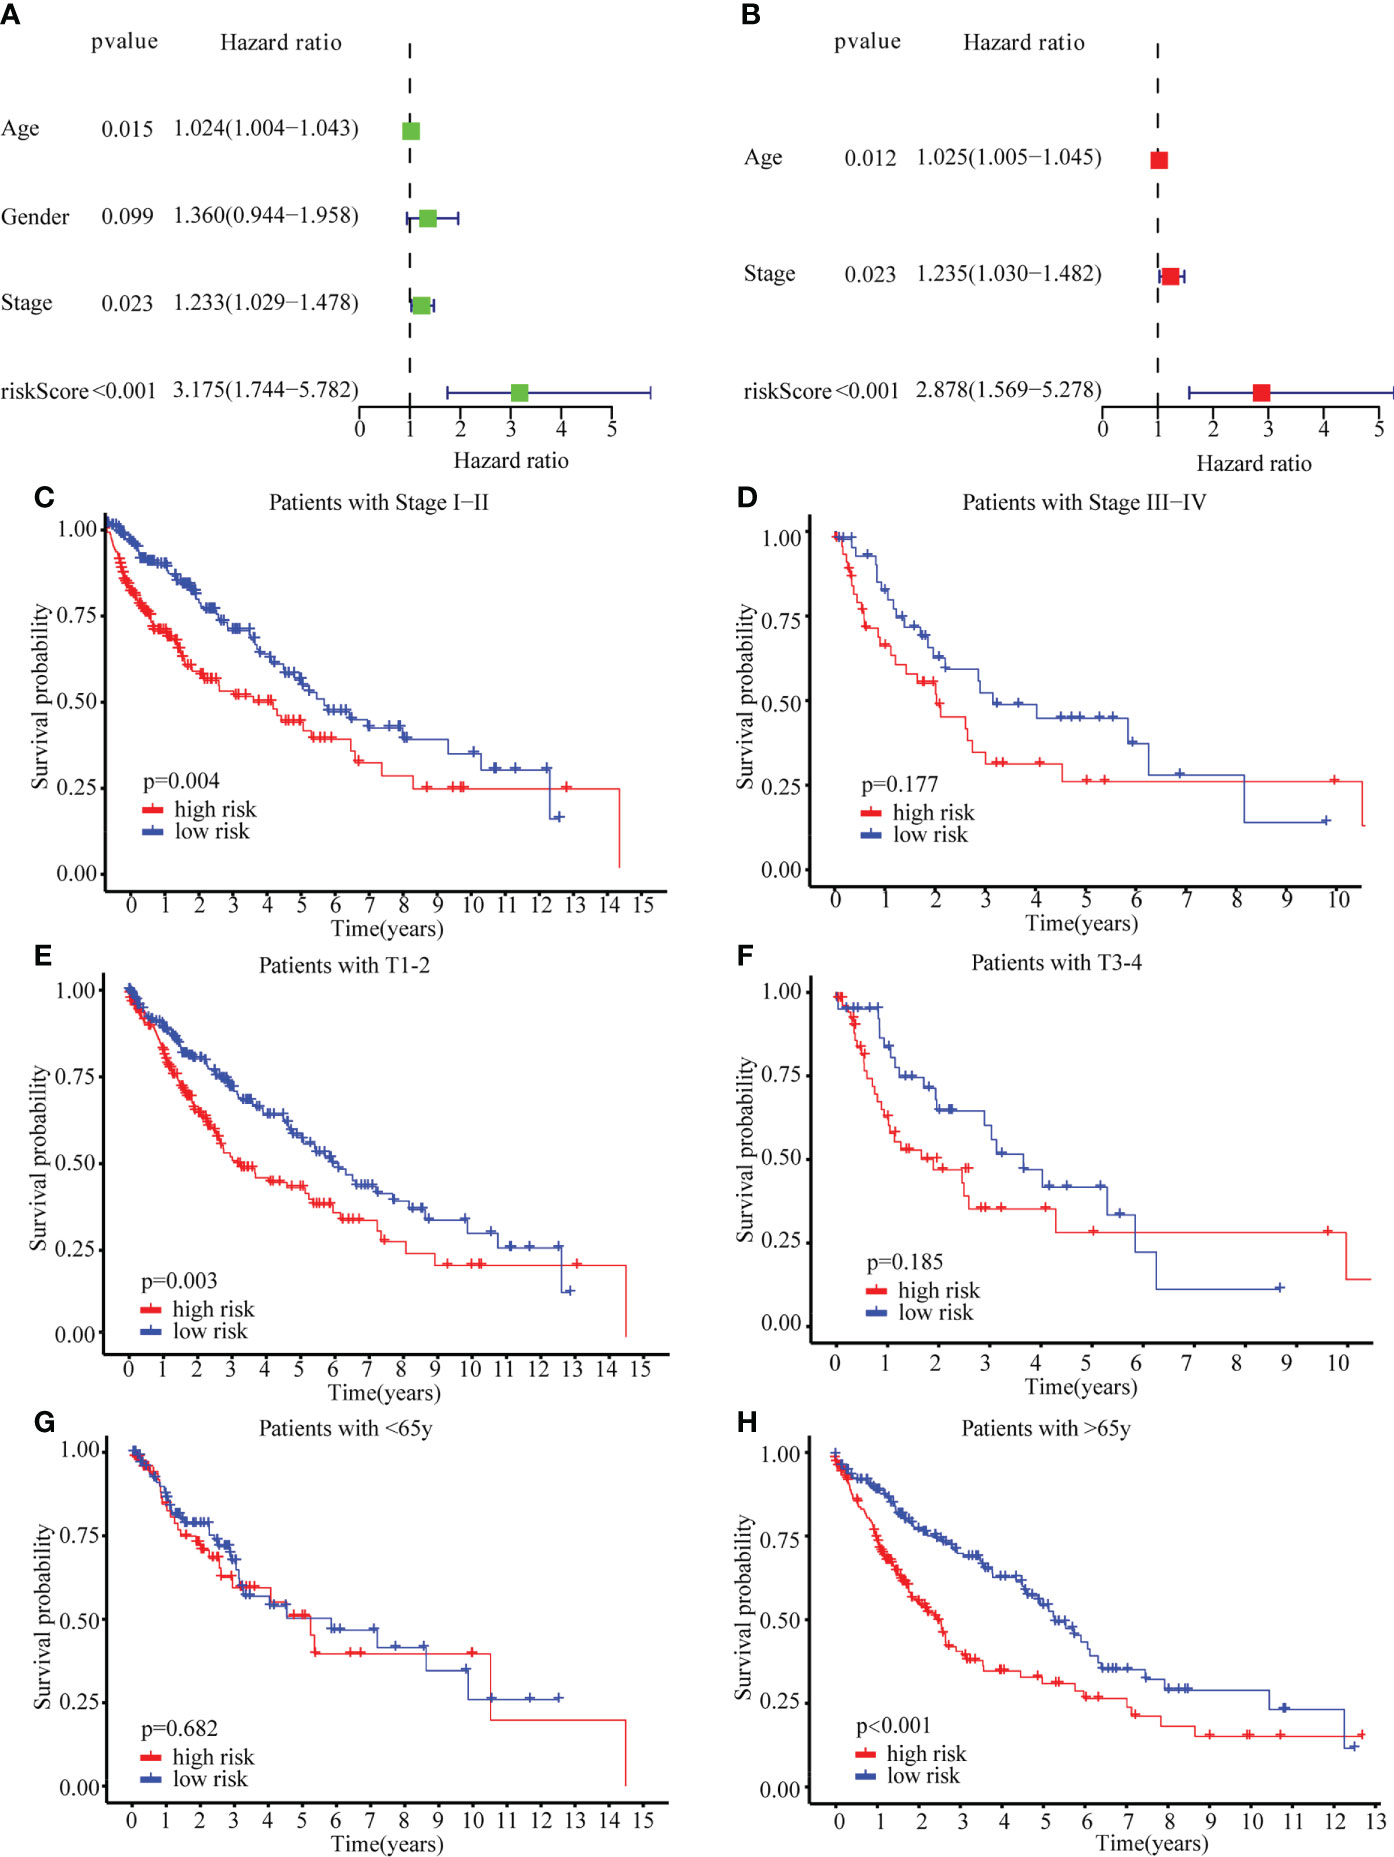
Figure 5 Univariate Cox regression, Multivariate Cox regression and stratified analysis. (A) Univariate Cox regression in TCGA cohort. (B) Multivariate Cox regression in TCGA cohort. (C–H) stratified analysis by clinical stage (I–II/III–IV) (C, D), T stage (T1–2/T3–4) (E, F), age (≤65/> 65) (G, H).
To identify the molecular function of hub senescence-related genes, GSEA enrichment analysis showed that cytokine-cytokine receptor interaction, complement and coagulation cascades, ECM-receptor interaction, viral myocarditis, leukocyte transendothelial migration were enriched in high risk groups (Figure 6A). Immune check-point expression analysis showed a significant correlation was observed among CD27, TIGT, TNFSF18, LAIR1, CD200, CTLA4, BTLA, TNFRSF8, NRP1, TNFRSF9, IDO2, CD70, CD244, PDCD1, TNFRSF4, ADORA2A, IDO1, ICOSLG, HAVCR2, CD28, TMIGD2, KIR3DL1, ICOS, TNFSF14, CD80, TNFSF4, CD40LG, TNFRSF14, LAG3, CD40, CD48 and PDCD1LG2 in high risk group (P<0.05; Figure 6B), while BTNL2, CD86, HHLA2 in low risk group (P<0.05; Figure 6B). These results indicated the senescence-related genes might involve in regulating tumor immune microenvironment.
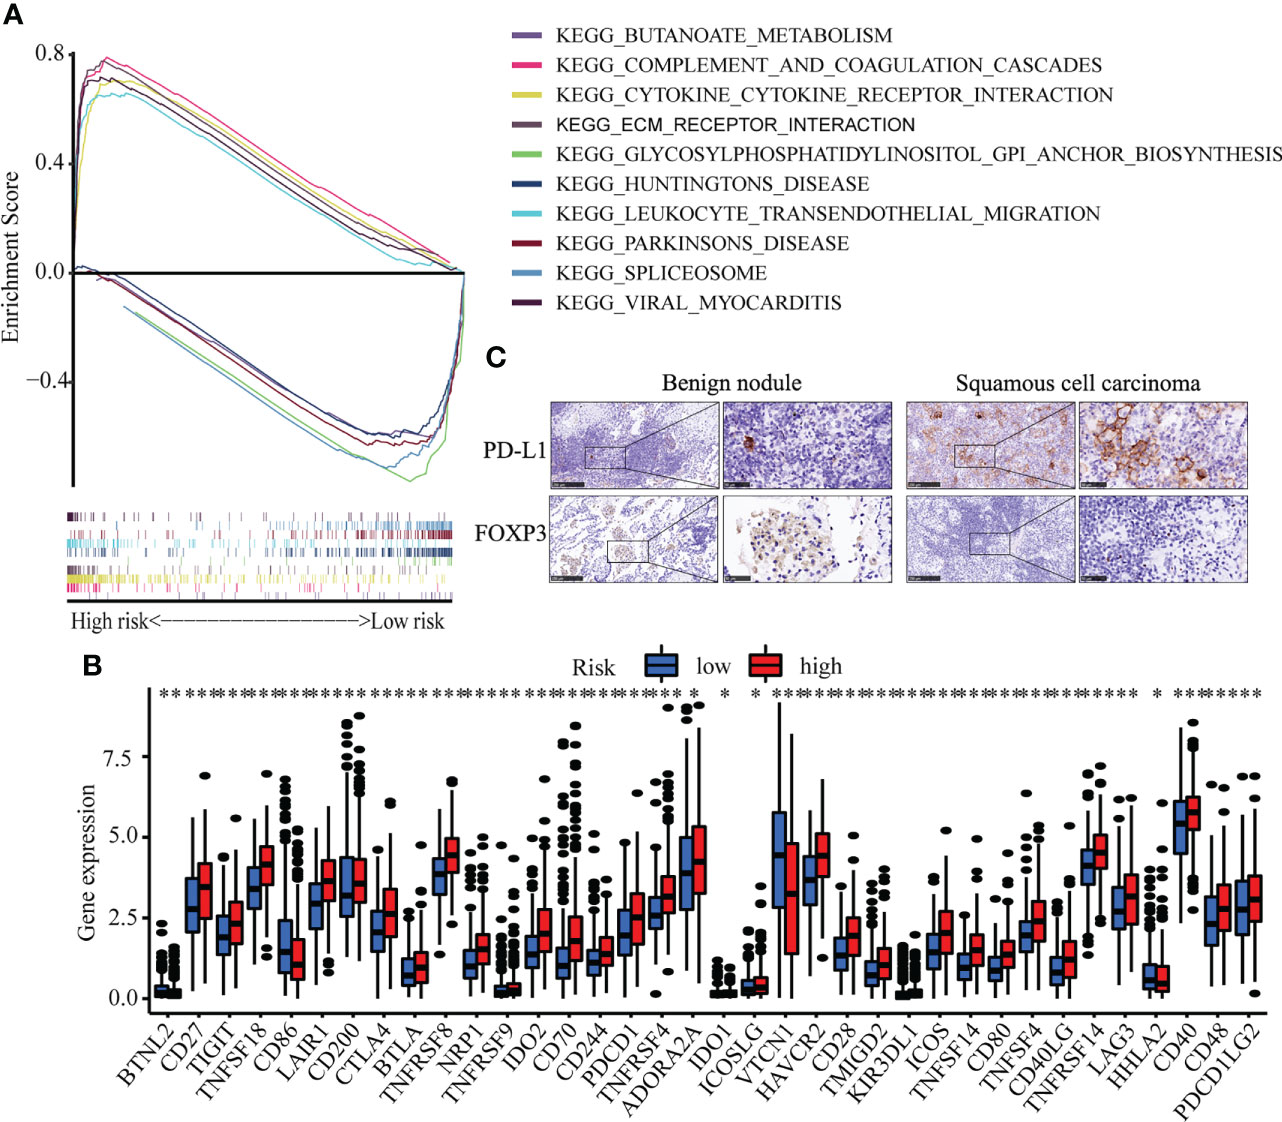
Figure 6 Immune cell infiltration in LUSC. (A) GSEA analysis between high risk and low risk groups. (B) The expression of immune check-point. (C) The Immunohistochemistry of CDKN1A and SOX2 between benign pulmonary nodule and LUSC. * means p<0.05; ** means p<0.01.
Correlation analysis between senescence-related genes and immune cell infiltration showed that senescence-related genes were associated with distinct immune cell infiltration by CIBERSORT, EPIC, MCPCOUNTER, QUANTISEQ, TIMER and XCELL analysis (Figures S4A–F). The cross-talk between risk scores and immune check-points regarding patient survival was studied. The TCGA-LUSC patients could be significantly stratified by both the risk score and the immune check-point using Kaplan–Meier analysis (P<0.05; Figure S5). To explore the immune cell infiltration in LUSC, we further validate the expression of PD-L1 and FOXP3 between benign nodule and LUSC and found that compared with benign nodule, PD-L1 was significantly up-regulated and FOXP3 was down-regulated in LUSC (Figure 6C). Despite widespread use of tumor mutation burden (TMB) as a biomarker for immunotherapy, the expression of TMB did not differ significantly between high risk and low risk groups. However, the low risk/high TMB group, however, had a better survival rate than the high risk/low TMB group (P<0.05; Figure 7A). To explore the value of risk model, immune therapy analysis revealed that low risk had better clinical outcome than the high risk group in IMvigor210 cohort (P=0.002; Figure 7B). Similarly, the low risk group with PD-L1 high expression had a better overall survival than high risk group (P<0.001; Figure 7C). The survival of low PD-L1 expression had no survival benefit (P=0.585; Figure 7D). Sub-group analysis also identified that the IMvigor210 patients could be significantly stratified by both the risk score and the immune check-point using Kaplan–Meier analysis (P<0.05; Figure S6). These results revealed that senescence-related genes involved in immune cell infiltration and associated with the response of immune therapy.
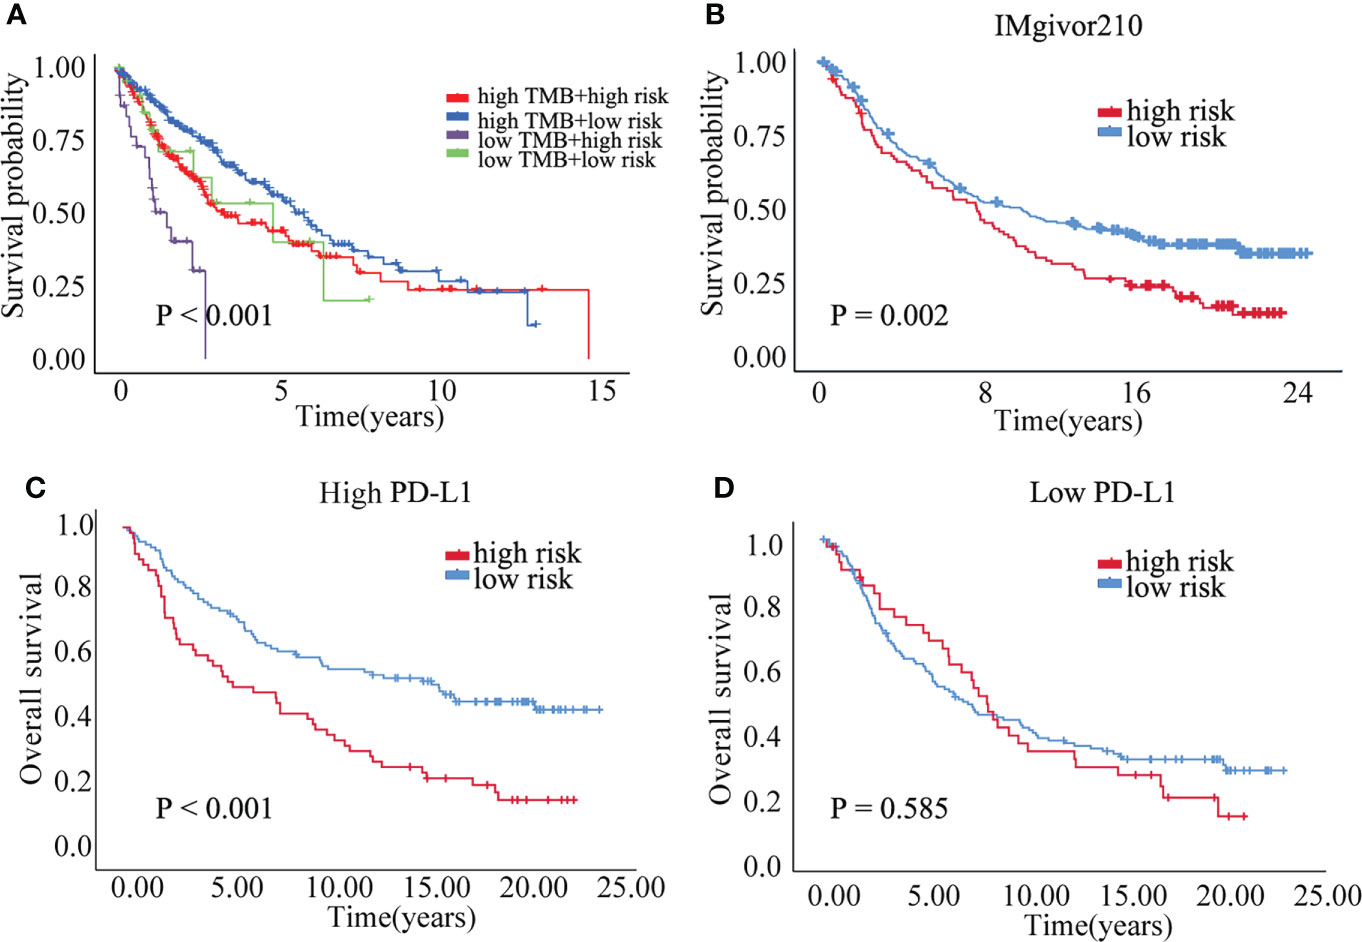
Figure 7 The prognostic of risk model. (A) The survival crosstalk between the risk score and TMB. (B) The prognosis between high and low risk group in IMvigor210 cohort. (C) The overall survival of high and low risk group in PD-L1 high expression group. (D) The overall survival of high and low risk group in PD-L1 low expression group.
Cellular senescence is a phenotype of cell cycle arrest that can be induced by different stresses (32–34). However, despite its involvement in diverse physiological processes, it has been proven that senescence inhibits tumor development in different types of cancer (35–37). In the tumor microenvironment, Senescence-associated secretory phenotypes (SASP), triggered by senescent tumor cells, cause immune cells to be recruited and activated, resulting in both antitumor and tumor-promoter actions (36–38). Herein we comprehensively performed clinical and immunological analysis of cellular senescence-related genes in LUSC. A novel risk model was developed to predict LUSC prognosis and respond to immunotherapy. The LUSC patients could be stratified by the cellular senescence-related risk model. The results of both multivariate and univariate Cox regressions revealed that the risk score may serve as a biomarker for overall survival and early diagnosis of LUSC with >65, T1-2 and stage I-II.
The risk model was composed of six senescence-related genes: CDKN1A, CEBPB, SNAI1, MDH1, SIX1 and SOX5. CDKN1A, encodes cyclin-dependent kinase inhibitor proteins p21Cip1/Waf1, which could activate cellular senescence (39–41). CEBPB could act as a critical determinant of cellular senescence to oncogenic Ras signaling (42). Snail, a zinc finger transcription protein, suppressed cellular senescence and promoted cancer invasion (43). Snail regulated cell survival and inhibits cellular senescence in human metastatic prostate cancer cell lines (44). Cytosolic malate dehydrogenase (MDH1) regulated senescence in human fibroblasts (45). SIX1, one member of homeobox transcriptional factors, repressed senescence by regulating cellular plasticity during tumorigenesis (46). SIX1 can also regulate cellular senescence by the regulation of p16INK4A and differentiation-related genes (47). SOX5, a member of the high-mobility group, inhibits dermal glioma formation in mice with ink4a deficiency by induction of acute cellular senescence (48).
In this study, senescence-related genes were found to control immune cell infiltration and immune treatment response in function enrichment and immunological check-point analyses. Because of its antitumorigenic and tumor-promoting properties in cancer, the SASP has been regarded as a double-edged sword. Senescence, according to recent research, can generate an immunosuppressive microenvironment that promotes cancer (49, 50). Senescent cell immunogenic switch could be identified by adaptive immune system, resulting in delayed tumor growth (11, 51, 52). In mice, macrophages recruited by CCL2 release and stimulated further by CD4+ T cells destroy NrasG12V-senescent premalignant hepatocytes. SASP factors produced by senescent cells aided in vascular remodelling, facilitating drug delivery and promoting the concentration of CD8+ T cells, the cytotoxicity of which may be improved by antibody-mediated PD-1 suppression. Furthermore, CDK4/6 inhibition-induced cellular senescence evoked antitumor immunity via regulatory T cell suppression and re-expression of endogenous retroviral elements, which provoked an interferon response (53). Our findings further indicated that tumor-specific cellular immunity was downregulated in high-risk individuals compared to low-risk patients and immunohistochemistry analysis found that FOXP3+ Treg was significantly downregulated in LUSC. Furthermore, the GSEA suggested that the immunological pathways in high-risk patients were dramatically altered. Meanwhile, the low risk group had a better survival benefit, especially with high expression of immune check-point and TMB. Thus, therapeutic interference with key factors regulating immune responses is a promising strategy to improve the clearance of premalignant senescent cells in high-risk LUSC and prevent tumour growth.
There were several drawbacks to this study as well. To begin, public data were acquired in order to create and validate a senescence-related risk model; however, prospective data from multicenter studies must be investigated further. Second, the immune cell infiltration mediated by senescence-related genes in TME need be further explored in vivo. Third, the risk model was constructed based on senescence-related genes, the diagnostic performance need be further improved combined with clinical index. Last, function and mechanism of senescence-related genes were theoretical, the concrete mechanism need to be further explored.
In conclusion, we systematically analyzed the clinical and immunological characteristics of cellular senescence-related genes in LUSC. We developed and validated a novel senescence-related risk model that can serve as a biomarker for prognosis and clinical immune therapy. Targeting senescence-related genes may be an alternative way to improve clinical therapy for LUSC.
The original contributions presented in the study are included in the article/Supplementary Material. Further inquiries can be directed to the corresponding authors.
XH, GL, JZ and JW conceptualized the study, created the figures, and wrote the text. Data was collected, analyzed, and the results were interpreted by LG, ZD, LW, and JZ. The study was designed by XH and JZ. All authors contributed to the article and approved the submitted version.
This study was supported by grants from the National Natural Science Foundation of China (82003212) and the Discipline Construction Project of Guangzhou Medical University during the 14th Five-Year Plan (06-410-2107181).
The authors declare that the research was conducted in the absence of any commercial or financial relationships that could be construed as a potential conflict of interest.
All claims expressed in this article are solely those of the authors and do not necessarily represent those of their affiliated organizations, or those of the publisher, the editors and the reviewers. Any product that may be evaluated in this article, or claim that may be made by its manufacturer, is not guaranteed or endorsed by the publisher.
The Supplementary Material for this article can be found online at: https://www.frontiersin.org/articles/10.3389/fonc.2022.997702/full#supplementary-material
Supplementary Figure 1 | The work flow of this study.
Supplementary Figure 2 | Correlation analysis between senescence-related genes and immune cell infiltration. (A–F) Correlation analysis by CIBERSORT (A), EPIC (B), MCPCOUNTER (C), QUANTISEQ (D), TIMER (E) and XCELL (F) analysis.
Supplementary Figure 3 | The copy number variations (A) and single nucleotide variation (B) of senescence-related genes.
Supplementary Figure 4 | The methylation status of senescence-related genes.
Supplementary Figure 5 | Survival analysis stratified by both the risk score and the immune check-point in the TCGA-LUSC cohort.
Supplementary Figure 6 | Survival analysis stratified by both the risk score and the immune check-point in the IMvigor210 cohort.
Supplementary Table 1 | The clinicopathological features of LUSC.
Supplementary Table 2 | Correlation among 9 cellular senescence-related genes.
1. Sung H, Ferlay J, Siegel RL, Laversanne M, Soerjomataram I, Jemal A. Bray f: Global cancer statistics 2020: GLOBOCAN estimates of incidence and mortality worldwide for 36 cancers in 185 countries. CA Cancer J Clin (2021) 71(3):209–49. doi: 10.3322/caac.21660
2. Planchard D, Besse B, Groen H, Hashemi S, Mazieres J, Kim TM, et al. Phase 2 study of dabrafenib plus trametinib in patients with BRAF V600E-mutant metastatic NSCLC: Updated 5-year survival rates and genomic analysis. J Thorac Oncol (2022) 17(1):103–15. doi: 10.1016/j.jtho.2021.08.011
3. Thai AA, Solomon BJ, Sequist LV, Gainor JF. Heist RS: Lung cancer. Lancet (2021) 398(10299):535–54. doi: 10.1016/S0140-6736(21)00312-3
4. Oser MG, Niederst MJ, Sequist LV. Engelman JA: Transformation from non-small-cell lung cancer to small-cell lung cancer: Molecular drivers and cells of origin. Lancet Oncol (2015) 16(4):e165–72. doi: 10.1016/S1470-2045(14)71180-5
5. Marcoux N, Gettinger SN, O'Kane G, Arbour KC, Neal JW, Husain H, et al. EGFR-mutant adenocarcinomas that transform to small-cell lung cancer and other neuroendocrine carcinomas: Clinical outcomes. J Clin Oncol (2019) 37(4):278–85. doi: 10.1200/JCO.18.01585
6. Conti L. Gatt s: Squamous-cell carcinoma of the lung. N Engl J Med (2018) 379(11):e17. doi: 10.1056/NEJMicm1802514
7. Travis WD, Dacic S, Sholl LM. Wistuba II: Pathologic assessment of lung squamous cell carcinoma after neoadjuvant immunotherapy. J Thorac Oncol (2021) 16(1):e9–e10. doi: 10.1016/j.jtho.2020.11.009
8. Koike Y, Aokage K, Ikeda K, Nakai T, Tane K, Miyoshi T, et al. Machine learning-based histological classification that predicts recurrence of peripheral lung squamous cell carcinoma. Lung Cancer (2020) 147:252–8. doi: 10.1016/j.lungcan.2020.07.011
9. Hirsch FR, Scagliotti GV, Mulshine JL, Kwon R, Curran WJ, Wu YL, et al. Lung cancer: Current therapies and new targeted treatments. Lancet (2017) 389(10066):299–311. doi: 10.1016/S0140-6736(16)30958-8
10. Di Micco R, Fumagalli M, Cicalese A, Piccinin S, Gasparini P, Luise C, et al. Oncogene-induced senescence is a DNA damage response triggered by DNA hyper-replication. Nature (2006) 444(7119):638–42. doi: 10.1038/nature05327
11. Courtois-Cox S, Jones SL, Cichowski K. Many roads lead to oncogene-induced senescence. Oncogene (2008) 27(20):2801–9. doi: 10.1038/sj.onc.1210950
12. Chandeck C, Mooi WJ. Oncogene-induced cellular senescence. Adv Anat Pathol (2010) 17(1):42–8. doi: 10.1097/PAP.0b013e3181c66f4e
13. Nguyen HQ, To NH, Zadigue P, Kerbrat S, de la Taille A, Le Gouvello S, et al. Ionizing radiation-induced cellular senescence promotes tissue fibrosis after radiotherapy. A Revi Crit Rev Oncol Hematol (2018) 129:13–26. doi: 10.1016/j.critrevonc.2018.06.012
14. Chambers CR, Ritchie S, Pereira BA, Timpson P. Overcoming the senescence-associated secretory phenotype (SASP): A complex mechanism of resistance in the treatment of cancer. Mol Oncol (2021) 15(12):3242–55. doi: 10.1002/1878-0261.13042
15. Wang L, Lankhorst L, Bernards R. Exploiting senescence for the treatment of cancer. Nat Rev Cancer (2022) 22(6):340–55. doi: 10.1038/s41568-022-00450-9
16. Dorr JR, Yu Y, Milanovic M, Beuster G, Zasada C, Dabritz JH, et al. Synthetic lethal metabolic targeting of cellular senescence in cancer therapy. Nature (2013) 501(7467):421–5. doi: 10.1038/nature12437
17. Wiley CD, Flynn JM, Morrissey C, Lebofsky R, Shuga J, Dong X, et al. Analysis of individual cells identifies cell-to-cell variability following induction of cellular senescence. Aging Cell (2017) 16(5):1043–50. doi: 10.1111/acel.12632
18. Biran A, Zada L, Abou KP, Vadai E, Roitman L, Ovadya Y, et al. Quantitative identification of senescent cells in aging and disease. Aging Cell (2017) 16(4):661–71. doi: 10.1111/acel.12592
19. Harismendy O, Notani D, Song X, Rahim NG, Tanasa B, Heintzman N, et al. 9p21 DNA variants associated with coronary artery disease impair interferon-gamma signalling response. Nature (2011) 470(7333):264–8. doi: 10.1038/nature09753
20. Holdt LM, Teupser D. Recent studies of the human chromosome 9p21 locus, which is associated with atherosclerosis in human populations. Arterioscler Thromb Vasc Biol (2012) 32(2):196–206. doi: 10.1161/ATVBAHA.111.232678
21. Demaria M, Ohtani N, Youssef SA, Rodier F, Toussaint W, Mitchell JR, et al. An essential role for senescent cells in optimal wound healing through secretion of PDGF-AA. Dev Cell (2014) 31(6):722–33. doi: 10.1016/j.devcel.2014.11.012
22. Jun JI, Lau LF. The matricellular protein CCN1 induces fibroblast senescence and restricts fibrosis in cutaneous wound healing. Nat Cell Biol (2010) 12(7):676–85. doi: 10.1038/ncb2070
23. Childs BG, Durik M, Baker DJ, van Deursen JM. Cellular senescence in aging and age-related disease: From mechanisms to therapy. Nat Med (2015) 21(12):1424–35. doi: 10.1038/nm.4000
24. Barry JD, Hall JP, Plenderleith L. Genome hyperevolution and the success of a parasite. Ann NY Acad Sci (2012) 1267:11–7. doi: 10.1111/j.1749-6632.2012.06654.x
25. Munoz-Espin D, Serrano M. Cellular senescence: From physiology to pathology. Nat Rev Mol Cell Biol (2014) 15(7):482–96. doi: 10.1038/nrm3823
26. Simpson RJ, Lowder TW, Spielmann G, Bigley AB, LaVoy EC, Kunz H. Exercise and the aging immune system. Ageing Res Rev (2012) 11(3):404–20. doi: 10.1016/j.arr.2012.03.003
27. Mongiardi MP, Pellegrini M, Pallini R, Levi A, Falchetti ML. Cancer response to therapy-induced senescence: A matter of dose and timing. Cancers (Basel) (2021) 13(3):484. doi: 10.3390/cancers13030484
28. Zhang J, Zheng Z, Zheng J, Xie T, Tian Y, Li R, et al. Epigenetic-mediated downregulation of zinc finger protein 671 (ZNF671) predicts poor prognosis in multiple solid tumors. Front Oncol (2019) 9:342. doi: 10.3389/fonc.2019.00342
29. Zhang J, Lin H, Jiang H, Jiang H, Xie T, Wang B, et al. A key genomic signature associated with lymphovascular invasion in head and neck squamous cell carcinoma. BMC Cancer (2020) 20(1):266. doi: 10.1186/s12885-020-06728-1
30. Charoentong P, Finotello F, Angelova M, Mayer C, Efremova M, Rieder D, et al. Pan-cancer immunogenomic analyses reveal genotype-immunophenotype relationships and predictors of response to checkpoint blockade. Cell Rep (2017) 18(1):248–62. doi: 10.1016/j.celrep.2016.12.019
31. Goodman A, Patel SP, Kurzrock R. PD-1-PD-L1 immune-checkpoint blockade in b-cell lymphomas. Nat Rev Clin Oncol (2017) 14(4):203–20. doi: 10.1038/nrclinonc.2016.168
32. Blasco MA, Lee HW, Hande MP, Samper E, Lansdorp PM, DePinho RA, et al. Telomere shortening and tumor formation by mouse cells lacking telomerase RNA. Cell (1997) 91(1):25–34. doi: 10.1016/S0092-8674(01)80006-4
33. Di Micco R, Fumagalli M, D'Adda DFF. Breaking news: high-speed race ends in arrest–how oncogenes induce senescence. Trends Cell Biol (2007) 17(11):529–36. doi: 10.1016/j.tcb.2007.07.012
34. Bartkova J, Rezaei N, Liontos M, Karakaidos P, Kletsas D, Issaeva N, et al. Oncogene-induced senescence is part of the tumorigenesis barrier imposed by DNA damage checkpoints. Nature (2006) 444(7119):633–7. doi: 10.1038/nature05268
35. Martien S, Abbadie C. Acquisition of oxidative DNA damage during senescence: The first step toward carcinogenesis? Ann N Y Acad Sci (2007) 1119:51–63. doi: 10.1196/annals.1404.010
36. Braig M, Schmitt CA. Oncogene-induced senescence: Putting the brakes on tumor development. Cancer Res (2006) 66(6):2881–4. doi: 10.1158/0008-5472.CAN-05-4006
37. Toso A, Di Mitri D, Alimonti A. Enhancing chemotherapy efficacy by reprogramming the senescence-associated secretory phenotype of prostate tumors: A way to reactivate the antitumor immunity. Oncoimmunology (2015) 4(3):e994380. doi: 10.4161/2162402X.2014.994380
38. Salazar G, Cullen A, Huang J, Zhao Y, Serino A, Hilenski L, et al. SQSTM1/p62 and PPARGC1A/PGC-1alpha at the interface of autophagy and vascular senescence. Autophagy (2020) 16(6):1092–110. doi: 10.1080/15548627.2019.1659612
39. Lopez-Dominguez JA, Rodriguez-Lopez S, Ahumada-Castro U, Desprez PY, Konovalenko M, Laberge RM, et al. Cdkn1a transcript variant 2 is a marker of aging and cellular senescence. Aging (Albany NY) (2021) 13(10):13380–92. doi: 10.18632/aging.203110
40. Campisi J, D'Adda DFF. Cellular senescence: when bad things happen to good cells. Nat Rev Mol Cell Biol (2007) 8(9):729–40. doi: 10.1038/nrm2233
41. Salotti J, Sakchaisri K, Tourtellotte WG, Johnson PF. An arf-Egr-C/EBPbeta pathway linked to ras-induced senescence and cancer. Mol Cell Biol (2015) 35(5):866–83. doi: 10.1128/MCB.01489-14
42. Furuya S, Endo K, Takahashi A, Miyazawa K, Saitoh M. Snail suppresses cellular senescence and promotes fibroblast-led cancer cell invasion. FEBS Open Bio (2017) 7(10):1586–97. doi: 10.1002/2211-5463.12300
43. Emadi BM, Soheili ZS, Schmitz I, Sameie S, Schulz WA. Snail regulates cell survival and inhibits cellular senescence in human metastatic prostate cancer cell lines. Cell Biol Toxicol (2010) 26(6):553–67. doi: 10.1007/s10565-010-9163-5
44. Lee SM, Dho SH, Ju SK, Maeng JS, Kim JY, Kwon KS. Cytosolic malate dehydrogenase regulates senescence in human fibroblasts. Biogerontology (2012) 13(5):525–36. doi: 10.1007/s10522-012-9397-0
45. De Lope C, Martin-Alonso S, Auzmendi-Iriarte J, Escudero C, Mulet I, Larrasa-Alonso J, et al. SIX1 represses senescence and promotes SOX2-mediated cellular plasticity during tumorigenesis. Sci Rep (2019) 9(1):1412. doi: 10.1038/s41598-018-38176-0
46. Adrados I, Larrasa-Alonso J, Galarreta A, Lopez-Antona I, Menendez C, Abad M, et al. The homeoprotein SIX1 controls cellular senescence through the regulation of p16INK4A and differentiation-related genes. Oncogene (2016) 35(27):3485–94. doi: 10.1038/onc.2015.408
47. Tchougounova E, Jiang Y, Brasater D, Lindberg N, Kastemar M, Asplund A, et al. Sox5 can suppress platelet-derived growth factor b-induced glioma development in Ink4a-deficient mice through induction of acute cellular senescence. Oncogene (2009) 28(12):1537–48. doi: 10.1038/onc.2009.9
48. Ruhland MK, Loza AJ, Capietto AH, Luo X, Knolhoff BL, Flanagan KC, et al. Stromal senescence establishes an immunosuppressive microenvironment that drives tumorigenesis. Nat Commun (2016) 7:11762. doi: 10.1038/ncomms11762
49. Eggert T, Wolter K, Ji J, Ma C, Yevsa T, Klotz S, et al. Distinct functions of senescence-associated immune responses in liver tumor surveillance and tumor progression. Cancer Cell (2016) 30(4):533–47. doi: 10.1016/j.ccell.2016.09.003
50. Braumuller H, Wieder T, Brenner E, Assmann S, Hahn M, Alkhaled M, et al. T-helper-1-cell cytokines drive cancer into senescence. Nature (2013) 494(7437):361–5. doi: 10.1038/nature11824
51. Rakhra K, Bachireddy P, Zabuawala T, Zeiser R, Xu L, Kopelman A, et al. CD4(+) T cells contribute to the remodeling of the microenvironment required for sustained tumor regression upon oncogene inactivation. Cancer Cell (2010) 18(5):485–98. doi: 10.1016/j.ccr.2010.10.002
52. van Tuyn J, Jaber-Hijazi F, MacKenzie D, Cole JJ, Mann E, Pawlikowski JS, et al. Oncogene-expressing senescent melanocytes up-regulate MHC class II, a candidate melanoma suppressor function. J Invest Dermatol (2017) 137(10):2197–207. doi: 10.1016/j.jid.2017.05.030
Keywords: senescence, immune microenvironment, immunotherapy, lung squamous cell carcinoma, overall survival
Citation: Hu X, Guo L, Liu G, Dai Z, Wang L, Zhang J and Wang J (2022) Novel cellular senescence-related risk model identified as the prognostic biomarkers for lung squamous cell carcinoma. Front. Oncol. 12:997702. doi: 10.3389/fonc.2022.997702
Received: 19 July 2022; Accepted: 20 October 2022;
Published: 17 November 2022.
Edited by:
Zhi-Xiang Xu, University of Alabama at Birmingham, United StatesReviewed by:
Rajarsi Gupta, Stony Brook Medicine, United StatesCopyright © 2022 Hu, Guo, Liu, Dai, Wang, Zhang and Wang. This is an open-access article distributed under the terms of the Creative Commons Attribution License (CC BY). The use, distribution or reproduction in other forums is permitted, provided the original author(s) and the copyright owner(s) are credited and that the original publication in this journal is cited, in accordance with accepted academic practice. No use, distribution or reproduction is permitted which does not comply with these terms.
*Correspondence: Jun Wang, am9obi1raW5nQDEyNi5jb20=; Jian Zhang, emhhbmdqaWFuQGd6aG11LmVkdS5jbg==
†These authors have contributed equally to this work
‡ORCID: Jian Zhang, orcid.org/0000-0002-0557-886X
Disclaimer: All claims expressed in this article are solely those of the authors and do not necessarily represent those of their affiliated organizations, or those of the publisher, the editors and the reviewers. Any product that may be evaluated in this article or claim that may be made by its manufacturer is not guaranteed or endorsed by the publisher.
Research integrity at Frontiers
Learn more about the work of our research integrity team to safeguard the quality of each article we publish.