 Peng Hao1†
 Bo-Yu Deng
 Zhe-Xing Liu
 Wu Zhou
 Yi-Kai Xu
- 1Nanfang Hospital, Southern Medical University, Guangzhou, China
- 2School of Medical Information Engineering, Guangzhou University of Chinese Medicine, Guangzhou, China
- 3School of Biomedical Engineering, Southern Medical Uinversity, Guangzhou, China
Purpose: To develop an appropriate machine learning model for predicting anaplastic lymphoma kinase (ALK) rearrangement status in non-small cell lung cancer (NSCLC) patients using computed tomography (CT) images and clinical features.
Method and materials: This study included 193 patients with NSCLC (154 in the training cohort, 39 in the validation cohort), 68 of whom tested positive for ALK rearrangements and 125 of whom tested negative. From the nonenhanced CT scans, 157 radiomic characteristics were extracted, and 8 clinical features were collected. Five machine learning (ML) models were assessed to find the best classification model for predicting ALK rearrangement status. A radiomic signature was developed using the least absolute shrinkage and selection operator (LASSO) algorithm. The predictive performance of the models based on radiomic features, clinical features, and their combination was assessed by receiver operating characteristic (ROC) curves.
Results: The support vector machine (SVM) model had the highest AUC of 0.914 for classification. The clinical features model had an AUC=0.805 (95% CI 0.731–0.877) and an AUC=0.735 (95% CI 0.566–0.863) in the training and validation cohorts, respectively. The CT image-based ML model had an AUC=0.953 (95% CI 0.913–1.0) in the training cohort and an AUC=0.890 (95% CI 0.778–0.971) in the validation cohort. For predicting ALK rearrangement status, the ML model based on CT images and clinical features performed better than the model based on only clinical information or CT images, with an AUC of 0.965 (95% CI 0.826–0.882) in the primary cohort and an AUC of 0.914 (95% CI 0.804–0.893) in the validation cohort.
Conclusion: Our findings revealed that ALK rearrangement status could be accurately predicted using an ML-based classification model based on CT images and clinical data.
Introduction
Lung cancer is the leading cause of cancer-related death worldwide. In 2013, in women aged 40 to 59 years, lung cancer surpassed breast cancer as the main cause of cancer death (1). Non-small cell lung cancer (NSCLC) is the most common histological subtype, accounting for 85%-90% of lung cancers (2). In the past decade, the emergence of novel drugs that target signalling pathways activated by genetic changes, for example, EGFR mutations and ALK rearrangement status, has revolutionized the treatment of NSCLC patients (3). The presence of an ALK rearrangement protein has been discovered in a small percentage of NSCLC patients, mostly in those with lung adenocarcinoma (3). Approximately 5% of lung adenocarcinomas have ALK rearrangement status, which is mutually exclusive with EGFR mutations. Crizotinib is a promising ALK fusion status inhibitor (4). Thus, identifying ALK rearrangements in NSCLC patients is crucial for therapy planning.
Because histologic and genetic information from invasive biopsies is often taken from only a section of a generally heterogeneous tumour, this characterization information does not provide a thorough depiction of functional and physiological aspects of lesions (5). The most common method for diagnosing and assessing treatment response of lung malignancies is computed tomography (CT). Thus, previous research has examined the link between some gene mutations in lung cancer and clinical features and radiological characteristics of lung cancer (6). Some CT imaging features, such as central tumour location, pleural effusion, lobulated margin, large mass and distant metastases, have been linked to ALK gene rearrangements in these studies (7–13). However, the evaluation of these radiological characteristics of lung cancer, is time-consuming and greatly dependent on the radiologist’s knowledge. Machine learning (ML) is a computer-based method for diagnosing lung cancer, predicting survival, and forecasting gene mutations. It can help radiologists discover more about the phenotype of a tumour including that is not obvious on CT scans (14–19). To avoid overfitting and develop robust predictive or prognostic models, a successful radiomic prediction study requires several phases, including accurate statistical analysis, feature selection, and classification. To select a subset of features that can be merged into a multiparametric model, a variety of ML algorithms can be utilized. Although radiomic analysis has used a variety of ML approaches for categorization, there is no “one size fits all” solution because the effectiveness of different ML processes has been proven to vary depending on the kind of data or applicant (20).
As a result, the goal of this research was to investigate effective radiomics-based ML algorithms that predict ALK rearrangements in patients with NSCLC.
Materials and methods
Patients inclusion
From May 2012 to February 2020, we retrospectively reviewed all CT scans of NSCLC patients from PACS system at Nanfang hospital. This retrospective study examined 1002 patients with pathologically proven lung cancer who underwent surgery or received a biopsy. The clinical features of the patients were retrieved from the hospital information system. This study included patients over the age of 18 who met the following criteria: (1) had tumour specimens with confirmed ALK gene rearrangements and pathological testing; (2) had pretreatment CT images; and (3) had complete clinical data. The exclusion criteria were as follows: (1) patients receiving treatment before CT scan (2) the time between CT examination and treatment was longer than one month; (3) multiple tumour nodules were found in the lung; (4) tumour lesions were near the hilar and could not be separated from neighbouring hilar architecture. According to these criteria, 716 patients were included, 648 of whom were ALK negative and 68 of whom were positive for ALK rearrangements. Twenty percent of the ALK negative patients were randomly chosen to participate in our study. Finally, this study included 193 patients, 125 ALK negative patients and 68 ALK positive patients. The flowchart of patients selection for non-small cell lung cancer (NSCLC) was show in Figure 1. The TNM system was utilized for staging based on the American Joint Committee on Cancer (AJCC) manual (21). The patients were divided into two groups: a primary cohort (n=154 patients) and an independent validation cohort (n=39 patients), were randomly chosen in a ratio of 8:2 from patients with and without ALK rearrangements. This study was approved by the Ethical Committee of the Nanfang Hospital.
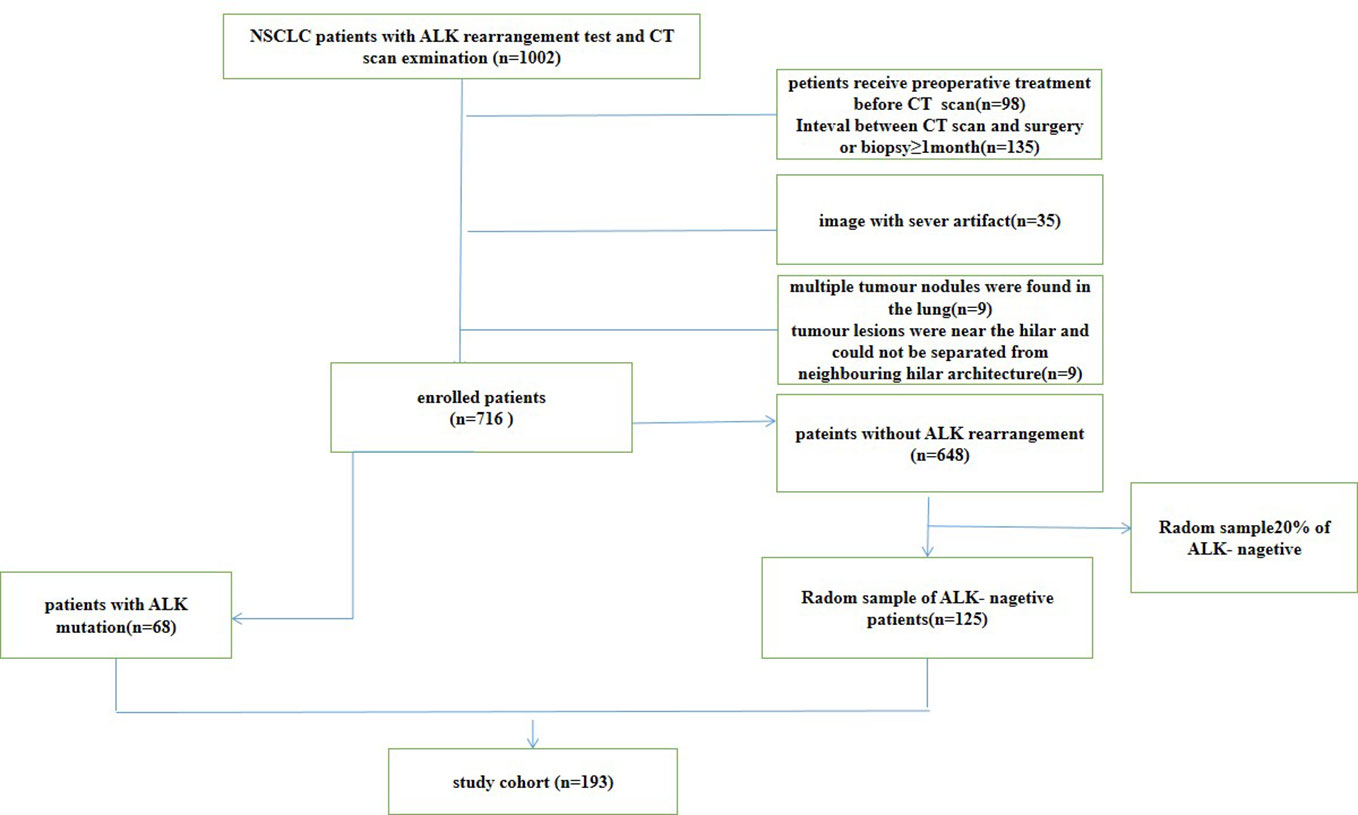
Figure 1 The flowchart of patients selection for non-small cell lung cancer (NSCLC).
The patients were examined with 256-slice iCT (Philips Health care, Best, Netherlands) or Siemens Medical Solutions’ Sensation 64, Definition AS (Forchheim, Germany) equipment. The scanning parameters of the two scanners were as follows: tube rotation time 0.5 s vs. 0.5 s, pitch 0.87 vs. 1.2, detector collimation 128 0.625 vs. 64, tube voltage 120 kV, tube current 100-300 mA, field view 350 mm, matrix 512×512, slice thickness 1-5 mm, reconstruction interval 1 mm, and voxel spacing (X and Y directions) 0.52-1.36 mm. Two different scanners from different manufacturers were adopted. Standardization and normalization were applied to all matrices before analysis (22).
Analysis of ALK rearrangement status
For genetic status determination, tissue samples acquired from biopsy or surgical excision were employed. The tissue specimens were prepared using formalin fixation and paraffin embedding. Immunohistochemistry with the D5F3 antibody, which has already been widely utilized for this purpose, was employed to detect ALK rearrangement gene expression. Two senior pathologists validated the findings. Wild-type ALK was defined as a specimen that did not have the ALK fusion gene present.
Radiomic analysis
The radiomic analysis included five steps, which was illustrated in Figure 2.
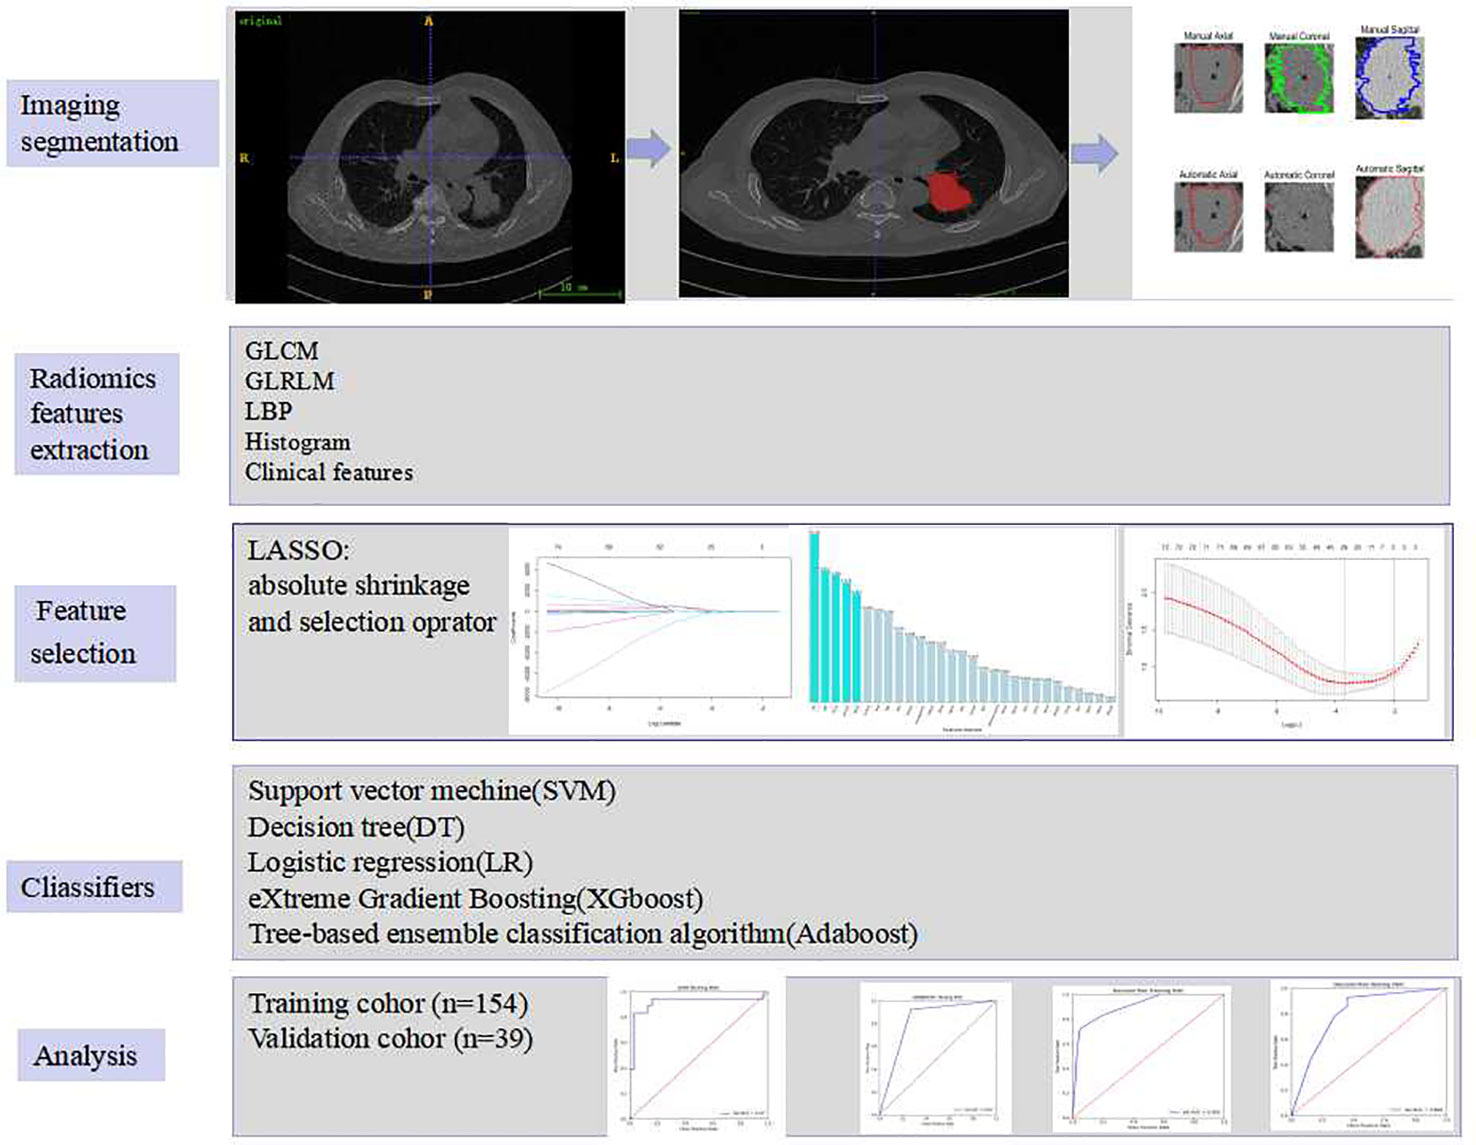
Figure 2 The radiogenomics framework of this study.
Segmentation of tumours
For each patient, horizontal, coronal and sagittal views were used for tumour segmentation by using ITK-SNAP software (http://www.itksnap.org/). A chest radiologist with 8 years of experience manually segregated the regions of interest (ROIs) and a senior with ten years of expertise reviewed all the ROIs. To ensure segmentation reproducibility, 30 patients were chosen at random to validate the inter-observer agreement between two observers’ delineations of ROIs using the dice similarity coefficient (DSC) by using Matlab 2018b, average value:0.8349 (from 0.6680 to 0.9186).To illustrate,the level of volume agreement the categorization scale below was used: DSC≥0.85 (High Agreement), 0.85>DSC≥0.70(Medium Agreement), 0.7>DSC≥0.5 (Low Agreement), DSC<0.5(Very Low Agreement) (23) Some inappropriate segmentations for ROI bounds were modified where necessary. An automatic active contour segmentation method was used to refine the manually segmented findings.
Radiomic features extraction
Radiomic characteristics were extracted from two-dimensional region of interest (2D-ROI). Pyradiomics (http://pyradiomics.readthedocs.io/en/latest/index.html) was utilized. To be potentially clinically beneficial, we constructed classifiers based on radiomic features acquired from each ROI. Grey level co-occurrence matrix (GLCM), grey level run length matrix (GLRLM), local binary pattern (LBP), histogram, and clinical parameters were acquired from each ROI. The texture and clinical features were then normalized.
Feature selection and classification algorithms
The LASSO technique and 10-fold cross-validation were used to obtain the best subset of radiomic characteristics. A variety of classifiers, including support vector machine (SVM), eXtreme gradient boosting (XGboost), tree-based ensemble classification algorithm (Adaboost), decision tree (DT) and logistic regression (LR), were assessed. The model’s performance was evaluated using receiver operating characteristic (ROC) curves and the area under the ROC curve (AUC) by 100 repeated tests. Accuracy, sensitivity, F1, recall and mean absolute error were all calculated as well.
Statistics analysis
Data was analysed with IBM SPSS 25.0 (http://www.ibm.com). For continuous variables, the two independent samples t-test or the Mann–Whitney U test were used, and the significant differences in the ML model between the ALK+ and ALK- groups were investigated using the same statistical methodologies. For categorical variables, such as gender, history of smoking, smoking index, clinical stage, distant metastasis, and tumour’s degree of pathological invasiveness and EGFR mutation of tumour, the chi-square test or Fisher’s exact test was used. The difference in AUCs between the two models was calculated statistically using DeLong’s test. The ML model was implemented using the Keras toolkit and Python (version 3.6.8, https://www.python.org/).
Results
Patient Cohort
The clinical characteristics of the patients were described in Table 1. The ALK rearrangement-positive patients were significantly younger than the ALK rearrangement-negative individuals (P < 0.001). In addition, more patients with stage III-IV cancer were found in the ALK mutation group (P < 0.001).
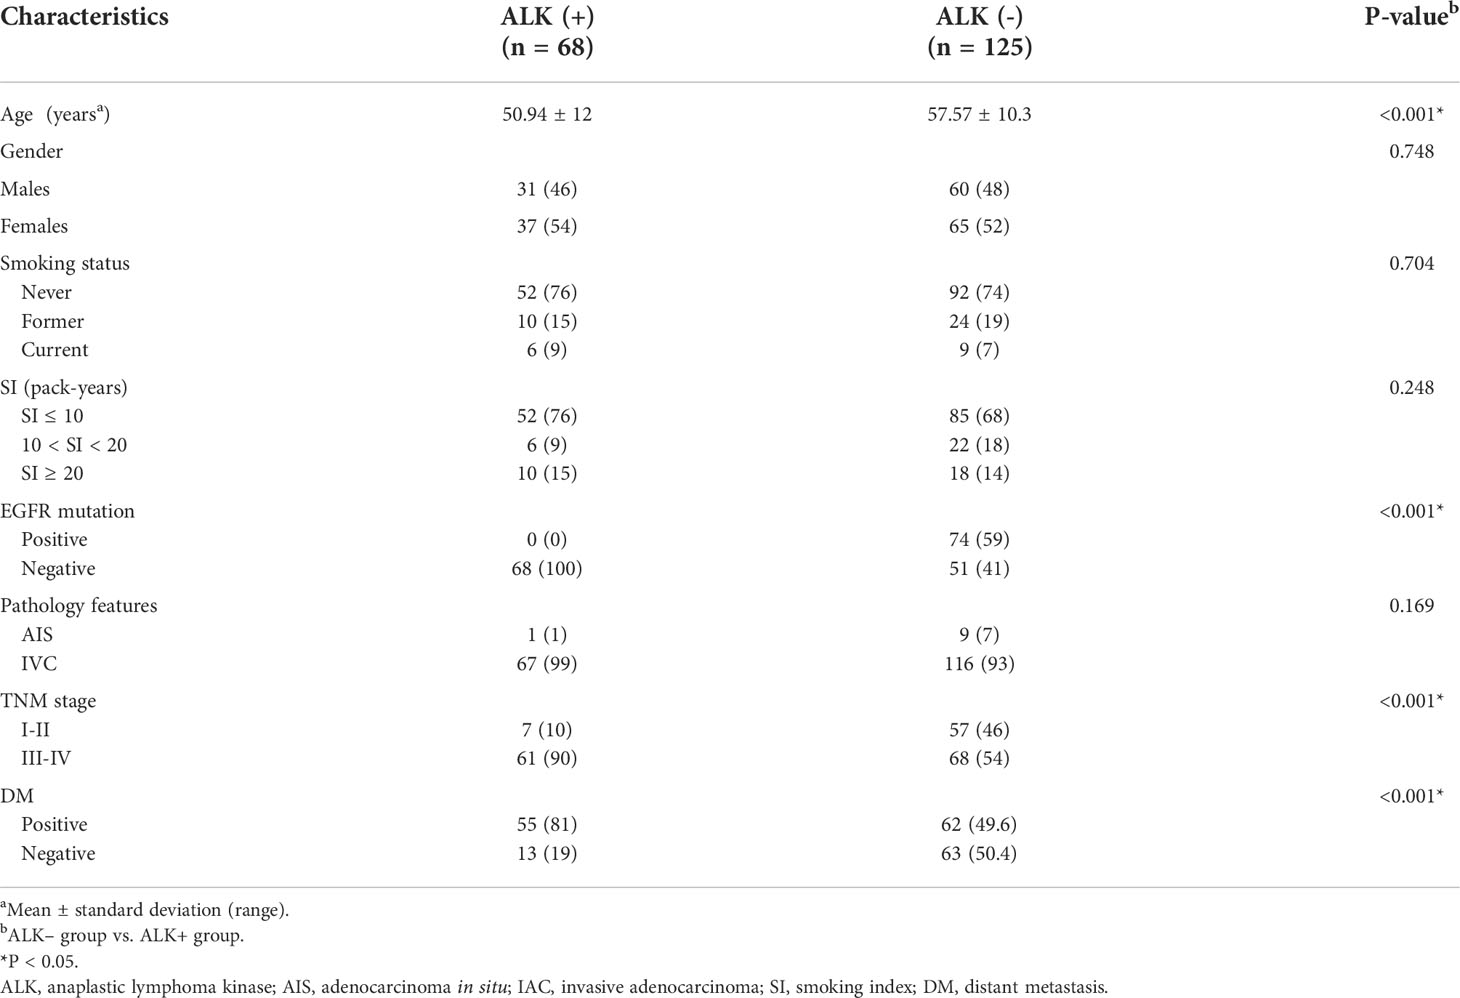
Table 1 Clinical characteristics of the ALK (+) and ALK (-) patients.
Performance of the radiomic machine learning algorithm
The best subset of radiomic characteristics was selected using the LASSO technique and 10-fold cross-validation. The radiomic features were retrieved from the 193 patients in the training set to create the radiomic signature. (Figures 3–5). The chosen radiomic properties were as follows: 37hist, 94hist, 99hist, 116hist, 117hist, 123hist, calcutes, homogeneity, Lbp1, Lbp2, Lbp5, PR, SRE, SALGLE (Table 2). Age and phase are proved significant clinical features.
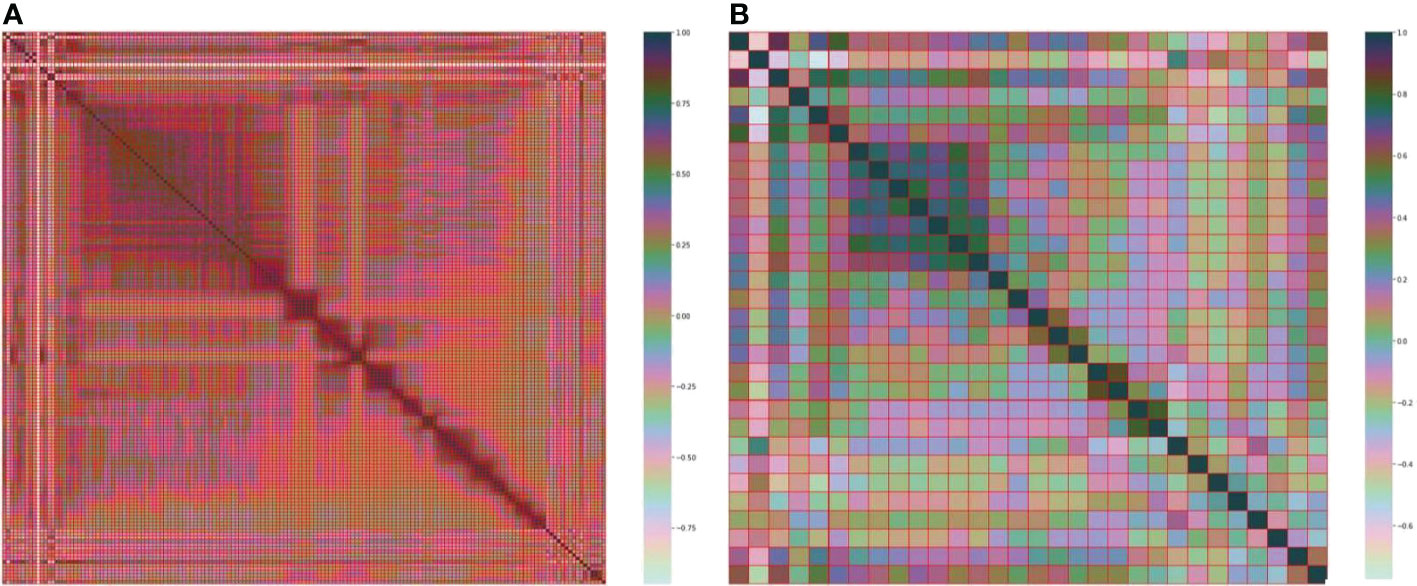
Figure 3 (A) Heatmap of the 157 radiomic features. (B) Heatmap of the 30 most important radiomic characteristics.
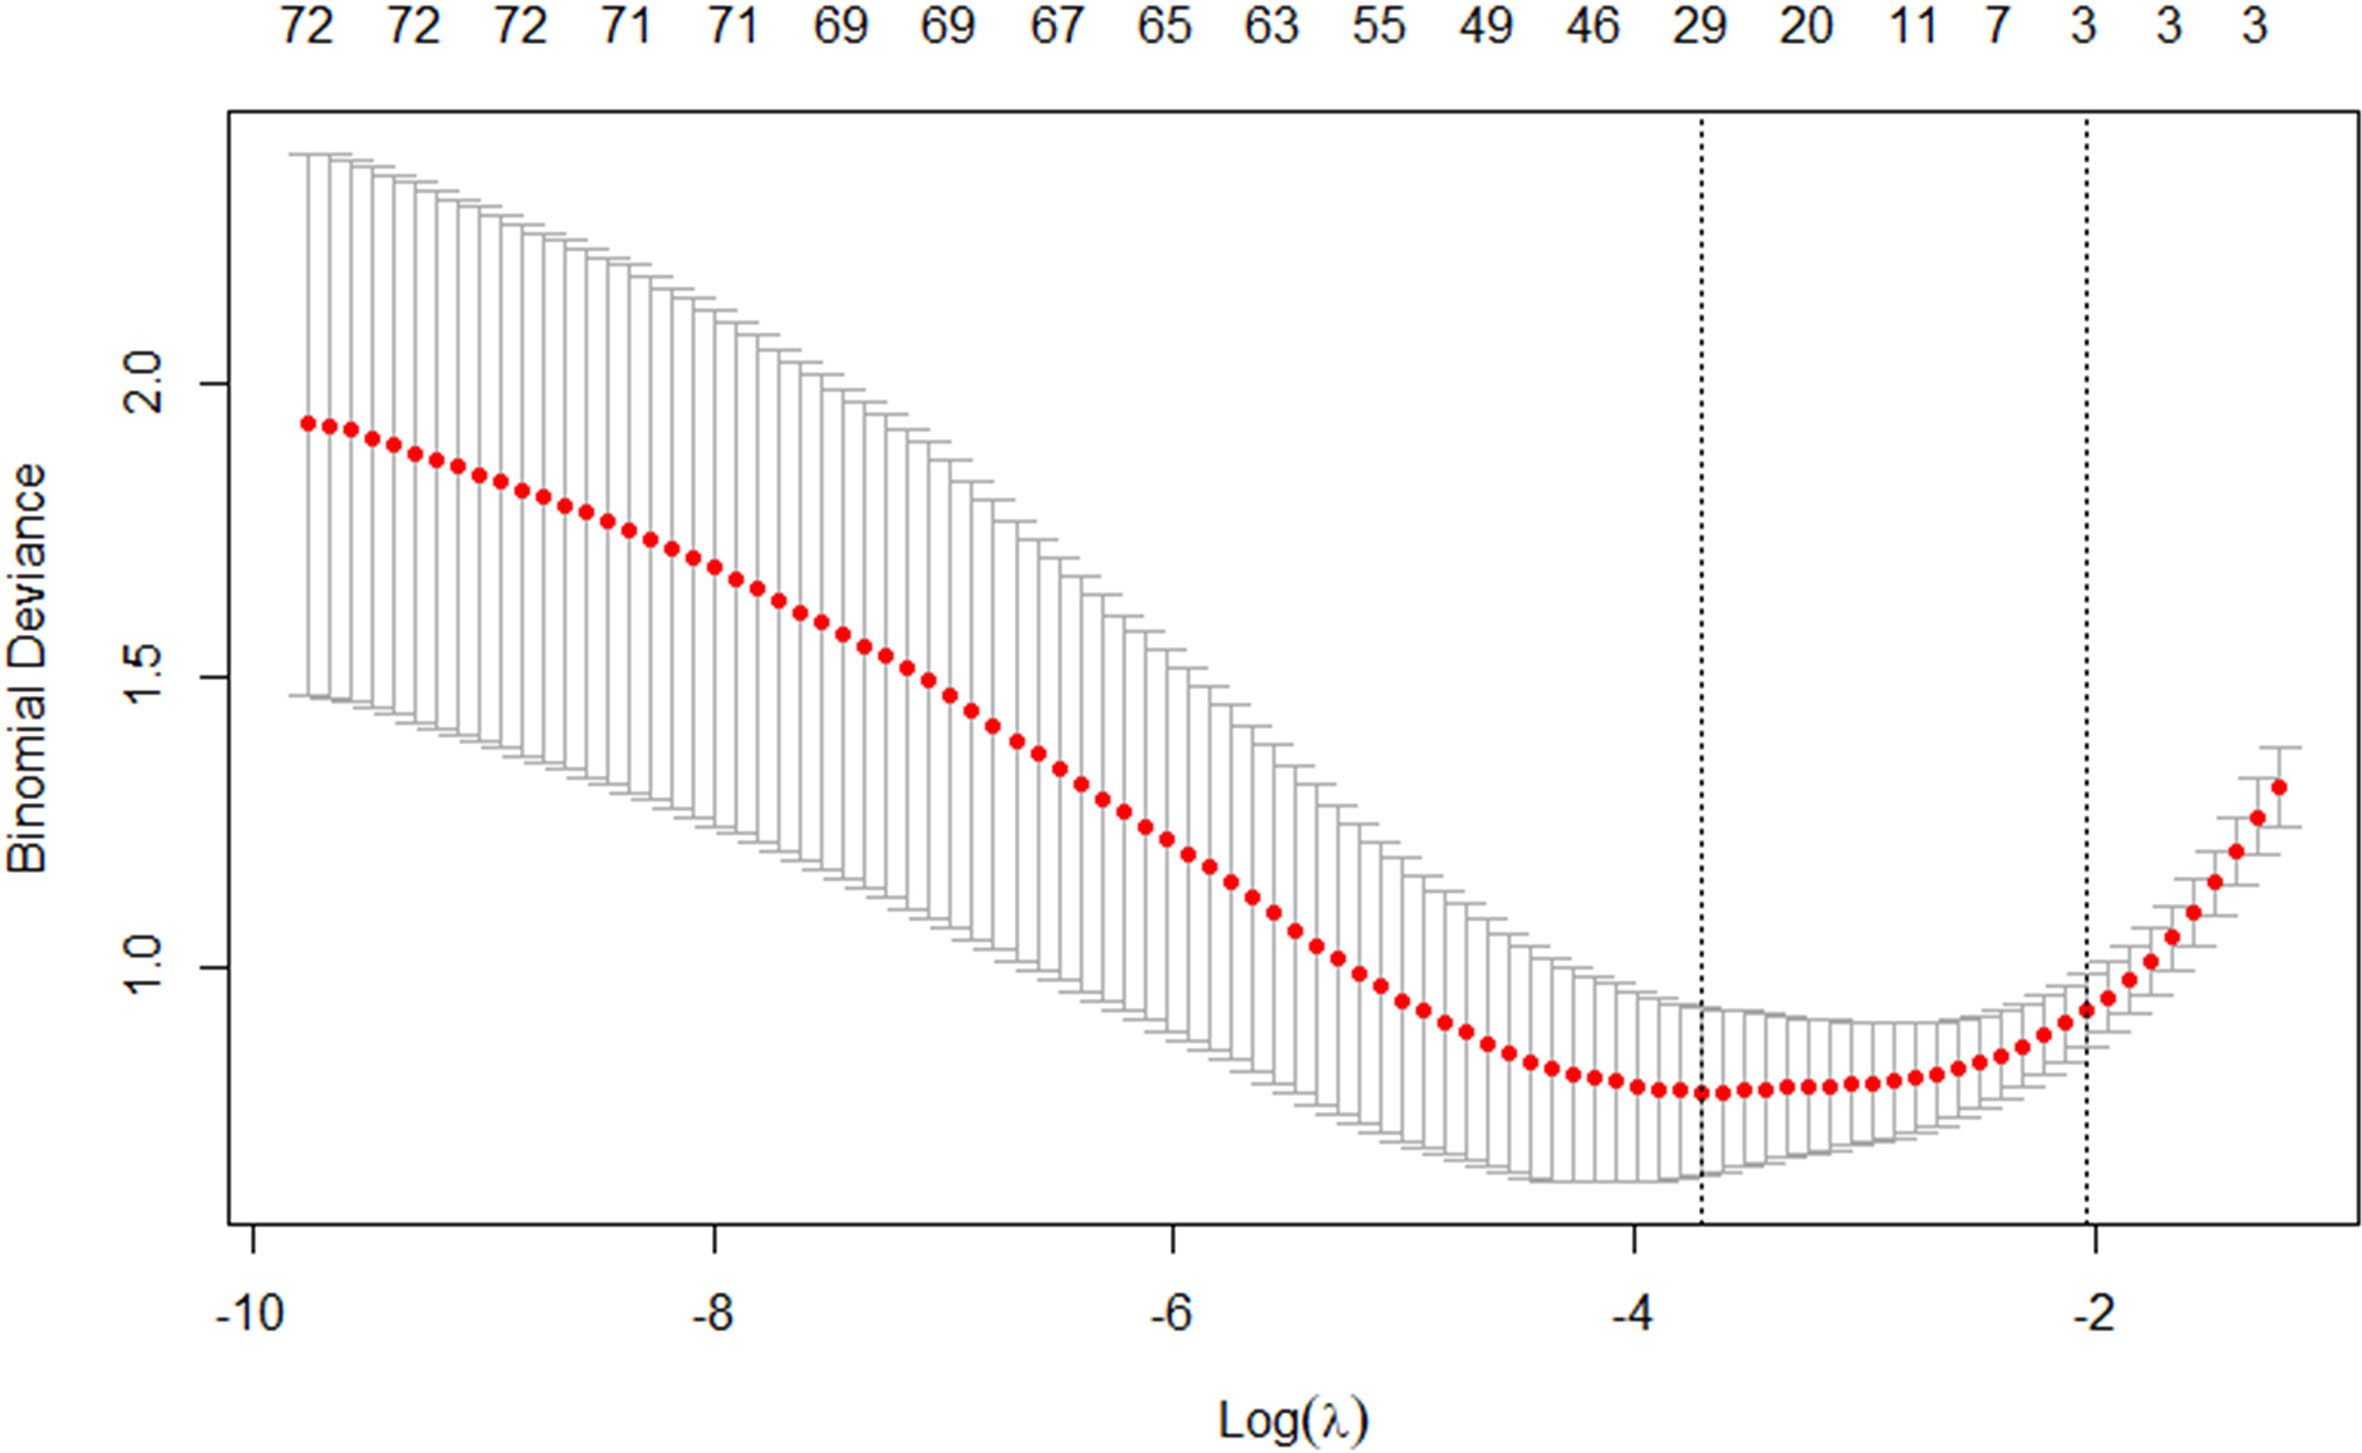
Figure 4 The tuning parameter in the LASSO model was chosen using a 10-fold cross-validation method based on minimum criterion. The LASSO regression cross-validation model’s binomial deviances as a function of logs(λ) were plotted.
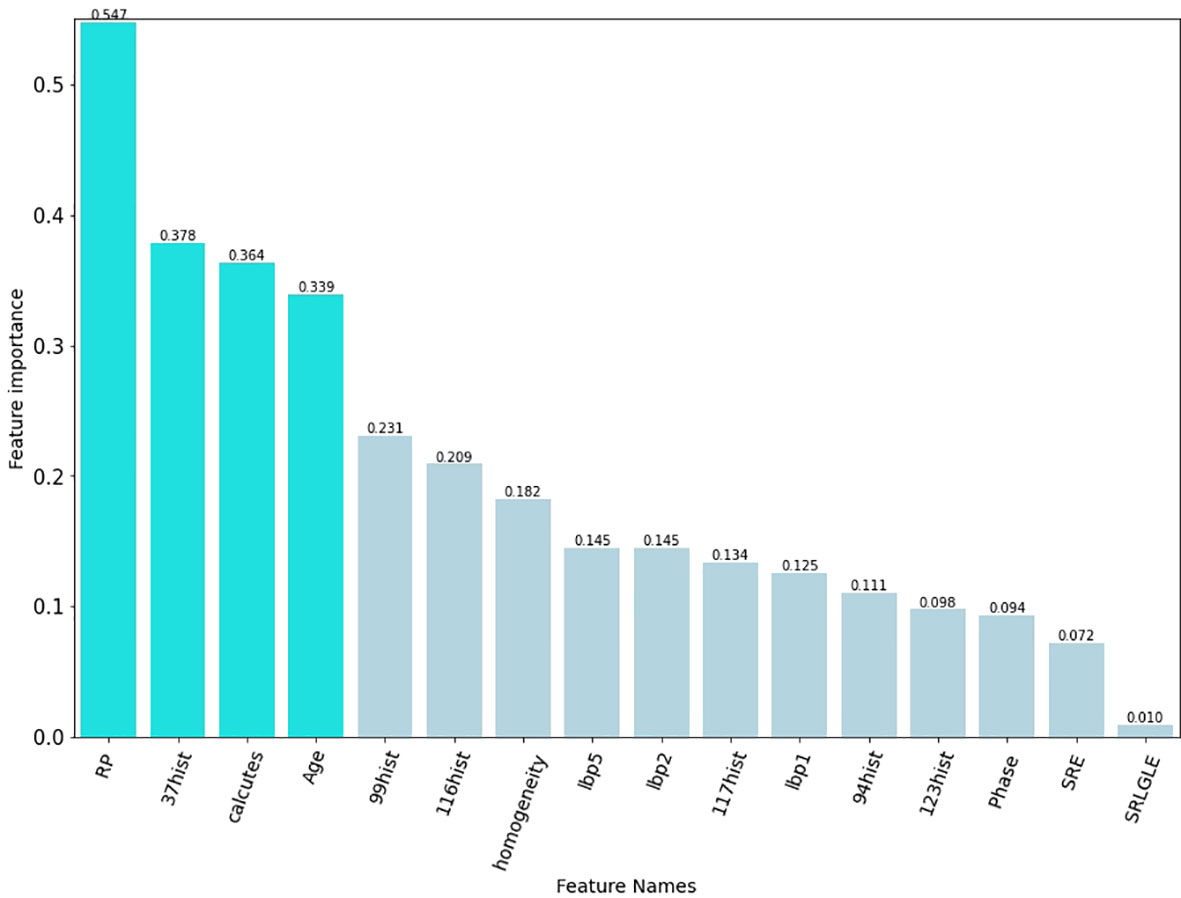
Figure 5 The final elements that were chosen to be maintained. The preserved characteristics were on the y axis, and the matching LASSO regression coefficients were on the x axis. The log(λ) coefficients of the features that have been fitted.
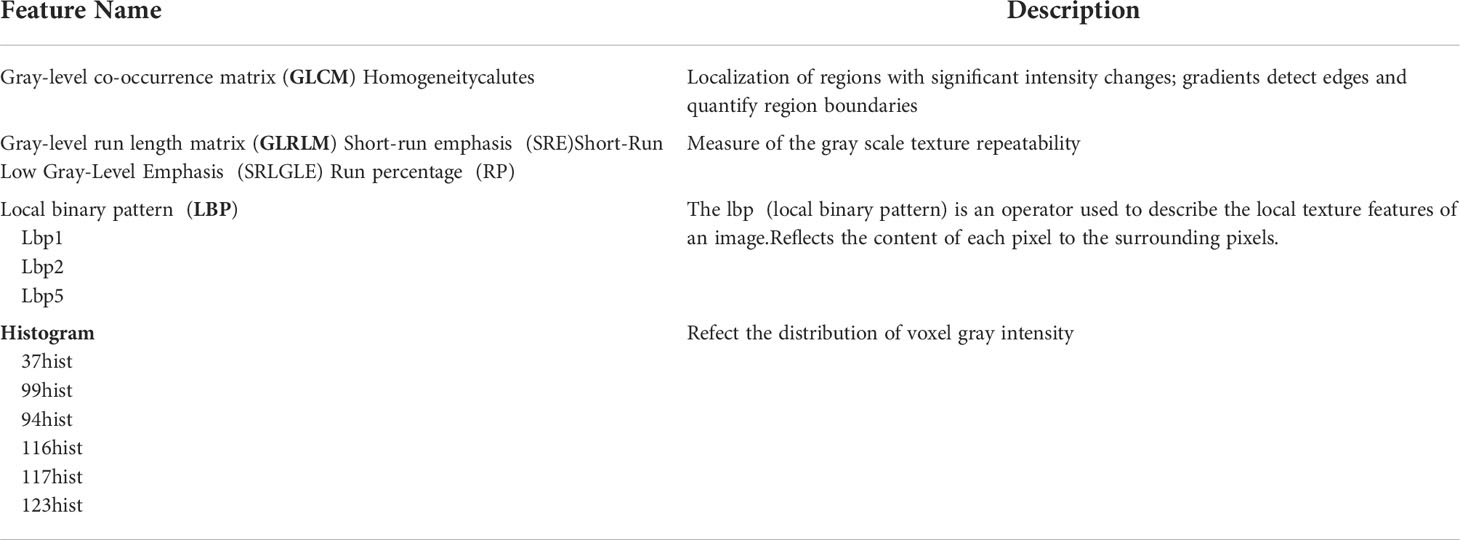
Table 2 Selected features with descriptions.
Supervised learning classification
After applying SVM, XGboost, Adaboost, LBP, DT, and LR to determine the optimal features, we identified the most appropriate approach for generating the final classification model based on their performances. We also used grid-search cross-validation to find the best parameters for all of the ML techniques discussed above. In terms of detecting ALK mutations, SVM exceeded the other traditional ML methods as shown in Tables 3, 4 and Figure 6.
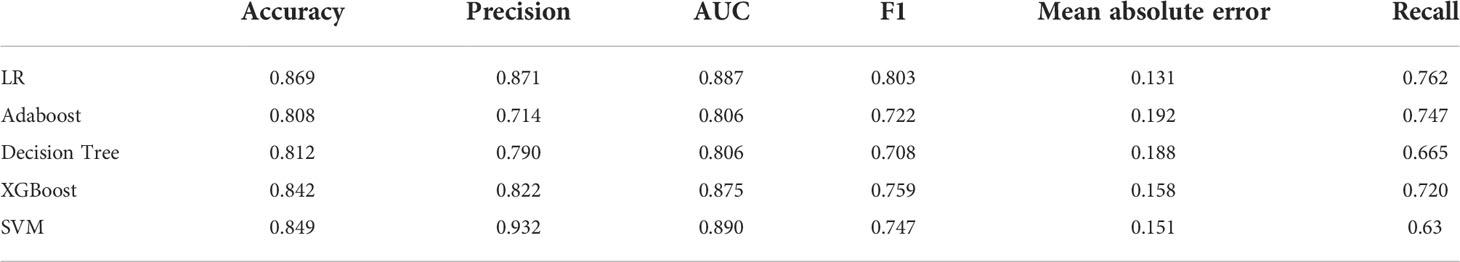
Table 3 Assessment of different classifier feature selection-based machine learning models for predicting ALK fusion type in the validation cohort.
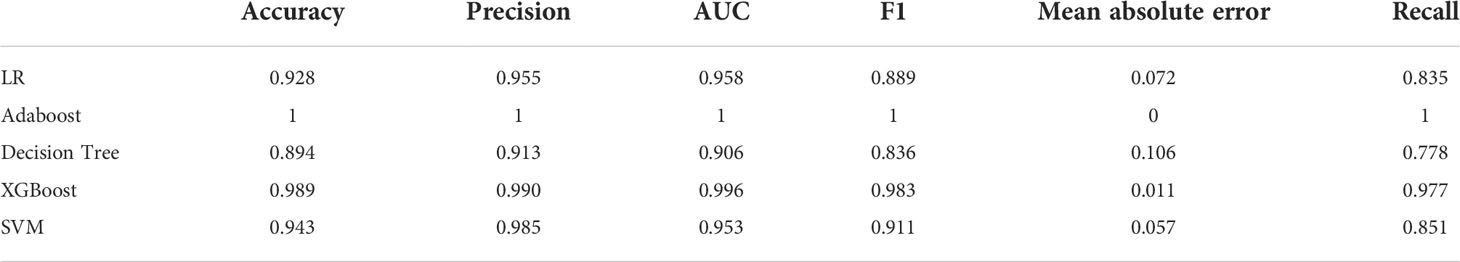
Table 4 Assessment of different classifier feature selection-based machine learning models for predicting ALK fusion type in the training cohort.
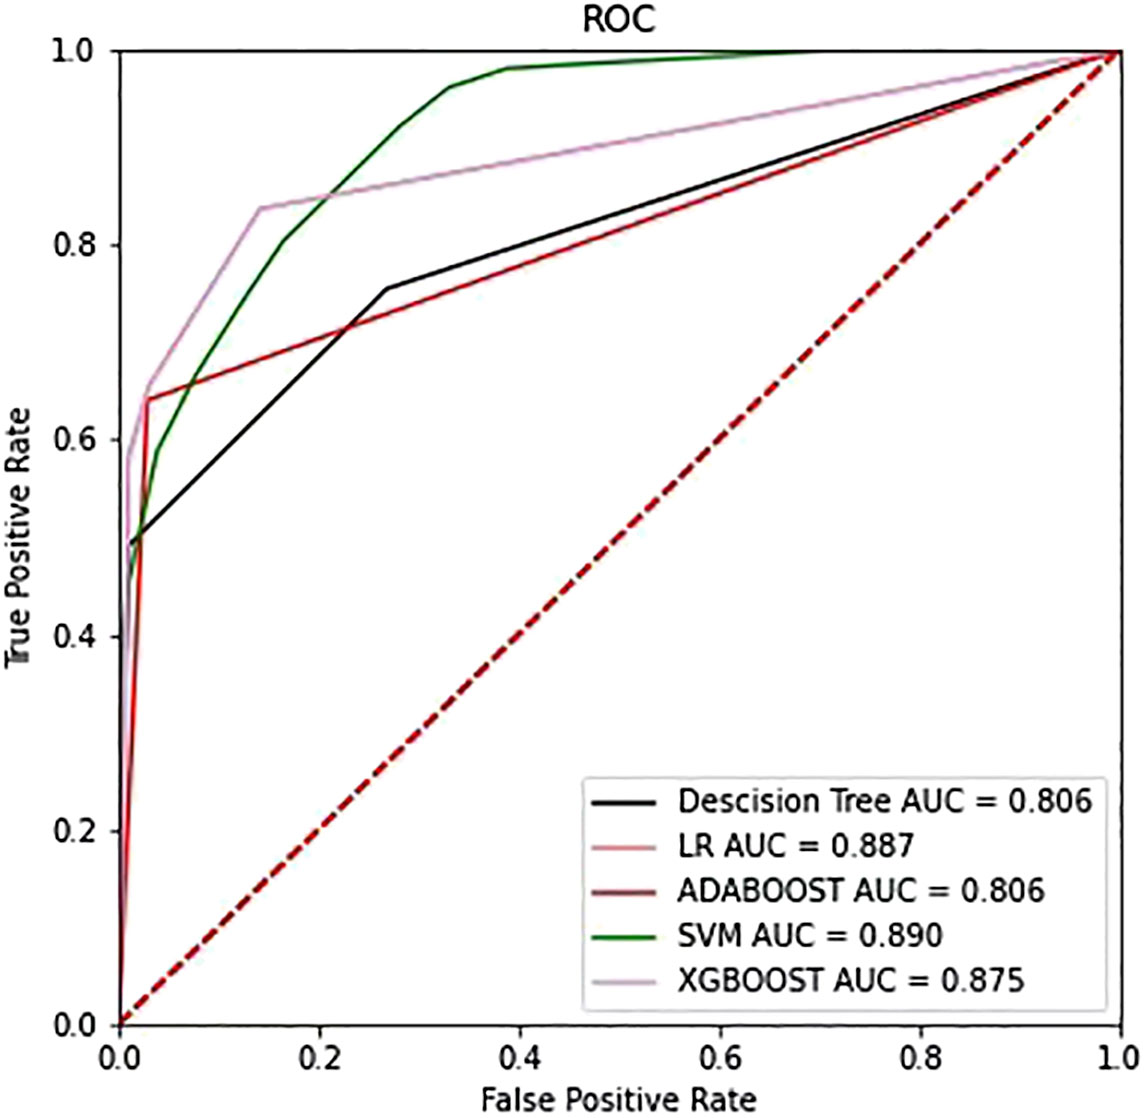
Figure 6 The ROC curves of the top four models selected from the training phase on the testing dataset.
Predictive performance of the machine learning model
The SVM classifier had the highest AUC for classification (Table 5). In the primary cohort, the ML model trained on both CT scans and clinical features performed well AUC=0.965 (95% CI 0.8257–0.8823), which was verified in the validation cohort AUC=0.914 (95% CI 0.804–0.891; P<0.001). For the CT image-based model, the AUC was 0.953 (95% CI 0.913–1.0) and 0.890 (95% CI 0.778–0.971) for the primary and validation cohorts, respectively. The performance of the ML models trained on both CT images and clinical characteristics was significantly higher than that of the clinical model. The result for the primary cohort trained on the clinical model was an AUC=0.805 (95% CI 0.731–0.877; P<0.0001), and that for the validation cohort was an AUC=0.735 (95% CI 0.566–0.863; P<0.005). The decision curves are shown in Figure 7. The results indicated that ML models trained on both CT images and clinical data performed better than ML models trained by only CT images or the clinical characteristics.
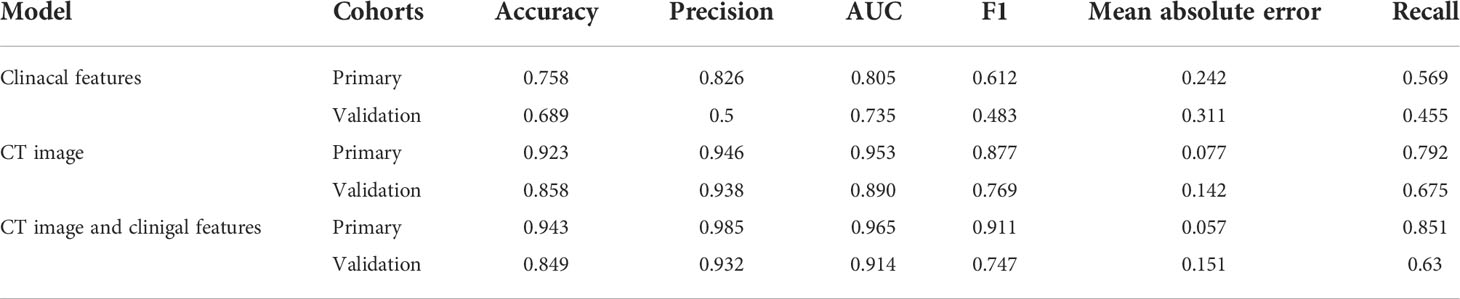
Table 5 Predictive performance of SVM in the primary and validation cohorts.
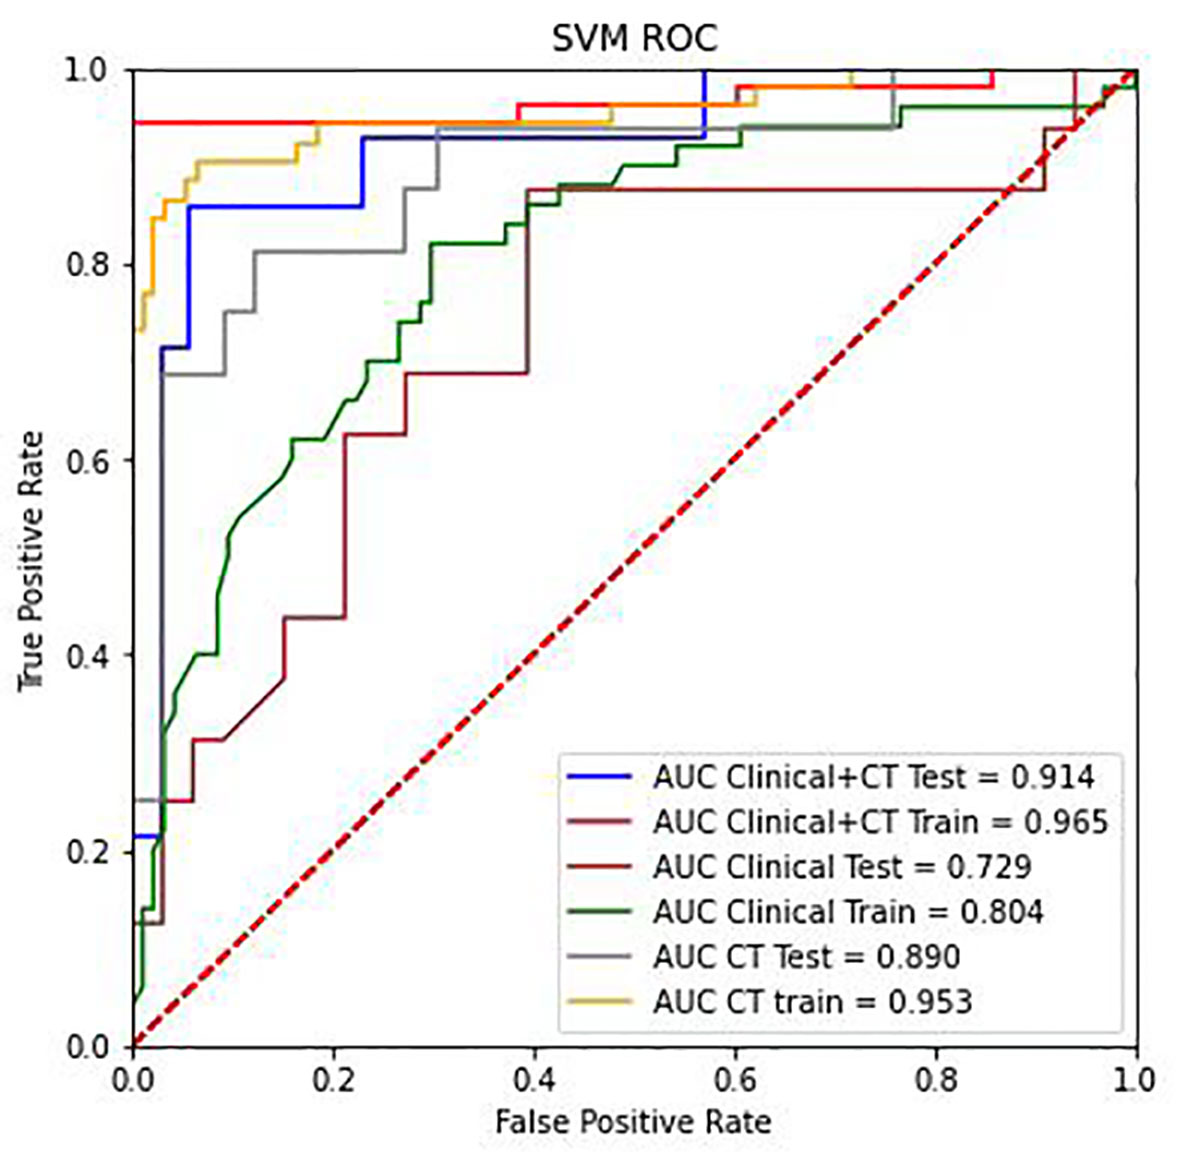
Figure 7 The ROC curve analysis of the CT radiomics models, clinical features, and combinations of CT radiomics and clinical features in the training group and testing group.
Discussion
Our findings demonstrated that using the SVM classifier to predict ALK gene rearrangements based on both CT scans and clinical characteristics was the most effective strategy. In our study, the integrated model exhibited the highest AUC, which exceeds the clinical models based on previously identified CT characteristics (also known as morphological or semantic CT features) (12, 24) and combined with clinical features, semantic CT features, and radiomic features (25).
Among clinical features, we found ALK+ patients are often younger than ALK- patients, which is consistent with prior studies (7). Female sex and smoking history, on the other hand, do not differ much between the two groups of patients. The bulk of the patients in our ALK+ study was in advanced stages of cancer (III-IV). ALK gene rearrangements were more common in lung cancer at advanced stages, in accordance with a prior study (10). Clinical information is useful in improving the integrated model for ALK rearrangement status detection, as it increases the integrated model’s performance by incorporating clinical characteristics for lesions in the primary and validation cohorts. A previous study had proposed a predictive model for detecting ALK rearrangements, using age as the only clinical component selected and many semantic CT features (AUC=0.846) (9).
Our findings imply that radiomics can be used to predict ALK rearrangement status on CT images in patients with NSCLC. The histogram and texture categories served as the foundation for the radiomic model, which implies that the intensity change of tumours was a potent predictor of the ALK genetic mutation. In this study, we found that Rp, 37hist, and calutes, that linked with ALK mutations. The AUC for postcontrast CT radiomic characteristics detecting ALK rearrangements was 0.829, according to Ma et al. (26). However, their research was based on enhanced CT scans. The radiomic model in our study demonstrates that radiomic features extracted from nonenhanced CT images are sufficient for developing a reliable ALK rearrangements prediction model in NSCLC patients.
Radiomics is an emerging discipline attempting to bridge the gap between medical imaging and personalized medicine (27, 28) by investigating the value of medical images in the diagnosis, grading, and prognostication of diseases using medical image analysis technologies and ML algorithms. However, the best way to use certain medical images or objectives is unclear due to the various feature selection approaches and ML algorithms (29).
In recent years, researchers have investigated the efficacy of various feature selection and ML algorithms in medical image classification to determine whether they are appropriate for the given medical image data. For example, Shiri I et al. (20) examined radiomic characteristics from low-dose CT, diagnostic quality CT, and PET-CT as well as ML techniques in NSCLC patients. Their results predicted mutation status of EGFR and KRAS. Then, six feature selection procedures and 12 classifiers were used, and multivariate ML-based AUC performances for EGFR and KRAS were improved to 0.82 and 0.83, respectively. Lan Song et al. compared the performance of three feature selection approaches and two classification methods for predicting ALK fusion in lung cancer patients using clinical characteristics combined with conventional CT and radiomic data (25). They extracted 1218 radiomic characteristics from CT scans and discovered that the LR and DT classifiers had the best prediction performance (AUC=0.890). The optimal ML classifier and feature selection method varied between studies, which could be related to a variety of factors, such as visual modalities, feature extraction algorithms, the number of features chosen, the goal task, and cohort size. According to Han’s study, radiomics-based ML was used to determine the best model for NSCLC histologic subtypes (29), and SVM paired with LASSO produced the highest prediction efficacy, similar to our study.
Even though our model’s performance was quite promising, there are a few limitations in this study that need to be addressed. First, although the results were favourable, the model’s ability to handle imbalanced data must be improved to generalize the prediction outcome to more datasets. Second, we may need to employ a cutting-edge deep learning method to perform the classification task is warranted. Several studies have successfully constructed models to address this issue with positive results (30). These findings have encouraged us to use neural networks to construct the baseline model in future studies.
In conclusion, the ML model that combined CT scans and clinical features are able to accurately identify the status of the ALK gene. This study provides a noninvasive solution, which is a quick and simple way to guide clinical genetic diagnosis.
Data availability statement
The original contributions presented in the study are included in the article/supplementary material. Further inquiries can be directed to the corresponding author.
Ethics statement
The studies involving human participants were reviewed and approved by The Nanfang Hospital’s Ethical Committee. The patients/participants provided their written informed consent to participate in this study. Written informed consent was obtained from the individual(s) for the publication of any potentially identifiable images or data included in this article.
Author contributions
Guarantor of integrity of the entire study: PH, B-YD, WZ and Y-KX. Study concepts and design: PH, Z-XL and Y-KX. Literature research: PH, B-YD. Clinical studies: JX, C-TH, FZ. Experimental studies/data analysis: B-YD, WZ. Statistical analysis: FZ. Manuscript preparation: PH, Z-XL and Y-KX. Manuscript editing: PH, B-YD. PH and B-YD contribute equally to this work. All authors contributed to the article and approved the submitted version.
Funding
Natural Science Foundation of Guangdong Province (NO. 2017A030310102).
Acknowledgments
We thank the SPRINGER NATURE Author Services for its linguistic assistance during the preparation of this manuscript.
Conflict of interest
The authors declare that the research was conducted in the absence of any commercial or financial relationships that could be construed as a potential conflict of interest.
Publisher’s note
All claims expressed in this article are solely those of the authors and do not necessarily represent those of their affiliated organizations, or those of the publisher, the editors and the reviewers. Any product that may be evaluated in this article, or claim that may be made by its manufacturer, is not guaranteed or endorsed by the publisher.
References
1. Siegel RL, Miller KD, Jemal A. Cancer statistics 2017. CA: A Cancer J Clin (2017) 67(1):7–30. doi: 10.3322/caac.21387
2. Ganeshan B, Panayiotou E, Burnand K, Dizdarevic S, Miles K. Tumour heterogeneity in non-small cell lung carcinoma assessed by CT texture analysis: A potential marker of survival. Eur Radiol (2012) 22(4):796–802. doi: 10.1007/s00330-011-2319-8
3. Mok TS, Wu Y, Ahn M, Garassino MC, Kim HR, Ramalingam SS, et al. Osimertinib or platinum–pemetrexed in EGFR T790M–positive lung cancer. New Engl J Med (2017) 376(7):629–40. doi: 10.1056/NEJMoa1612674
4. Shaw AT, Kim D, Nakagawa K, Seto T, Crinó L, Ahn M, et al. Crizotinib versus chemotherapy in AdvancedALK-positive lung cancer. New Engl J Med (2013) 368(25):2385–94. doi: 10.1056/NEJMoa1214886
5. Cai W, Lin D, Wu C, Li X, Zhao C, Zheng L, et al. Intratumoral heterogeneity of ALK-rearranged and ALK/EGFR coaltered lung adenocarcinoma. J Clin Oncol (2015) 33(32):3701–9. doi: 10.1200/JCO.2014.58.8293
6. Miao Y, Zhu S, Li H, Zou J, Zhu Q, Lv T, et al. Comparison of clinical and radiological characteristics between anaplastic lymphoma kinase rearrangement and epidermal growth factor receptor mutation in treatment naïve advanced lung adenocarcinoma. J Thorac Dis (2017) 9(10):3927–37. doi: 10.21037/jtd.2017.08.134
7. Rizzo S, Petrella F, Buscarino V, De Maria F, Raimondi S, Barberis M, et al. CT radiogenomic characterization of EGFR, K-RAS, and ALK mutations in non-small cell lung cancer. Eur Radiol (2016) 26(1):32–42. doi: 10.1007/s00330-015-3814-0
8. Zhou JY, Zheng J, Yu ZF, Xiao WB, Zhao J, Sun K, et al. Comparative analysis of clinicoradiologic characteristics of lung adenocarcinomas with ALK rearrangements or EGFR mutations. Eur Radiol (2015) 25(5):1257–66. doi: 10.1007/s00330-014-3516-z
9. Yamamoto S, Korn RL, Oklu R. ALK molecular phenotype in non – small cell lung cancer: CT radiogenomic characterization. Radiology (2014) 272(2):568–76. doi: 10.1148/radiol.14140789
10. Choi C. Advanced adenocarcinoma of the lung: Comparison of CT characteristics of patients with anaplastic lymphoma kinase gene rearrangement and those with epidermal growth factor receptor mutation. Radiology (2015) 275(1):272–9. doi: 10.1148/radiol.14140848
11. Mendoza DP. Computed tomography imaging characteristics of NoneSmall-cell lung cancer with anaplastic lymphoma kinase rearrangements: A systematic review and meta-analysis. Clin Lung Cancer (2019) 132:28–35. doi: 10.1016/j.cllc.2019.05.006
12. Jeong CJ, Lee HY, Han J, Jeong JY, Lee KS, Choi YL, et al. Role of imaging biomarkers in predicting anaplastic lymphoma kinase-positive lung adenocarcinoma. Clin Nucl Med (2015) 40(1):e34–9. doi: 10.1097/RLU.0000000000000581
13. Yildiz VO, Ozkan E, West A. CT Gray-level texture analysis as a quantitative imaging biomarker of epidermal growth factor receptor mutation status in adenocarcinoma of the lung. AJR Am J Roentgenol (2015) 205:1016–25. doi: 10.2214/AJR.14.14147
14. Tu W, Sun G, Fan L, Wang Y, Xia Y, Guan Y, et al. Radiomics signature: A potential and incremental predictor for EGFR mutation status in NSCLC patients, comparison with CT morphology. Lung Cancer (2019) 132:28–35. doi: 10.1016/j.lungcan.2019.03.025
15. Yang X, He J, Wang J, Li W, Liu C, Gao D, et al. CT-based radiomics signature for differentiating solitary granulomatous nodules from solid lung adenocarcinoma. Lung Cancer (2018) 125:109–14. doi: 10.1016/j.lungcan.2018.09.013
16. Evelyn EC, de Jong E, Van Elmpt W, Rizzo S, Colarieti A, Spitaleri G, Leijenaar R, et al. Applicability of a prognostic CT-based radiomic signature model trained on stage I-III non-small cell lung cancer in stage IV non-small cell lung cancer. Lung Cancer (2018) 124:6–11. doi: 10.1016/j.lungcan.2018.07.023
17. Lu J, Ji X, L. W, Y. J. Machine learning-based radiomics for prediction of epidermal growth factor receptor mutations in lung adenocarcinoma. Dis Markers (2022) 2022:2056837. doi: 10.1155/2022/2056837
18. Le NQK, Kha QH, Nguyen VH. Machine learning-based radiomics signatures for EGFR and KRAS mutations prediction in non-Small-Cell lung cancer. Int J Mol Sci (2021) 22(17):9254. doi: 10.3390/ijms22179254
19. Lan S, Zhenchen Z, Huanwen W, Han W, Cheng X, Li J, et al. Individualized nomogram for predicting ALK rearrangement status in lung adenocarcinoma patients. Eur Radiol (2021) 31(4):2034–47.
20. Shiri I, Maleki H, Hajianfar G, Abdollahi H, Ashrafinia S, Hatt M, et al. Next-generation radiogenomics sequencing for prediction of EGFR and KRAS mutation status in NSCLC patients using multimodal imaging and machine learning algorithms. Mol Imaging Biol (2020) 22(4):1132–48. doi: 10.1007/s11307-020-01487-8
21. Edge SB, Compton CC. The American joint committee on cancer: The 7th edition of the AJCC cancer staging manual and the future of TNM. Ann Surg Oncol (2010) 17(6):1471–4. doi: 10.1245/s10434-010-0985-4
22. Park S, Lee SM, Do K, Lee J, Bae W, Park H, et al. Deep learning algorithm for reducing CT slice thickness: Effect on reproducibility of radiomic features in lung cancer. Korean J Radiol (2019) 20(10):1431. doi: 10.3348/kjr.2019.0212
23. Crispin-Ortuzar M, Apte AP, Iyer A. Technical note: Extension of CERR for computational radiomics: a comprehensive MATLAB platform for reproducible radiomics research. Med Phys (2018) 45(8):3713–20. doi: 10.1002/mp.13046
24. Halpenny DF, Riely GJ, Hayes S, Yu H, Zheng J, Moskowitz CS, et al. Are there imaging characteristics associated with lung adenocarcinomas harboring ALK rearrangements? Lung Cancer (2014) 86(2):190–4. doi: 10.1016/j.lungcan.2014.09.007
25. Song L, Zhu Z, Mao L, Li X, Han W, Du H, et al. Clinical, conventional CT and radiomic feature-based machine learning models for predicting ALK rearrangement status in lung adenocarcinoma patients. Front Oncol (2020) 10:369. doi: 10.3389/fonc.2020.00369
26. Ma D, Gao X, Dan Y, Zhang A, Wang W, Yang G, et al. Evaluating solid lung adenocarcinoma anaplastic lymphoma kinase gene rearrangement using noninvasive radiomics biomarkers. (2020) 13:6927–6935. doi: 10.2147/OTT.S257798
27. Lambin P, Leijenaar RTH, Deist TM, Peerlings J, De Jong EEC, Van Timmeren J, et al. Radiomics: The bridge between medical imaging and personalized medicine. Nat Rev Clin Oncol (2017) 14(12):749–62. doi: 10.1038/nrclinonc.2017.141
28. Gillies RJ, Kinahan PE, Hricak H. Radiomics: Images are more than pictures, they are data. Radiology (2016) 278(2):563–77. doi: 10.1148/radiol.2015151169
29. Han Y, Ma Y, Wu Z, Zhang F, Zheng D, Liu X, et al. Histologic subtype classification of non-small cell lung cancer using PET/CT images. Eur J Nucl Med Mol Imaging (2021) 48(2):350–60. doi: 10.1007/s00259-020-04771-5
Keywords: tomography, X-ray computed, anaplastic lymphoma kinase, gene mutation, non-small cell lung cancer, machine learning, texture
Citation: Hao P, Deng B-Y, Huang C-T, Xu J, Zhou F, Liu Z-X, Zhou W and Xu Y-K (2022) Predicting anaplastic lymphoma kinase rearrangement status in patients with non-small cell lung cancer using a machine learning algorithm that combines clinical features and CT images. Front. Oncol. 12:994285. doi: 10.3389/fonc.2022.994285
Received: 14 July 2022; Accepted: 26 September 2022;
Published: 20 October 2022.
Edited by:
Chuanming Li, Chongqing University Central Hospital, ChinaReviewed by:
Sheng Lin, The Affiliated Hospital of Southwest Medical University, ChinaYuchuan Hu, Tangdu Hospital, China
Copyright © 2022 Hao, Deng, Huang, Xu, Zhou, Liu, Zhou and Xu. This is an open-access article distributed under the terms of the Creative Commons Attribution License (CC BY). The use, distribution or reproduction in other forums is permitted, provided the original author(s) and the copyright owner(s) are credited and that the original publication in this journal is cited, in accordance with accepted academic practice. No use, distribution or reproduction is permitted which does not comply with these terms.
*Correspondence: Wu Zhou, emhvdXd1QGd6dWNtLmVkdS5jbg==; Yi-Kai Xu, eWlrYWkueHVAMTYzLmNvbQ==
†These authors have contributed equally to this work