
95% of researchers rate our articles as excellent or good
Learn more about the work of our research integrity team to safeguard the quality of each article we publish.
Find out more
ORIGINAL RESEARCH article
Front. Oncol. , 18 October 2022
Sec. Molecular and Cellular Oncology
Volume 12 - 2022 | https://doi.org/10.3389/fonc.2022.991850
This article is part of the Research Topic Computational Pathology for Tumor Microenvironment Assessment View all 4 articles
 Joshua Hamilton1,2,3Anne Breggia4Timothy L. Fitzgerald5Michael A. Jones6Peter C. Brooks3,7
 Karissa Tilbury1,3*
 Andre Khalil1,2,3*
Pancreatic ductal adenocarcinoma (PDAC) is one of the deadliest cancers with a minority (< 10%) of patients surviving five years past diagnosis. This could be improved with the development of new imaging modalities for early differentiation of benign and cancerous fibrosis. This study intends to explore the application of a two-photon microscopy technique known as second harmonic generation to PDAC using the 2D Wavelet Transform Modulus Maxima (WTMM) Anisotropy method to quantify collagen organization in fibrotic pancreatic tissue. Forty slides from PDAC patients were obtained and eight images were captured per each tissue category on each slide. Brownian surface motion and white noise images were generated for calibration and testing of a new variable binning approach to the 2D WTMM Anisotropy method. The variable binning method had greater resistance to wavelet scaling effects and white noise images were found to have the lowest anisotropy factor. Cancer and fibrosis had greater anisotropy factors (Fa) at small wavelet scales than normal and normal adjacent tissue. At a larger scale of 21 μm this relationship changed with normal tissue having a higher Fa than all other tissue groups. White noise is the best representative image for isotropy and the 2D WTMM anisotropy method is sensitive to changes induced in collagen by PDAC.
Pancreatic cancer is the deadliest solid organ malignancy, the 11th most common cancer but the 3rd most common cause of cancer-related death (1). At the time of presentation majority of patients have either locally advanced or metastatic disease; this presentation has a median survival of fewer than six months. Despite novel combinations of multiagent chemotherapy, this disease is fatal in most patients (2, 3). Tumor-associated stroma and microenvironment may provide an immunoprotective milieu; the fibrotic nature of PDAC frequently limits both chemotherapy and immunotherapy penetration (4–6). Unfortunately, conventional imaging modalities poorly differentiate benign fibrosis from cancerous fibrosis (7–9). Therefore, proper identification of cancerous fibrosis is critical for treatment decisions.
To develop a biologically meaningful diagnostic or treatment method, the underlying markers, and biophysical properties of PDAC development need to be better understood. Stromal cell heterogeneity leads to genetic predisposition to chemo and immunotherapy resistance in multiple cancers (10, 11). This heterogeneity is also tied to the severity of fibrosis caused by PDAC in the pancreas (12). Higher levels of fibrosis and stromal stiffness are also correlated with poor patient prognosis (13). Attempts to understand this relationship involved the use of PDAC mouse models in which researchers inhibited the ability of stroma cells to produce extracellular matrix (ECM) components such as collagen (14). When compared to the control PDAC models, the inhibition of collagen increased tumor cell metastasis and lethality (14). This suggests that the relationship between the activation of stromal cells, fibrosis, and cancer severity are more complex than a simple linear correlation. The remodeling of the extracellular matrix in the tumor microenvironment is a complex interaction between the PDAC cells and stromal cells, that orchestrates the loss of homeostasis with respect to collagen synthesis, degradation, and post-translational modification (15). Collagen in PDAC is typically longer, straighter, and more aligned than healthy pancreatic tissue collagen (16–18). Different structures of collagen have been shown to interact with T cell penetration leading to poor patient outcomes (6). One hypothesis is that stromal cell heterogeneity impacts the dynamics of collagen remodeling promoting tumorigenesis and suppressing immune system penetration into the tumor mass (19).
Exploration of the relationship between collagen and cancer has been conducted in a multitude of studies using Second Harmonic Generation (SHG) (20). SHG is a two-photon microscopy technique that uses pulsed lasers to elicit a non-linear response in the tissue (21). SHG microscopy is a label-free, collagen specific imaging technique with submicron resolution and 3D optical sectioning (22–24). The typical excitation wavelength used for collagen is in the infrared (IR) range and capable of penetrating tissue upwards of 500 μm (25). This would allow for imaging PDAC tumor biopsies with minimal modification to current clinical approaches. Recent studies applying SHG to PDAC use an open software known as CT-FIRE to quantify collagen fiber morphology (16–18, 20). First, a fixed-size curvelet is convolved with the image and then a fiber-tracing algorithm delineates individual collagen fibers to quantify collagen fiber width, length, alignment, and straightness. CT-FIRE is focused on identifying characteristics of single collagen fibers at a single scale; however, understanding the overall alignment at multiple convolution scales could be the key to a deeper understanding of PDAC ECM modification.
A recent publication highlighted the need for a multiscale approach to understanding collagen fiber organization in biological systems using the 2D Wavelet Transform Modulus Maxima (WTMM) anisotropy method on SHG images (26). The 2D WTMM anisotropy method involves convolving the image with Gaussian derivative wavelets over a continuous range of smoothing scales enabling a multiscale approach to understand organizational changes in an image. The method was first developed in the context of Galactic astronomy (27) and later used in a multitude of applications such as muscle morphogenesis (28–32), artificial bone implants (33), exploring the relationship between nerve and college in neuropathic adipose tissue (34), and the aforementioned exploration into comparing mouse melanoma and integrin knockout impact on collagen restructuring (26). To optimize this method for subtle changes between cancer and fibrotic collagen, updates to the 2D WTMM anisotropy method are being explored and presented in this paper.
This paper builds upon the previously published multiscale 2D WTMM anisotropy method to increase the sensitivity of the final anisotropy factor with the introduction of isotropic calibration images and statistically-driven histogram binning processes. This improved method is applied to SHG images of PDAC pathology slides annotated by a pathologist to reveal multiscale alterations of collagen fiber morphologies. This once again demonstrates the need of multiscale approaches to understanding the ECM, especially due to disease state alterations.
Forty H&E stained slides of PDAC tissue, from forty unique patients, originally biopsied for pathology analysis were obtained from the Maine Medical Center BioBank (MMC BB). The slides were scanned with an Aperio2 slide scanner (Leica Biosystems, Wetzlar, Germany) and then annotated by a pathologist who highlighted areas of cancer, fibrosis, and normal tissue. Twenty slides were annotated as only normal tissue and the other twenty slides had areas annotated as cancer. Of the twenty cancer slides, 15 also had areas annotated as fibrosis and 13 had areas annotated as normal tissue. Normal tissue on the same slide as cancer slide were categorized as normal adjacent tissue. This results in four tissue categories from the annotated slides, cancer, normal, fibrosis, and normal adjacent (see Table 1).
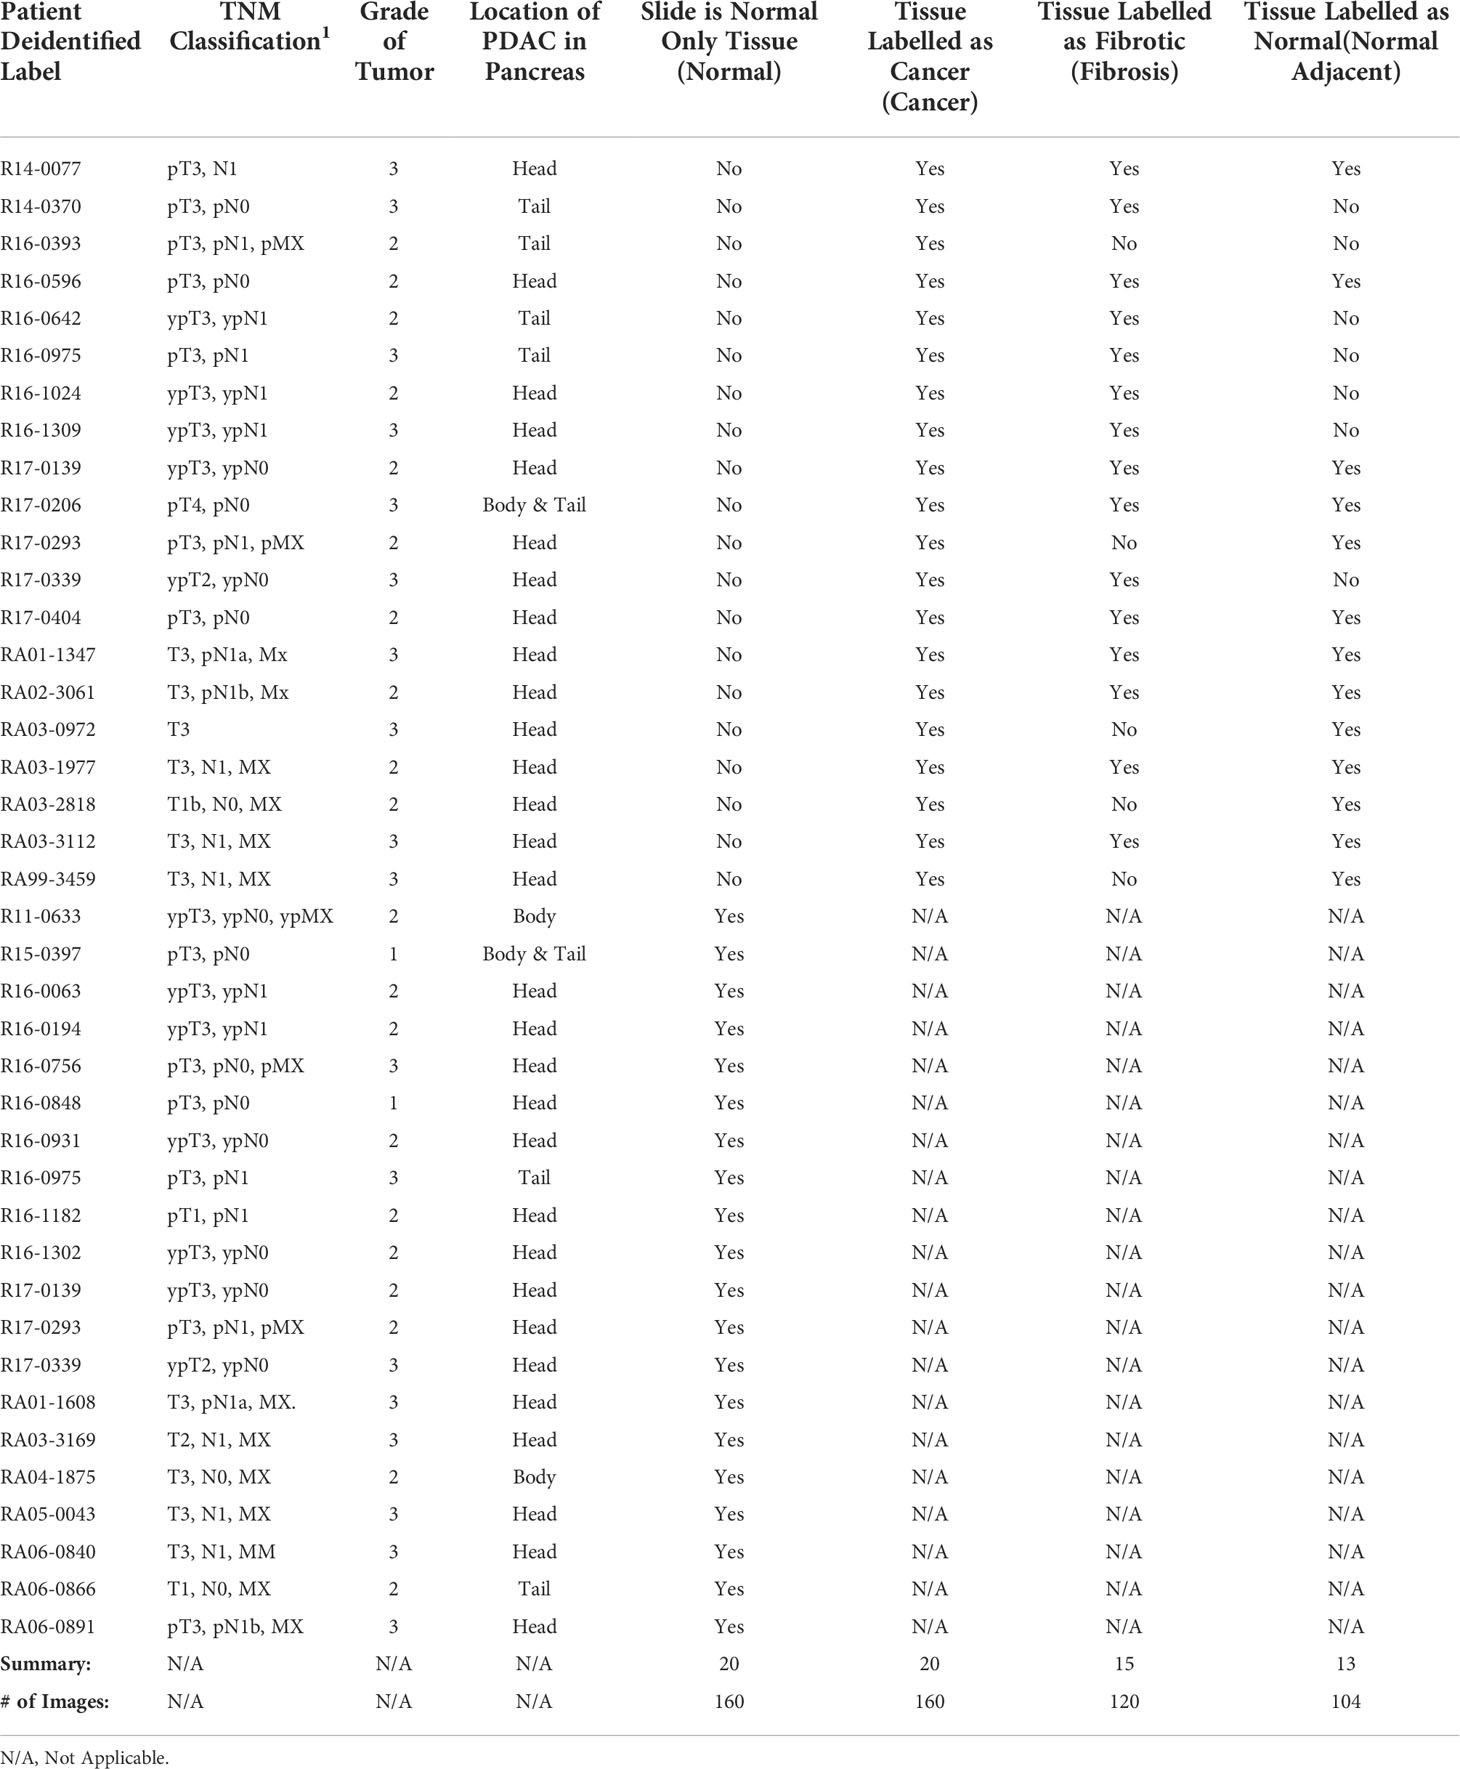
Table 1 Summary of pancreatic biopsy slide information by patient.
Eight distinct ductal structures within each normal, normal adjacent, fibrosis, and cancer were identified on the H&E slide and then imaged using SHG microscopy (Figure 1). SHG images were acquired on a custom-built 2-photon microscope consisting of an upright microscope stand (Olympus BX50WI, Olympus, Center Valley, Pennsylvania), laser scanning unit (Fluoview300, Olympus), titanium sapphire femtosecond laser (Chameleon Ultra II, Coherent, Santa Barbara, California), and an electro optic modulator (ConOptics, Danbury, Connecticut) for laser power modulation. Circular polarization was used for SHG imaging; it was verified at the focal plane by rotating a polarizer and experiencing no change in laser power. Forward directed SHG images were acquired at 890-nm excitation, using a LUMPlanFLN 40 × 0.8 NA (Olympus, Center Valley, Pennsylvania) water immersion objective. Forward directed SHG was collected in a 0.9 NA condenser lens and filtered using a 448/20 bandpass filter and the forward directed SHG signal was collected using a 448/20-nm (Semrock Rochester, New York) prior to detection via a H7421 GaAsP PMT (Hamamastsu, Hamamstsu City, Japan). Each region of interest was imaged using 2x optical zoom (180 μm field of view) with a digital resolution of 512 × 512 pixels and using a laser scanning speed of 2.71 s/frame with the final image resulting from Kalman filtering using 4 state updates. The full list of patients, images, and tissue categories used in this study are shown in Table 1.
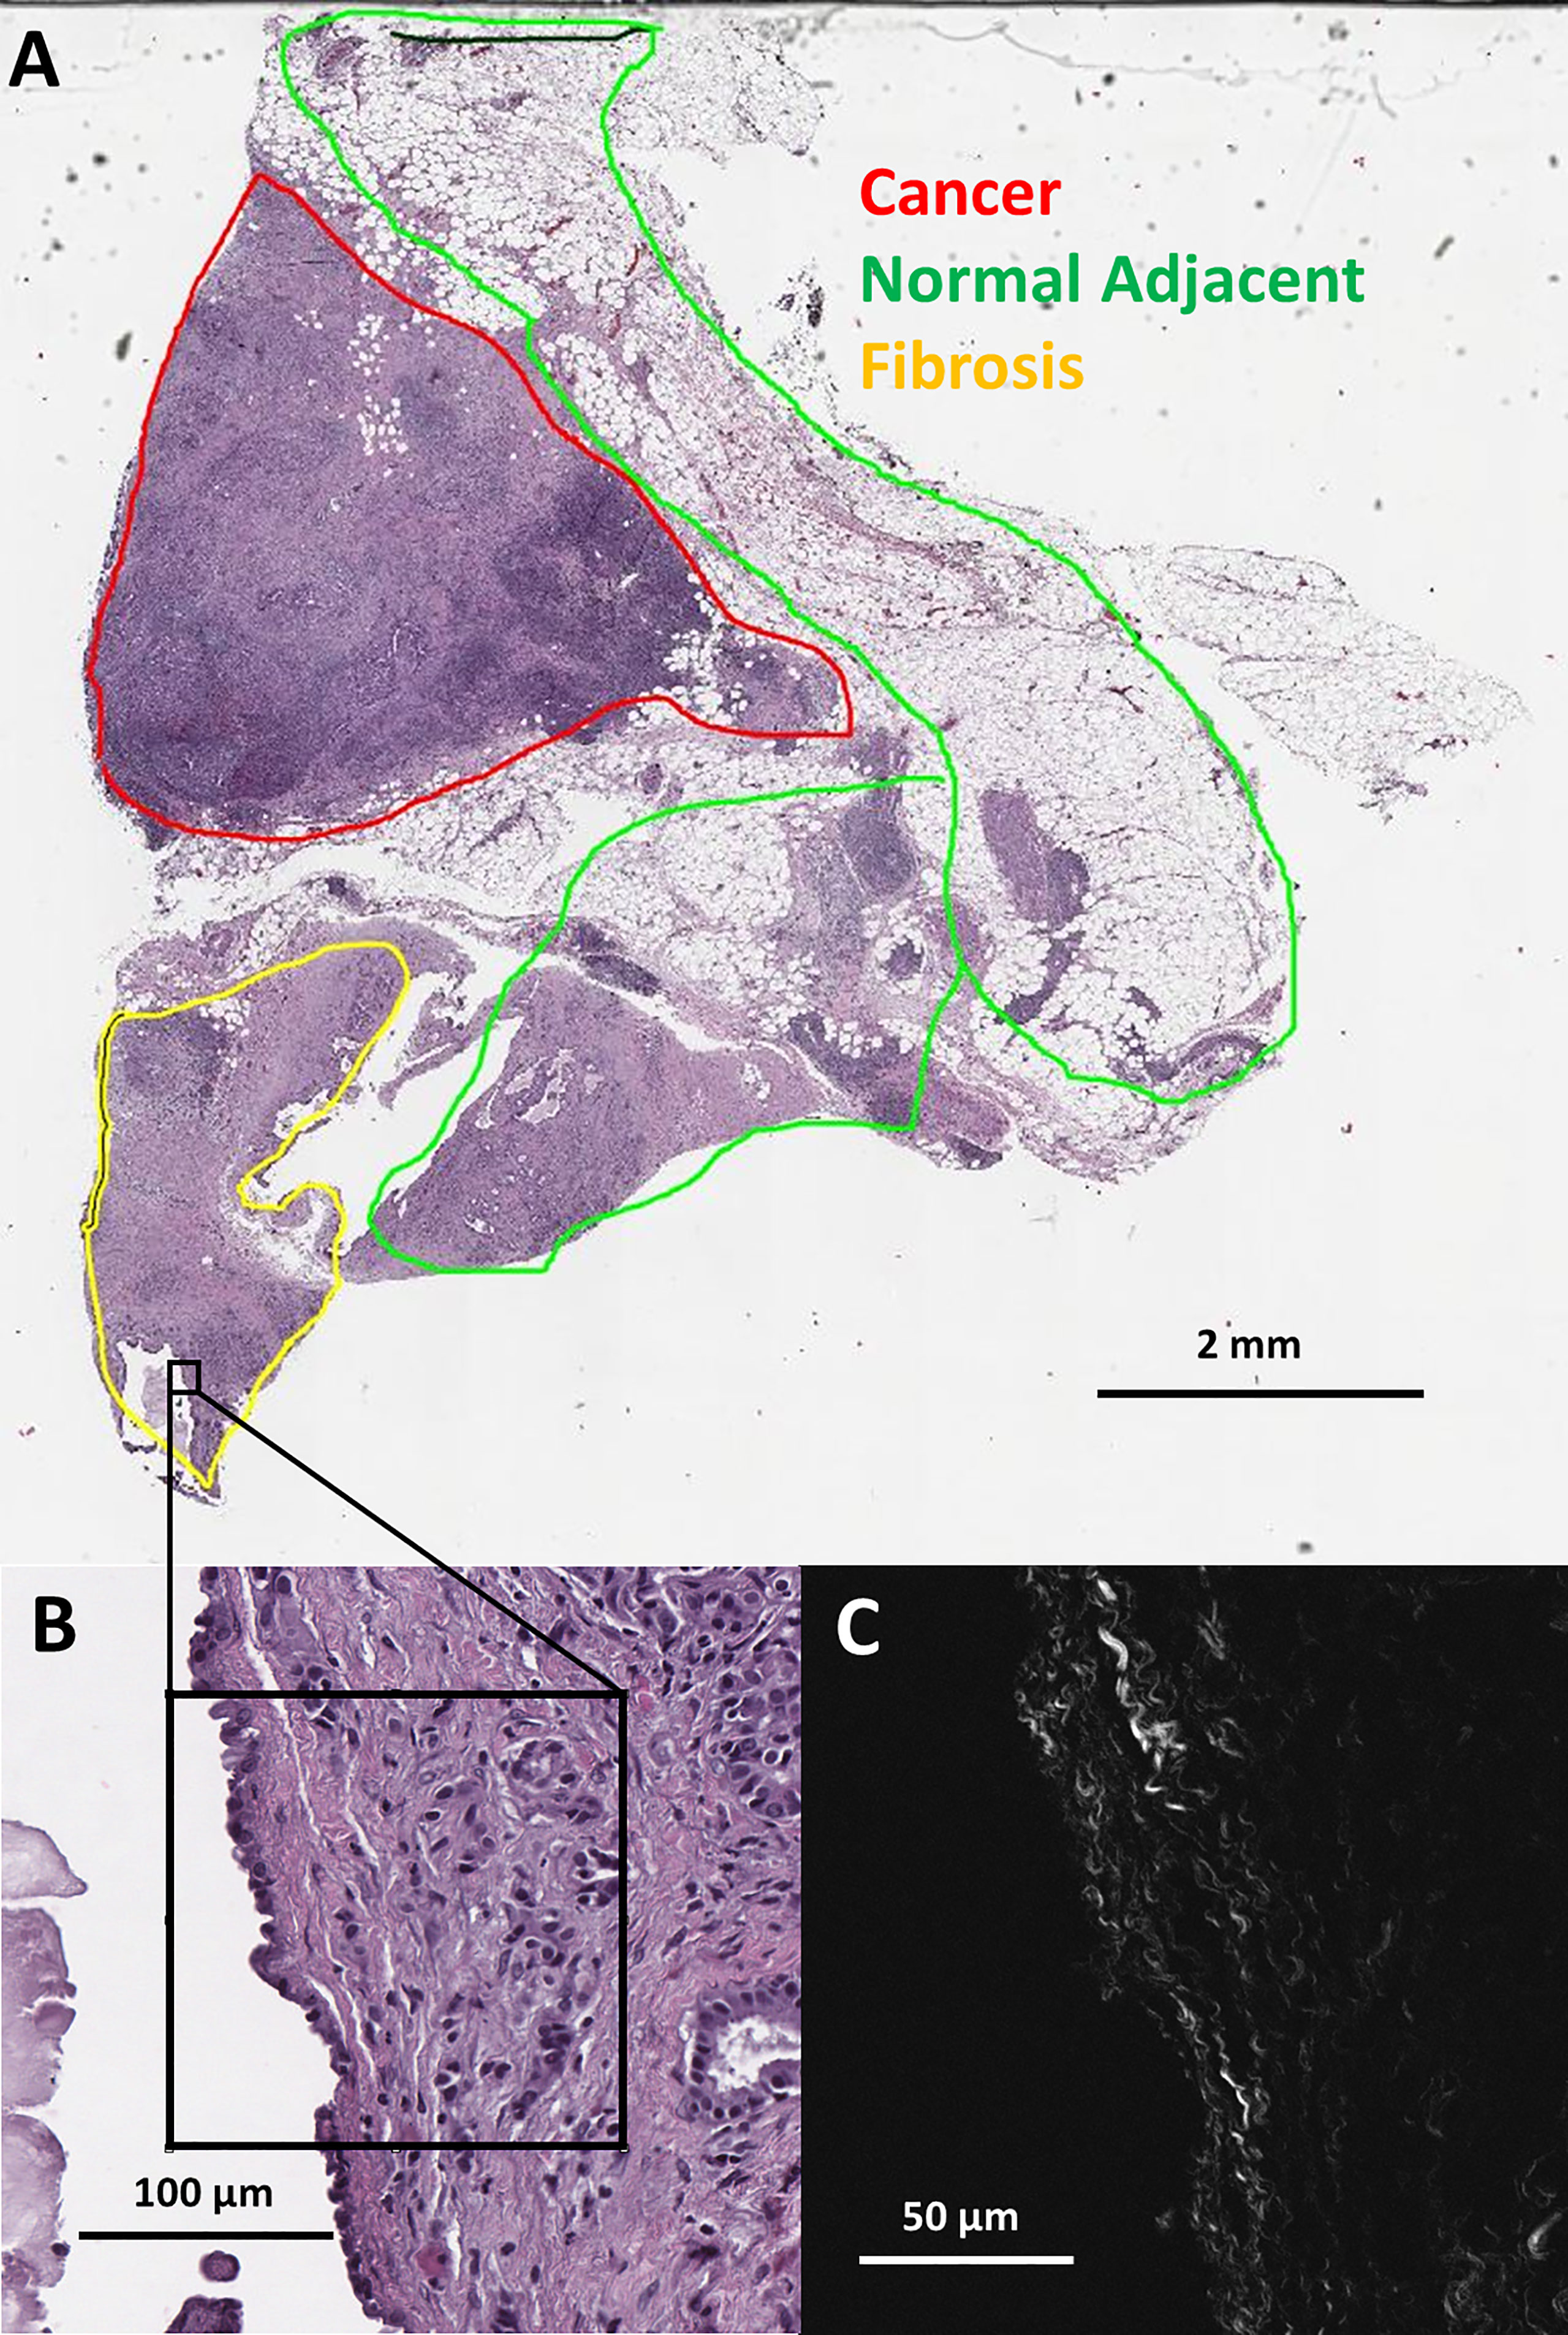
Figure 1 (A) Pathologist labeled H&E slide scan from a pancreatic tumor biopsy with an example of one SHG microscopy imaged area outlined in black. (B) Zoomed view of outlined area from H&E scan. (C) SHG microscopy image of outlined area.
The SHG images were analyzed using the 2D WTMM anisotropy method. This method involves convolving the image with wavelets over a continuous range of scales allowing for multiscale analysis. The wavelets used for the analysis are the partial derivatives of a 2D Gaussian (isotropic) smoothing function, ϕ(x,y) :
The 2D wavelet-transform applied to the image, f, is calculated as follows:
from which the modulus and argument (angle) can be obtained:
At a given scale a > 0, the wavelet transform modulus maxima are the specific locations b within the image where the modulus Mѱ [f] (b,a) is locally maximum in the direction of the argument Aѱ [f] (b,a). At each size scale a, these WTMM are automatically organized as “edge detection maxima chains” (35). Additional algorithmic details can be found in the Appendix of reference (36). A visual diagram of these mathematical operations is shown in Figure 2.
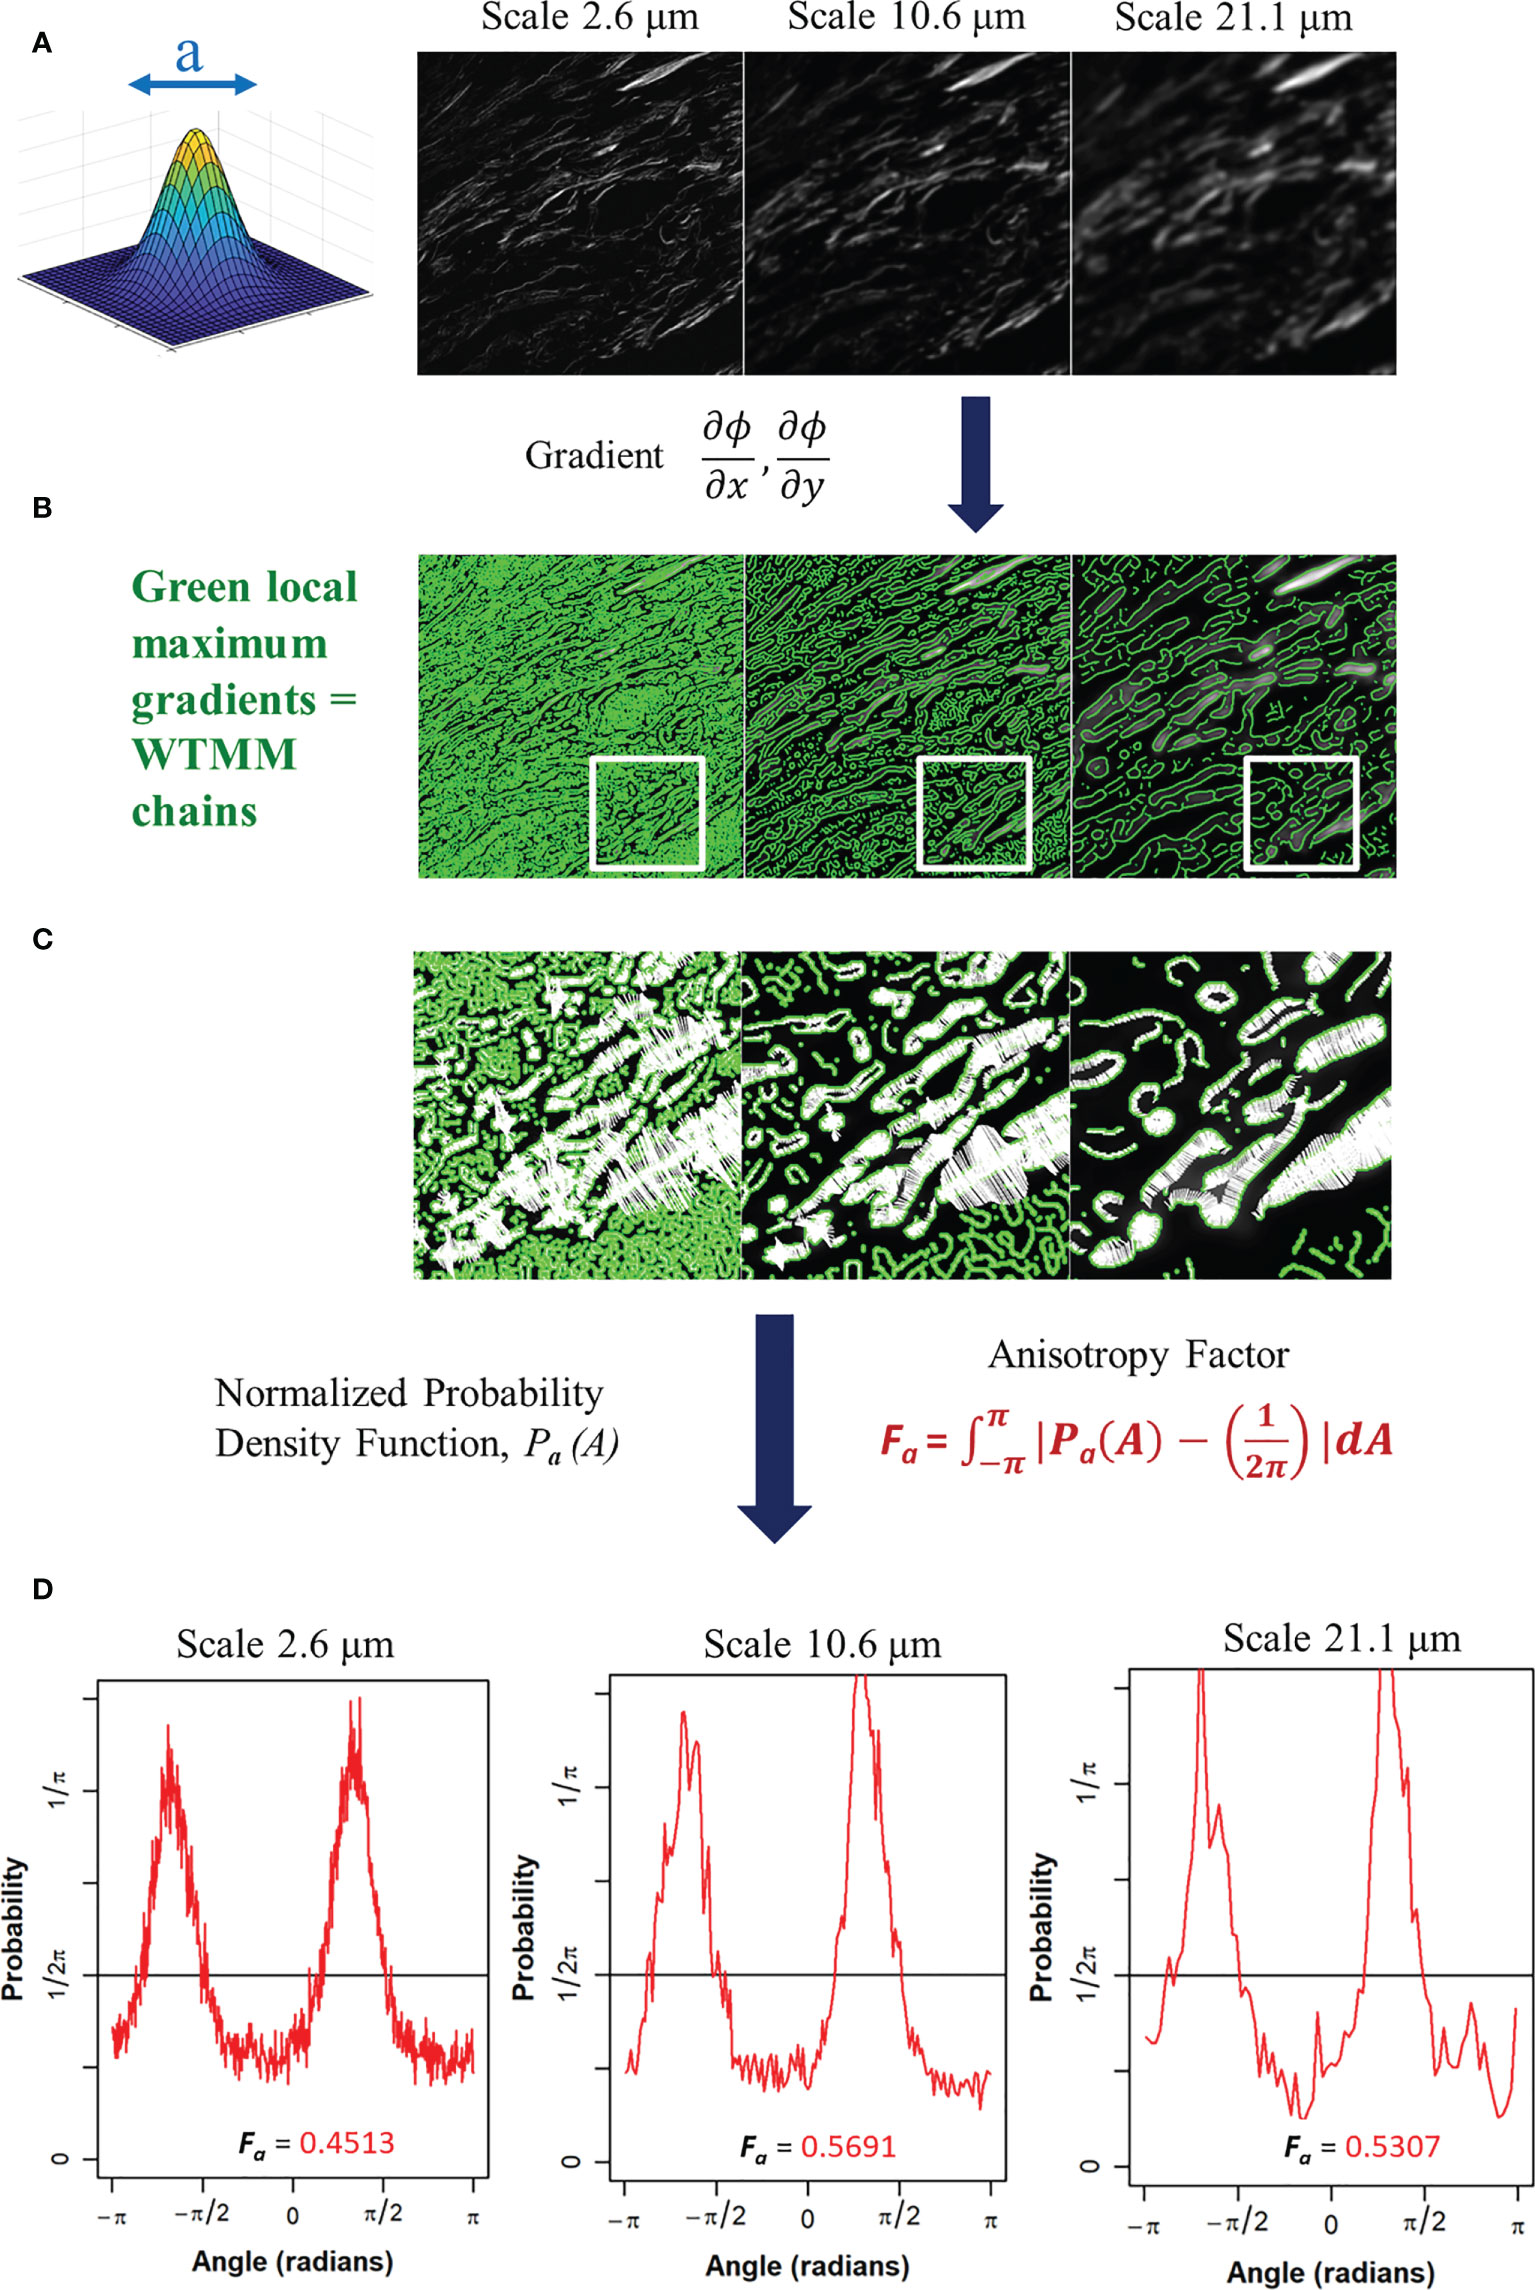
Figure 2 (A) Gaussian wavelet convolved SHG image at 3 representative wavelet size scales. (B) Maxima chains at 3 representative wavelet scales shown in green. (C) Zoomed inserts from white outlined area in panel B at 3 representative wavelet size scales to identify WTMM vectors (white arrows) showing magnitude and direction of local gradients of the maximum image density fluctuations. (D) Probability density functions (PDF), shown in red, of 3 representative wavelet scales generated from angles of local gradient vectors with the theoretical isotropic 1/2pi line shown in black. The anisotropy factor, Fa (Eq. 4), is shown for each PDF.
The angles from the WTMM chains are used to find the direction of changes in the image intensity. This allows for a definition of anisotropy based off the directional changes of image intensity across all size scales a. The angle distribution from the WTMM chains at each size scale are used to calculate probability density functions (PDFs), Pa(A), of the angles. A flat PDF indicates a perfectly isotropic image with random direction of intensity variations. Therefore, deviations from a flat PDF are indicative of intensity variations at preferential angles (anisotropy). Numerically, binning of the PDF is typically fixed to a single number of histogram bins (i.e. 64) at each size scale regardless of the total number of maxima chains (26). Here, there are significant differences in the number of maxima chains at each scale; therefore, a variable binning approach was developed and implemented. In this variable binning approach, each scale has a unique number of bins to ensure 100 maxima chains are in each bin. To generate a quantitative measurement from the wavelet-transformed image at each size scale we used the anisotropy factor, Fa where at each size scale a, the area between the curve of the image pdfs and a flat, , pdf is calculated:
A value of Fa = 0 represents pure isotropy and greater values represent more anisotropy where the theoretical upper limit is 2 (See Supplemental Data for Details). This process is also shown in Figure 2. This results in a quantitative representation of image anisotropy which in turn provides information on collagen morphology in this study.
For numerical calibration of isotropy, two variations of self-affined, scale invariant fractal images were used: Brownian motion surfaces and white noise images. Both are known to be theoretically isotropic, i.e., their pixel intensity gradients change randomly (37). Brownian motion (136) and white noise (136) images were generated using the Fourier filtering method (37) to be studied using the 2D WTMM anisotropy method.
The numerical calculations described in Sections 2.3 and 2.4 were performed using Xsmurf, a Tcl/Tk software package that runs C-based routines (github.com/pkestene/xsmurf). The statistical analyses were performed using the R package (38).
The white noise and Brownian motion surface image analysis was computed using the 2D WTMM anisotropy method described earlier. The images were analyze using fixed binning (64 bins) and variable binning (100 samples a bin) with the results shown in Figure 3. Variable binning causes significant changes in the pdf and anisotropy factor at small scales but causes minimal changes at larger scales (Figure 3C1-C4). Furthermore, the anisotropy factor vs wavelet scale is more stable with variable binning in both Brownian motion surface and White noise images which is ideal due to their known scale invariance (Figure 3D1-D3, zoomed inserts). Additionally, the white noise curves at all image size scales have a lower anisotropy factor than the Brownian motion surface images. The white noise curves also remain flat for a longer wavelet scale range suggesting more robust scale invariance.
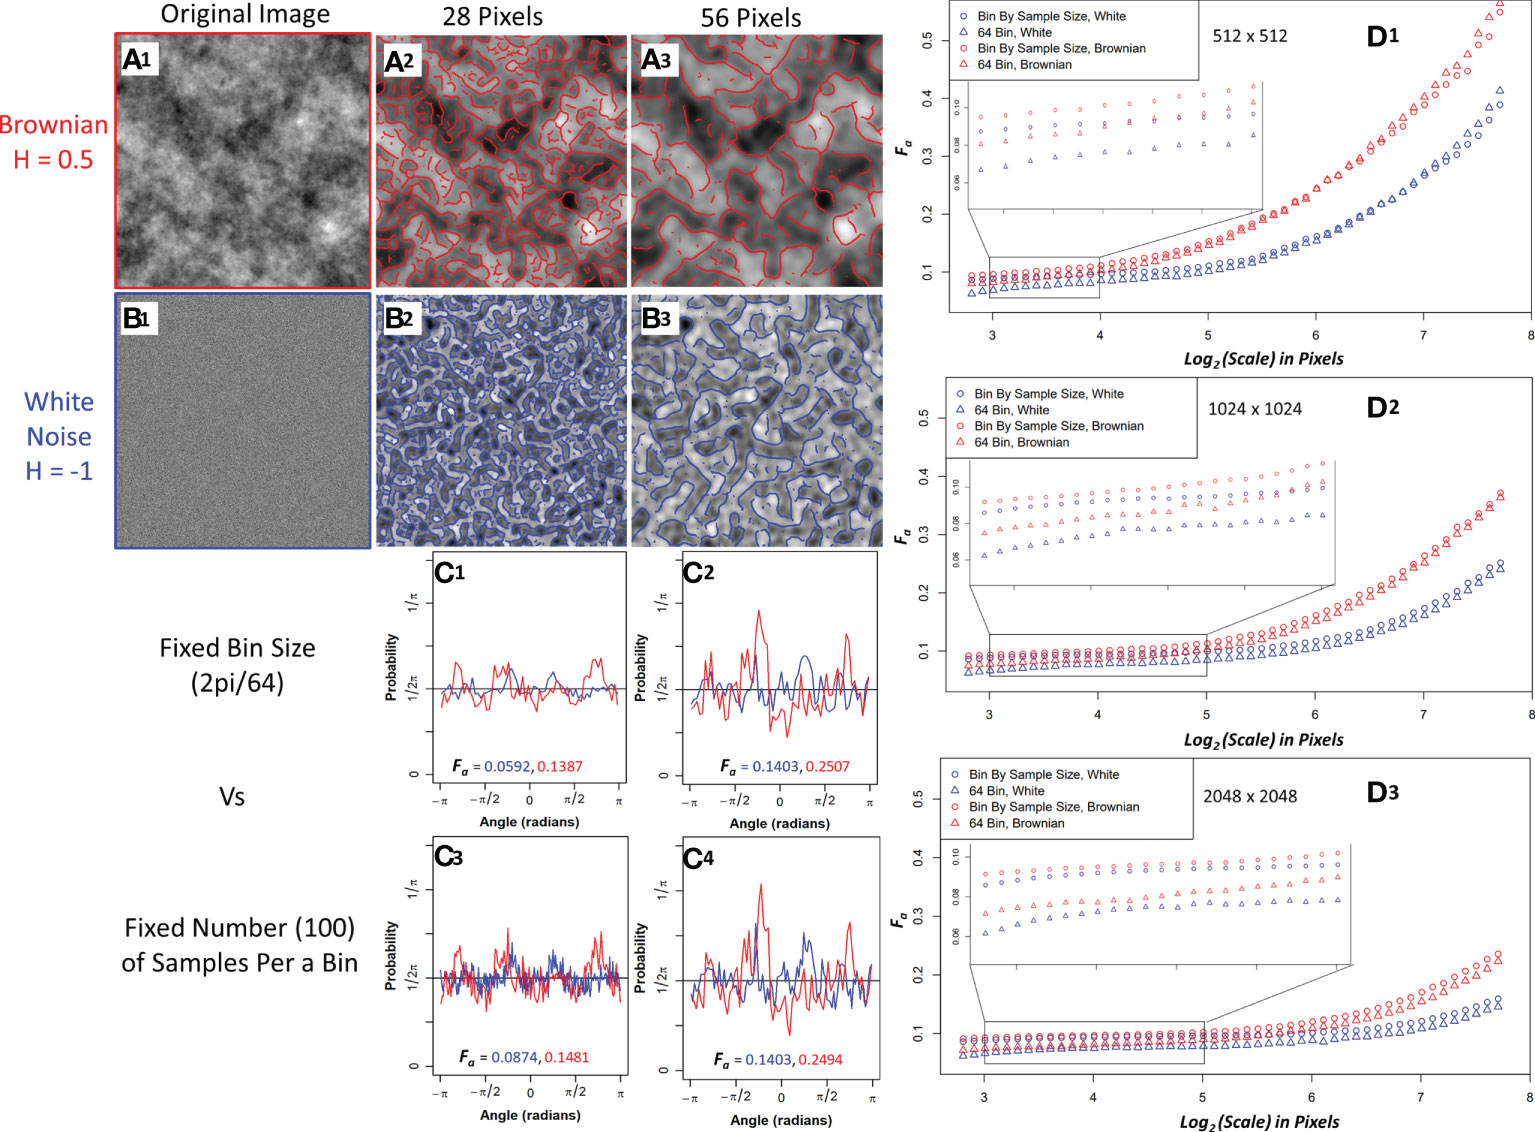
Figure 3 Sample Brownian image (A1) and sample white noise image (B1) convolved with a 28-pixel wavelet (A2, B2) and a 56-pixel wavelet (A3, B3) with maxima chains shown in red (Brownian) and blue (white noise). Probability density functions (PDF) with anisotropy factors from two representative size scales using 64 bins to generate the PDF (C1, C2) and fixing the number of samples (100) per a bin to generate the PDF (C3, C4). Brownian is shown in red and white noise in blue. Median anisotropy factor vs wavelet scale across 136 images for Brownian (red) and white noise (blue) 512 x 512-pixel images (D1), 1024 x 1024-pixel images (D2), and 2048 x 2048-pixel images (D3) with fixed 64 binning for anisotropy factor calculation (Triangle) and 100 samples per a bin calculation (Circle). Inset graph is a zoomed in view of anisotropy factor vs scale within the enclosed region.
To further investigate their differences, edge effects on both image types were assessed by calculating the wavelet transform on full 1024x1024 and 2048x2048 images and then only using the center 512x512 maxima chains for anisotropy analysis. White noise images had less anisotropy factor variability when compared to the actual 512x512 images than Brownian motion surface images, thus suggesting white noise images are more resistant to edge effects (Supplemental Figure 1). Variable binning was also found to improve the coefficient of variation in the anisotropy factor of white noise images at all size scales, with a significant improvement at smaller size scales (Supplemental Figure 2). Given the superiority of white noise and variable binning, the anisotropy factor of the pancreatic images were variably binned with white noise images used as the numerical isotropic control.
The new variable binned, white noise controlled, multi-scale anisotropy factor results of normal, normal adjacent, fibrosis, and cancer are plotted in Figure 4. There are significant differences in anisotropy factor values as can be seen between the cancer/fibrosis and normal/adjacent categories. Interestingly, at a wavelet scale of 21 µm all tissue types converge with only normal tissue diverging at larger scales.
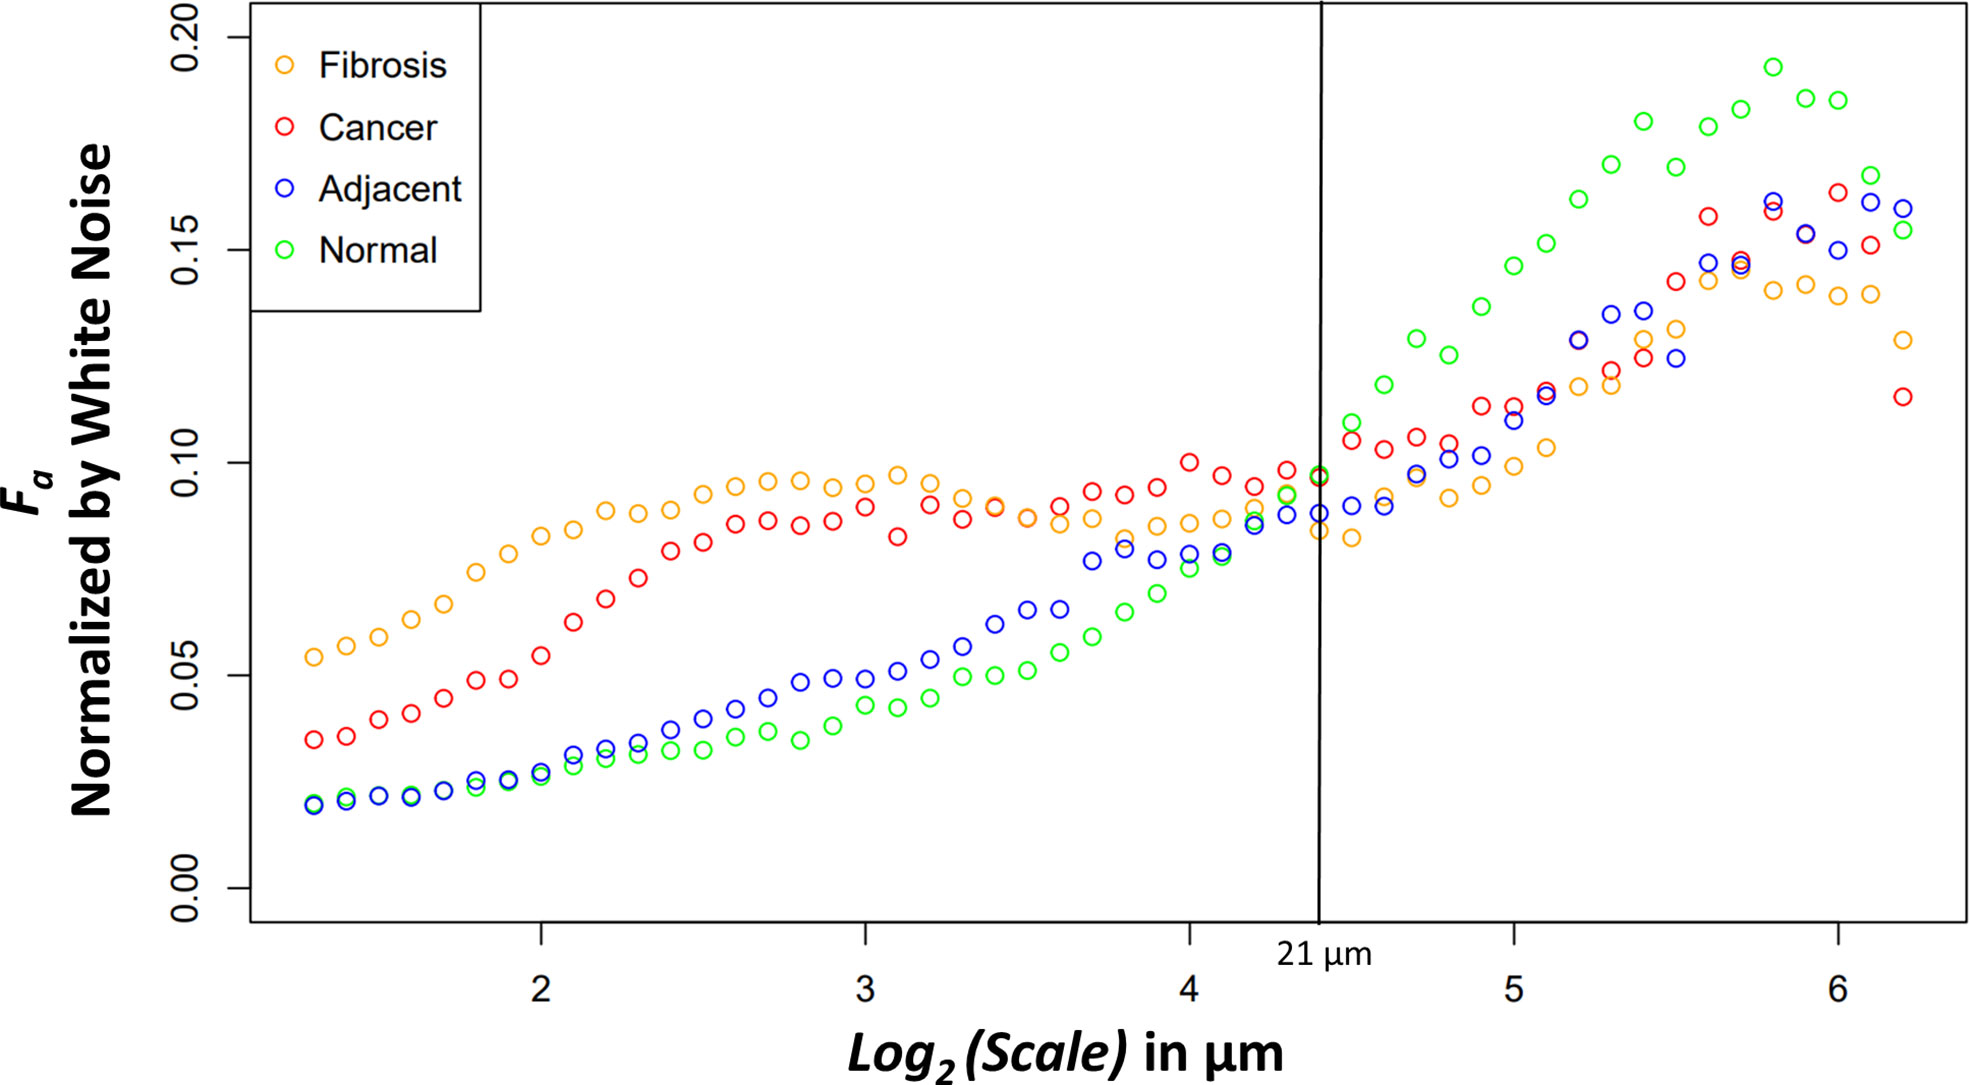
Figure 4 Median anisotropy factor across all images for fibrosis (orange), cancer (red), adjacent (blue), and normal (green) tissue normalized by white noise anisotropy factor from ~2.5 μm to 73.5 μm.
Four relevant pairwise comparisons are shown in Figure 5 with corresponding Wilcoxon ranked sum test. Cancer vs normal, shown in panel A, are statistically significantly different at all size scales other than the convergence wavelet range. At smaller size scales, before the cross over scale, cancer is more anisotropic and at larger size scales, after the cross over scale, the normal tissue is more anisotropic. In Panel B, the comparison between adjacent and cancer tissue can be seen where they are statistically significantly different at small wavelet size scales but are not at the larger wavelet size scales.
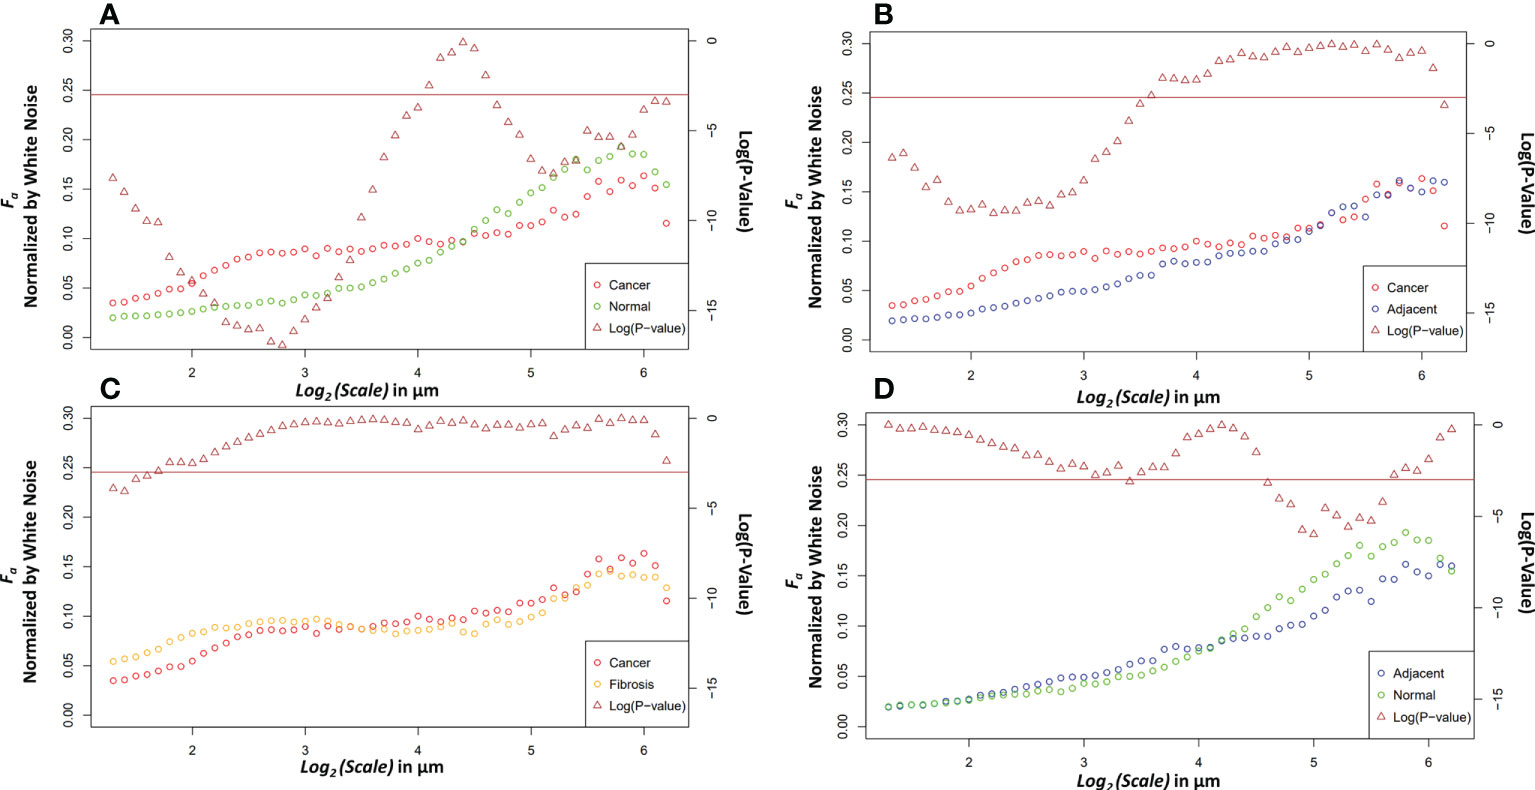
Figure 5 Pairwise comparisons of the median anisotropy factor across all images normalized by white noise anisotropy factor from ~2.5 μm to 73.5 μm (left y-axis) for cancer tissue vs. normal tissue (A), cancer tissue vs. adjacent tissue (B), cancer tissue vs. fibrotic tissue (C), and adjacent tissue vs. normal tissue (D). The p-values (right y-axis), shown in brown, from a Wilcoxon rank sum test ran at each scale between the tissue pair’s anisotropy factors. Values below the horizontal brown line at 0.05 show statistical significance.
The fibrosis and cancer are not statistically significantly different except at the first four wavelet size scales shown in panel C. In panel D, the normal tissue is more anisotropic than normal adjacent tissue at larger size scales but is not statistically significantly different at other size scales.
This paper shares improvements made to the 2D WTMM anisotropy method, and an exploration of the method applied to PDAC pathology slides. The method improvements help define isotropy vs. anisotropy within the 2D WTMM anisotropy method and better utilize the statistics at smaller scales through variable binning as demonstrated by the improvement in coefficient of variation. The statistical significance found between tissue labeled as cancerous or as normal by a pathologist demonstrate the future possible clinical applications of this label-free analysis method.
The 2D WTMM anisotropy method testing performed on the two scale invariant normalization candidates tell a clear story. In every test the white noise outperformed the Brownian motion surface images demonstrating white noise as the clear candidate for discrete numerical normalization of isotropy. This result follows the logic that can be derived about the image structure due to its generation. The Brownian motion surface images have large-scale sinusoidal patterns as they move from high to low pixel value areas in the image. The 2D WTMM anisotropy method at larger scales detects this large-scale sinusoidal pattern, which then results in the higher anisotropy factor than white noise. At smaller scales, the Brownian surface motion image could have pockets of pixels that seem more anisotropic from its gradual pixel value changes whereas white noise is isotropic at all scales.
The differences between the tissue types can elucidate information about ECM modification in both close and distant proximity from the tumor. The higher anisotropy of cancer at smaller scales could be caused through stellate cell over production of collagen and cancer cell mediated remodeling (39). At larger scales, after an interesting ~21 μm wavelet size crossover point, the larger anisotropy in healthy tissue suggests that the cancer has disrupted the overall normal large-scale organization of collagen fiber bundles. This observation is further supported by the adjacent normal tissue results. The cancer and adjacent normal tissue are different at smaller scales, but this statistical significance starts dissipating at a wavelet scale of ~12 μm. At larger size scales the adjacent tissue cannot be differentiated from cancer suggesting again a large-scale collagen disruption due to the cancer even in areas distant from those annotated as cancer by a pathologist. An important note when comparing normal and adjacent normal tissue is the lack of 3D spatial organization as this study was prospective and careful 3D mapping of pancreatic tissue processing was not performed. Therefore, it is plausible that a slide containing only normal tissue is near-adjacent to cancerous tissues in a manner similar to normal adjacent tissue on a slide annotated with both cancerous and normal tissue. Despite this possibility, there was statistical significance between normal adjacent and normal tissues at larger scales suggesting that collagen organization is disrupted near cancerous tissue. Finally, the comparison of fibrosis vs cancer only found slight statistical significance over the first four wavelet scales which range from ~2.4 μm to ~3.0 μm. This difference could be due to the straightness of the fibers in the fibrotic tissue. Otherwise, the overall trend of anisotropy factor vs scale matched between the two tissue types. This suggests that that there are minor differences in collagen structure between fibrosis and the cancer collagen. The pathologist labeled these tissue types using the gold standard, H&E histology, but it is highly subjective, and moreover, not highly sensitive to the collagen fibrillar aspects which seem to contain some valuable information regarding normal vs cancerous vs fibrotic tissue. Overall, this method demonstrates the ability to differentiate changes in collagen structure induced by PDAC using a continuous multiscale suite of information allowing for deeper analysis than other methods.
The image data supporting the conclusions of this article will be made available by the authors, without undue reservation.
Ethical review and approval was not required for the study on human participants in accordance with the local legislation and institutional requirements. Written informed consent for participation was not required for this study in accordance with the national legislation and the institutional requirements.
AB, TF, MJ, PB: clinical data acquisition. JH: image pre-processing. JH and AK: WTMM analysis. JH, KT, and AK: statistical analyses and figure preparation. JH, AB, PB, TF, KT, and AK: manuscript writing. All authors contributed to the article and approved the submitted version.
We acknowledge support from the Jane Bellino Cancer Research Fund, administered through the Maine Medical Center Philanthropy Department.
We are thankful to Dr. Thomas Gridley and all of the CompuMAINE Lab members for helpful technical discussions.
The authors declare that the research was conducted in the absence of any commercial or financial relationships that could be construed as a potential conflict of interest.
All claims expressed in this article are solely those of the authors and do not necessarily represent those of their affiliated organizations, or those of the publisher, the editors and the reviewers. Any product that may be evaluated in this article, or claim that may be made by its manufacturer, is not guaranteed or endorsed by the publisher.
The Supplementary Material for this article can be found online at: https://www.frontiersin.org/articles/10.3389/fonc.2022.991850/full#supplementary-material
1. Ilic M, Ilic I. Epidemiology of pancreatic cancer. World J Gastroenterol (2016) 22:9694–705. doi: 10.3748/wjg.v22.i44.96941
2. Saung MT, Zheng L. Current standards of chemotherapy for pancreatic cancer. Clin Ther (2017) 39:2125–34. doi: 10.1016/j.clinthera.2017.08.015
3. Ghosn M, Kourie HR, El Karak F, Hanna C, Antoun J, Nasr D. Optimum chemotherapy in the management of metastatic pancreatic cancer. World J Gastroenterol (2014) 20:2352–7. doi: 10.3748/wjg.v20.i9.2352
4. Liang C, Shi S, Meng Q, Liang D, Ji S, Zhang B, et al. Complex roles of the stroma in the intrinsic resistance to gemcitabine in pancreatic cancer: Where we are and where we are going. Exp Mol Med (2017) 49. doi: 10.1038/emm.2017.255
5. Zeng S, Pöttler M, Lan B, Grützmann R, Pilarsky C, Yang H. Chemoresistance in pancreatic cancer. Int J Mol Sci (2019) 20:1–19. doi: 10.3390/ijms20184504
6. Schmiechen ZC, Stromnes IM. Mechanisms governing immunotherapy resistance in pancreatic ductal adenocarcinoma. Front Immunol (2021) 11:613815. doi: 10.3389/fimmu.2020.613815
7. Hu JX, Lin YY, Zhao CF, Chen WB, Liu QC, Li QW, et al. Pancreatic cancer: A review of epidemiology, trend, and risk factors. World J Gastroenterol (2021) 27:4298–321. doi: 10.3748/wjg.v27.i27.4298
8. Ho CK, Kleeff J, Friess H, Büchler MW. Complications of pancreatic surgery. Hpb (2005) 7:99–108. doi: 10.1080/13651820510028936
9. Zhang L, Sanagapalli S, Stoita A. Challenges in diagnosis of pancreatic cancer. World J Gastroenterol (2018) 24:2047–60. doi: 10.3748/wjg.v24.i19.2047
10. Sunami Y, Häußler J, Klee J. Cellular heterogeneity of pancreatic stellate cells, mesenchymal stem cells, and cancer-associated fibroblasts in pancreatic cancer. Cancers (Basel) (2020) 12:1–15. doi: 10.3390/cancers12123770
11. Costa A, Kieffer Y, Scholer-Dahirel A, Pelon F, Bourachot B, Cardon M, et al. Fibroblast heterogeneity and immunosuppressive environment in human breast cancer. Cancer Cell (2018) 33:463–479.e10. doi: 10.1016/j.ccell.2018.01.011
12. Helms E, Onate MK, Sherman MH. Fibroblast heterogeneity in the pancreatic tumor microenvironment. Cancer Discov (2020) 10:648–56. doi: 10.1158/2159-8290.CD-19-1353
13. Piersma B, Hayward MK, Weaver VM. Fibrosis and cancer: A strained relationship. Biochim Biophys Acta - Rev Cancer (2020) 1873:188356. doi: 10.1016/j.bbcan.2020.188356
14. Özdemir BC, Pentcheva-Hoang T, Carstens JL, Zheng X, Wu CC, Simpson TR, et al. Depletion of carcinoma-associated fibroblasts and fibrosis induces immunosuppression and accelerates pancreas cancer with reduced survival. Cancer Cell (2014) 25:719–34. doi: 10.1016/j.ccr.2014.04.005
15. Perez VM, Kearney JF, Yeh JJ. The PDAC extracellular matrix: A review of the ECM protein composition, tumor cell interaction, and therapeutic strategies. Front Oncol (2021) 11:751311. doi: 10.3389/fonc.2021.751311
16. Drifka CR, Tod J, Loeffler AG, Liu Y, Thomas GJ, Eliceiri KW, et al. Periductal stromal collagen topology of pancreatic ductal adenocarcinoma differs from that of normal and chronic pancreatitis. Mod Pathol (2015) 28:1470–80. doi: 10.1038/modpathol.2015.97
17. Drifka CR, Loeffler AG, Mathewson K, Keikhosravi A, Eickhoff JC, Liu Y, et al. Highly aligned stromal collagen is a negative prognostic factor following pancreatic ductal adenocarcinoma resection. Oncotarget (2016) 7:76197–213. doi: 10.18632/oncotarget.12772
18. Drifka CR, Loeffler AG, Esquibel CR, Weber SM, Eliceiri KW, Kao WJ. Human pancreatic stellate cells modulate 3D collagen alignment to promote the migration of pancreatic ductal adenocarcinoma cells. BioMed Microdev (2016) 18:1–10. doi: 10.1007/s10544-016-0128-1
19. Murphy KJ, Chambers CR, Herrmann D, Timpson P, Pereira BA. Dynamic stromal alterations influence tumor-stroma crosstalk to promote pancreatic cancer and treatment resistance. Cancers (Basel) (2021) 13:1–22. doi: 10.3390/cancers13143481
20. Natal R de A, Adur J, Cesar CL, Vassallo J. Tumor extracellular matrix: lessons from the second-harmonic generation microscopy. Surg Exp Pathol (2021) 4:1–8. doi: 10.1186/s42047-021-00089-0
21. James DS, Campagnola PJ. Recent advancements in optical harmonic generation microscopy: Applications and perspectives. BME Front (2021) 2021:1–24. doi: 10.34133/2021/3973857
22. Rueden CT, Conklin MW, Provenzano PP, Keely PJ, Eliceiri KW. (2009). Nonlinear optical microscopy and computational analysis of intrinsic signatures in breast cancer, in: Proc 31st Annu Int Conf IEEE Eng Med Biol Soc Eng Futur Biomed EMBC 2009, (IEEE). pp. 4077–80. doi: 10.1109/IEMBS.2009.5334523
23. Bredfeldt JS, Liu Y, Conklin MW, Keely PJ, Mackie TR, Eliceiri KW. Automated quantification of aligned collagen for human breast carcinoma prognosis. J Pathol Inform (2014) 5:28. doi: 10.4103/2153-3539.139707
24. Campbell KR, Wen B, Shelton EM, Swader R, Cox BL, Eliceiri K, et al. 3D second harmonic generation imaging tomography by multi-view excitation. Optica (2017) 4:1171. doi: 10.1364/optica.4.001171
25. Parodi V, Jacchetti E, Osellame R, Cerullo G, Polli D, Raimondi MT. Nonlinear optical microscopy: From fundamentals to applications in live bioimaging. Front Bioeng Biotechnol (2020) 8:585363. doi: 10.3389/fbioe.2020.585363
26. Tilbury K, Han X, Brooks PC, Khalil A. Multiscale anisotropy analysis of second-harmonic generation collagen imaging of mouse skin. J BioMed Opt (2021) 26:1–19. doi: 10.1117/1.jbo.26.6.065002
27. Khalil A, Joncas G, Nekka F, Kestener P, Arneodo A. Morphological analysis of h i features. II. wavelet-based multifractal formalism. Astrophys J Suppl Ser (2006) 165:512–50. doi: 10.1086/505144
28. Snow CJ, Goody M, Kelly MW, Oster EC, Jones R, Khalil A, et al. Time-lapse analysis and mathematical characterization elucidate novel mechanisms underlying muscle morphogenesis. PloS Genet (2008) 4(10):6–17. doi: 10.1371/journal.pgen.1000219
29. Snow CJ, Peterson MT, Khalil A, Henry CA. Muscle development is disrupted in zebrafish embryos deficient for fibronectin. Dev Dyn (2008) 237:2542–53. doi: 10.1002/dvdy.21670
30. Goody MF, Kelly MW, Lessard KN, Khalil A, Henry CA. Nrk2b-mediated NAD+ production regulates cell adhesion and is required for muscle morphogenesis in vivo. Nrk2b and NAD+ in muscle morphogenesis. Dev Biol (2010) 344:809–26. doi: 10.1016/j.ydbio.2010.05.513
31. Goody MF, Kelly MW, Reynolds CJ, Khalil A, Crawford BD, Henry CA. NAD+ biosynthesis ameliorates a zebrafish model of muscular dystrophy. PloS Biol (2012) 10(10):3–15. doi: 10.1371/journal.pbio.1001409
32. Bailey E, Alrowaished S, Kilroy E, Crooks E, Drinkert D, Karunasiri C, et al. NAD+ improves neuromuscular development in a zebrafish model of FKRPassociated dystroglycanopathy. Skelet Muscle (2019) 9:5–20. doi: 10.1186/s13395-019-0206-1
33. Khalil A, Aponte C, Zhang R, Davisson T, Dickey I, Engelman D, et al. Image analysis of soft-tissue in-growth and attachment into highly porous alumina ceramic foam metals. Med Eng Phys (2009) 31:775–83. doi: 10.1016/j.medengphy.2009.02.007
34. Harling M, Juybari J, Johnson CP, Townsend KL, Khalil A, Tilbury K. Wavelet-based characterization of the spatial relationship of nerve and collagen in neuropathic adipose tissue. Proc SPIE 11245 Three-Dimens Multidimens Microsc Image Acquis Process (2020). doi: 10.1117/12.2546918
35. Khalil A, Grant JL, Caddle LB, Atzema E, Mills KD, Arneodo A. Chromosome territories have a highly nonspherical morphology and nonrandom positioning. Chromosom Res (2007) 15:899–916. doi: 10.1007/s10577-007-1172-8
36. McAteer RTJ, Kestener P, Arneodo A, Khalil A. Automated detection of coronal loops using a wavelet transform modulus maxima method. Sol Phys (2010) 262:387–97. doi: 10.1007/s11207-010-9530-7
37. Mandelbrot BB, van Ness JW. Fractional Brownian motions, fractional noises and applications. Review (1968) 10(4):422–37. doi: 10.1137/1010093
38. R Core Team. R: A language and environment for statistical computing. Vienna, Austria: R Foundation for Statistical Computing (2021). Available at: https://www.R-project.org/.
Keywords: anisotropy, second-harmonic generation (SHG), pancreatic cancer, wavelets, tumor micro environment
Citation: Hamilton J, Breggia A, Fitzgerald TL, Jones MA, Brooks PC, Tilbury K and Khalil A (2022) Multiscale anisotropy analysis of second-harmonic generation collagen imaging of human pancreatic cancer. Front. Oncol. 12:991850. doi: 10.3389/fonc.2022.991850
Received: 12 July 2022; Accepted: 23 September 2022;
Published: 18 October 2022.
Edited by:
Liron Pantanowitz, University of Michigan, United StatesCopyright © 2022 Hamilton, Breggia, Fitzgerald, Jones, Brooks, Tilbury and Khalil. This is an open-access article distributed under the terms of the Creative Commons Attribution License (CC BY). The use, distribution or reproduction in other forums is permitted, provided the original author(s) and the copyright owner(s) are credited and that the original publication in this journal is cited, in accordance with accepted academic practice. No use, distribution or reproduction is permitted which does not comply with these terms.
*Correspondence: Andre Khalil, YW5kcmUua2hhbGlsQG1haW5lLmVkdQ==; Karissa Tilbury, a2FyaXNzYS50aWxidXJ5QG1haW5lLmVkdQ==
Disclaimer: All claims expressed in this article are solely those of the authors and do not necessarily represent those of their affiliated organizations, or those of the publisher, the editors and the reviewers. Any product that may be evaluated in this article or claim that may be made by its manufacturer is not guaranteed or endorsed by the publisher.
Research integrity at Frontiers
Learn more about the work of our research integrity team to safeguard the quality of each article we publish.