- 1Department of Cardiovascular Surgery, Union Hospital, Tongji Medical College, Huazhong University of Science and Technology, Wuhan, China
- 2Department of Thoracic Surgery, Union Hospital, Tongji Medical College, Huazhong University of Science and Technology, Wuhan, China
- 3Key Laboratory for Molecular Diagnosis of Hubei Province, The Central Hospital of Wuhan, Tongji Medical College, Huazhong University of Science and Technology, Wuhan, China
The roles and mechanisms of T-cell receptor (TCR)-associated transmembrane adaptor 1 (TRAT1) in lung adenocarcinoma (LAC) have not yet been reported in the relevant literature. Therefore, this study aimed to understand the roles and mechanisms of TRAT1 in LAC using bioinformatics and in vitro experiments. TRAT1 expression levels in LAC samples were analysed using various databases. TRAT1 co-expressed genes were acquired by the correlation analysis of LAC tissues. The functional mechanisms and protein network of TRAT1 co-expressed genes were analysed using bioinformatics analysis. The expression of TRAT1 was activated in LAC cells, and the roles of TRAT1 overexpression in the growth and migration of cancer cells was investigated using flow cytometry, Cell Counting Kit-8 (CCK-8), and migration and invasion assays. The relationship between TRAT1 overexpression, the immune microenvironment, and RNA modification was evaluated using correlation analysis. TRAT1 expression levels were significantly abnormal at multiple mutation sites and were related to the prognosis of LAC. TRAT1 co-expressed genes were involved in cell proliferation, adhesion, and differentiation, and TRAT1 overexpression significantly inhibited cell viability, migration, and invasion and promoted apoptosis of A549 and H1299 cells, which might be related to the TCR, B cell receptor (BCR), MAPK, and other pathways. TRAT1 expression levels were significantly correlated with the ESTIMATE, immune, and stromal scores in the LAC microenvironment. Additionally, TRAT1 expression levels were significantly correlated with the populations of B cells, CD8 T cells, cytotoxic cells, and other immune cells. TRAT1 overexpression was significantly correlated with the expression of immune cell markers (such as PDCD1, CD2, CD3E) and genes involved in RNA modification (such as ALKBH1, ALKBH3, ALKBH5). In conclusions, TRAT1 overexpression inhibited the growth and migration of LAC cells, thereby delaying cancer progression, and was correlated with the LAC microenvironment and RNA modifications.
Introduction
Lung adenocarcinoma (LAC) is a common subtype of non-small cell lung cancer (NSCLC) (1–3). At present, most patients with early LAC achieve better survival after surgical treatment (4). However, the long-term prognosis of patients with advanced LAC after surgical treatment remains poor. Some genes, microRNAs (miRNAs), and long noncoding RNAs (lncRNAs) play crucial roles in the occurrence of LAC (5–9). For example, the lncRNA LINC00319 is overexpressed in LAC tissues and cells. However, the prognosis of patients with LAC showing significantly elevated expression levels of LINC00319 is dismal. Inhibition of LINC00319 expression inhibits the growth of LAC cells in vitro. LINC00319 promotes LAC progression by regulating the miR-450b-5p/EZH2 signalling pathway (6). Additionally, the lncRNA RAET1K is significantly upregulated in LAC tissues and correlates with poor prognosis in patients with LAC. RAET1K affects cell cycle, causing G1/S arrest via the miR-135a-5p/CCNE1 signalling mechanism and subsequently participates in the regulation of LAC progression (7). Similarly, RHPN2 is also overexpressed in the LAC tissues. High expression levels of RHPN2 are associated with a poor prognosis in patients with LAC and promote LAC cell growth and migration (9).
T cell receptor (TCR)-associated transmembrane adaptor 1 (TRAT1) is one of the hub regulatory genes of TCR and is associated with cancer progression (10–12). For example, IL-4 can trigger IL-17-producing CD8 T cell (Tc17) cytotoxicity and induce cell proliferation. IL-4/AKT signalling drives the upregulation of TRAT1 expression in Tc17 cells to stabilize the TCR and enhance Tc17 cytotoxicity (11). A risk model based on five immune response-related genes, TRAT1, IL2RB, CTLA4, IGHM, and IL21R, can predict the prognosis of patients with breast cancer (12). Our previous results published in the journal of Current Medical Science showed that the expression level of TRAT1 was significantly decreased in NSCLC, LAC, and lung squamous cell carcinoma (LUSC). Decreased expression levels of TRAT1 are associated with poor prognosis in patients with NSCLC, LAC, and LUSC and are associated with smoking, clinical stage, histological subtype, and lymph node metastasis in patients with LAC. Based on these findings, we aimed to explore the roles and mechanisms of TRAT1 in the progression of LAC using a comprehensive analysis in this study. Activation of TRAT1 expression in LAC cells resulted in the identification of the effects of TRAT1 overexpression on LAC cell proliferation, migration, and invasion, and the relationship between TRAT1 overexpression, LAC immune microenvironment, and RNA modifications was investigated to assess the role of TRAT1 in LAC progression.
Materials and methods
cBioPortal database
The cBioPortal (http://www.cbioportal.org/index.do) database contains cancer- and immune-related data from multiple research centres. Data on LAC tissues obtained from the cBioPortal database was used to explore the relationship between TRAT1 expression, LAC mutation sites, and the clinicopathological characteristics of patients with LAC. Additionally, the relationship between TRAT1 expression and LAC immunity was explored using data from the MSK LAC cellular immunity.
Identification of TRAT1 expression at mutation sites in patients with LAC
The muTarget (https://www.mutarget.com/) database is used for cancer biomarker discovery. In the muTarget database, we used the following screening parameters: target-TRAT1, cancer type-LAC, and mutation rate >1%, to explore the expression levels of TRAT1 at the mutation sites of patients with LAC.
Biological functions, mechanisms, and protein-protein interaction (PPI) network of TRAT1 strongly co-expressed genes
TRAT1 co-expressed genes in 535 LAC tissues from The Cancer Genome Atlas (TCGA) database were identified using a correlation analysis. Genes were identified to be strongly co-expressed when the correlation coefficient r > 0.4 or < −0.4 and P < 0.001, as described in the literature (13, 14). The biological process, molecular function, and cellular composition of TRAT1 strongly co-expressed genes were explored using the gene ontology (GO) annotation and adjusted P < 0.05 as the standard of significance. The signalling mechanisms associated with the strongly co-expressed genes of TRAT1 were investigated using the Kyoto Encyclopedia of Genes and Genomes (KEGG) analysis (14). The PPI network of TRAT1 strongly co-expressed genes was constructed using the STRING database and further visualized using Cytoscape software.
Cell culture and construction of TRAT1 overexpression cell lines
A549 and H1299 cell lines were obtained from the Shanghai Institute of Biochemistry and Cell Biology (Shanghai, China) and were cultured in Dulbecco’s modified Eagle’s medium (DMEM) (Thermo Fisher Scientific, USA) supplemented with 10% foetal bovine serum (FBS) (Thermo Fisher Scientific, USA) at 37°C in an incubator with 5% CO2. The pCDNA3.1(-) TRAT1 expression vector and pCDNA3.1(-) control vector were synthesized by Tianyi Huiyuan (China). A549 and H1299 cells were cultured in 6-well plates at a suitable density for 24 h in an incubator and then transfected with TRAT1 overexpression and control vectors using Lipofectamine 3000 (Thermo Fisher Scientific, USA) for 24 h. TRAT1 overexpression was confirmed in the established cell models of LAC by RT-PCR and western blotting.
Identification of cell models of LAC via the RT-PCR
TRIzol was used to isolate total RNA from LAC cells, and total RNA was reverse transcribed into cDNA using the Revertra Ace qPCR RT Kit (Toyobo Life Science, Japan). UltraSYBR mixture (CWBio) was used to perform the PCR cycles on ABI Stepone Plus (Thermo Fisher Scientific, USA). Changes in the relative TRAT1 mRNA expression levels were calculated by the 2^ΔΔct method. The primer sequences used for TRAT1 and β-actin were as follows: TRAT1 forward: 5′-ACAAATGAAAGCCCGACCAG-3′ and reverse: 5′-ATCAAGTGAGGCGTAGCACA-3′; β-actin forward 5’-ACTCTTCCAGCCTTCCTTCC-3’ and reverse 5’-CGTCATACTCCTGCTTGCTG-3’.
Western blotting
In well-grown transfected A549 and H1299 cells, each group of A549 and H1299 cells were lysed using a lysis buffer (Beyotime, China) and protein quantification was performed by bicinchoninic acid (BCA) method (Beyotime, China). Total protein of 30 µg was used for protein gel electrophoresis, followed by TRAT1 antibody (1:1000) (Univ, China) incubation and secondary antibody (Univ, China) (1:5000) incubation. These steps were followed by membrane washing and exposure to determine TRAT1 protein expression.
Detection of proliferation and apoptosis of LAC cells
Cells were plated in 96-well plates at a density of 5 × 10³ cells/well. Following 24 h of incubation, the cells were transfected with pCDNA3.1(-) TRAT1 expression vector and pCDNA3.1(-) control vector for 24, 48, and 72 h, followed by the addition of 10 μl Cell Counting Kit-8 (CCK-8) solution to each well. Absorbance was measured at 450 nm using an EnSpire multimode plate reader, and the optical density (OD) was calculated for the cell viability assay. Cell apoptosis was analysed using the phycoerythrin (PE) Annexin V Apoptosis Detection Kit І (BD Biosciences). Cells were seeded in 6-well plates, transfected for 24 h, and stained according to the manufacturer’s instructions. Apoptotic cells were immediately detected using the FACS Caliber II Sorter and the Cell Quest FACS system (BD Biosciences, USA). Data were analysed using the FlowJo software (version 7.6.5).
Detection of migration and invasion of LAC cells
The cells were cultured in 12-well plates. A clean pipette tip was used to inflict a ‘wound’ when cells formed a confluent monolayer, and the cells cultured in DMEM were supplemented with 2% FBS. The cells were then transfected and images of the wound margins were captured using an optical light microscope (Olympus Corporation, Japan) at 0 h time point. Following incubation for 24 h, images of the same region of cells were captured for measurement. The wound healing rate was calculated using the following formula: The cells were subjected to a Transwell assay (Transwell system; Corning, USA) after transfection. The basolateral chamber was balanced with 600 ml of DMEM supplemented with 10% FBS, and 200 ml of A549 and H1299 cell suspensions were added to the apical chamber in FBS-free DMEM. After culturing the cells for 24 h at 37°C with 5% CO2, the transwell chambers were fixed with 5% paraformaldehyde for 15 min and then stained with 0.1% crystal violet for 10 min according to the manufacturer’s protocol. Transmembrane cells were observed under an inverted fluorescence microscope.
Identification of the relationship between TRAT1 expression and immune microenvironment
The ESTIMATE, immune and stromal scores, and the populations of immune-infiltrating cells in 535 LAC tissues were calculated using single sample gene set enrichment analysis (ssGSEA) and an ESTIMATE algorithm. Correlation analysis was used to explore the relationship between TRAT1 expression and the ESTIMATE, immune and stromal scores, and immune-infiltrating cells. The ESTIMATE, immune and stromal scores, and the populations of immune infiltrating cells in the high- and low-TRAT1 expression groups were identified and grouped based on the median value of TRAT1 expression. In the Kaplan–Meier (K–M) plotter (http://kmplot.com/analysis/) database, the relationship between high- and low-TRAT1 expression levels and the prognosis-related immune cells of patients with LAC was explored using the K–M survival analysis and grouped by the median value of TRAT1 expression.
Identification of the relationship between TRAT1 expression and immune cell markers and RNA modifications
The expression data of immune cell markers in the LAC tissues were extracted (15). Correlation analysis was used to explore the relationship between TRAT1 expression and the levels of immune-infiltrating cell markers in LAC tissues. The expression levels of LAC immune-infiltrating cell markers in the high- and low-TRAT1 expression groups were evaluated based on the median value of TRAT1 expression. Additionally, the relationship between TRAT1 expression levels and N6-methyladenosine (m6A)-, N1-methyladenosine (m1A)-, and 5-methylcytosine (m5C)-regulated genes was evaluated using correlation analysis.
Statistical analysis
The expression levels of TRAT1 in the LAC cell models were analysed using the t-test. The relationship between the expression levels of TRAT1 and the immune microenvironment was analysed using a correlation analysis. Statistical significance was set at P < 0.05.
Results
Clinical values of TRAT1 expression level in LAC
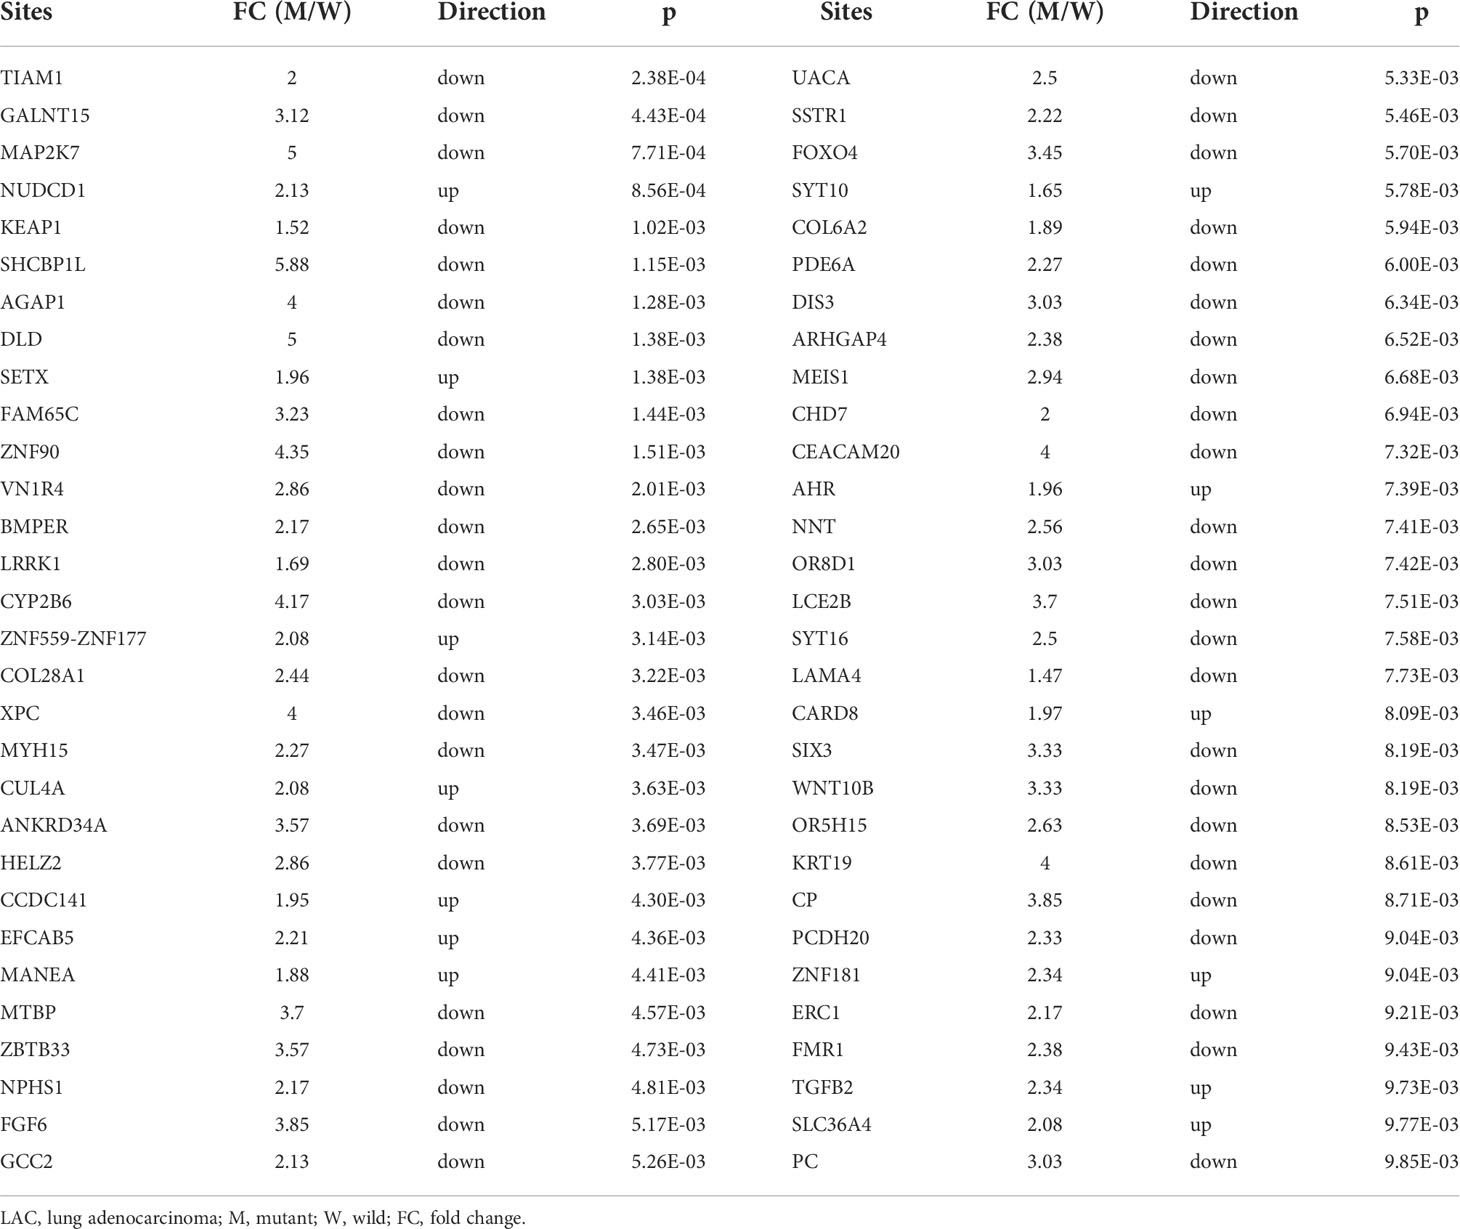
We previously found that TRAT1 expression was significantly decreased, which was associated with dismal prognosis in NSCLC. In this study, the TRAT1 expression was related to overall survival (OS), progression-free survival (PFS), smoking history, forced expiratory volume in 1 s (FEV1), and other clinical characteristics of patients with LAC in the cBioPortal database (Figure S1). The relationship between TRAT1 expression levels and PD-L1 expression, tumour mutational burden (TMB), response efficacy, and other immune characteristics in LAC cells was also obtained from the cBioPortal database (Figure 1). In the muTarget database, TRAT1 expression levels were significantly elevated at NUDCD1, SETX, CUL4A, and other gene mutation sites, and were significantly decreased at TIAM1, GALNT15, MAP2K7, and other gene mutation sites (Table 1 and Figure 2), which preliminarily suggested that TRAT1 has an important prognostic role and might be a prognostic biomarker in patients with LAC.
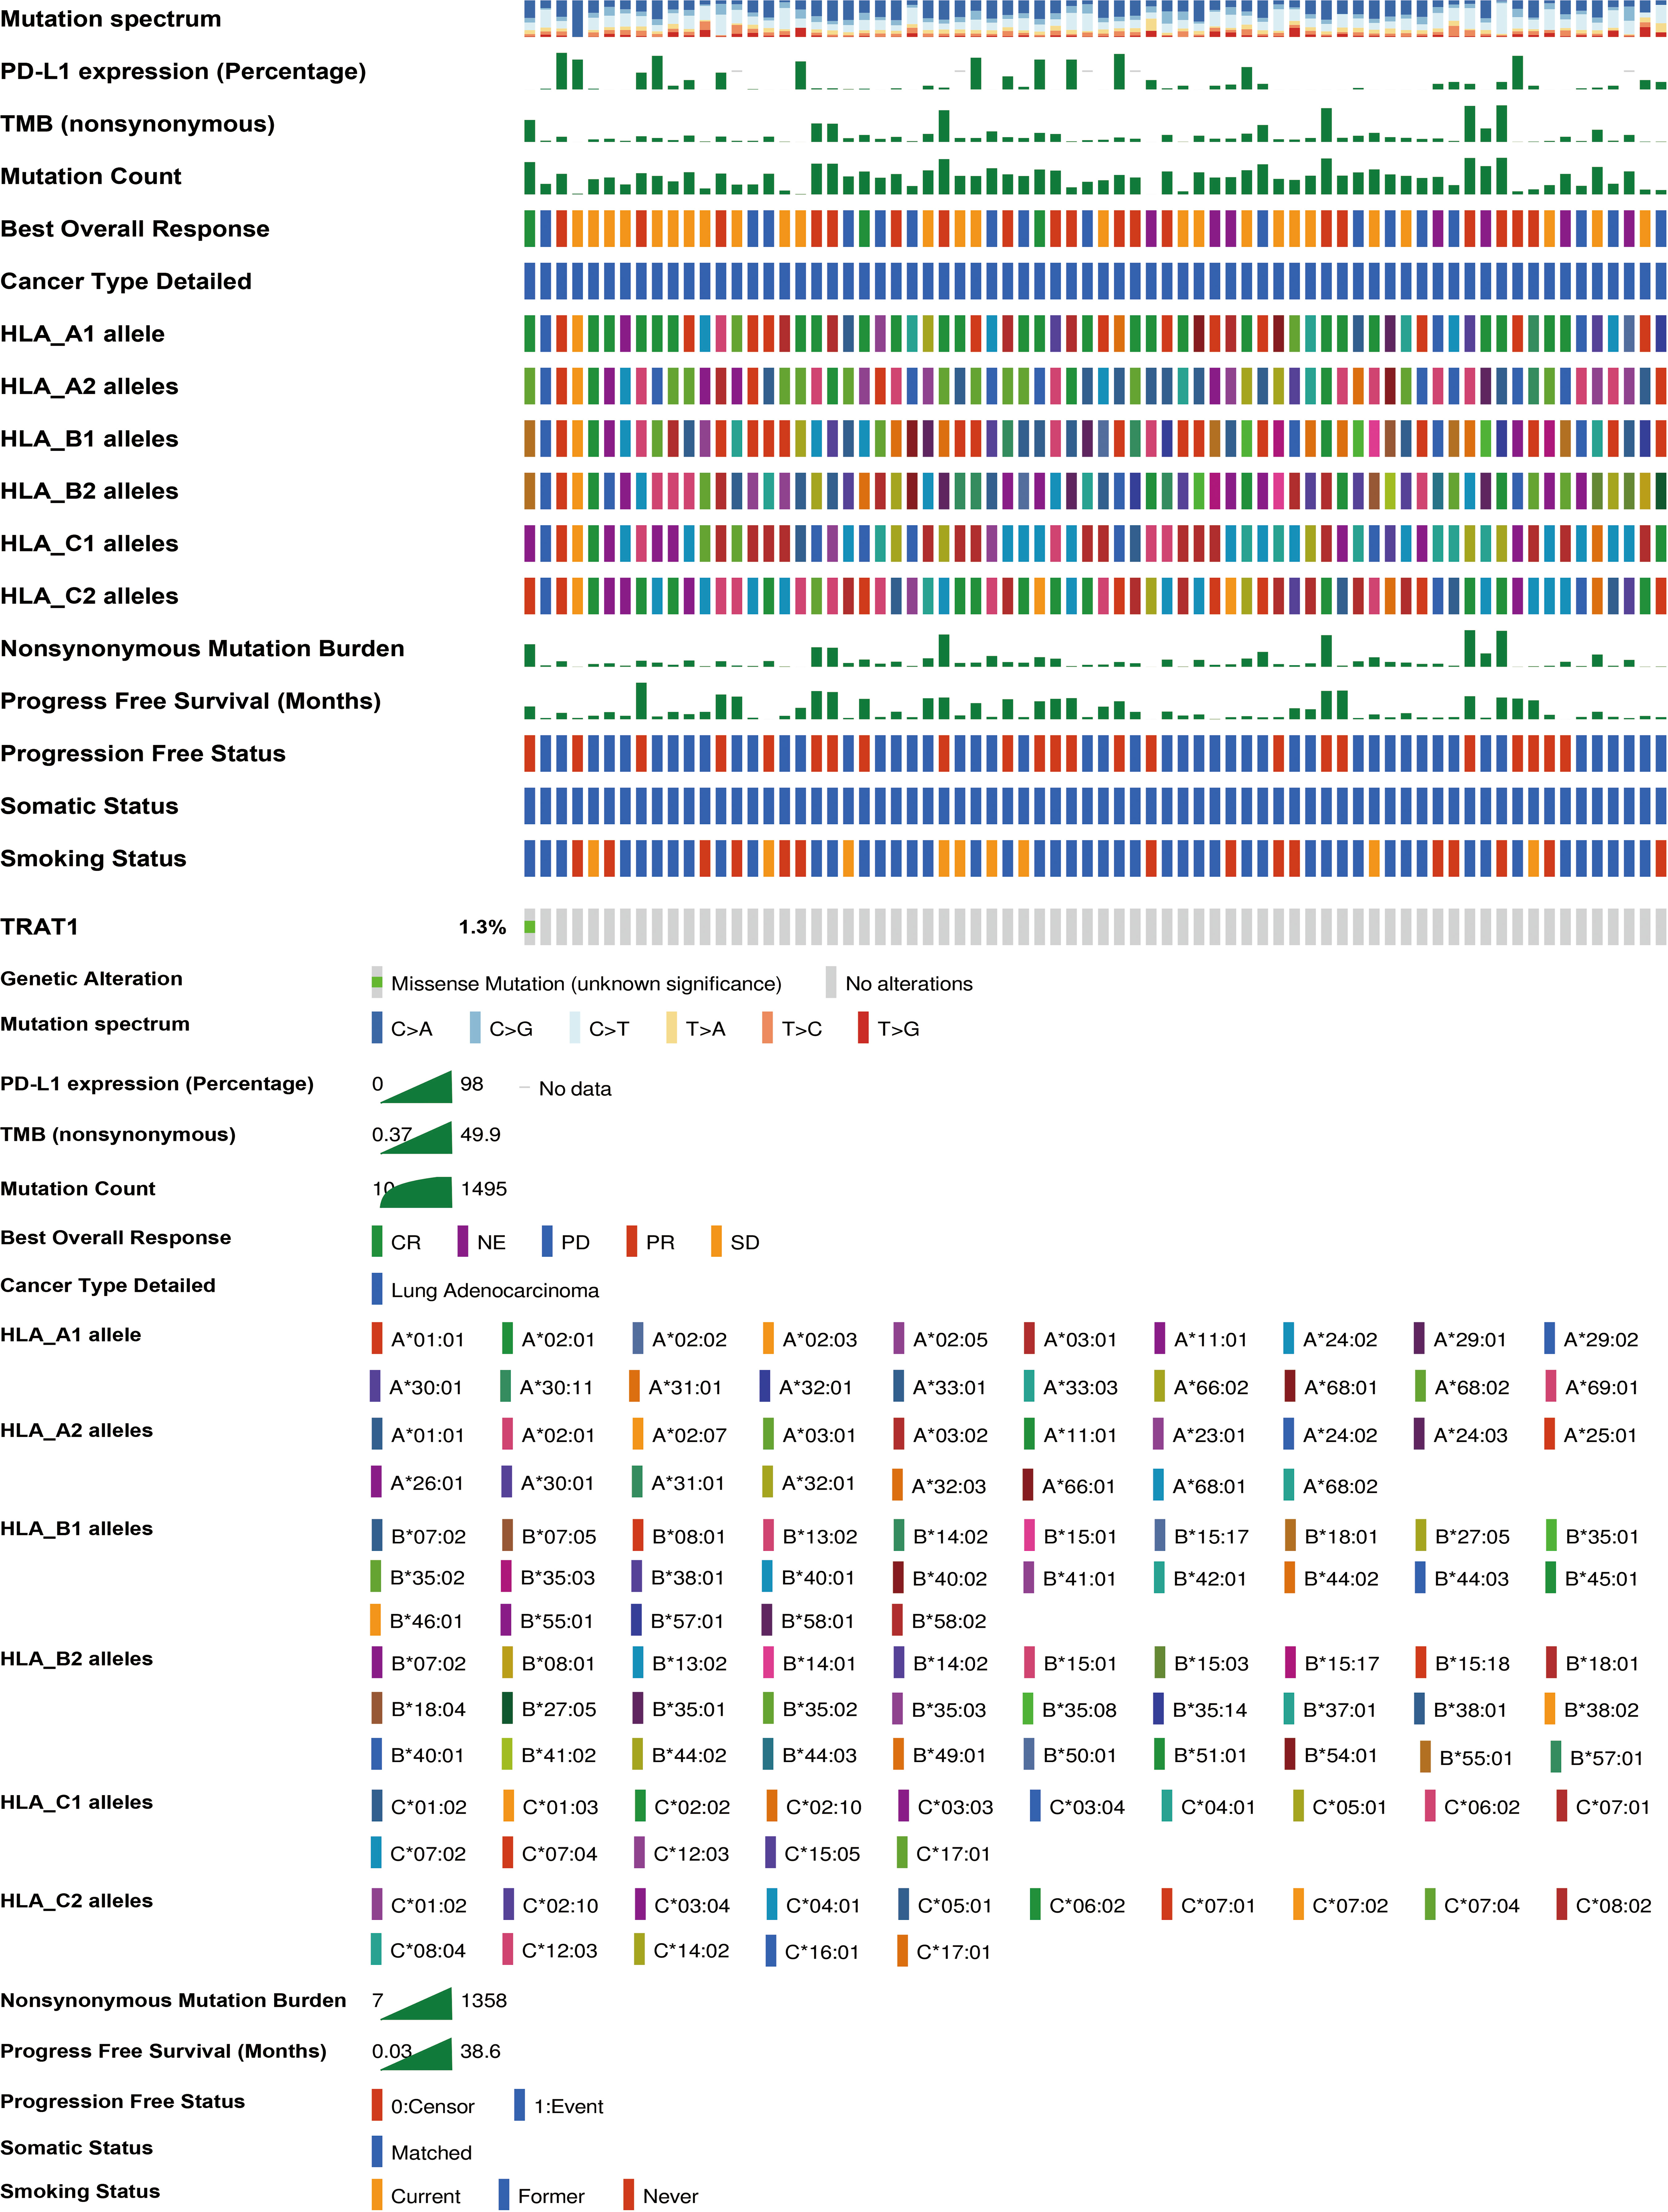
Figure 1 The relationship between TRAT1 expression levels and immune characteristics of LAC cells. LAC, lung adenocarcinoma.
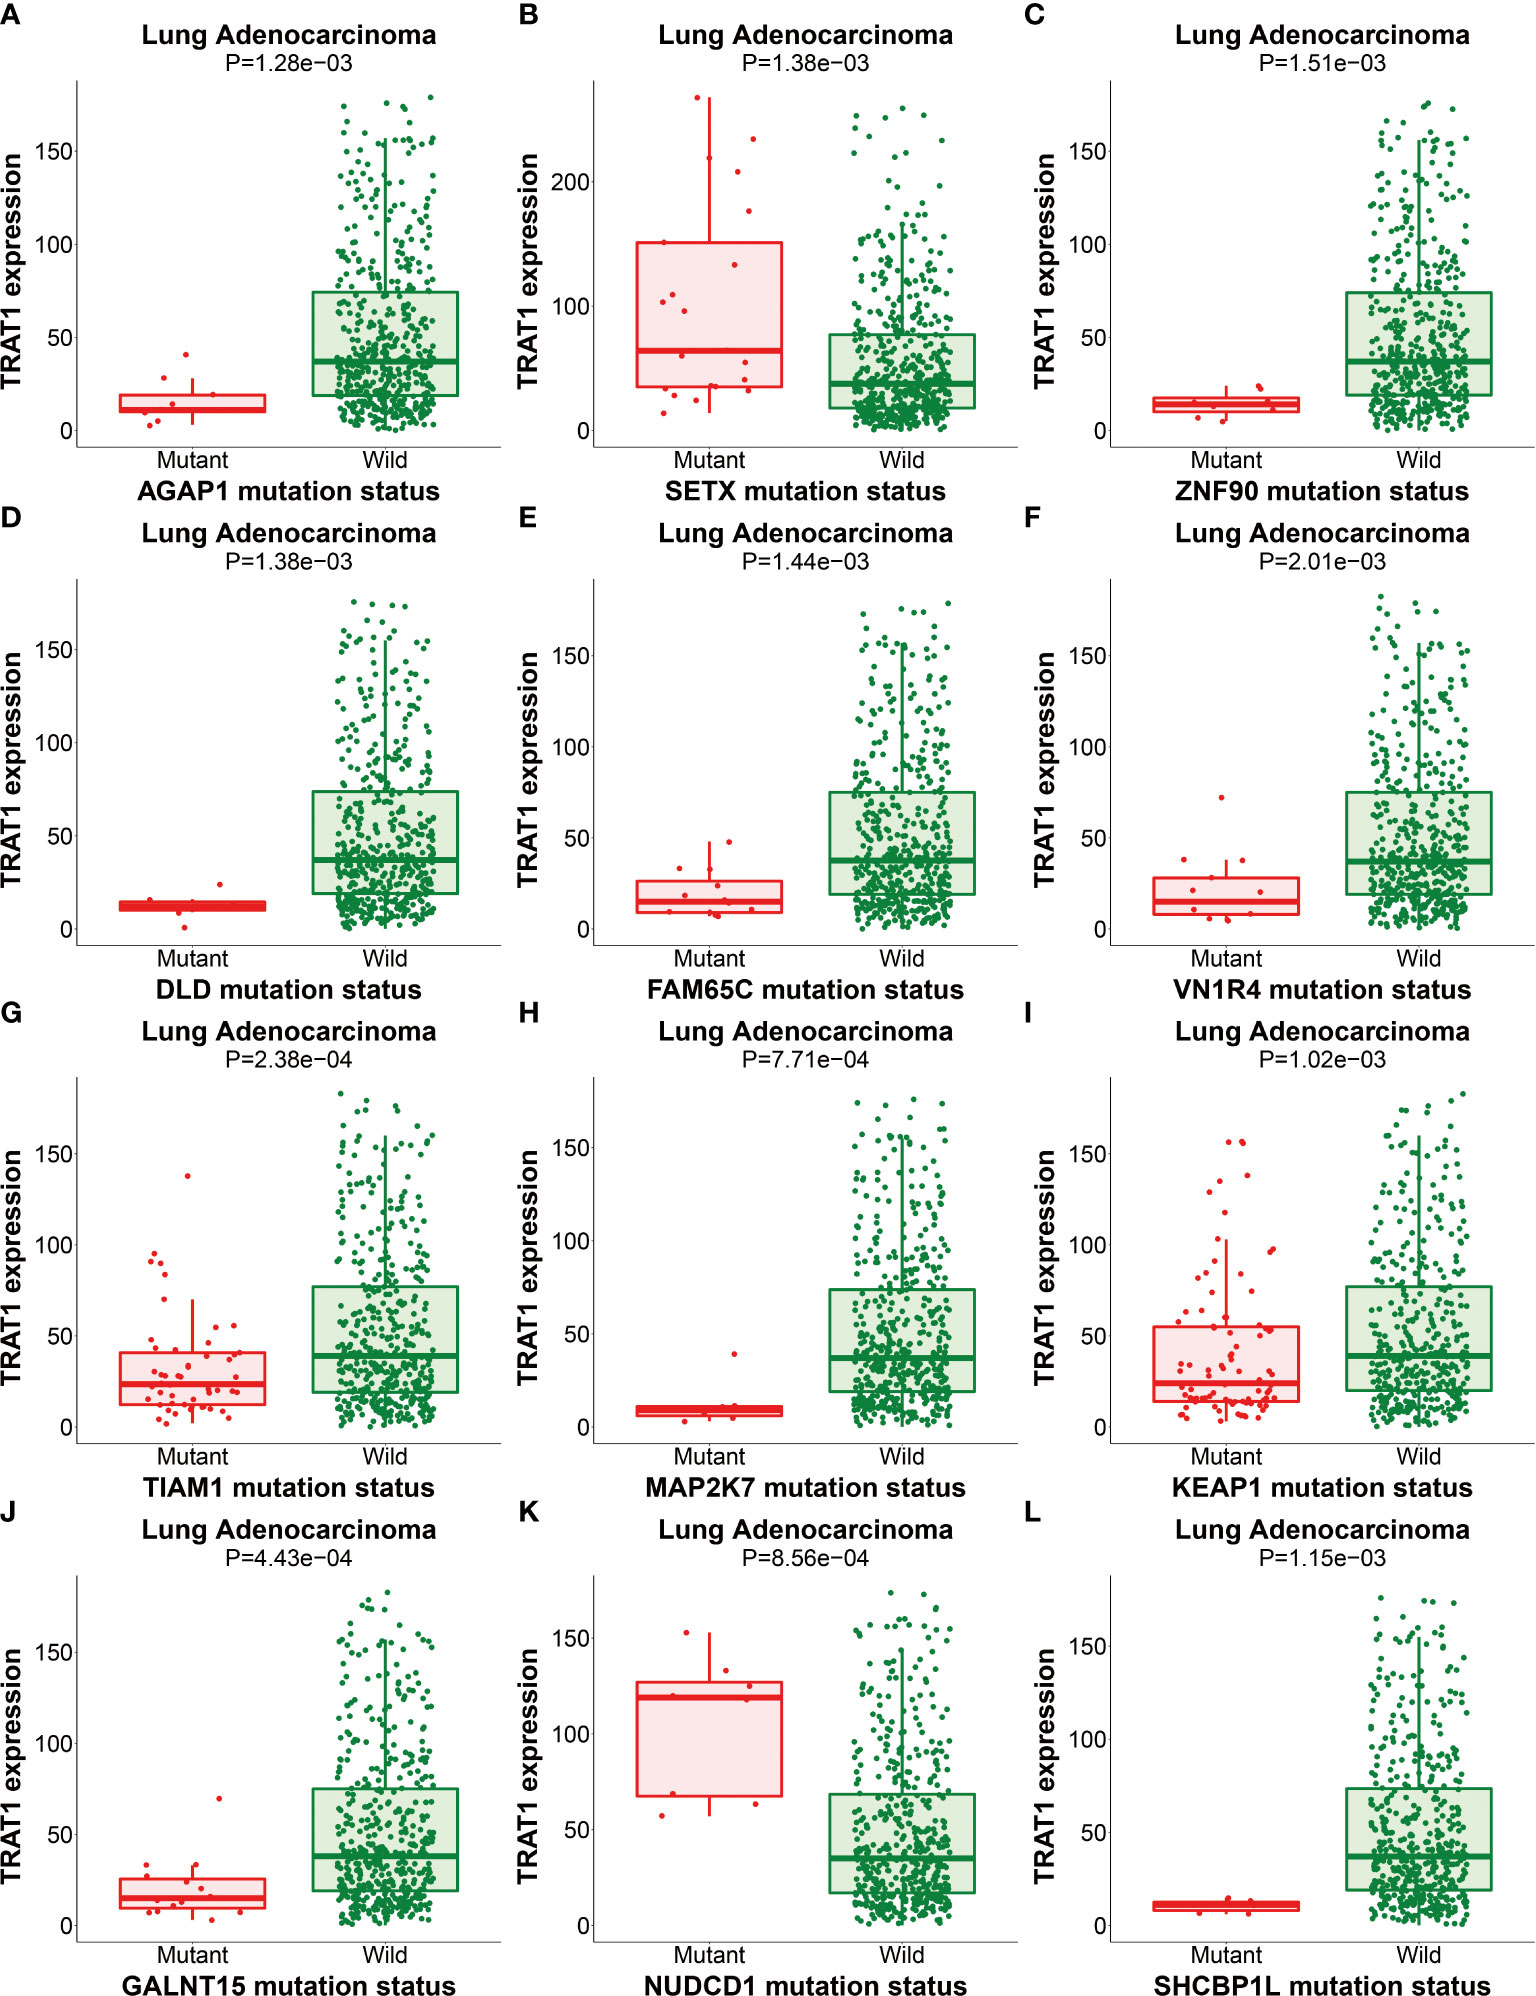
Figure 2 The expression of TRAT1 in LAC mutation sites. (A) AGAP1; (B) SETX; (C) ZNF90; (D) DLD; (E) FAM65C; (F) VN1R4; (G) TIAM1; (H) MAP2K7; (I) KEAP1; (J) GALNT15; (K) NUDCD1; (L) SHCBP1. LAC, lung adenocarcinoma.
Roles, mechanisms, and PPI network involved in the strongly co-expressed genes of TRAT1
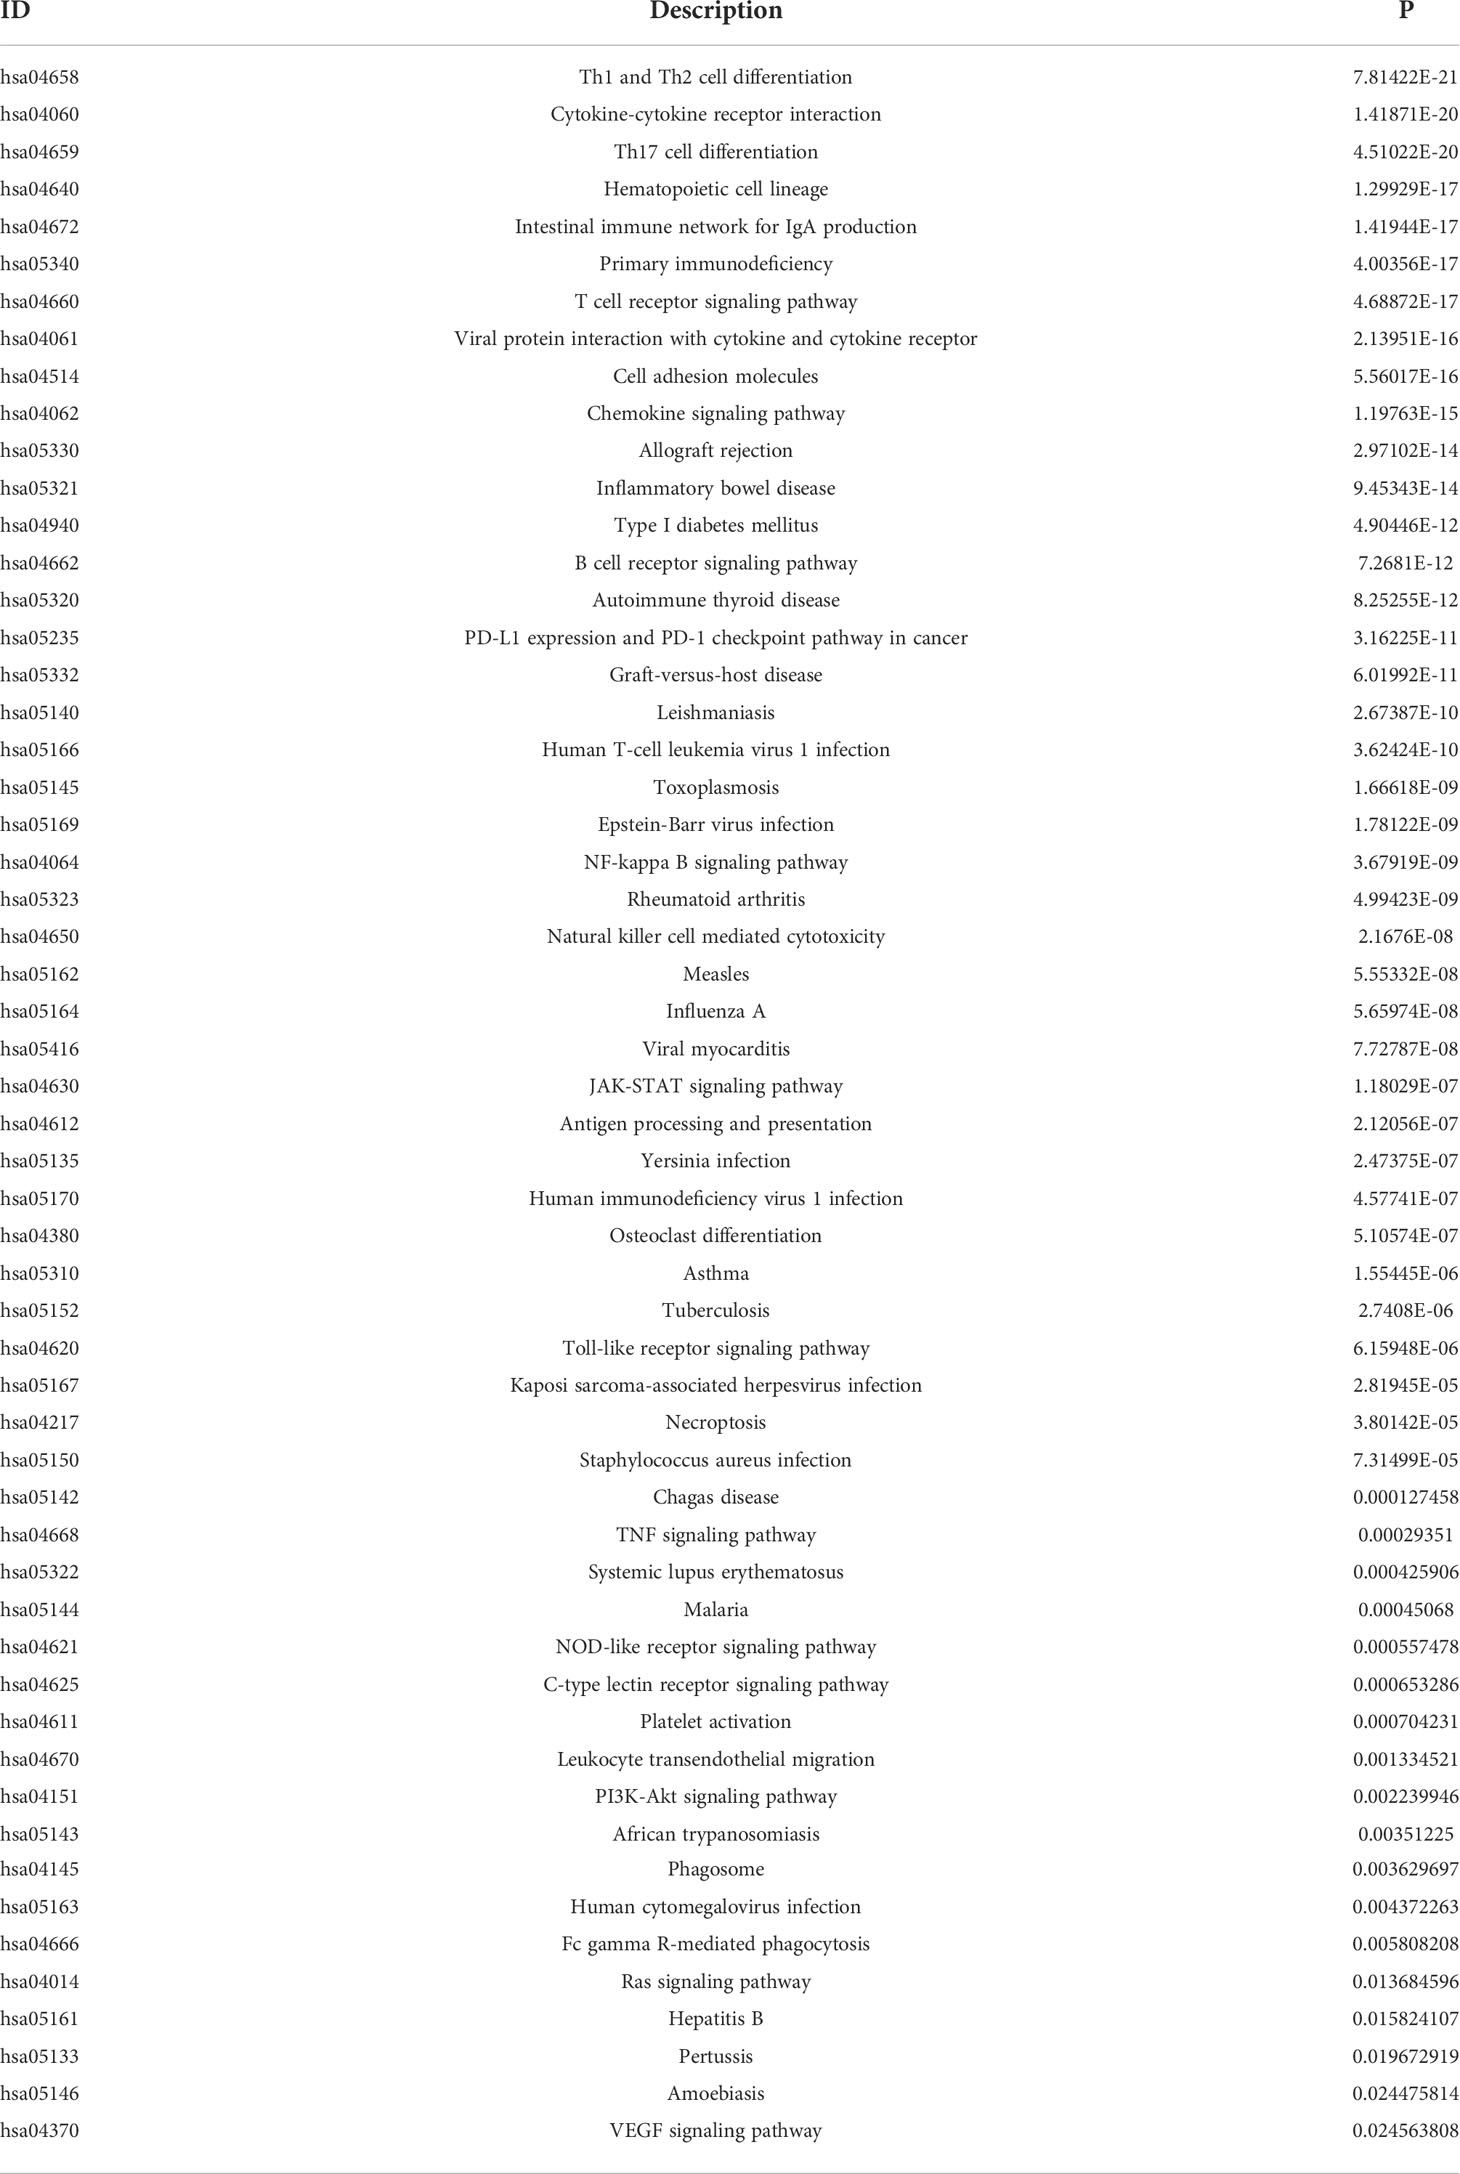
There were 806 strongly co-expressed genes of TRAT1 (Table S1 and Figure 3). TRAT1 co-expressed genes were found to be involved in T cell activation, lymphocyte differentiation, T cell differentiation, lymphocyte proliferation, mononuclear cell proliferation, and others (Figures 4A-C and Table S2). In addition, TRAT1 co-expressed genes were involved in Th1, Th2, and Th17 cell differentiation; PD-L1 expression and PD-1 checkpoint pathway in cancer; TCR, B cell receptor (BCR), NF-kappa B, JAK-STAT, PI3K-AKT, VEGF, and other signalling pathways as per KEGG analysis (Figure 4D and Table 2). Figure 5 shows the PPI network between the strongly co-expressed genes of TRAT1. Abnormal expression of TRAT1 is associated with cancer mechanisms and immunity, indicating that TRAT1 has an important role in LAC progression.
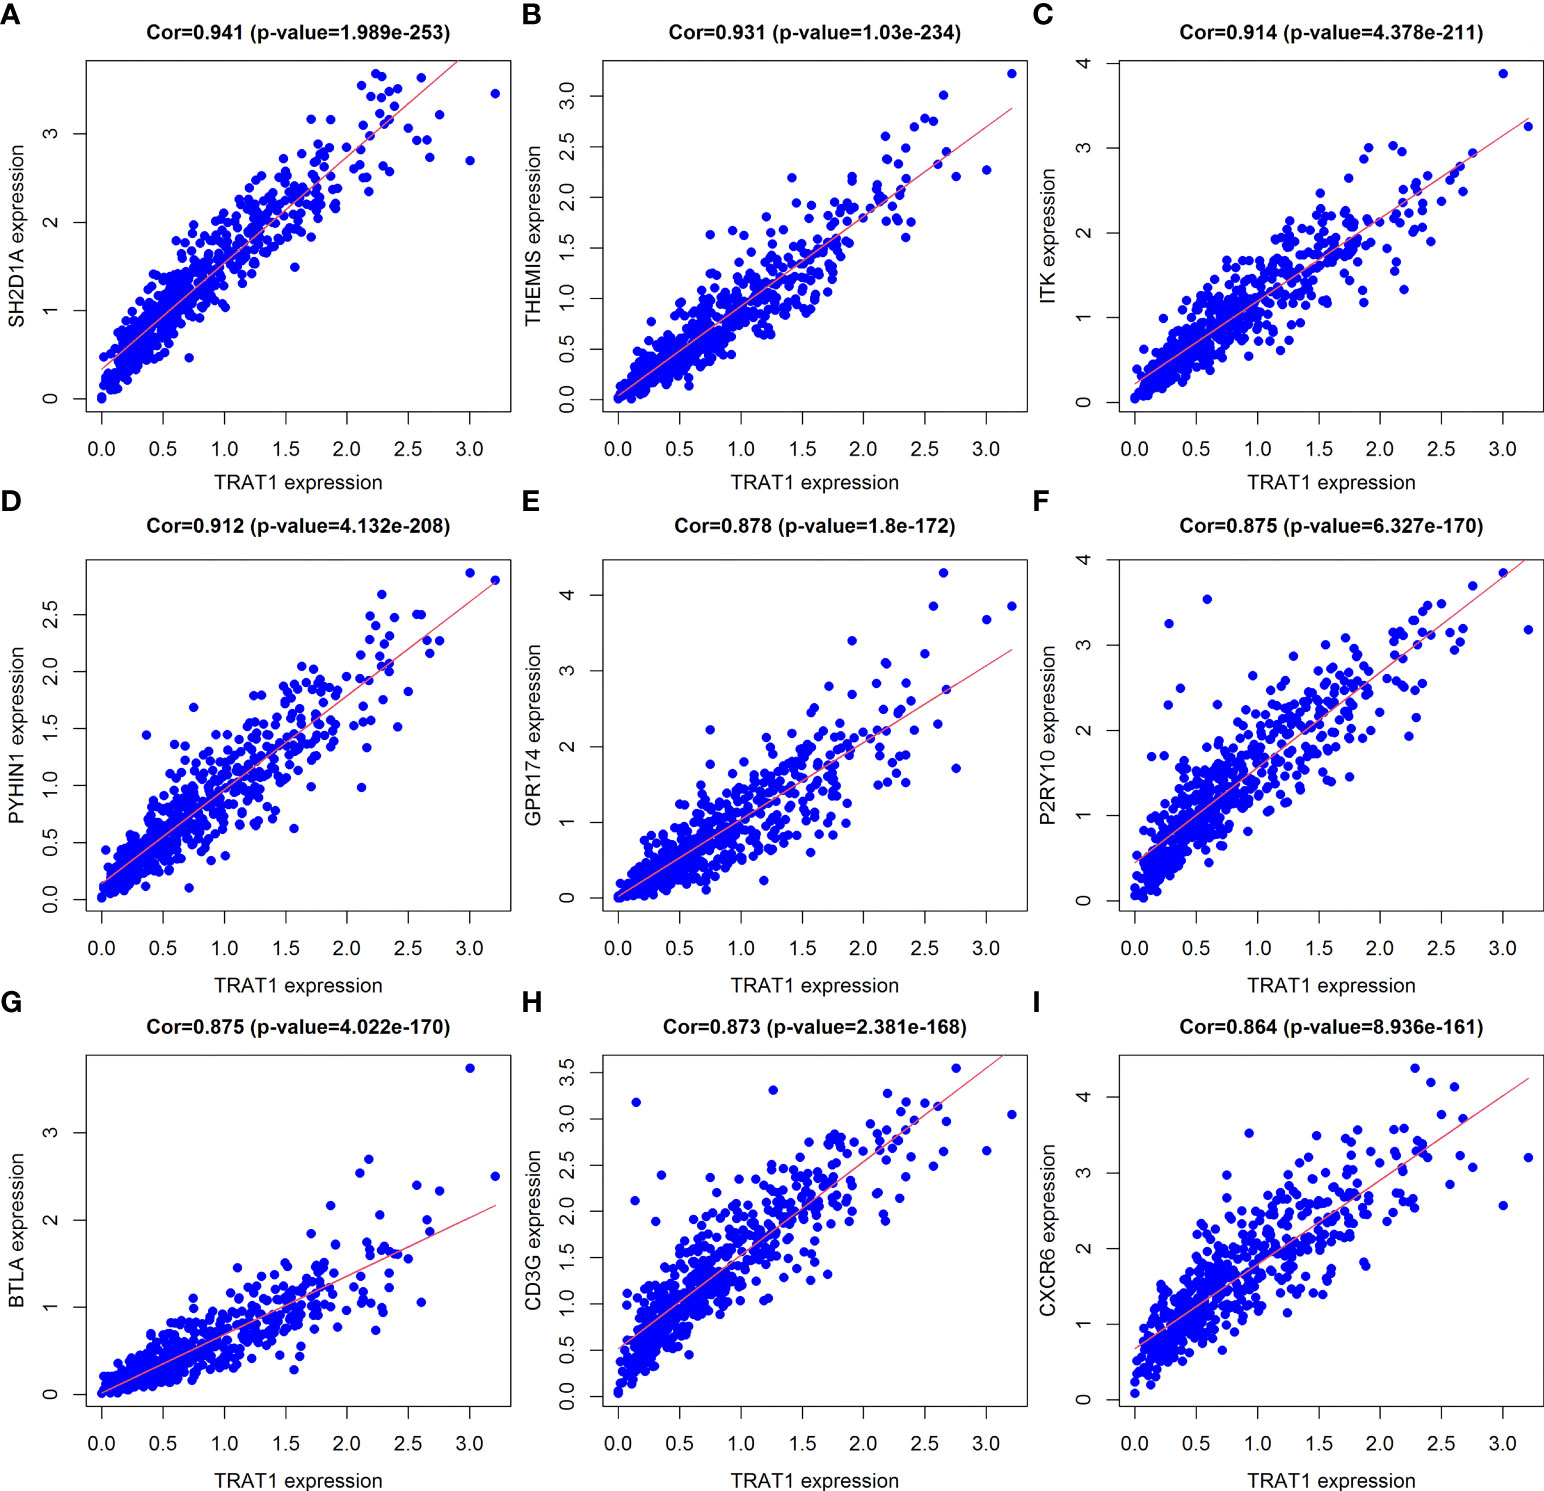
Figure 3 Top 9 TRAT1 co-expressed genes. (A) SH2D1A; (B) THEMIS; (C) ITK; (D) PYHIN1; (E) GPR174; (F) P2RY10; (G) BTLA; (H) CD3G; (I) CXCR6.
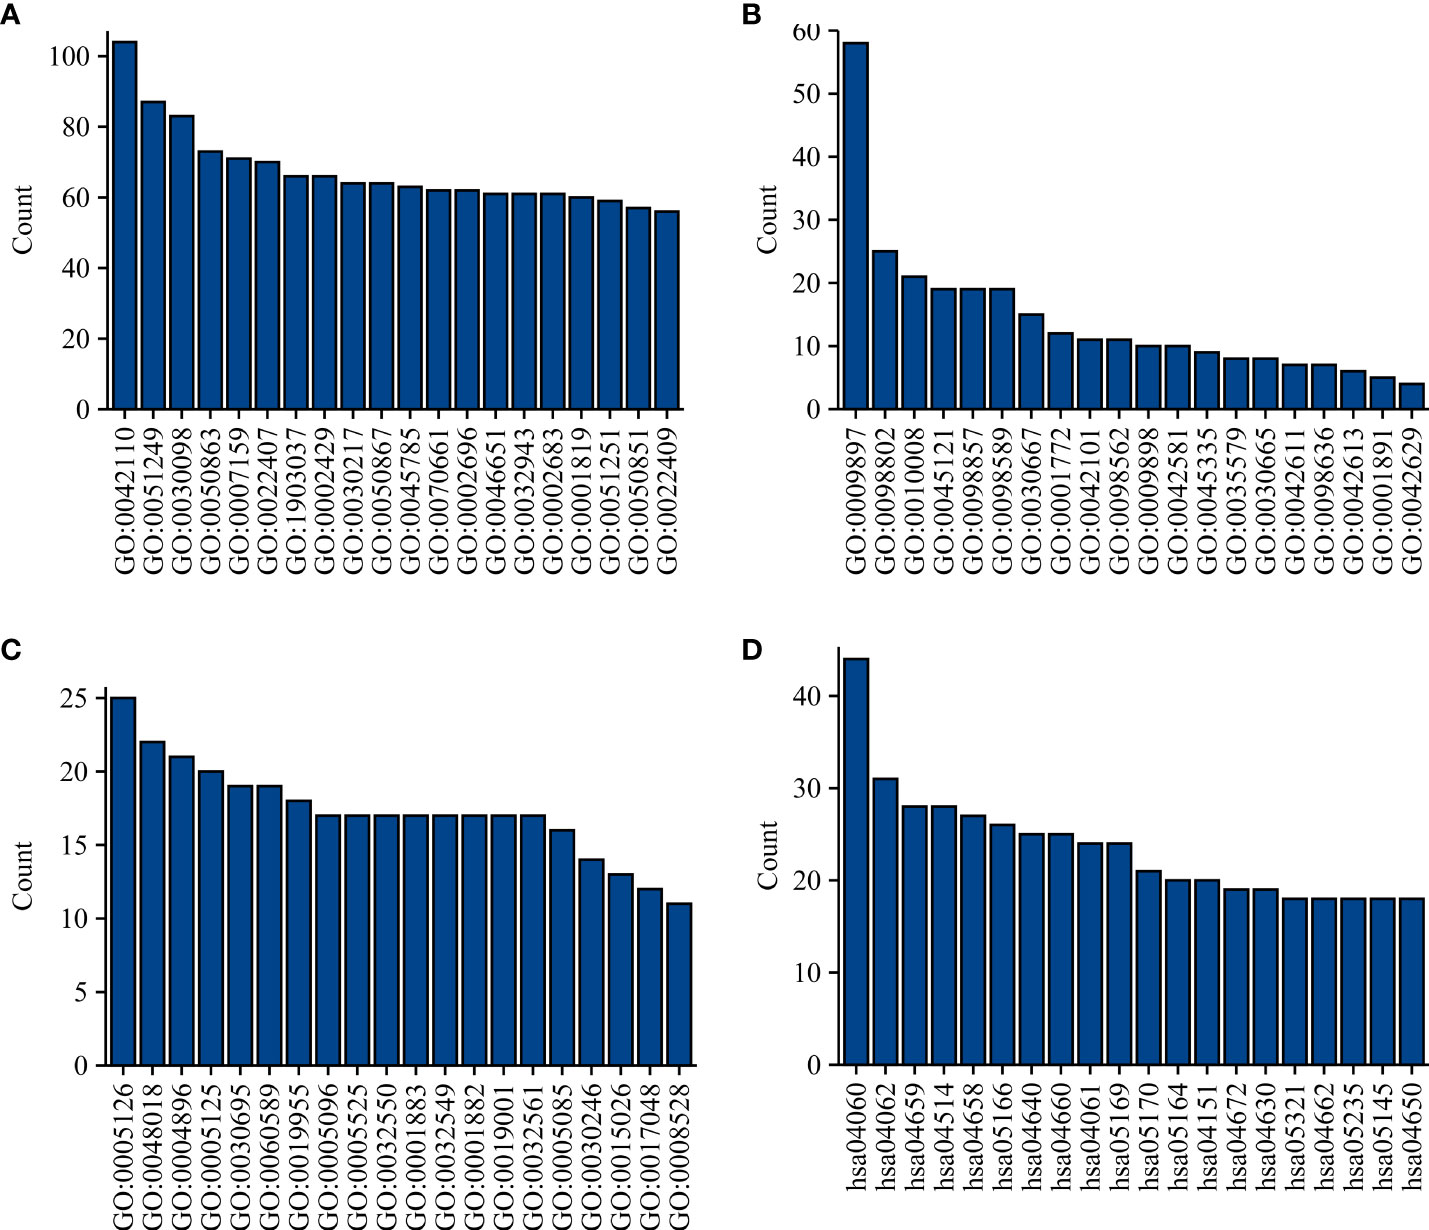
Figure 4 Functions and mechanisms of TRAT1 co-expressed genes. (A) BP; (B) CC; (C) MF; (D) Signalling pathways. BP, biological process; MF, molecular function; CC, cell component.
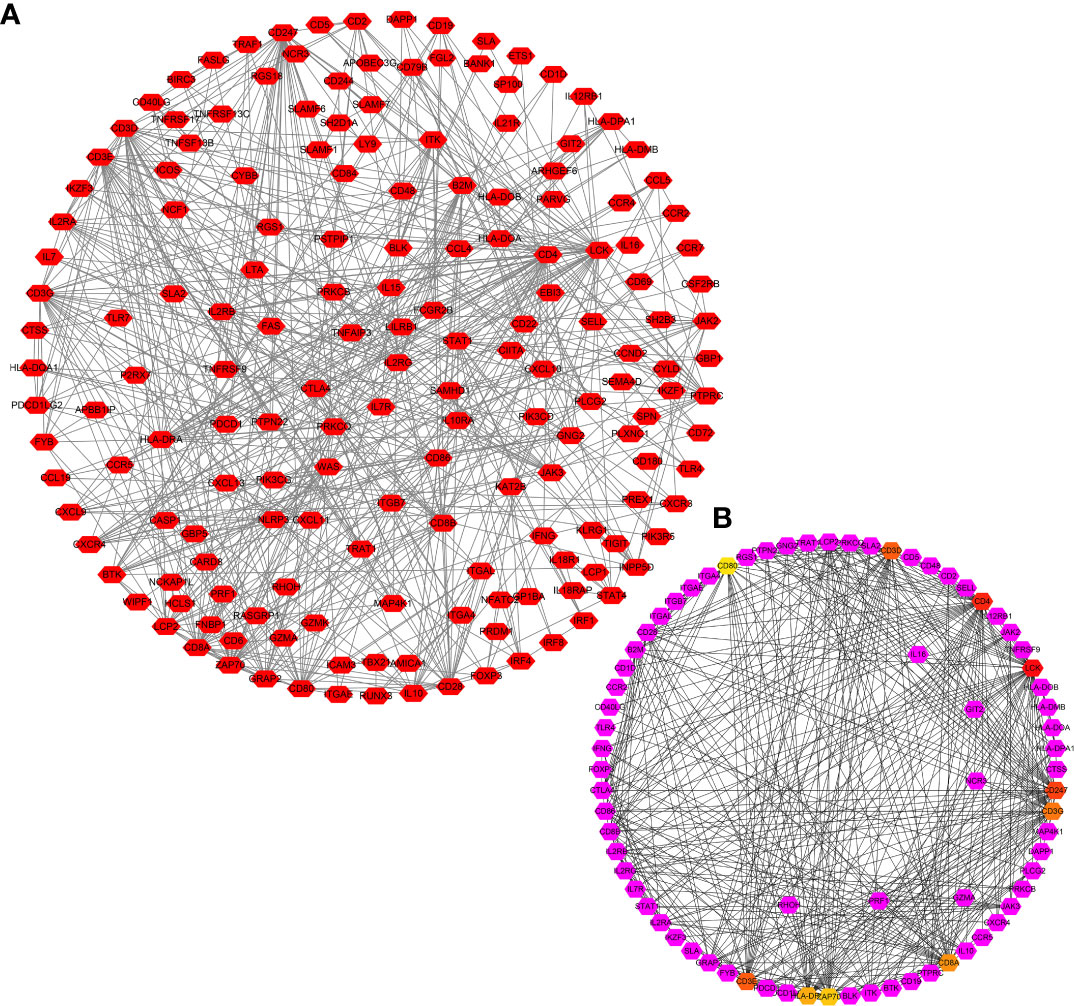
Figure 5 PPI network of TRAT1 co-expressed genes. (A) PPI network; (B) Hub genes in network. PPI, protein-protein interaction.
Elevated TRAT1 expression inhibited LAC cell growth and metastasis
Cell models of TRAT1 overexpression were successfully established using the A549 and H1299 cells and confirmed by PCR and western-blotting (Figures 6A, B). The CCK-8 assay results showed that compared with the control group, the viability of A549 and H1299 cells in the TRAT1 overexpression group significantly decreased, and the cell viability of the two groups at 48 and 72 h was statistically significant (Figures 6C, D). TRAT1 overexpression significantly promoted apoptosis in the A549 and H1299 cells (Figures 6E, F). The results of the invasion experiment showed that increased expression of TRAT1 significantly inhibited the invasion of A549 and H1299 cells (Figures 6G, H). Additionally, the results of the scratch assay showed that elevated TRAT1 expression significantly inhibited the migration of A549 and H1299 cells with significant differences between the two groups (Figures 7A, B). This suggests that TRAT1 functions as a tumour suppressor in LAC progression to inhibit cancer growth and migration.
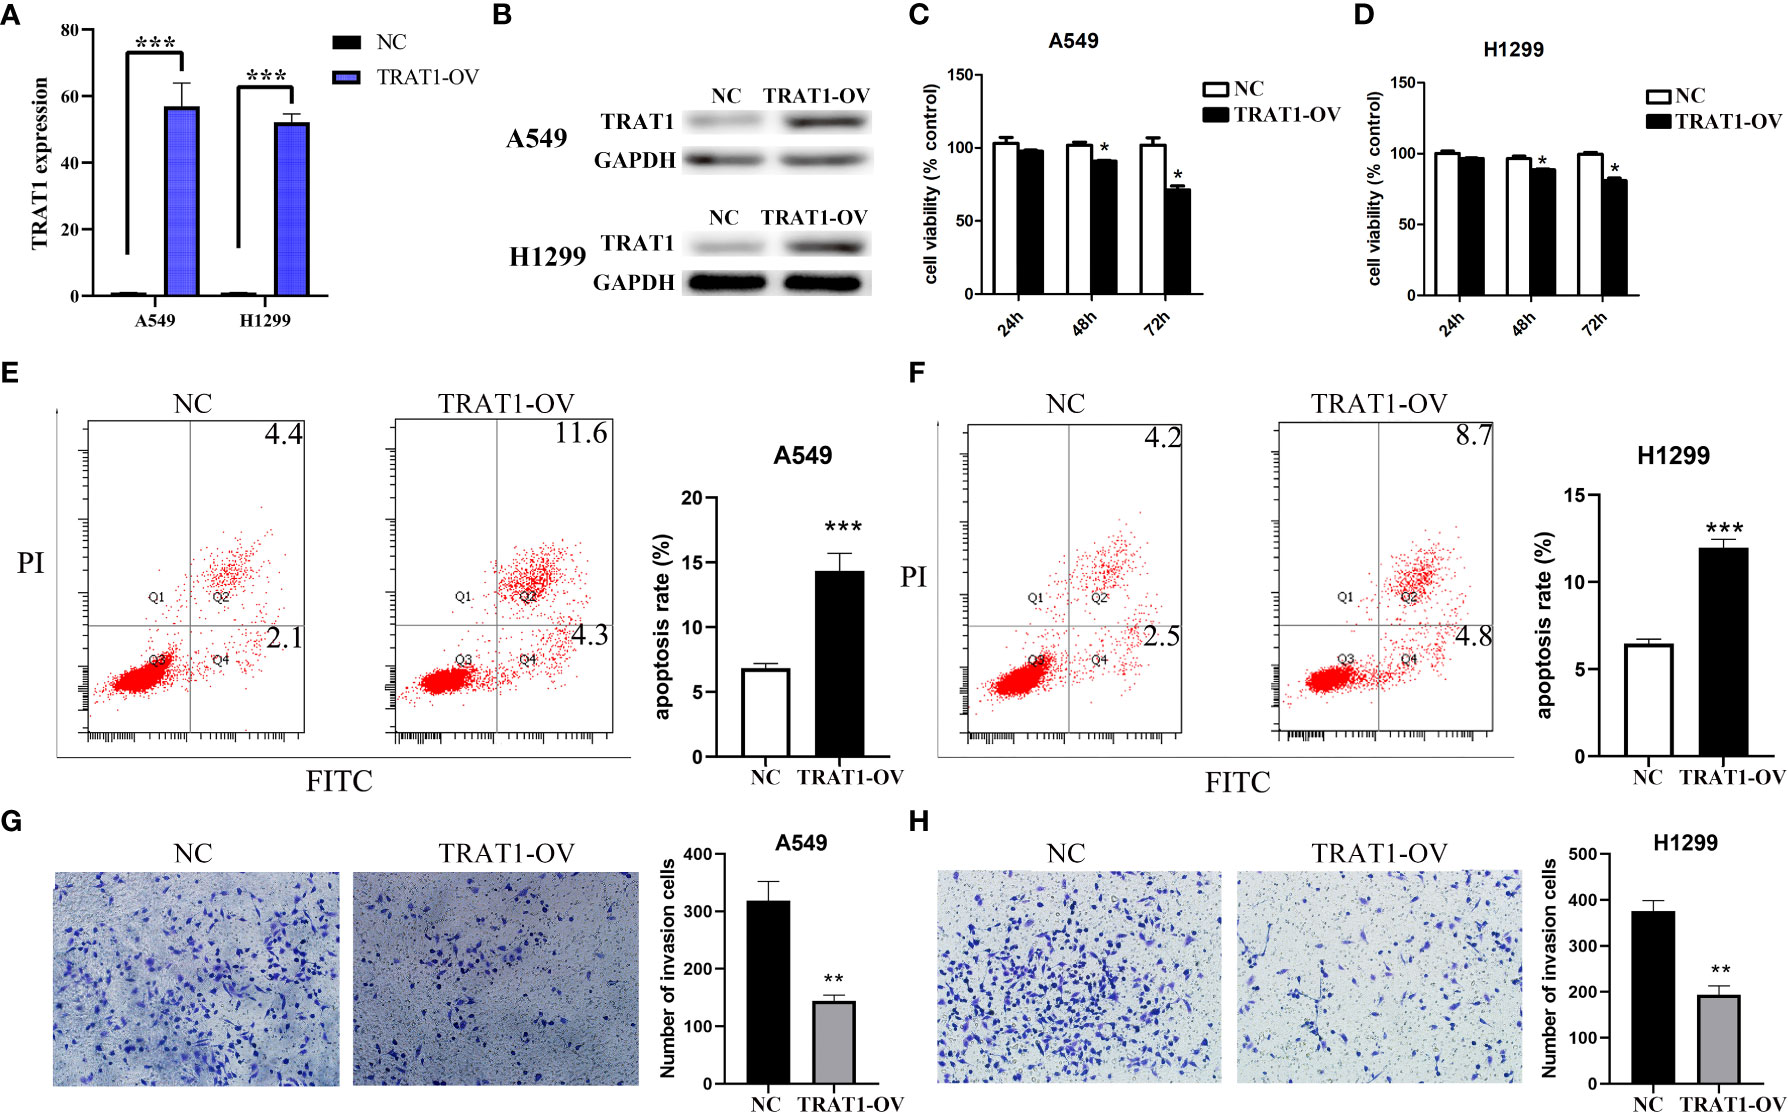
Figure 6 TRAT1 overexpression inhibited the cell growth and immune invasion in LAC cell models. (A, B) Construction of A549 and H1299 cell models of TRAT1 overexpression using the PCR and Western Blotting; (C-F) Decreased cell viability and increased apoptosis in TRAT1 overexpression group determined using the CCK-8 assay and flow cytometry; (G, H) Decreased cell invasive ability in TRAT1 overexpression group determined using the transwell experiment. LAC, lung adenocarcinoma; CCK-8, Cell Counting Kit-8; *P < 0.05; **P < 0.01; ***P < 0.001.

Figure 7 Elevated TRAT1 expression inhibited cell migration in LAC A549 and H1299 cells. (A) A549 cells; (B) H1299 cells. LAC, lung adenocarcinoma; *P < 0.05.
TRAT1 was significantly associated with the LAC immune microenvironment
TRAT1 expression level was significantly correlated with the stromal (r = 0.487), immune (r = 0.732), and ESTIMATE scores (r = 0.668) (Figures 8A-C). TRAT1 expression was also significantly correlated with the populations of activated dendritic cells (aDCs) (r = 0.462), B cells (r = 0.585), CD8 T cells (r = 0.25), cytotoxic cells (r = 0.633), DCs (r = 0.294), eosinophils (r = 0.128), immature dendritic cells (iDCs) (r = 0.25), macrophages (r = 0.37), mast cells (r = 0.149), neutrophils (r = 0.117), natural killer (NK) CD56bright cells (r = -0.120), NK CD56dim cells (r = 0.229), NK cells (r = -0.186), plasmacytoid dendritic cells (pDCs) (r = 0.229), T cells (r = 0.822), T helper cells (r = 0.657), central memory T (TCM) cells (r = 0.416), effector memory T (TEM) cells (r = 0.282), T follicular helper (TFH) cells (r = 0.369), gamma delta T (Tγδ) cells (r = 0.115), Th1 cells (r = 0.588), Th17 cells (r = 0.104), regulatory T (Treg) cells (r = 0.335), and Th2 cells (r = 0.075), as determined using the Pearson correlation analysis (Figures 9, S2). Grouping by the median value of TRAT1 expression showed that the stromal, immune, and ESTIMATE scores were significantly different (Figures 8D-F), and the levels of B, CD8 T, cytotoxic, and other cells were significantly different between the high- and low-TRAT1 expression groups (Figure S3).
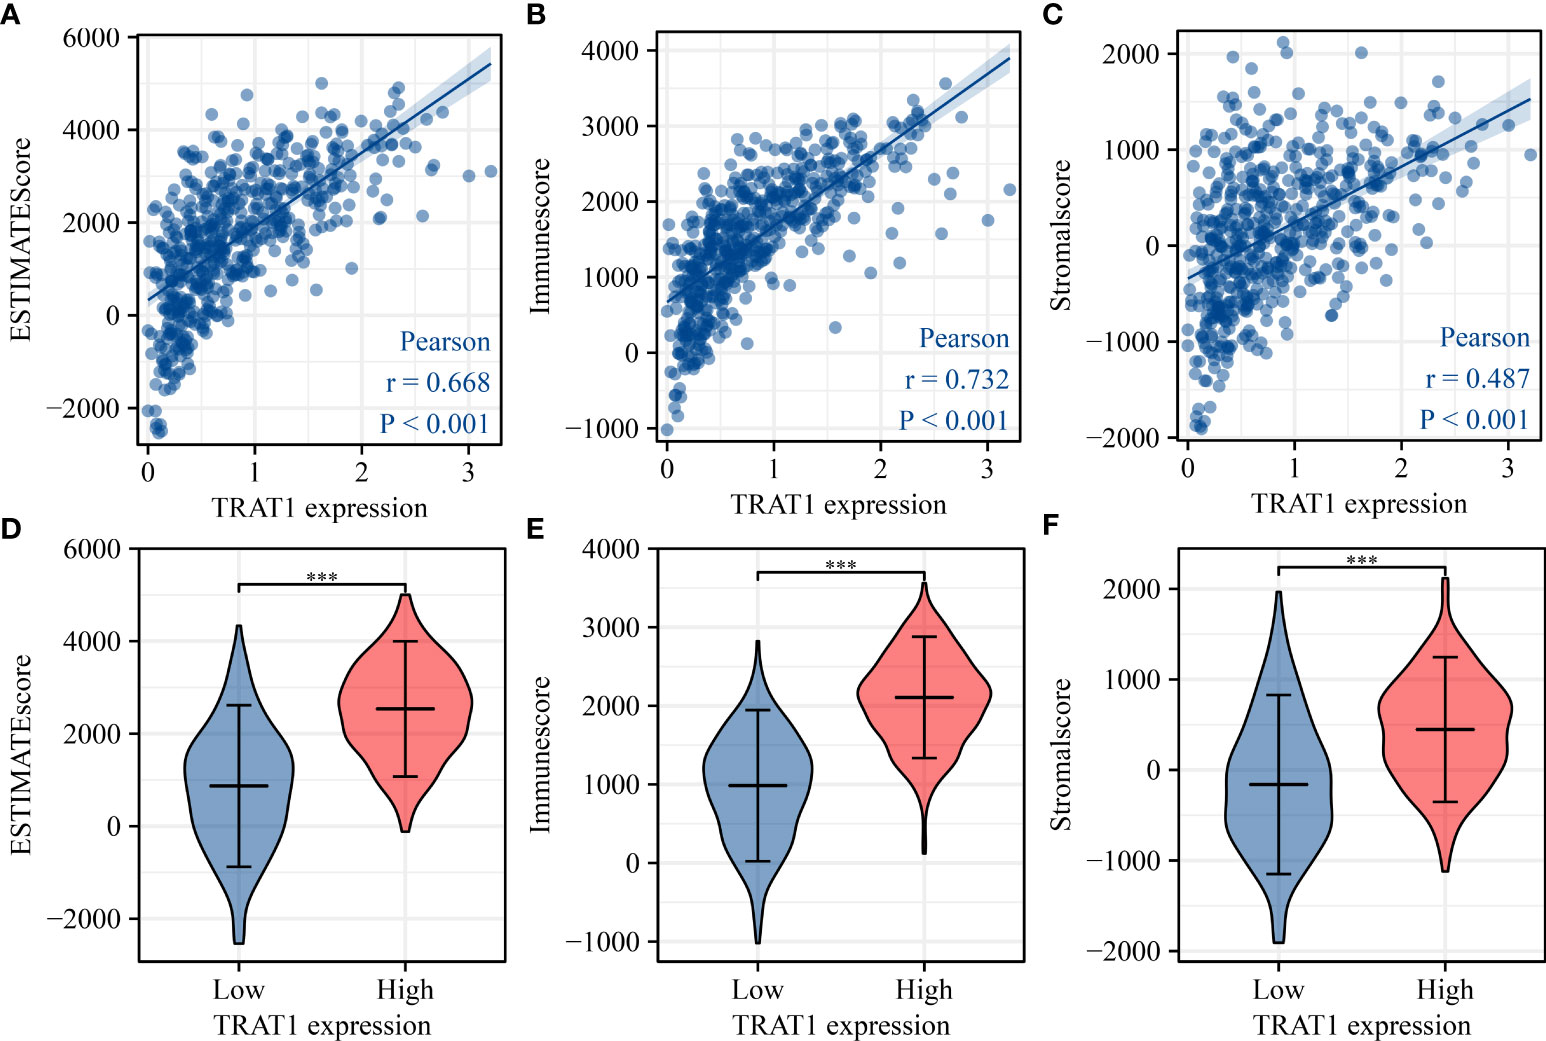
Figure 8 TRAT1 expression was significantly correlated with the levels of stromal, immune, and ESTIMATE scores in LAC tissues. (A) Stromal score; (B) Immune score; (C) ESTIMATE score; (D–F) The levels of stromal, immune, and ESTIMATE scores in high- and low-TRAT1 expression groups. LAC, lung adenocarcinoma.
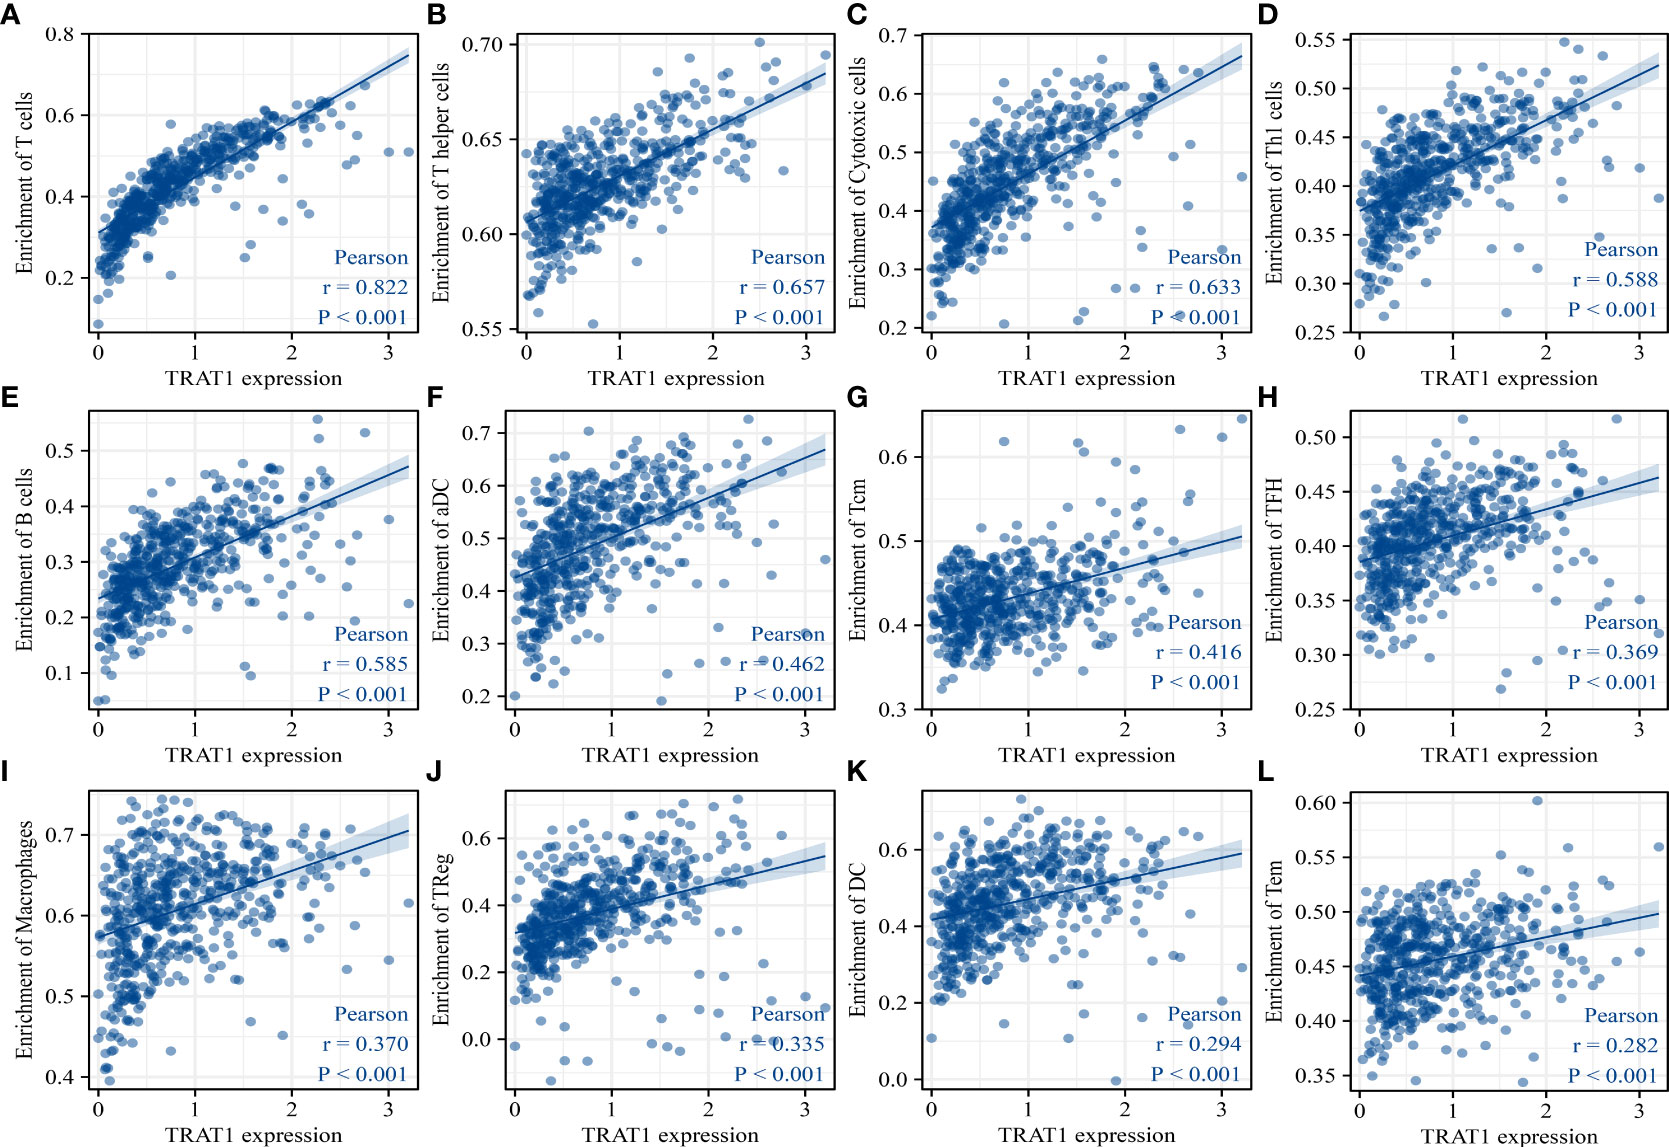
Figure 9 TRAT1 expression was significantly correlated with the populations of immune cells in LAC tissues. (A) T cells; (B) T helper cells; (C) Cytotoxic cells; (D) Th1 cells; (E) B cells; (F) aDC; (G) TCM; (H) TFH; (I) macrophages; (J) Treg; (K) DC; (L) TEM. LAC, lung adenocarcinoma; aDC, activated dendritic cells; TCM, central memory T cells; TFH, follicular helper T cells; Treg, regulatory T cells; TEM, effector memory T cells.
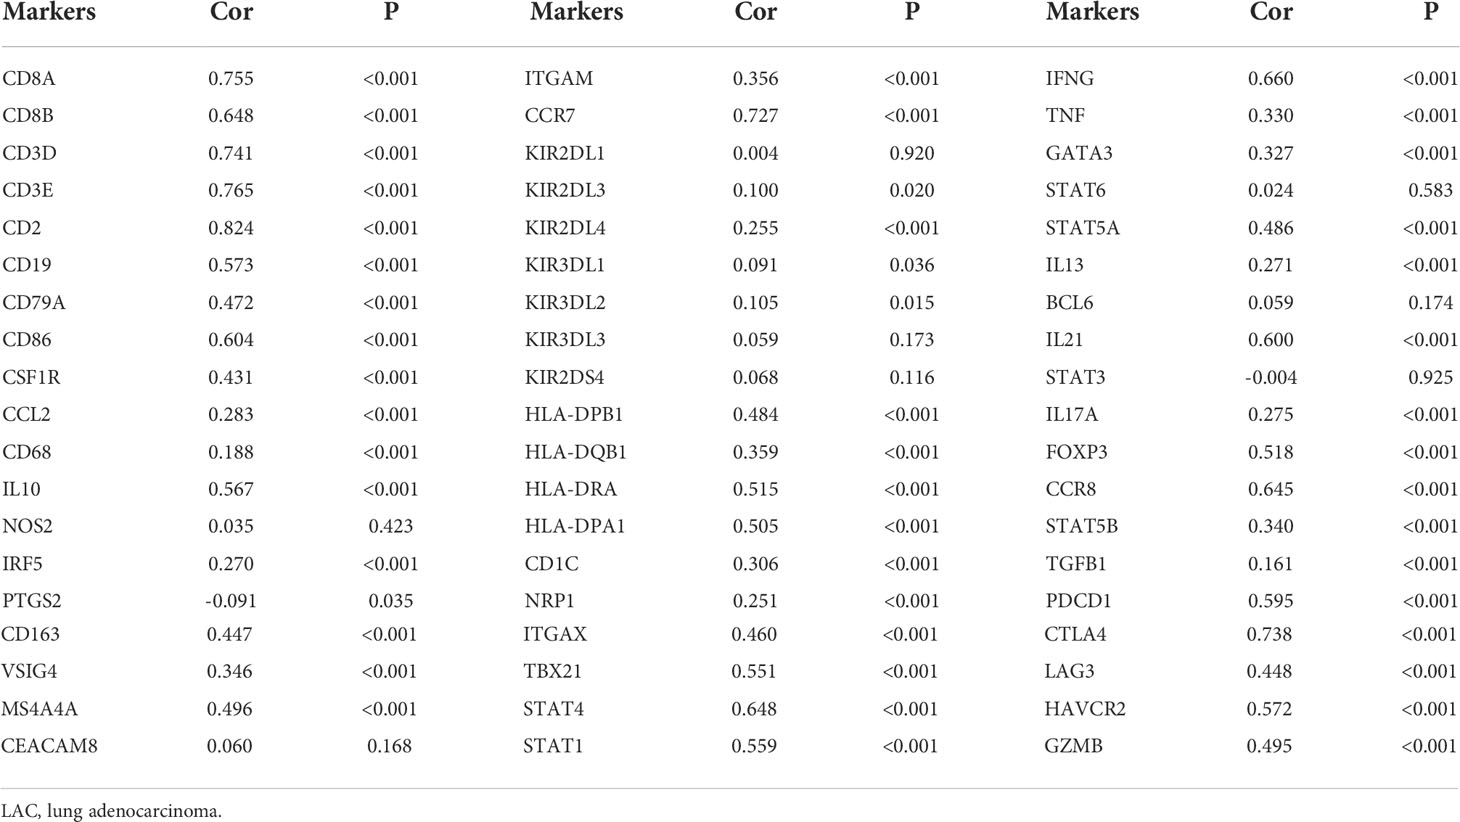
The expression data of immune cell markers in LAC tissues were obtained from TCGA database, and using correlation analysis, we found that the expression levels of TRAT1 correlated with the expression levels of CD8A, CD8B, CD3D, and others (Figure 10 and Table 3). Grouping by the median value of TRAT1 expression showed that the levels of PDCD1, CD79A, CD19, and other immune cell markers were significantly different (Figure S4). In the K–M plotter database, K–M survival analysis revealed that the decreased expression of TRAT1 was significantly associated with poor prognosis in patients with LAC under the following conditions: basophils (decreased), natural killer T-cells (decreased), and type 2 T-helper cells (enriched) (Figure 11). Further, TRAT1 plays an important role in the progression of LAC and is a potential immune marker.
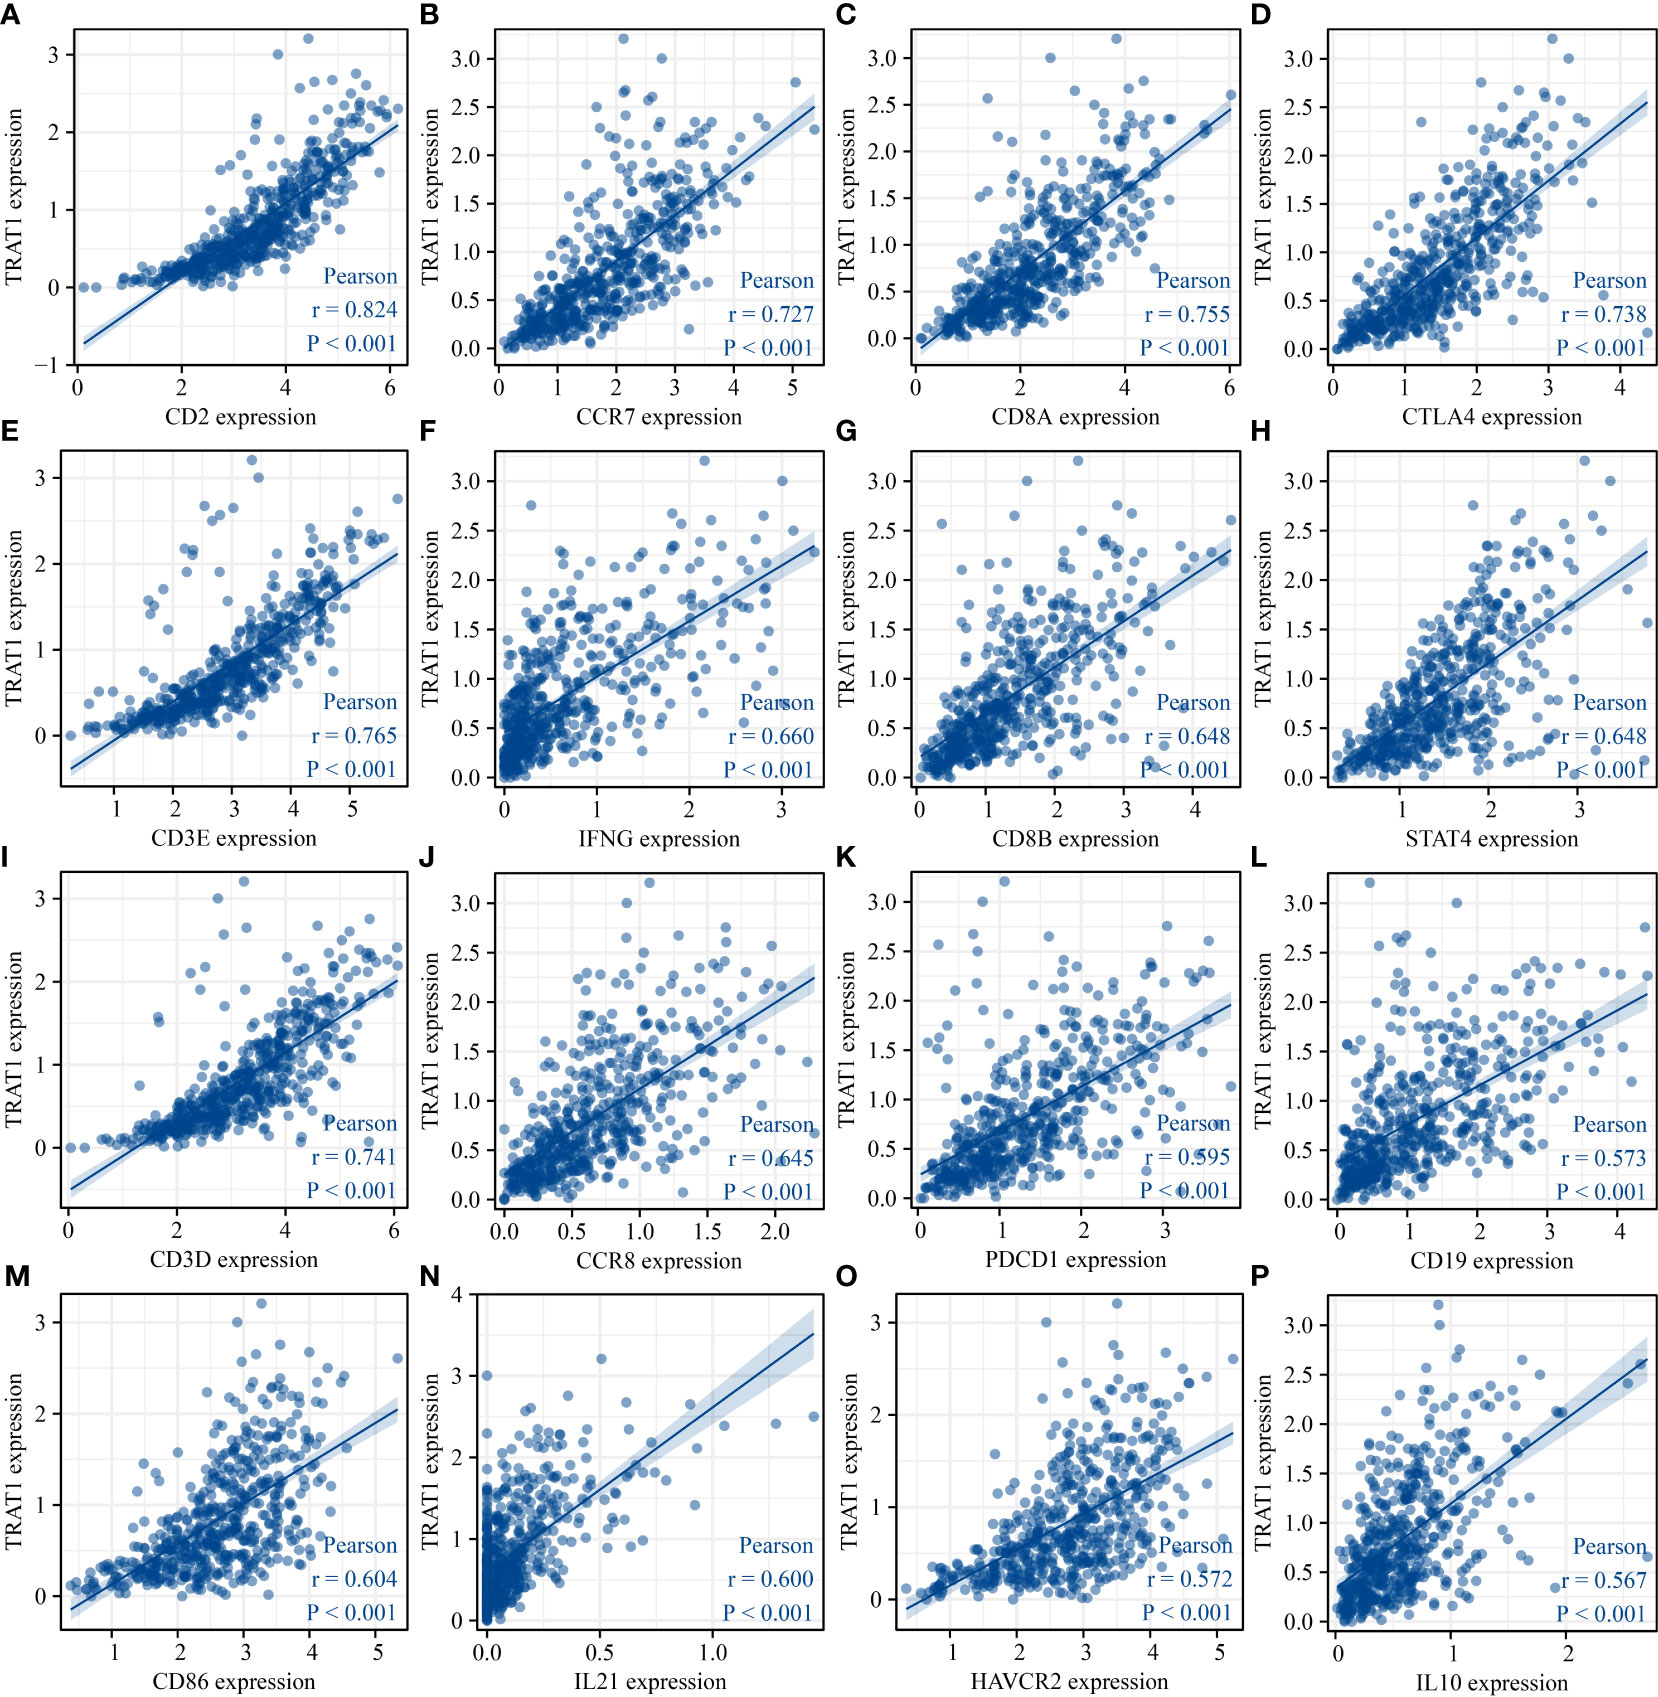
Figure 10 TRAT1 expression was significantly correlated with the levels of immune cell markers in LAC tissues. (A) CD2; (B) CCR7; (C) CD8A; (D) CTLA4; (E) CD3E; (F) IFNG; (G) CD8B; (H) STAT4; (I) CD3D; (J) CCR8; (K) PDCD1; (L) CD19; (M) CD86; (N) IL21; (O) HAVCR2; (P) IL10. LAC, lung adenocarcinoma.
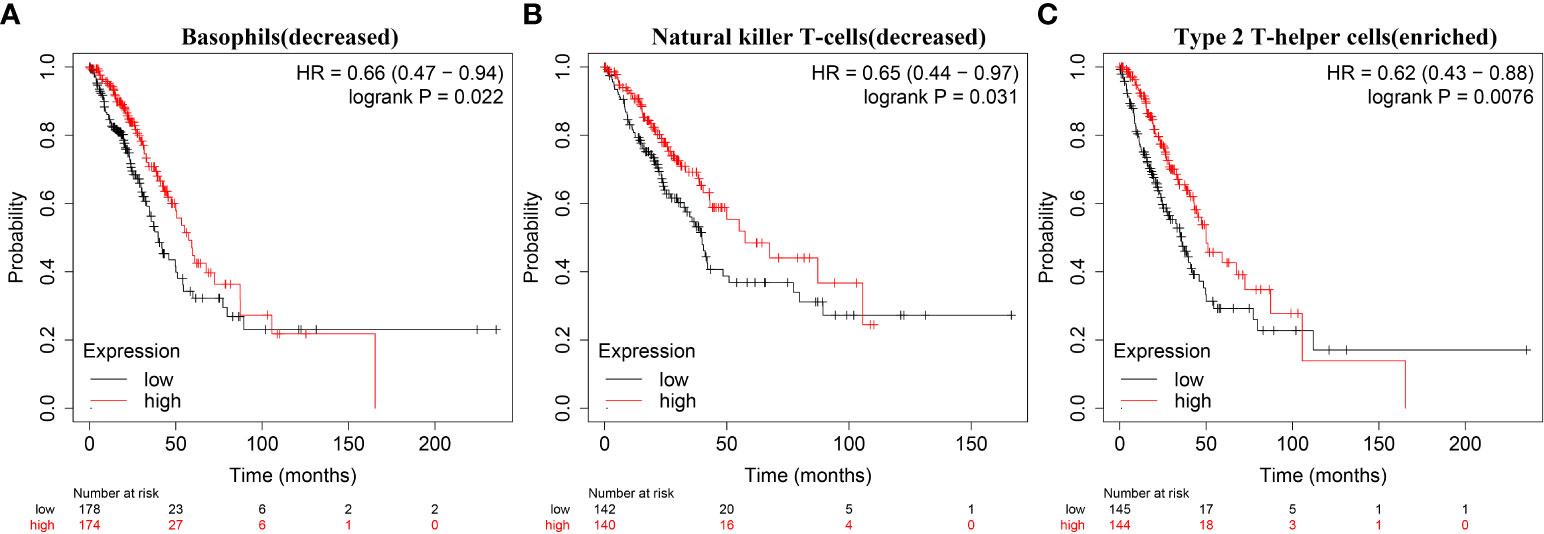
Figure 11 Decreased expression of TRAT1 was significantly associated with prognosis-related immune cells in patients with LAC. (A) Basophils (decreased); (B) Natural killer T-cells (decreased); (C) Type 2 T-helper cells (enriched). LAC, lung adenocarcinoma.
TRAT1 was associated with RNA modification regulator genes
Correlation analysis revealed that the expression levels of TRAT1 were associated with the expression levels of genes associated with RNA modifications, including ALKBH1, ALKBH3, DNMT3A, ALYREF, BMT2, DNMT3A, FMR1, FTO, IGF2BP1, METTL14, NOP2, NSUN2, NSUN3, NSUN5, RBM15, RBM15B, RBMX, RRP8, TET2, TRDMT1, WTAP, YBX1, YTHDC1, YTHDC2, YTHDF1, YTHDF2, YTHDF3, and TRMT61A (Figures 12, S5). Grouping by the median value of TRAT1 expression showed that the levels of BMT2, ALYREF, ALKBH5, ALKBH3, ALKBH1, TET2, RRP8, RBMX, RBM15B, and RBM15 were significantly different between the high- and low-TRAT1 expression groups (Figure S6).
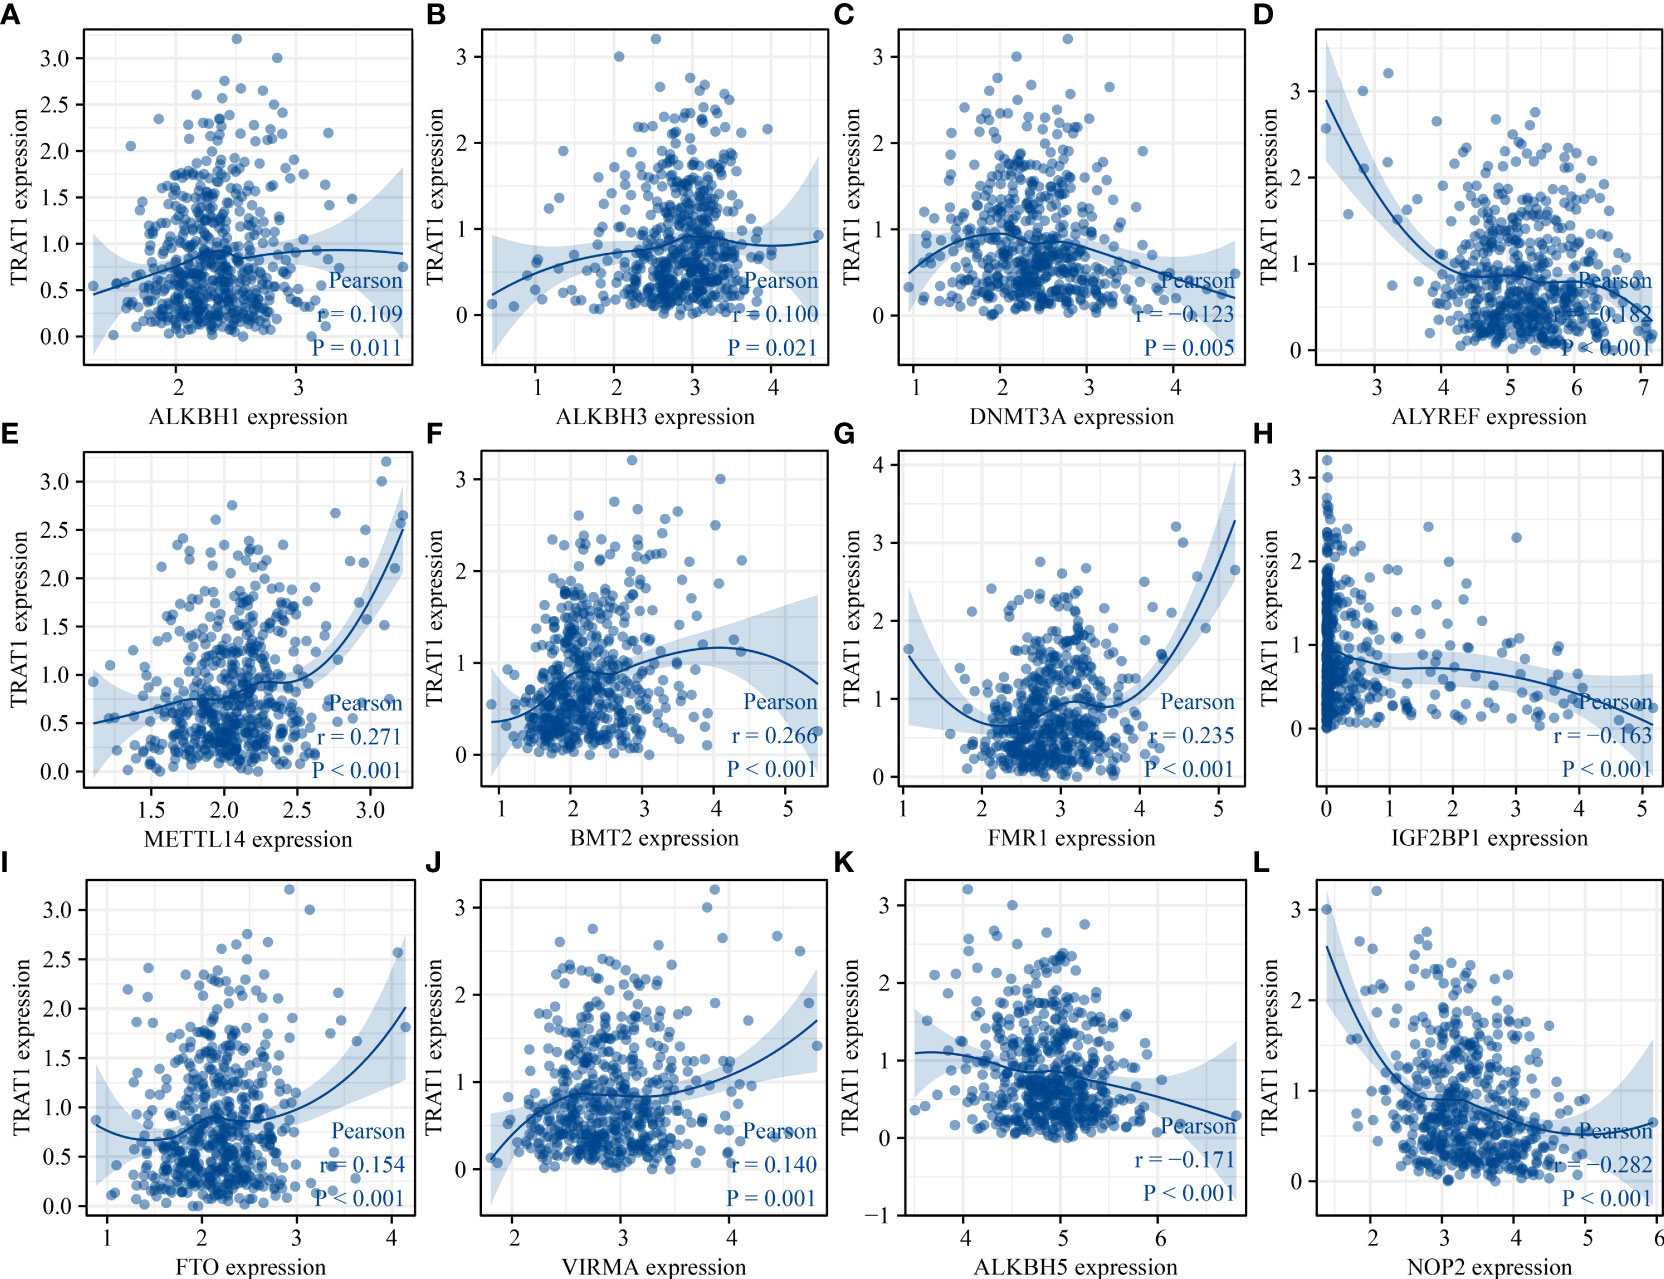
Figure 12 TRAT1 was associated with the RNA modification regulator genes. (A) ALKBH1; (B) ALKBH3; (C) DNMT3A; (D) ALYREF; (E) METTL14; (F) BMT2; (G) FMR1; (H) IGF2BP1; (I) FTO; (J) VIRMA; (K) ALKBH5; (L) NOP2.
Discussion
Studies have shown that oncogenes or tumour suppressor genes can promote or inhibit LAC progression (14, 16–18). The mRNA and protein expression levels of SPTBN2 in LAC tissues were significantly higher than those in normal tissues. Elevated SPTBN2 expression was associated with poor prognosis in patients with LAC. Interference with SPTBN2 inhibited the proliferation of A549 and H1299 cells. Interference with SPTBN2 expression resulted in decreased cell migration and invasion abilities compared to the control cell group (16). FYN is downregulated in LAC tissues and cells, and decreased FYN expression levels are associated with poor prognosis in patients with LAC. FYN overexpression significantly inhibited A549 cell viability, invasion, migration, and angiogenesis, accelerated cell apoptosis, and inhibited E-cadherin, vimentin, Snail, and PI3K/AKT protein expression in cancer cells (17). Our previous study found that the expression levels of TRAT1 in NSCLC, LAC, and LUSC tissues were significantly decreased, and the decreased expression level of TRAT1 was associated with poor prognosis in patients with cancer. In our study, we found that TRAT1 was associated with OS, PFS, smoking history, FEV1, PD-L1 expression, TMB, and response effects in patients with LAC. Additionally, TRAT1 co-expressed genes were found to be involved in cell differentiation, cell activation, cell-cell adhesion, and cell proliferation. In our cell model, elevated TRAT1 expression inhibited cell viability, migration, and invasion, and promoted apoptosis in A549 and H1299 cells. This suggests that TRAT1 may be involved in cell growth and migration as a tumour suppressor gene in LAC.
TRAT1 is a TCR regulator. We found that TRAT1 strongly co-expressed genes were involved in Th1, Th2, and Th17 cell differentiation and the TCR signalling pathway via KEGG analyses, which confirmed that TRAT1 was significantly associated with TCR. In addition, elevated TRAT1 expression might be involved in LAC progression through the Toll-like receptor and VEGF, MAPK, and MTOR signalling pathways, which are related to the progression of LAC (2, 19–23). For example, STAMBP expression is significantly increased in LAC cells and is closely related to tumour size, lymph node invasion, and tumour stage. STAMBP overexpression predicted shorter OS and disease-free survival in patients with LAC and promoted cell migration, invasion, and EGFR stabilization, whereas decreased STAMBP expression induces EGFR degradation. Small molecule inhibitors of EGFR and MAPK can block STAMBP-induced cell migration and invasion (21). DLC1 is significantly downregulated in LAC tissues and cells. DLC1 overexpression inhibits cell proliferation, migration, and invasion, whereas DLC1 downregulation promotes cell proliferation, migration, and invasion. DLC1 inhibits the proliferation and invasion of LAC cells by inhibiting the MAPK/ERK signalling pathway (22). However, the roles of TRAT1 overexpression and the Toll-like receptor, VEGF, MAPK, and other cancer signalling pathways need to be further confirmed in our models via western blotting. In addition, TRAT1 is associated with immunity (24, 25), and the immune microenvironment was significantly associated with LAC progression (26–28). For example, a meta-analysis by Brody et al. showed that high PD-L1 expression was associated with shorter survival. Anti-PD-1/PD-L1 drugs could improve the survival time of patients with cancer (28). In our research, we also found that the expression level of TRAT1 was significantly correlated with the levels of stromal, immune, and ESTIMATE scores, and was significantly correlated with the immune infiltration of CD8 T, cytotoxic, T, Th1, Th17, Treg, and other immune cell populations. TRAT1 expression was significantly correlated with the levels of CD8A, CD8B, CD3D, and other immune cell markers. The decreased expression of TRAT1 was associated with the prognosis of patients with LAC with basophils (decreased), natural killer T-cells (decreased), and type 2 T-helper cells (enriched). Preliminary evidence suggests that TRAT1 is an immune-related prognostic biomarker. However, the relationship between the expression level of TRAT1 in LAC and immune cells needs further study for verification.
Currently, RNA modification is one of the main mechanisms underlying cancer progression (29–34). For example, the m6A regulator gene METTL3 is overexpressed in lung cancer and associated with OS in patients with cancer. METTL3 overexpression can activate the PI3K/AKT/mTOR signalling pathway and mTOR-mediated protein synthesis in cancer cells to promote lung cancer progression (33). The m6A reader YTHDC2 is suppressed in LAC tissues. Decreased YTHDC2 expression levels are associated with poor clinical outcomes in patients with LAC. YTHDC2 reduces tumorigenesis in a mouse model and inhibits LAC cell progression. YTHDC2 inhibits cystine uptake through m6A recognition of the YTH domain, thus blocking the downstream antioxidation program. YTHDC2 destabilizes SLC7A11 mRNA in an m6A-dependent manner (34). Therefore, we explored the relationship between TRAT1 expression and RNA modification regulatory genes. We found that TRAT1 expression levels correlated with m6A, m1A, and m5C modification regulator genes (ALKBH1, ALKBH3, DNMT3A, and others).
The shortcomings of our study were the lack of LAC tissue specimens, which resulted in us not able to confirm the expression of TRAT1 in LAC tissues and the relationship between the expression levels of TRAT1 and prognosis of patients with cancer, which needs to be verified in the future. In addition, the elevated expression of TRAT1 is associated with cancer signalling pathways such as Toll-like receptor, VEGF, and MAPK pathways, which should be further confirmed by western blotting in the future. In conclusion, we found that TRAT1 could inhibit the progression of LAC, which was related to the prognosis of patients with LAC based on the results of a comprehensive analysis. Furthermore, TRAT1 expression levels were significantly correlated with immune cell infiltration and immune cell marker levels in LAC, which is worthy of further exploration. Our findings will provide a basis for the further investigation of the interaction between TRAT1 and the immune microenvironment for regulating LAC progression.
Data Availability Statement
Publicly available datasets were analysed in this study. Any additional data can be obtained from the corresponding author upon reasonable request.
Author contributions
S-HW and S-SC conceptualized and designed the study. QG and C-YW performed the research experiments and plotted graphs. X-YX, QG, and S-SC wrote the manuscript and supervised the experiments. S-SC, ST, J-LC, J-HW, and YD performed cell culture experiments, constructed LAC cell models, and performed functional studies. All authors have read the manuscript and agreed to its publication.
Funding
This work was supported by the Natural Science Foundation of China (No. 82100115, 82070431, 82100299, and 82100116), Natural Science Foundation of Hubei (No. 2020CFB392 and 2020CFB818), and Wuhan Municipal Health Commission Foundation(No. wx21Q38).
Acknowledgments
We would like to thank TCGA, cBioPortal, muTarget and Kaplan-Meier plotter databases for providing the LAC data used in our study.
Conflict of interest
The authors declare that the research was conducted in the absence of any commercial or financial relationships that could be construed as a potential conflict of interest.
Publisher’s note
All claims expressed in this article are solely those of the authors and do not necessarily represent those of their affiliated organizations, or those of the publisher, the editors and the reviewers. Any product that may be evaluated in this article, or claim that may be made by its manufacturer, is not guaranteed or endorsed by the publisher.
Supplementary material
The Supplementary Material for this article can be found online at: https://www.frontiersin.org/articles/10.3389/fonc.2022.960866/full#supplementary-material
References
1. Ding DX, Li Q, Shi K, Li H, Guo Q, Zhang YQ. LncRNA NEAT1-miR-101-3p/miR-335-5p/miR-374a-3p/miR-628-5p-TRIM6 axis identified as the prognostic biomarker for lung adenocarcinoma via bioinformatics and meta-analysis. Transl Cancer Res (2021) 10:4870–83. doi: 10.21037/tcr-21-2181
2. Zhu J, Ao H, Liu M, Cao K, Ma J. UBE2T promotes autophagy via the p53/AMPK/mTOR signaling pathway in lung adenocarcinoma. J Transl Med (2021) 19:374. doi: 10.1186/s12967-021-03056-1
3. Chen C, Guo Q, Song Y, Xu G, Liu L. SKA1/2/3 serves as a biomarker for poor prognosis in human lung adenocarcinoma. Transl Lung Cancer Res (2020) 9:218–31. doi: 10.21037/tlcr.2020.01.20
4. Watanabe K, Sakamaki K, Ito H, Yokose T, Yamada K, Nakayama H, et al. Impact of the micropapillary component on the timing of recurrence in patients with resected lung adenocarcinoma. Eur J Cardiothorac Surg (2020) 58:1010–8. doi: 10.1093/ejcts/ezaa138
5. Huang Y, Zhuang Q, Zhuang W. Mortal obligate RNA transcript inhibits cancer cell invasion and migration in lung adenocarcinoma by downregulating miRNA-223. Cancer Biother Radiopharm (2020) 35:345–50. doi: 10.1089/cbr.2019.3244
6. Zhang ZW, Chen JJ, Xia SH, Zhao H, Yang JB, Zhang H, et al. Long intergenic non-protein coding RNA 319 aggravates lung adenocarcinoma carcinogenesis by modulating miR-450b-5p/EZH2. Gene (2018) 650:60–7. doi: 10.1016/j.gene.2018.01.096
7. Zheng C, Li X, Ren Y, Yin Z, Zhou B. Long noncoding RNA RAET1K enhances CCNE1 expression and cell cycle arrest of lung adenocarcinoma cell by sponging miRNA-135a-5p. Front Genet (2020) 101348. doi: 10.3389/fgene.2019.01348
8. Ye JJ, Cheng YL, Deng JJ, Tao WP, Wu L. LncRNA LINC00460 promotes tumor growth of human lung adenocarcinoma by targeting miR-302c-5p/FOXA1 axis. Gene (2019) 685:76–84. doi: 10.1016/j.gene.2018.10.058
9. Xiao D, He J, Guo Z, He H, Yang S, Huang L, et al. Rhophilin-2 upregulates glutamine synthetase by stabilizing c-myc protein and confers resistance to glutamine deprivation in lung cancer. Front Oncol (2020) 10:571384. doi: 10.3389/fonc.2020.571384
10. Quan Q, Xiong X, Wu S, Yu M. Identification of immune-related key genes in ovarian cancer based on WGCNA. Front Genet (2021) 12:760225. doi: 10.3389/fgene.2021.760225
11. Liu CH, Lin BS, Wu MY, Song YC, Ke TW, Chou YL, et al. Adoptive transfer of IL-4 reprogrammed Tc17 cells elicits anti-tumour immunity through functional plasticity. Immunology (2022) 166:310–26. doi: 10.1111/imm.13473
12. Lee H, Kwon MJ, Koo BM, Park HG, Han J, Shin YK. A novel immune prognostic index for stratification of high-risk patients with early breast cancer. Sci Rep (2021) 11:128. doi: 10.1038/s41598-020-80274-5
13. Bie LY, Li D, Mu Y, Wang S, Chen BB, Lyu HF, et al. Analysis of cyclin e co-expression genes reveals nuclear transcription factor y subunit alpha is an oncogene in gastric cancer. Chronic Dis Transl Med (2019) 5:44–52. doi: 10.1016/j.cdtm.2018.07.003
14. Guo Q, Liu XL, Liu HS, Luo XY, Yuan Y, Ji YM, et al. The risk model based on the three oxidative stress-related genes evaluates the prognosis of LAC patients. Oxid Med Cell Longev (2022) 2022:4022896. doi: 10.1155/2022/4022896
15. Pan JH, Zhou H, Cooper L, Huang JL, Zhu SB, Zhao XX, et al. LAYN is a prognostic biomarker and correlated with immune infiltrates in gastric and colon cancers. Front Immunol (2019) 10:6. doi: 10.3389/fimmu.2019.00006
16. Wu C, Dong B, Huang L, Liu Y, Ye G, Li S, et al. SPTBN2, a new biomarker of lung adenocarcinoma. Front Oncol (2021) 11:754290. doi: 10.3389/fonc.2021.754290
17. Xue F, Jia Y, Zhao J. Overexpression of FYN suppresses the epithelial-to-mesenchymal transition through down-regulating PI3K/AKT pathway in lung adenocarcinoma. Surg Oncol (2020) 33:108–17. doi: 10.1016/j.suronc.2020.02.002
18. Zeng X, Wang H, He D, Jia W, Ma R. LIMD1 increases the sensitivity of lung adenocarcinoma cells to cisplatin via the GADD45α/p38 MAPK signaling pathway. Front Oncol (2020) 10:969. doi: 10.3389/fonc.2020.00969
19. Jungnickel C, Schnabel PA, Bohle R, Wiewrodt R, Herr C, Bals R, et al. Nontypeable haemophilus influenzae-promoted proliferation of kras-induced early adenomatous lesions is completely dependent on toll-like receptor signaling. Am J Pathol (2017) 187:973–9. doi: 10.1016/j.ajpath.2017.01.003
20. Wang Y, Zhang F, Wang J, Hu L, Jiang F, Chen J, et al. lncRNA LOC100132354 promotes angiogenesis through VEGFA/VEGFR2 signaling pathway in lung adenocarcinoma. Cancer Manag Res (2018) 10:4257–66. doi: 10.2147/CMAR.S177327
21. Xu H, Yang X, Xuan X, Wu D, Zhang J, Xu X, et al. STAMBP promotes lung adenocarcinoma metastasis by regulating the EGFR/MAPK signaling pathway. Neoplasia (2021) 23:607–23. doi: 10.1016/j.neo.2021.05.011
22. Niu N, Ma X, Liu H, Zhao J, Lu C, Yang F, et al. DLC1 inhibits lung adenocarcinoma cell proliferation, migration and invasion via regulating MAPK signaling pathway. Exp Lung Res (2021) 47:173–82. doi: 10.1080/01902148.2021.1885524
23. Odintsov I, Mattar MS, Lui AJW, Offin M, Kurzatkowski C, Delasos L, et al. Novel preclinical patient-derived lung cancer models reveal inhibition of HER3 and mTOR signaling as therapeutic strategies for NRG1 fusion-positive cancers. J Thorac Oncol (2021) 16:1149–65. doi: 10.1016/j.jtho.2021.03.013
24. Kirchgessner H, Dietrich J, Scherer J, Isomäki P, Korinek V, Hilgert I, et al. The transmembrane adaptor protein TRIM regulates T cell receptor (TCR) expression and TCR-mediated signaling via an association with the TCR zeta chain. J Exp Med (2001) 193:1269–84. doi: 10.1084/jem.193.11.1269
25. Bruyns E, Marie-Cardine A, Kirchgessner H, Sagolla K, Shevchenko A, Mann M, et al. T Cell receptor (TCR) interacting molecule (TRIM), a novel disulfide-linked dimer associated with the TCR-CD3-zeta complex, recruits intracellular signaling proteins to the plasma membrane. J Exp Med (1998) 188:561–75. doi: 10.1084/jem.188.3.561
26. Liu XS, Zhou LM, Yuan LL, Gao Y, Kui XY, Liu XY, et al. NPM1 is a prognostic biomarker involved in immune infiltration of lung adenocarcinoma and associated with m6A modification and glycolysis. Front Immunol Front Immunol (2021) 12:724741. doi: 10.3389/fimmu.2021.724741
27. Chen L, Cao MF, Xiao JF, Ma QH, Zhang H, Cai RL, et al. Stromal PD-1+ tumor-associated macrophages predict poor prognosis in lung adenocarcinoma. Hum Pathol (2020) 97:68–79. doi: 10.1016/j.humpath.2019.12.007
28. Brody R, Zhang Y, Ballas M, Siddiqui MK, Gupta P, Barker C, et al. PD-L1 expression in advanced NSCLC: Insights into risk stratification and treatment selection from a systematic literature review. Lung Cancer (2017) 112:200–15. doi: 10.1016/j.lungcan.2017.08.005
29. Wang E, Li Y, Ming R, Wei J, Du P, Zhou P, et al. The prognostic value and immune landscapes of a m6A/m5C/m1A-related LncRNAs signature in head and neck squamous cell carcinoma. Front Cell Dev Biol (2021) 9:718974. doi: 10.3389/fcell.2021.718974
30. Li J, Zuo Z, Lai S, Zheng Z, Liu B, Wei Y, et al. Differential analysis of RNA methylation regulators in gastric cancer based on TCGA data set and construction of a prognostic model. J Gastrointest Oncol (2021) 12:1384–97. doi: 10.21037/jgo-21-325
31. Li J, Momen-Heravi F, Wu X, He K. Mechanism of METTL14 and m6A modification of lncRNA MALAT1 in the proliferation of oral squamous cell carcinoma cells. Oral Dis (2022). doi: 10.1111/odi.14220
32. Zhu Y, Peng X, Zhou Q, Tan L, Zhang C, Lin S, et al. METTL3-mediated m6A modification of STEAP2 mRNA inhibits papillary thyroid cancer progress by blocking the hedgehog signaling pathway and epithelial-to-mesenchymal transition. Cell Death Dis (2022) 13:358. doi: 10.1038/s41419-022-04817-6
33. Cheng FW, Peng LM, Luo D. Methyltransferase-like 3 promotes the progression of lung cancer via activating PI3K/AKT/mTOR pathway. Clin Exp Pharmacol Physiol (2022) 49:748–58. doi: 10.1111/1440-1681.13647
Keywords: T cell receptor associated transmembrane adaptor 1, lung adenocarcinoma, T-cell receptor, immune microenvironment, RNA modification
Citation: Xiao X-Y, Guo Q, Tong S, Wu C-Y, Chen J-L, Ding Y, Wan J-H, Chen S-S and Wang S-H (2022) TRAT1 overexpression delays cancer progression and is associated with immune infiltration in lung adenocarcinoma. Front. Oncol. 12:960866. doi: 10.3389/fonc.2022.960866
Received: 04 August 2022; Accepted: 16 September 2022;
Published: 06 October 2022.
Edited by:
Shihori Tanabe, National Institute of Health Sciences (NIHS), JapanReviewed by:
Zhiguo Luo, Hubei University of Medicine, ChinaZhu Wang, Shenzhen Longhua People’s Hospital, China
Copyright © 2022 Xiao, Guo, Tong, Wu, Chen, Ding, Wan, Chen and Wang. This is an open-access article distributed under the terms of the Creative Commons Attribution License (CC BY). The use, distribution or reproduction in other forums is permitted, provided the original author(s) and the copyright owner(s) are credited and that the original publication in this journal is cited, in accordance with accepted academic practice. No use, distribution or reproduction is permitted which does not comply with these terms.
*Correspondence: Si-Hua Wang, c2lodWFfd2FuZ0AxMjYuY29t; Shan-Shan Chen, Y2hlbnNoYW5zaGFuQHp4aG9zcGl0YWwuY29t
 Xiao-Yue Xiao1
 Qiang Guo
 Song Tong
 Chuang-Yan Wu
 Jun-Hao Wan
 Shan-Shan Chen
 Si-Hua Wang