 Vishnu S. Mishra
 Sachin Patil
 Puli Chandramouli Reddy
 Bimlesh Lochab
94% of researchers rate our articles as excellent or good
Learn more about the work of our research integrity team to safeguard the quality of each article we publish.
Find out more
ORIGINAL RESEARCH article
Front. Oncol., 16 August 2022
Sec. Pharmacology of Anti-Cancer Drugs
Volume 12 - 2022 | https://doi.org/10.3389/fonc.2022.953098
This article is part of the Research TopicBiological Aspects of Targeted Drug Discovery: Development of Novel Targets and/or Chemotherapies, and Drug RepurposingView all 16 articles
Glioblastoma multiforme (GBM) is known as the primary malignant and most devastating form of tumor found in the central nervous system of the adult population. The active pharmaceutical component in current chemotherapy regimens is mostly hydrophobic and poorly water-soluble, which hampers clinical implications. Nanodrug formulations using nanocarriers loaded with such drugs assisted in water dispersibility, improved cellular permeability, and drug efficacy at a low dose, thus adding to the overall practical value. Here, we successfully developed a water-dispersible and biocompatible nanocargo (GO-PEG) based on covalently modified graphene oxide (GO) with a 6-armed poly(ethylene glycol) amine dendrimer for effective loading of the two hydrophobic anticancer drug molecules, CPI444 and vatalanib. These drug molecules target adenosine receptor (A2AR), vascular endothelial growth factor receptor (VEGFR), platelet-derived growth factor receptor (PDGFR), and type III stem cell receptor tyrosine kinase (c-KIT), which plays a crucial role in cancers. The effective cellular delivery of the drugs when loaded on GO-PEG is attributed to the increased permeability of the drug-nanoconjugate formulation. We observed that this combinatorial drug treatment with nanocargo resulted in a significant reduction in the overall cell survival as supported by reduced calcium levels and stem cell markers such as Oct4 and Nanog, which are two of the prime factors for GBM stem cell proliferation. Furthermore, reduced expression of CD24 upon treatment with nanoformulation impeded cellular migration. Cellular assays confirmed inhibition of cell proliferation, migration, and angiogenic potential of GBM treated with GO-PEG–Drug conjugates. Ultimately, GBM U87 cells assumed programmed cell death at a very low concentration due to nanocarrier-mediated drug delivery along with the chosen combination of drugs. Together, this study demonstrated the advantage of GO-PEG mediated combined delivery of CPI444 and vatalanib drugs with increased permeability, a three-pronged combinatorial strategy toward effective GBM treatment.
Neuro-oncology is a challenging area dealing with malignancies of the brain and spinal cord. Among all the central nervous system (CNS) cancers, glioblastoma multiforme (GBM) is a rare-grade 4 glioma (1) that emerges from glial cells and is one of the most malignant and aggressive forms of brain tumor. The incidence rate of GBM is about 2–3 per 100,000 individuals every year, with a survival rate of around 15 months (2). The major challenge in treating GBM is their physical isolation by the blood–brain barrier (BBB), which restricts their accessibility to many drugs. Another important feature is the multilevel molecular and cellular heterogeneity (3). In particular, due to stem cell heterogeneity, GBM can overcome the loss of a cell type upon chemotherapy by other cell types and quickly evolve. Owing to the complex nature of GBM, a multifaceted approach by which divergent properties of GBM can be targeted with a better drug delivery system is the need of the hour.
Glioblastoma tumors exhibit abnormal vasculature that promotes tumor hypoxia, eventually leading to treatment resistance. One of the major players, vascular endothelial growth factor (VEGF), contributes to the abnormal vasculature and could be a prime target to treat GBM (4). VEGF and its signaling pathway have been most extensively explored in context with angiogenesis in tumors, including GBM (5), and have been targeted by various chemotherapeutic drugs like tivozanib, sorafenib, and others. Bevacizumab, a humanized mAb (mono clonal antibody) against VEGF, is the first and only FDA (U.S. Food and Drug Administration) approved immunotherapy for GBM. However, it has been suggested that bevacizumab increases progression-free survival but does not significantly increase the overall survival of the patients (6). Another anti-angiogenic drug, vatalanib (PTK787), is a tyrosine kinase inhibitor of all VEGF (VEGFR-1, -2, and -3) receptors, platelet-derived growth factor receptor-β (PDGFR-β), and proto-oncogene, c-kit (4, 7). This drug has been shown to be well tolerated by cancer patients (8, 9). A recent study using vatalanib in a mouse model for Alzheimer’s disease (AD) has demonstrated its capability to cross the BBB and cause reduced AD pathology (10). A previous report also indicated that vatalanib can be effective in treating gliomas (11). These studies suggest that vatalanib could be effective in targeting the characteristic angiogenic properties of GBM along with a suitable partner to tackle heterogeneous nature of GBM.
Another emerging target of various cancers is the A2A adenosine receptor (A2AR). It is a guanine nucleotide-binding protein, and a G-protein coupled adenosine receptor and acts through mitogen-activated protein kinase (MAPK) and protein kinase A (PKA), signaling converging at the cyclic adenosine monophosphate (cAMP) response element (CREB) (12). This signaling axis regulates various cellular processes such as neuronal plasticity, neuroprotection, vasodilation, and immunosuppression (13). In glial cells, purinergic signaling has been shown to be modulated by various stress factors such as hypoxia, pro-inflammatory cytokines such as tumor necrosis factor-α (TNF-α), interleukin-1β (IL-1β) by elevated A2A receptor (13). These dynamics in A2A receptor mediated signaling affect various cellular processes of glial cells such as proliferation, differentiation, and apoptosis (14). Among these, targeting the immunosuppressive properties of purinergic signaling has been explored as a potential cancer therapy by using various antagonists to this pathway (15–17). Moreover, due to the neuronal origin of GBM, targeting A2A receptor mediated signaling may also affect different cellular functions. Therefore, choosing the A2A receptor antagonist might prove a double-edged sword.
CPI444, an antagonist of the human A2A receptor (18), is one of the earliest drugs evaluated in cancer therapies (19, 20). This drug has shown promising antitumor activity by increasing the CD8+ (cluster of differentiation 8 positive) T-cell infiltration due to blockage of adenosine activity (20). CPI444 also exhibited 66-fold higher inhibition specificity in A2A receptor over the A1 receptor (18). A recent report indicates the promising tolerance of this drug by renal cancer patients (19). Moreover, a recent study by Corvus Pharmaceuticals, Inc. has shown a minimum of 15% of CPI444 crossing BBB (21). Therefore, CPI444 is a viable choice to targeting divergent cellular mechanisms associated with GBM.
Nanoparticles have been widely explored as a carrier in the past few decades to improve the efficacy and reduce the side effects of anticancer drugs. Graphene and functionalized graphene derivatives offer unique physico-chemical properties and are the most widely explored nanocargos to deliver payloads such as drugs, nucleotides, proteins, etc. (22, 23). Graphene assists in excellent loading of hydrophobic cancer drugs by either non-covalent or covalent interactions due to its two-dimensional planar nanoarchitecture and a very high specific area. The ease of its preparation via chemical oxidation of graphite, followed by exfoliation to form graphene oxide (GO) nanoflakes, resulted in well-exposed oxygen-enriched functionalities such as hydroxyl, carbonyl, carboxyl, and epoxide. These multiple surface functionalities on GO provide excellent aqueous dispersion stability and scope of derivatization to impart biocompatibility and tuning capabilities to modulate charge, size, etc., essential for the delivery of anticancer drugs. In the past, several efforts have been made to amplify biocompatibility, aqueous stability and opsonization with a prolonged blood circulation time of GO, by functionalization with poly(ethylene glycol) (PEG), FDA approved polymer (24, 25). There are several reports on using GO-PEG to deliver several cancer drug molecules such as doxorubicin, cis-platin, camptothecin, etc. However, single drug-based conventional therapeutic approaches are not successful due to the complexity of the tumors and may cause drug resistance. Usage of multiple drugs is an attractive option where each component has a specific role to play and mitigates heterogeneity associated with the tumors. Various physical properties of drugs, such as molecular size, solubility, stability, and cellular delivery, are an important aspect of combinatorial drug treatment. However, their optimal dosage reaching the tumor site is essentially important for effective cancer treatment. This demands exploration of rational design of nanocarriers which can efficiently load multiple drugs and assist cellular delivery in the desired ratio to enable synergistic interactions, if any, with improved chemotherapeutic potential. Additionally, independent studies have demonstrated that GO-based nanostructures, including GO-PEG, can cross the BBB (26, 27) and are used in drug delivery for tageting glioma (28). This property proves invaluable, especially in the treatment of GBMs where crossing the BBB is a major hurdle for many chemotherapeutic agents.
In this work, a GO-PEG nanodrug delivery system is designed, synthesized, and characterized for the combinatorial therapy of two drug molecules, CPI444 and vatalanib. The drug molecules are separately loaded on GO-PEG and then combined in an optimal ratio to form a nanoformulation. The effective ratio of the two drugs was predetermined using a carrier-free in vitro experiment in the GBM U87 cell line. The current combinatorial therapeutic approach may provide new avenues and directions to the forefront of several therapeutic and developmental chemotherapy regimens.
Graphite flakes (Alfa Aesar, 99.8%, natural graphite 325 mesh), 6-arm PEG-amine (JenKem Technology, 15 kDa), sulfuric acid (H2SO4, Rankem, 95%−98%), potassium permanganate (KMnO4, Aldrich, 99%), phosphoric acid (H3PO4), hydrogen peroxide (30% w/v) and potassium hydroxide (KOH, powder) from Finar Scientific, Vatalanib (cat#A3969, APExBIO), CPI444 (cat#1202402-40-1, MedChemExpress), and GBM U87 cell lines were obtained from the National Centre for Cell Sciences (NCCS) Pune. The origin of GBM U87 (or U-87 MG) is a malignant glioma from a human male patient with epithelial morphology. It is from the primary brain tumor and grade IV glioma according to the WHO classification (29). MEM (Minimum Essential Medium Eagle, Cat#AL080A) media, trypsin-EDTA solution 1× 0.25% (Cat#TCL007), FBS (Fetal Bovine Serum, Cat#RM10681), antibiotic solution (penicillin and streptomycin), and PBS (Dulbecco’s Phosphate Buffered Saline, powder pH 7.4) were purchased from HiMEDIA, India. Fluorescein isothiocyanate (FITC, Invitrogen) and CCK-8 (Cell Counting Kit-8/Cytotoxicity assay kit) were purchased from Dojindo Molecular Technologies, USA.
A Thermo Scientific Evolution 201 UV−visible spectrophotometer was used to measure the absorbance in a 1 cm quartz cuvette over the range of 200−800 nm. A Nicolet iS20 mid-infrared FTIR spectrometer equipped with an interferometer with KBr/Ge coated beam splitter, deuterated triglycine sulfide (DTGS) detector, and attenuated total reflectance diamond (iD5-ATR) accessory was used to measure the Fourier transform infrared (FTIR) in the range of 4,000 to 450 cm−1 with a resolution of 0.25 cm−1. A Jobin Yvon HR800 Raman microscope was used for Raman analysis of nanomaterials at a wavelength (λ) of 514 nm. Disorder and defects in graphitic materials were measured by the ratio of the intensity of D and G bands, i.e., (ID/IG). Structure disorder in the graphite network raises the intensity ratio and is inversely proportional to the average sp2 cluster size. The distance between defect points (LD) in the GO samples was calculated from the intensities of the D (sp2-hybridized carbon breathing mode) and G (graphitic sp2-hybridized carbon) bands in the Raman spectra using the Tuinstra–Koenig relation, (C × λ = 102 nm2), using Equation (1) (30).
The average crystallite size (La) of the sp2 domains in the synthesized GOs was determined by Equation (2),
A Rigaku Smart Lab X-ray diffractometer was used to study the powder X-ray diffraction (PXRD) of nanoparticles using Cu-Kα radiation (λ = 0.154 nm) over a 2θ scan range of 4° to 60°, where θ is the Bragg angle. A Mettler Toledo thermogravimetric analyzer (TGA) with a built-in gas controller (TGA2 SF/1100) and fitted with an XP1U TGA balance (ultra-micro balance) was used to study the thermodynamic properties of nanoparticles in a temperature range from 50 to 700°C in a nitrogen atmosphere at a flow rate of 50 ml min−1 and a heating rate of 10°C min−1. The surface chemistry of nanomaterials was analyzed by X-ray photoelectron spectroscopy (XPS) (Omicron multiprobe surface analysis system) using a monochromatized AlKα (1,486.7 eV) radiation source. A dynamic light scattering (DLS) instrument (Nanosizer, Malvern, UK) was used to measure hydrodynamic particle size and zeta potential (ζ) using an argon laser at a λ = 633 nm, with a detector angle of 90°, at room temperature.
GO was prepared from graphite powder using a previously reported method (23). Graphite powder (1.0 g) was oxidized by a mixture of concentrated sulfuric acid and phosphoric acid (134:15 ml, v/v) followed by the addition of potassium permanganate (6.0 g) at room temperature. The reaction mixture was stirred at 50°C for 12 h, and after that allowed to cool to room temperature before the slow addition of a mixture of ice-cold water: H2O2 (250:3 ml) with vigorous stirring. A color change from dark brown to yellow is noticed. Upon gravity settling, GO particles settled down and the supernatant was decanted. The so-obtained residue was washed multiple times with water and GO as the residue was separated by centrifugation (Eppendorf 5425 R) at 11,000 rpm. This process was repeated until the pH of the supernatant became neutral. Finally, the brown slurry obtained was dried under vacuum on a rotary evaporator at 50°C and GO was obtained as a black powder (2.3 g).
An aqueous dispersion of GO (0.5 mg/ml, 20 ml) was prepared in deionized water by probe sonication for 2 min (Sonics USA, 500 W, 20 kHz) at 40% maximum amplitude and a pulse rate of 10 s (on and off) followed by bath sonication for 2 h. To this GO dispersion, 6-armed PEG amine (60 mg) and KOH (80 mg) were added. The reaction mixture was stirred vigorously at 80°C for 24 h. Finally, GO-PEG was obtained by purifying the reaction mixture by dialysis membrane (mol. weight cut-off = 10 kDa) against deionized water for 24 h to remove the excess or unbound 6-armed PEG amine. The GO-PEG dispersion was stored at 4°C.
A stock solution of CPI444 (1.1 mg) was prepared in a cosolvent mixture of water and tetrahydrofuran (1:1 v/v, 2 ml) and mixed with the prepared dispersion of GO-PEG (0.5 mg/ml, 2 ml). The resultant mixture was stirred vigorously at room temperature for 24 h. Excess or unbound CPI444 was removed by dialysis membrane (mol. weight cut-off = 10 kDa) against deionized water (50 ml × 4) for 24 h. Removal of excessive unbound amounts of CPI444 on GO-PEG was monitored and calculated using UV–visible spectroscopy at a maximum absorption wavelength (λmax) of CPI444 at 356 nm. The so-formed CPI444@GO-PEG nanoconjugate was stored at 4°C for further study. Similarly, vatalanib@GO-PEG was also prepared following the same method. In brief, a stock solution of vatalanib (1.01 mg) was prepared in a cosolvent mixture of water and tetrahydrofuran (1:1 v/v, 2 ml) and mixed with the prepared dispersion of GO-PEG (0.5 mg/ml, 2 ml) and dialyzed. For CPI444 + vatalanib@GO-PEG, optimal amounts of CPI444@GO-PEG and vatalanib@GO-PEG (with the same drug combination, 1:1 molar ratio, as without GO-PEG) were premixed and probe sonicated for 2 min to homogenize, just prior to study.
To determine the loading of CPI444 on GO-PEG, UV–vis spectroscopy measurements were carried out. A standard curve of CPI444 (linear fitting with R2 = 0.99505) at different concentrations was plotted at a λmax of 356 nm. After the reaction completion of the CPI444@GO-PEG preparation, an unbound or excess amount of leached out CPI44 drug, during dialysis, was calculated using a standard curve and subtracted from the added amount of drug. The percentage loading and encapsulation efficacy were calculated using Equation (3) and Equation (4), respectively.
Similarly, the percentage loading and encapsulation efficacy of vatalanib on GO-PEG were determined using the same protocol as in the case of CPI444 on GO-PEG, by UV–vis spectroscopy. The standard curve of vatalanib (linear fitting with R2 = 0.99665) at different concentrations was plotted at a λmax of 335 nm.
Glioblastoma multiforme (Human) cancer cell line GBM U87 was cultured in Minimum Essential Media (MEM) containing 10% FBS and 1% antibiotic (penicillin/streptomycin) solution in a humidified cell culture incubator (Galaxy 170R, Eppendorf) containing 5% CO2 at 37°C.
The cell viability study of pristine drugs (CPI444, vatalanib, and CPI444 + vatalanib), GO-PEG, and respective drug–GO-PEG nanoconjugates (CPI444@GO-PEG, vatalanib@GO-PEG, and CPI444 + vatalanib@GO-PEG) were assessed using the CCK-8 kit (Cat#CK04, Dojindo). The GBM U87 cells were seeded into a fresh 96-well flat-bottom plate at a density of 5,000 cells/well. After cells were attached for 18–24 h, they were treated separately with pristine drugs (2–60 µM), GO-PEG (2–20 µg/ml), and nanoconjugates (with a drug loading of 1–30 µM) at different concentrations for 48 h. After the treatment, 10 µl of CCK-8 solution was added to each well. Optical density (OD) at a λ of 450 nm was recorded on a microplate reader (BioRad). All the experiments were repeated three times independently. The relative percentage of absorbance was calculated, considering control as cent percent.
GBM U87 cells were seeded in a 60 mm culture dish and treated with FITC-tagged GO-PEG with a concentration of 0 µg/ml (untreated negative control), 5 µg/ml, 10 µg/ml, and 15 µg/ml. After 24 h, cells were harvested using trypsin. Cells were washed with 1× PBS twice and then resuspended in 500 µl of 1× PBS + 0.1% FBS solution. The cells were analyzed using a CytoFLEX flow cytometer and 10,000 events were acquired for each sample.
GBM U87 cells were seeded in a 60 mm dish and, after 18 h, cells were subjected to target drug formulations with appropriate controls. After 48 h of treatment, the cells were harvested and processed for FACS analysis.
Harvested cells were incubated in 3 µM concentration of Fluo-4AM dye (cat#F14201, Life technologies) in dark at room temperature for 20 min. After incubation, cells were washed twice with 1× PBS and resuspended in 500 µl of 1× PBS solution with 0.1% FBS solution.
Here, cells were washed twice with 1× PBS and then resuspended in a 1× PBS solution with 0.1% FBS. Cells were stained with CD24 mAb-FITC (cat#MHCD2401) at a concentration of 1:100 for 45 min in the dark at room temperature. Cells were collected and resuspended in 500 µl of 1× PBS solution with 0.1% FBS solution.
The cell suspensions were analyzed using a CytoFLEX flow cytometer and 10,000 events were acquired for each sample.
Transwell inserts (24 well, 8 μm pore size; HiMEDIA) were used to assess the migratory abilities of cells. Pre-treated GBM U87 cells with GO-PEG, CPI444 + vatalanib, and CPI444 + vatalanib@GO-PEG along with untreated control for 48 h were used for this assay. The treated cells were suspended at a final density of 3.5 × 10⁴ cell/ml in a serum-free medium and seeded in the upper-well of the chamber. The lower-well of the chamber contained media supplemented with 10% FBS. After 24 h, cells on the surface of the upper-well were removed by a cotton swab. Cells that had migrated through the filter to the lower chamber were fixed in 4% paraformaldehyde and stained with 1% crystal violet. Cells were counted from three randomly selected fields per each chamber under a microscope (ECLIPSE Ti, Nikon).
Cells were seeded in a 60 mm dish and treated with drugs as mentioned above for 48 h. Cells were harvested and re-suspended in media. Meanwhile 12-well plate coated with 50 μM poly-L-lysine (cat#P3513, Sigma) for 1 h at room temperature. Treated/untreated GBM U87 cells were harvested and suspended at a final density of 3 × 10⁵ cells/ml and plated on poly-L-lysine-coated plates for 30 min. After that, unattached cells were removed by inverting the 12-well plate and gently washing twice with 1× PBS. The attached cells were fixed in ice-cold methanol for 10 min at room temperature. After a wash with 1× PBS, cells were stained with 1% crystal violet stain for 5 min with gentle shaking. The plate was washed with water and kept for drying. After that, images were captured by a color camera. Later, stain was solubilized into 1 ml of 1% sodium dodecyl sulfate (SDS) for 1 h and collected in fresh 1.5 ml centrifuge tubes. Absorbance was recorded at 595 nm (Bio-Rad microplate reader) in a 96-well plate in four replicates. The absorbance value of the control sample was converted to 100% and relative percentage changes in other treatment conditions were calculated.
GBM U87 cells were harvested and seeded in a 60 mm dish for the invadopodia experiment. The cells were treated with specific drugs and GO-PEG–drug conjugates for 48 h following the procedure mentioned above. Prepared fluorescent gelatin-coated coverslips according to the protocol (31). Briefly, GBM U87 cells were harvested and plated on coverslip in 60%–70% confluency which was already coated with gelatin labeled with oregon green 488 (cat#G13186, Life technologies). After that, the coverslip with the cells was transferred to a CO2 incubator for 15 h for the initiation of the gelatin degradation. After 15 h of incubation, the coverslip was taken out of the plate and quickly fixed with 4% formaldehyde for 10–15 min at room temperature. The fixation solution was removed and washed with 1× PBS twice. Blocking and permeabilization were performed with a solution (3% BSA in 1× PBS containing 0.1% Triton X-100) for 15–20 min at room temperature in the dark. The blocking solution was removed and washed with 1× PBS twice. This was probed with Alexa Fluor 555 Actin-Phalloidin (1:500 dilution) for 30–40 min in the dark. Actin-Phalloidin was removed and washed with 1× PBS twice, and after that, the coverslip was mounted by inverting it over a glass slide containing a drop of mounting medium ProLong™ Gold antifade reagent with Hoechst (Invitrogen). The slides were dried and sealed with colorless nail paint. Images were taken under a Nikon Fluorescent Microscope (at ×60) for visual comparison.
To perform a 2D colony forming assay, cells were seeded in 6-well plates and then treated with various combinations of test drugs for 48 h. After 48 h, treated/untreated cells were placed in fresh 6-well plates at a cell density of 1,000 cells/well. Every third day, the media was replenished until control well-achieved confluency. The experiment was observed for up to 12 days and images were captured under a microscope (DIC imaging, ECLIPSE Ti, Nikon). Then, cells were fixed in 4% paraformaldehyde for 10 min and stained with crystal violet stain for 10 min. After washing the plates with water slowly, cells were collected in 1% SDS and absorbance was measured at 595 nm. The relative absorbance was compared to control sample in percentages (control was treated as cent percent).
The tube formation assay and cytokine array analysis were conducted as described previously (32). Briefly, primary endothelial cells were cultured and incubated with conditioned media of treated and untreated cells. Tube formation was analyzed after 4 h and images were captured. The number of branches and nodes was calculated manually and the same was shown as bar plots. For proteome array analysis, total cell lysate of all treated cells was collected and quantified by Bradford reagent. An equal amount of protein was loaded on each membrane for 24 h and developed as per the protocol of the manufacturer (cat#ARY010, R&D systems).
The effect of treatment of CPI444 and vatalanib@GO-PEG on apoptotic markers (proteins) was tested. Here, after 48 h of treatment with test drug formulations and appropriate controls, total cell lysate was prepared and quantified using Bradford reagent. Proteins were separated by 10% sodium dodecyl sulfate–polyacrylamide gel electrophoresis (SDS-PAGE) for 3 h. The proteins were transferred onto the polyvinylidene fluoride (PVDF) membrane after blocking blots were incubated with primary antibodies overnight at 4°C. The blots were washed and developed using appropriate horseradish peroxidase (HRP)-conjugated secondary antibodies following a standard protocol using chemiluminescent substrate (SuperSignal™ West Pico PLUS, cat#34580, ThermoFischer). The images were acquired by the FluorChem E system and densitometry was carried out by ImageJ software.
Primary antibodies: anti-PARP in Rabbit, cat#ITM3132; Anti-Bcl2 in Mouse, cat#ITT5756 and anti-β-actin in Rabbit from G-biosciences
Secondary antibodies: HRP-Goat-anti-Rabbit, cat#SE134 from G-biosciences and HRP-Goat-anti-Mouse, 554002 from BD biosciences.
The statistical analyses were performed using the GraphPad Prism Version 7.04 software. Here, the Student’s two-tailed t-test was performed using the mean from the minimum of three independent observed values, and respective p-values are reported.
The preparation of GO-PEG from graphite proceeds in two steps, as illustrated in Figure 1. In the first step, graphene oxide (GO) was prepared from graphite using the modified Hummer’s method. This involved chemical oxidation of graphite by acidified potassium permanganate. This method provides the benefit of keeping the graphitic planes relatively intact, and oxidation occurs mainly on the edges to introduce oxo-functionalities. The fewer defect in the basal plane ensures swift binding and efficient loading of the highly aromatic drug molecules via π-π stacking. The oxygen-rich functionalities such as carboxyl and hydroxyl groups are necessary to improve the aqueous dispersion stability of the GO nanoparticles, while epoxide and carbonyl groups on the basal plane are desired for the covalent modification of the GO (24). In the second step, the epoxide and carbonyl groups on GO were reacted with the 6-armed PEG-amine to form PEGylated graphene oxide, GO-PEG. The reaction is favored in alkaline medium and proceeded by base mediated nucleophilic ring-opening and addition reaction. This led to the enrichment of the surface of nanoparticles with an enormous number of covalently-linked free amine groups, in addition to the existing carboxyl and hydroxyl functionalities. As a result, the subsequent increase in polar functionalities in GO-PEG occurs to offer hydrophilic properties to the prepared nanocarrier. Following the purification, both GO and GO-PEG were characterized by various techniques. Figure 2A shows the FTIR spectra of GO and GO-PEG. The successful synthesis of GO from graphite was confirmed by the presence of oxygen-rich functionalities. The characteristic peaks at 3,400 cm−1, 1,740 cm−1, 1,590 cm−1, 1,412 cm−1 and 1,050 cm−1 are assigned to the O–H (of carboxylic group), >C=O (carbonyl), C=C (aromatic, sp2 hybridized carbon), O–H (adsorbed water) and C–O–C (epoxide ring) vibrations, respectively. The FTIR spectrum of GO-PEG is grossly dissimilar to GO, and clearly the carbonyl-related stretch is relatively vanished. Additionally, several new IR vibrations at 3,390 cm−1, 2,868 cm−1, and 1,250 cm−1 for the N–H stretching, C–H stretching, and C–H deformation vibrations, respectively, are observed. It is evident that the intensity of C–O–C stretching vibration at 1,050 cm−1 substantially increased in GO-PEG, which is due to the large number of ether linkages in the PEG structure. This demonstrated the presence of PEG-amine bound to GO in the synthesized nanocarrier.
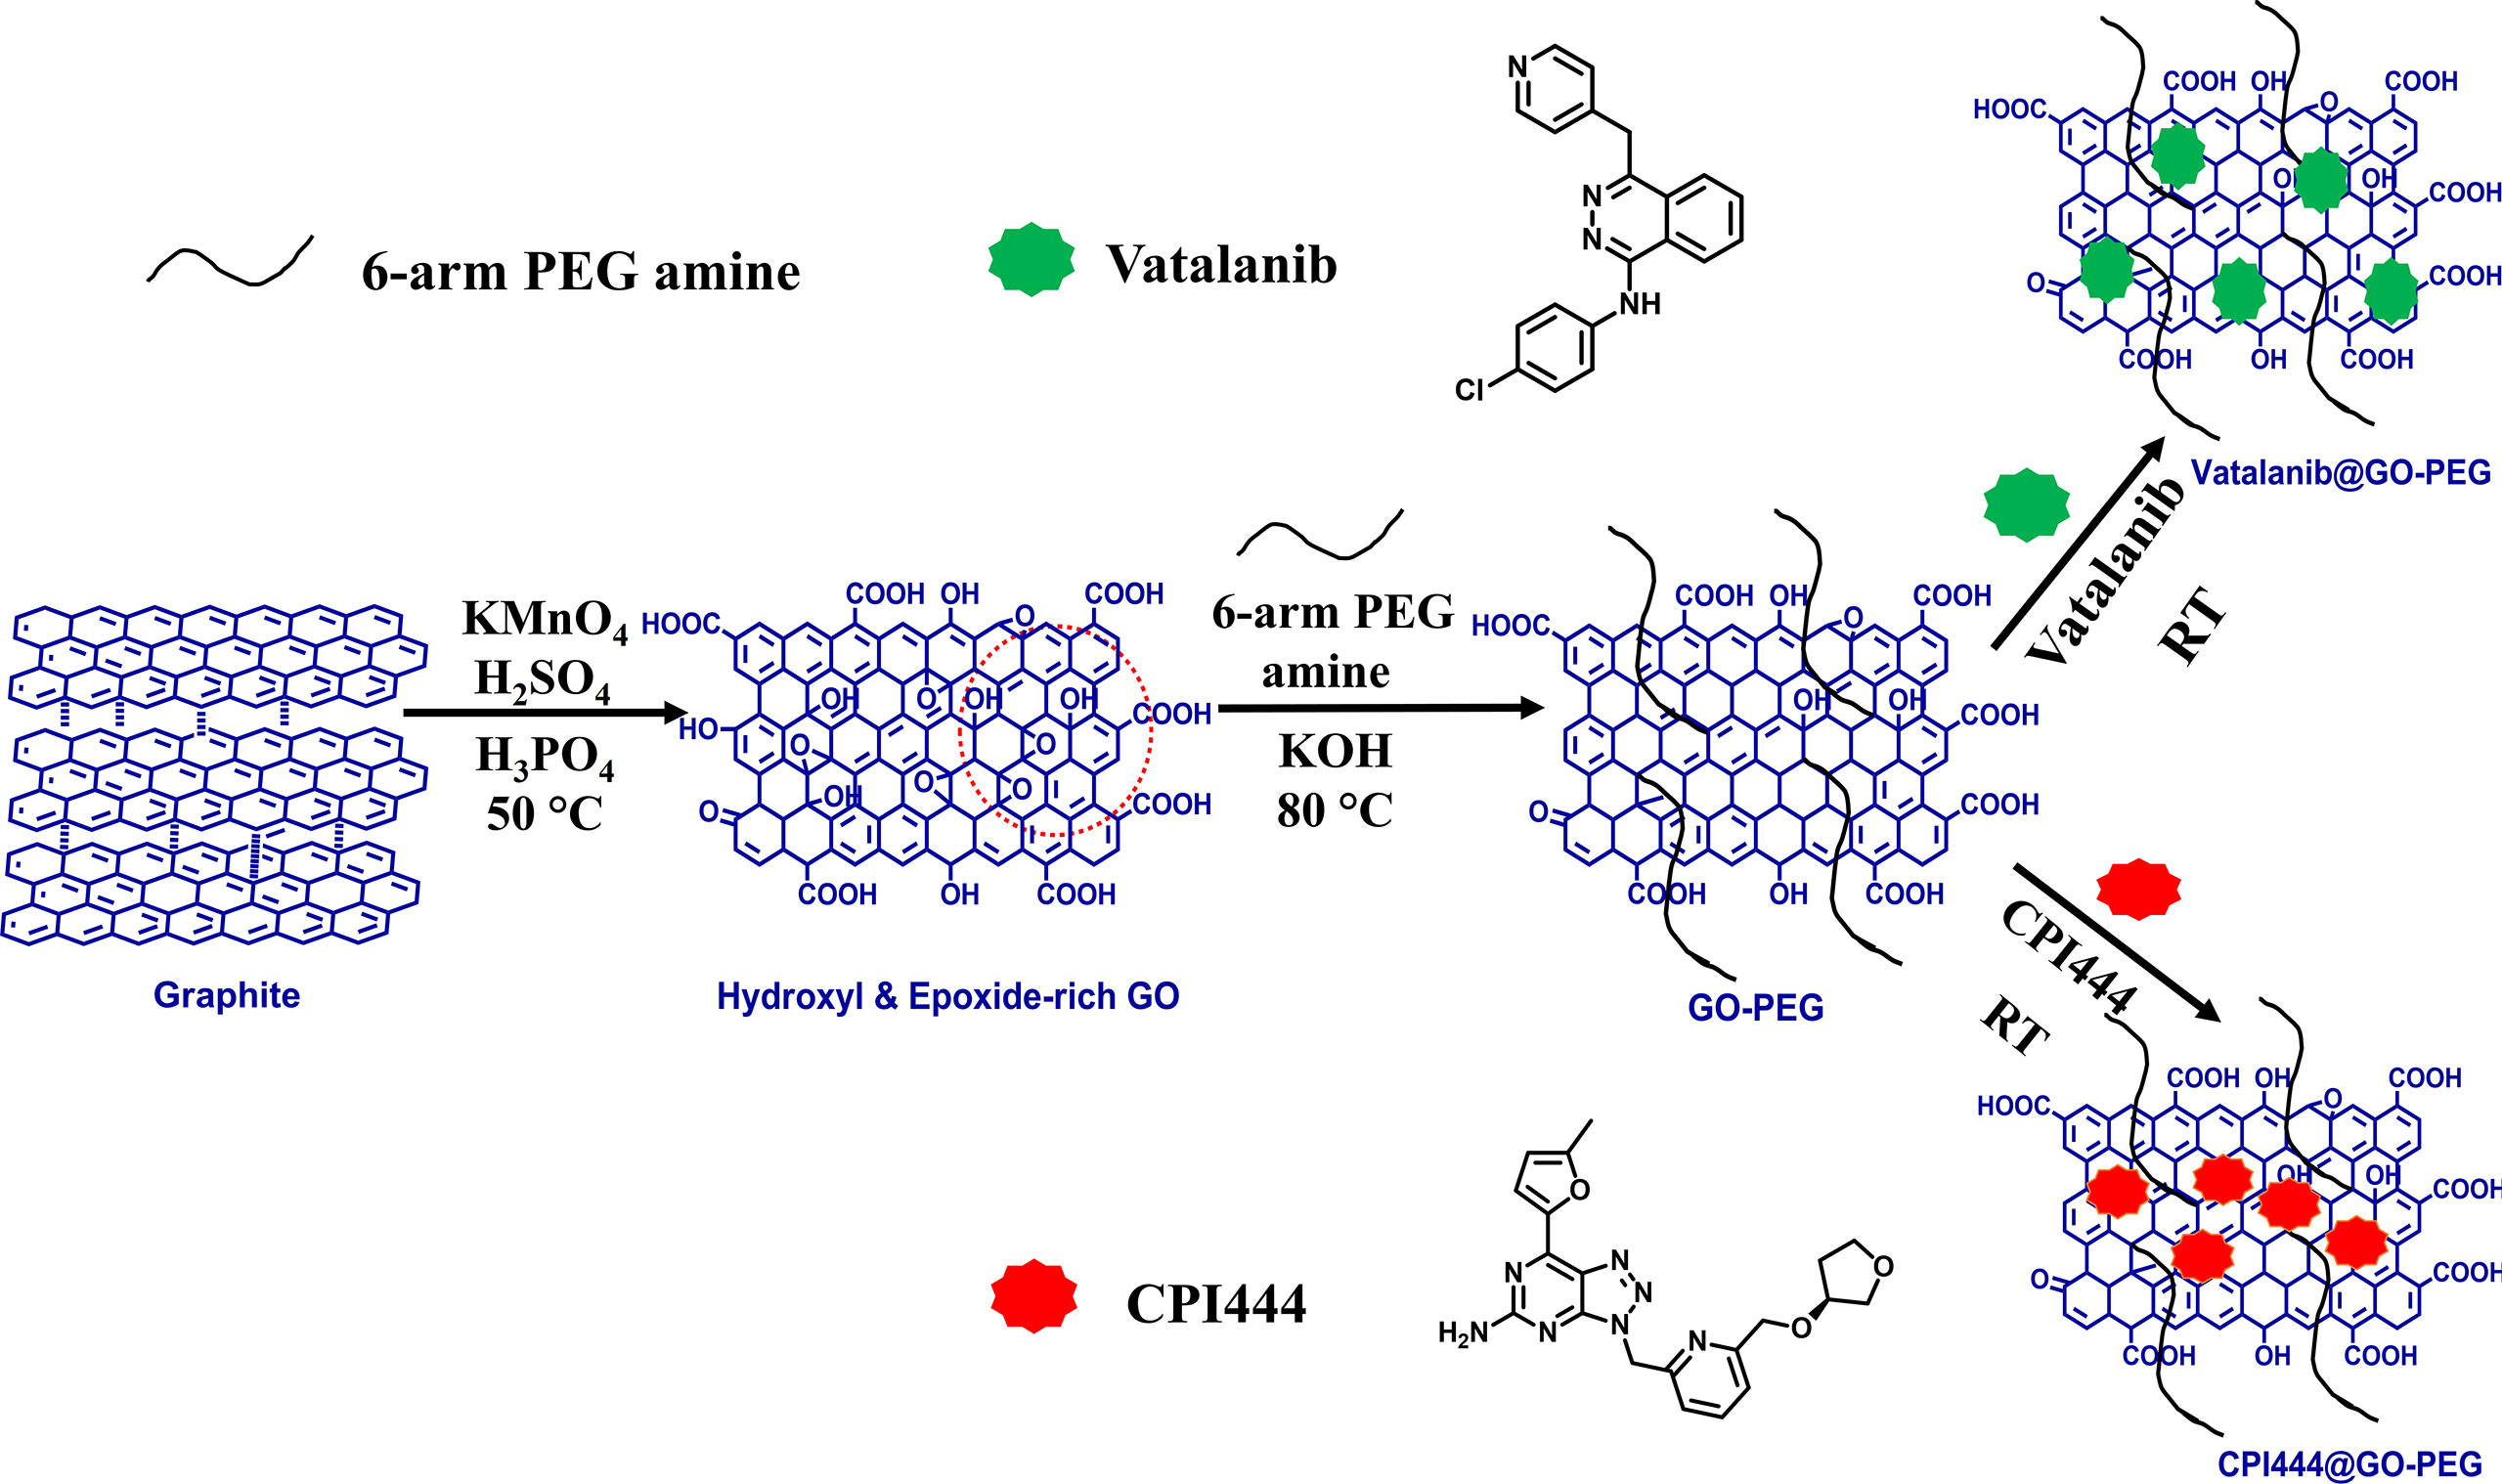
Figure 1 Schematic diagram for the synthesis of GO, GO-PEG, and drug loaded GO-PEG nanocarriers (CPI444@GO-PEG and vatalanib@GO-PEG).
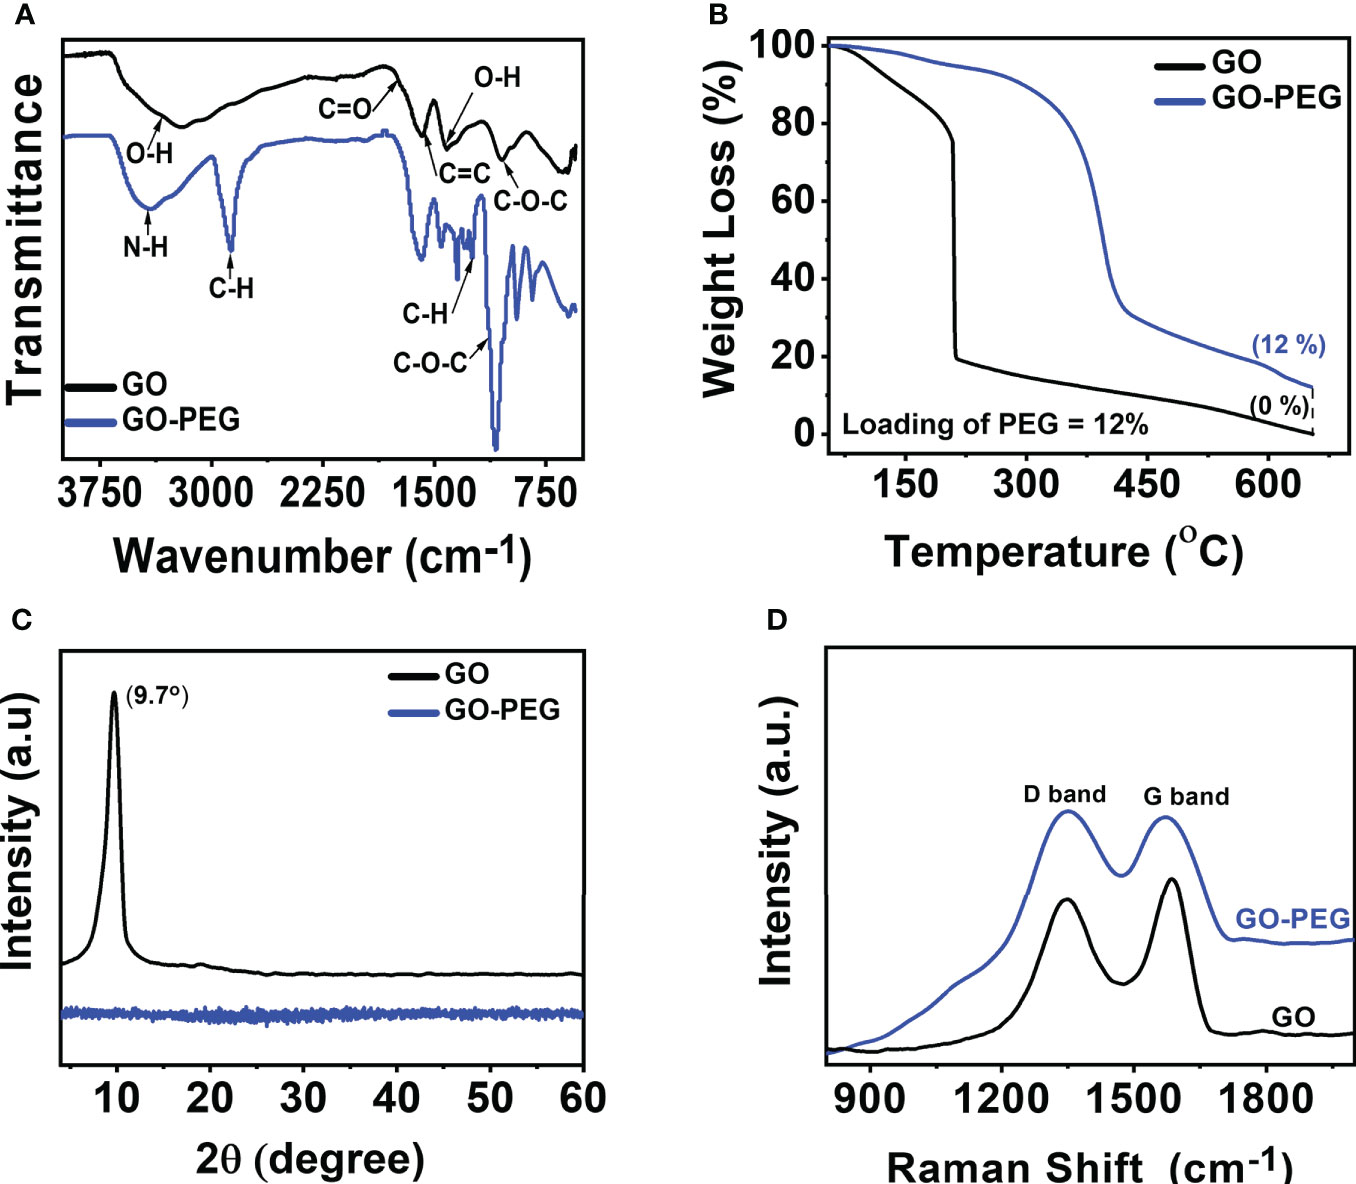
Figure 2 Characterization of GO and GO-PEG nanoparticles. (A) FTIR, (B) TGA, (C) PXRD, and (D) Raman spectra.
To determine the amount of PEG-amine coating on GO, thermogravimetric analysis (TGA) was performed. From Figure 2B, GO showed mass loss in the range of 80 to 220°C associated with the evaporation of adsorbed water and thermodynamic decomposition of highly labile oxygen functionalities (33). GO revealed a residual char yield of 0% at 650°C. Unlike GO, GO-PEG is relatively more thermodynamically stable and showed an initial mass at a high temperature of ~315°C, which clearly demonstrated the existence of a polymer coating on GO sheets (34). Comparison of residual char yield obtained at 650°C in GO and GO-PEG revealed a ~12% loading of PEG-amine on GO.
The powder X-ray diffractogram (PXRD) spectrum (Figure 2C) of GO showed the absence of graphite (002) peak at 2θ = 26.28° (35), but a new (001) peak at low 2θ = 9.7° clearly supports the successful oxidation of graphite to GO and the absence of graphite impurity in it. Surprisingly, no diffraction peaks are observed in GO-PEG, including the disappearance of diffraction peaks related to GO, which suggests PEG coating resulted in the formation of amorphous GO-PEG nanoparticles. The interlayer spacing of the materials is proportional to the degree of functionalization and inversely related to the observed 2θ. GO showed an interlayer spacing of 9.1 Å (>3.4 Å in graphite), calculated using Bragg’s equation (36) suggesting significant oxidation occurred in graphite to form GO. GO-PEG diffractogram remained featureless, suggesting the interlayer spacing may be further enhanced due to the introduction of extra PEG-amine coating on the GO-PEG nanostructure.
The Raman spectra as shown in Figure 2D show D and G bands centered at ∼1,350 cm−1 and ∼1,590 cm−1, respectively, confirming the typical lattice distortions (37) in GO. Defects in graphitic materials can be assessed by evaluating the ratio of intensities in the D and G bands, i.e., the ID/IG ratio. A higher ID/IG (1.04) in GO-PEG than that observed in GO (0.907), along with a subsequent broadening of bands, signifies an increased defect ratio of GO upon functionalization with the dendrimer. Interestingly, since PEGylation occurred on the pre-existing epoxide and carbonyl defects in GO, both the nanoparticles demonstrated an identical distance between defects (LD, ~10 nm). GO-PEG revealed a reduced in-plane crystallite size (La) from 18.5 nm to 16.1 nm, supporting PEGylation induced shrinking and disruption of stacked GO domains, consistent with the PXRD studies.
The UV–vis spectra of the aqueous dispersion of the synthesized nanomaterials are shown in Figure 3A. GO revealed two distinct absorption peaks at 230 nm and 300 nm, which originated from π–π* transition of the conjugated C=C bond and the n-π* transition of the >C=O bond, respectively (38). GO-PEG showed a red shift in the π–π* transition from 230 nm to 240 nm with an undetectable shoulder at 300 nm, confirming that PEGylation of GO led to greater retention of conjugation in its basal plane. Additionally, optical images of the aqueous dispersions (Figure 3A, inset) clearly showed an alteration in color from red-brown in GO to dark-black in GO-PEG, which further supports the formation of a more conjugated structure in the latter.
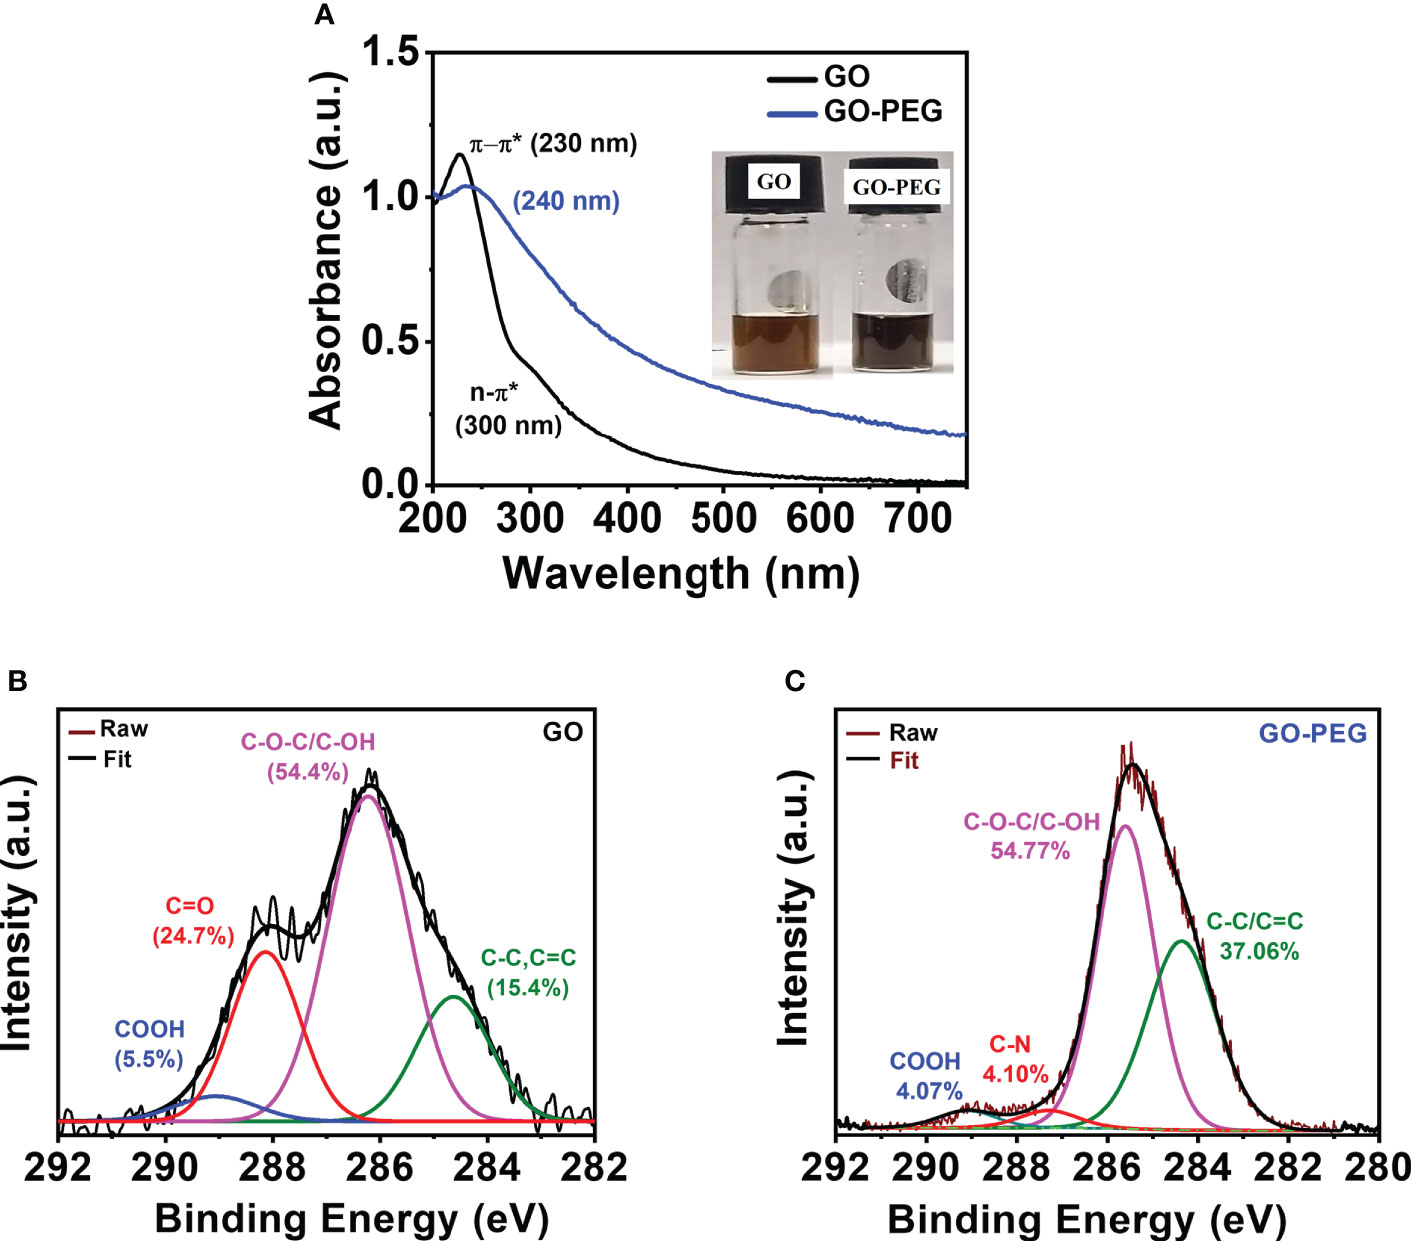
Figure 3 PEGylation of GO. (A, B) UV–visible spectra (inset shows digital images of the nanoparticle aqueous dispersions at a concentration of 0.5 mg/ml). XPS high-resolution deconvoluted spectra of C1s of (B) GO and (C) GO-PEG.
XPS analysis was performed to determine chemical functionality and confirm successful functionalization of GO nanoparticles with PEG-amine. Deconvolution of the C1s XPS spectrum (Figure 3B) in GO revealed the existence of four main types of carbon bonds (binding energy) as C–C/C=C (284.5 eV), C–O/C–O–C (286.3 eV), C=O (288.1 eV) and COOH (289.0 eV) with relative percentages of 15.4%, 54.4%, 24.7%, and 5.5%, respectively. Similarly, the C1s spectra of GO-PEG were deconvoluted into four peaks (Figure 3C) as C–C/C=C (284.4 eV), C–O/C–O–C (285.7 eV), C–N (288.3 eV) and COOH (289.1 eV). Successful attachment of PEG to GO was confirmed by a simultaneous increase in the percentage of C–C/C=C to 37.06% and vanishing of >C=O XPS peak, and appearance of a new peak which is attributed to the C–N (of bound PEG-amine) with a relative percentage of 4.10%. This clearly demonstrated the base-mediated nucleophilic addition reaction of PEG-NH2 on the carbonyl groups in GO, consistent with the FTIR results.
The particle size and surface charge (zeta potential, ζ) of nanoparticles are critical parameters that dictate the interaction with the payload and may guide their cellular uptake. As can be seen in Figures 4A, C, the average hydrodynamic sizes (ζ) of GO and GP were determined as 450 nm (−49 mV) and 80 nm (−12 mV), respectively. PEG binding to GO substantially reduced the hydrodynamic size and reduction in negative charge (ζ) due to the positively charged amino groups of PEG, which counteracted the negatively charged carboxylate group (COO−) in GO. This may enable GO-PEG as an attractive nanocargo for intracellular delivery. The CPI444@GO-PEG and vatalanib@GO-PEG showed a hydrodynamic sizes of 275 nm and 220 nm, respectively (Figure 4B). Drug loading on GO-PEG led to an increment in hydrodynamic size, clearly supporting the loading of hydrophobic drug molecules on GO-PEG nanoflakes. Further, a change in ζ value of GO-PEG in CPI444@GO-PEG and Vatalanib@GO-PEG showed (Figure 4D) a −21 mV and −16 mV, respectively, is noticed. Both zeta potential (ζ) and average hydrodynamic values of drug-nanoconjugates confirmed the successful loading of drug molecules on the GO-PEG nanocarrier.

Figure 4 Dynamic Light Scattering measurements. (A, B) Hydrodynamic size, and (C, D) Zeta potential of GO, GO-PEG, vatalanib@GO-PEG and CPI444@GO-PEG, respectively.
The amount of drug loading on GO-PEG as in CPI444@GO-PEG and vatalanib@GO-PEG was determined spectrophotometrically. A standard curve was plotted by recording absorbance at a respective wavelength maximum using variable drug (CPI444, λmax = 356 nm and vatalanib, λmax = 335 nm) concentrations, and a linear good fit (Figures 5A, B, Figures S1A, B) was obtained. The unbound drug was removed by dialysis on the carrier and purification was monitored by UV–vis spectroscopy. As can be seen from Figure 5C, a subsequent decrease in absorbance at 356 nm in the dialysate is noticed to support leaching out of the loosely bound CPI444 on GO-PEG. The fourth washing showed the absence of any released CPI444, confirming the successful formation of a stable CPI444@GO-PEG conjugate. The CPI444 loading capacity and encapsulation efficacy were calculated as 55 wt% and 50 wt%, respectively. Figure 5D shows UV–vis spectra for GO and CPI444@GO-PEG, qualitatively confirming the loading of CPI44 onto the GO-PEG nanocarrier as it revealed the shoulder at 356 nm associated with bound CPI444 on GO-PEG. Likewise, the amount and existence of vatalanib on the GO-PEG nanocarrier was also determined. As can be seen in Figure S1, for vatalanib, the dialyzate revealed almost no release of the unbound drug, supporting its excellent adsorption on the GO-PEG nanocarrier. Structurally, vatalanib has a highly rigid aromatic framework compared to CPI444, which ensures relatively strong van der Waals interactions of the former with the carrier.
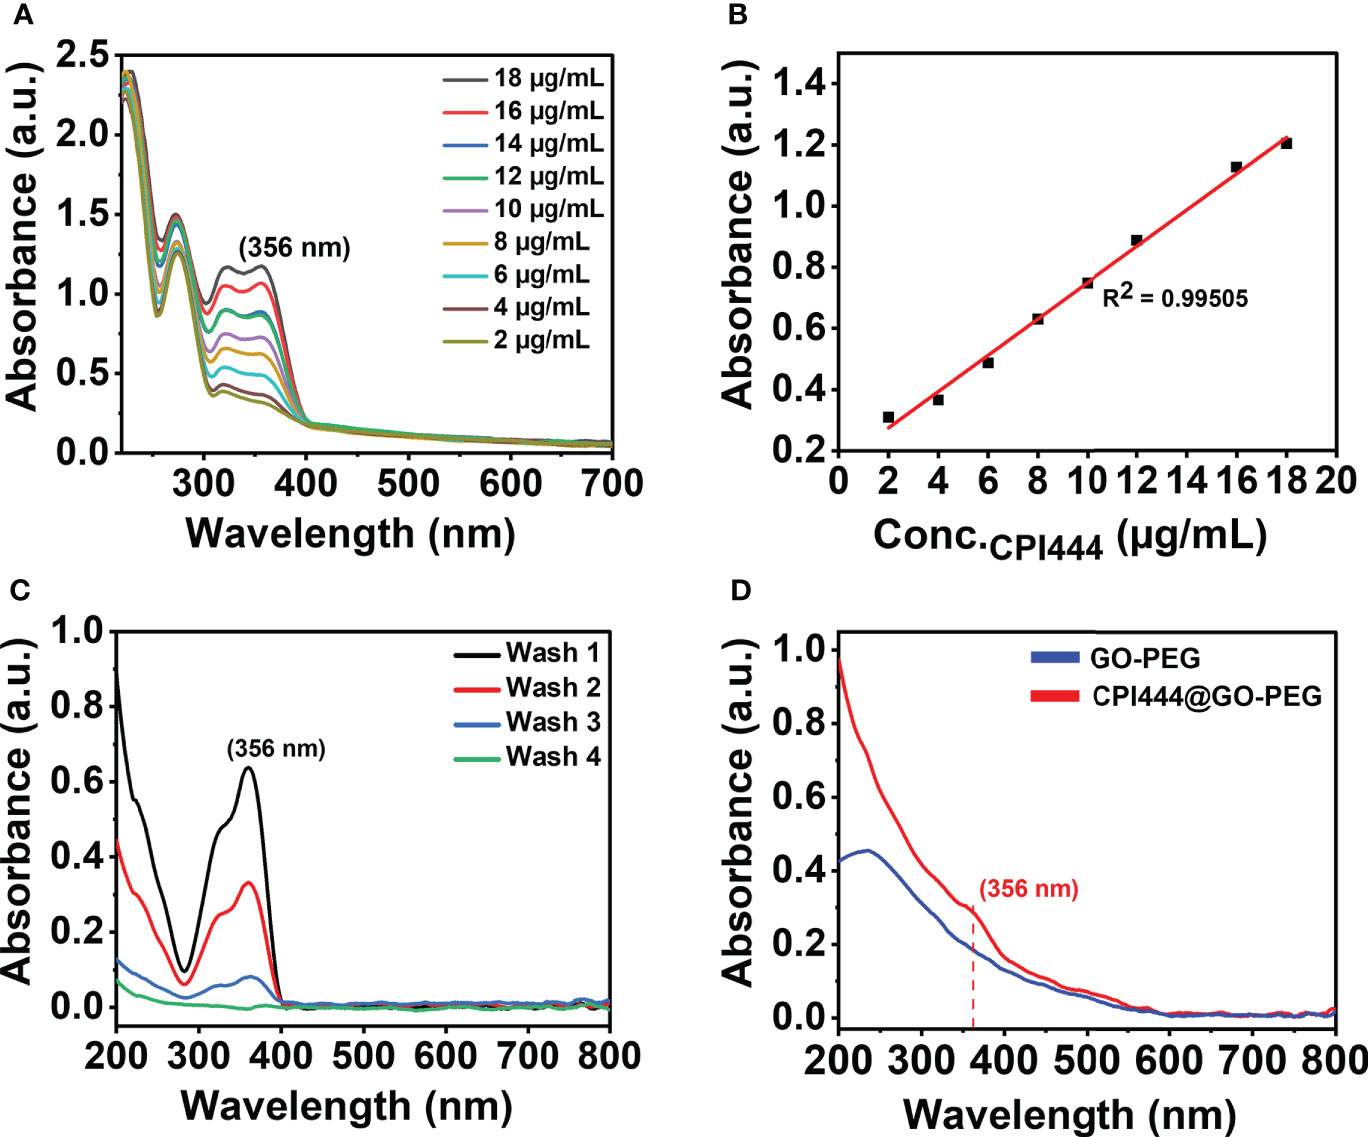
Figure 5 Quantitative and qualitative analysis for the formation of CPI@GO-PEG using UV–vis spectroscopy: (A) UV–vis spectra of CPI444 solution recorded at different concentrations in (water: THF) solvent mixture, (B) Linear equation obtained from the standard curve at a wavelength maximum of 356 nm, (C) UV–vis spectra recorded for unbound CPI444, (D) UV–vis spectra for GO-PEG and purified CPI444@GO-PEG.
The highly evasive nature of glioblastoma (GBM) is mainly due to the heterogeneity of the cellular and molecular players (3). This demands exploration of combinatorial nanotherapeutic approaches, i.e., utility of two or more drug molecules on a carrier to enhance high cellular uptake of drug and to induce pronounced effects in their specific roles to target different cellular mechanisms.
CPI444 is an adenosine A2A receptor antagonist emerging as a potential antitumor drug (20, 39, 40). Vatalanib is another potential drug that targets VEGFR tyrosine kinase and other class III kinases (41) and plays a significant role in targeting angiogenesis in GBMs (4). CPI444 and vatalanib have different molecular targets, enabling them to be suitable for GBM treatment. A nanocarrier, GO-PEG, was used to deliver both CPI444 and vatalanib drug molecules for better outcomes. Initially, a cell viability study was performed to assess the cytotoxic effects of CPI444, vatalanib, CPI444 + vatalanib, GO-PEG, and CPI444 + vatalanib@GO-PEG at different concentrations than individual drug molecules (Figures 6A–C). The inhibitory concentration (IC50) values of CPI444, vatalanib, and in combination were determined as 48, 33, and 26 µM, respectively (Figure 6A). The combination of CPI444 and vatalanib exhibited a drastic effect on cell survival at a relatively lower concentration than individual drug molecules. Further, the biocompatibility of the designed GO-PEG over GO was evaluated. It clearly revealed PEGylation substantially improved the cell viability up to 20 µg/ml, supporting it as a safe carrier (Figure 6B). Finally, an IC50 value for the drug loaded GO-PEG (CPI444 + vatalani@GO-PEG) was determined as 14 µM (Figure 6C). Drug molecules loaded with GO-PEG induced an elevated cytotoxic effect compared to the individual drug molecules or their combination. This assay suggests that the GO-PEG nanocarrier improves therapeutic efficacy without raising dosage. Additionally, the cellular uptake of GO-PEG nanoparticles in GBM U87 cells was calculated through flow cytometry (Figure 6D, Figure S2). To perform this experiment, GO-PEG was tagged with FITC and incubated with the cells for 24 h in different concentrations (5 µg/ml, 10 µg/ml, and 15 µg/ml). Here, a concentration-dependent cellular uptake of GO-PEG-FITC was observed. Previously, GO-PEG has been shown to exhibit a minimal effect on cell viability in the range of ~50 µg/ml (42). This novel formulation of nanocarrier (GO-PEG) with CPI444 and vatalanib facilitated increased cellular uptake, thus allowing the effective reduction of inhibitory concentrations affecting cell viability. This will reduce significant side effects due to overdosage.
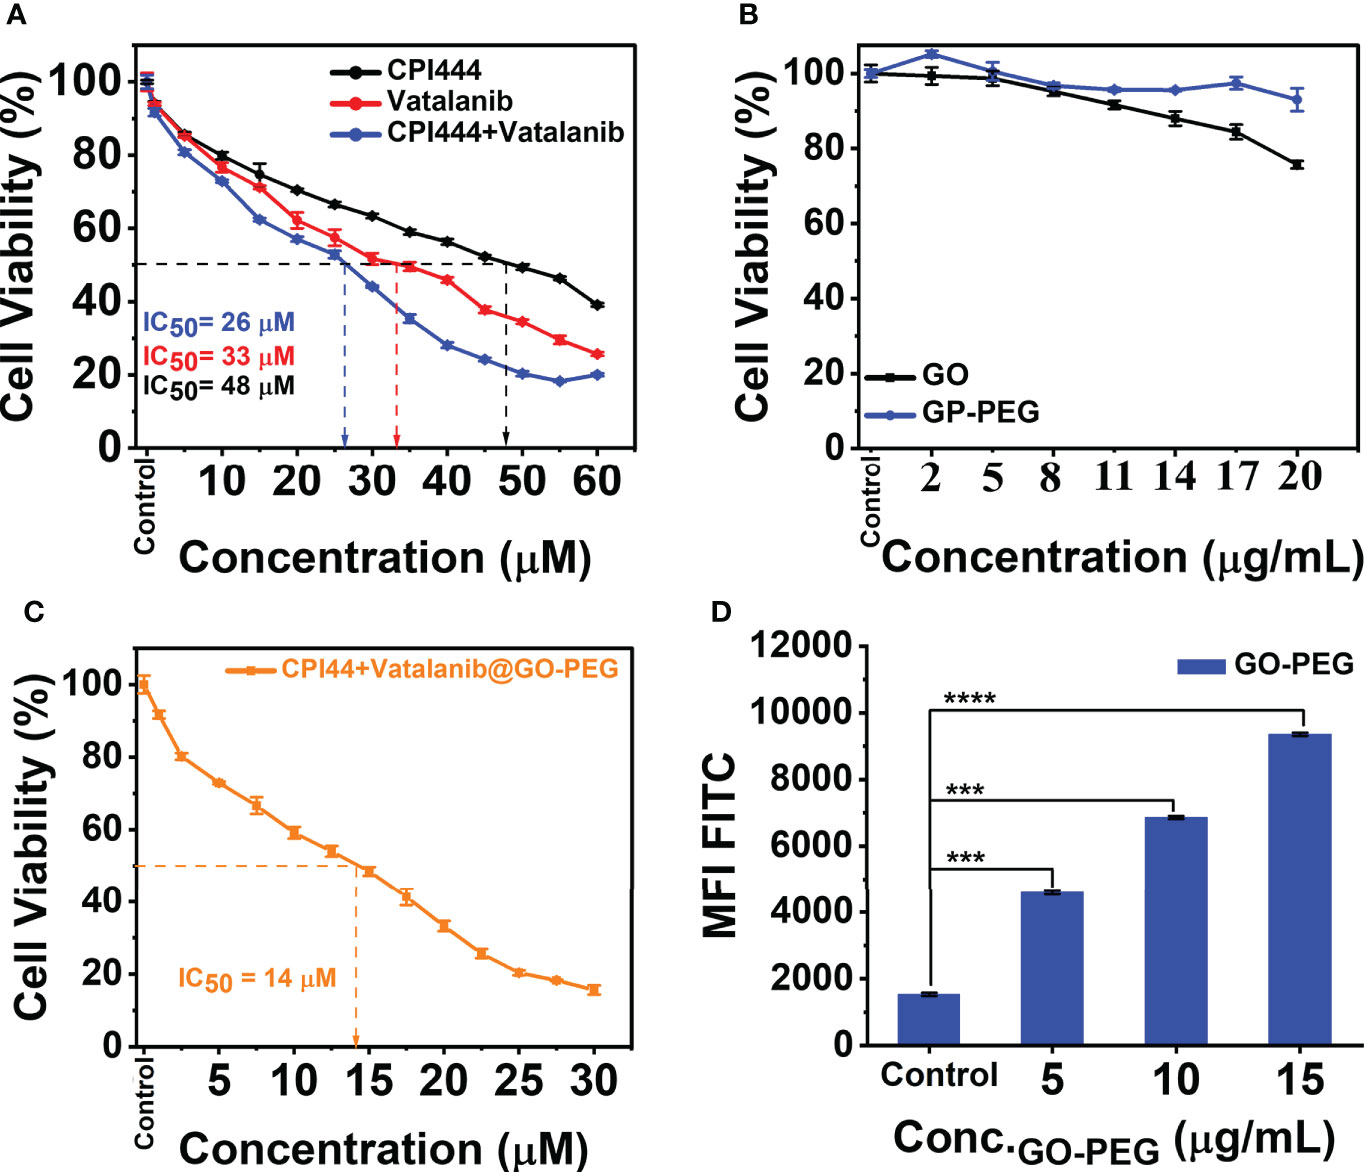
Figure 6 Cell viability studies and cellular uptake of PEGylated graphene oxide. (A) CPI444 and vatalanib cell cytotoxicity were calculated in GBM U87 cells. Cells were treated with drugs individually along with different concentrations for 48 h. After 48 h, IC50 values were calculated. (B) Cytotoxicity analyses of GO and GO-PEG were performed in GBM U87 cells. The PEGylated graphene oxide carrier did not show significant cytotoxicity in the GBM cell line up to 20 µg/ml. (C) In the GBM U87 cell line IC50 value of CPI444 + vatalanib@GO-PEG is ~14 µM. (D) To confirm the cellular internalization of PEGylated GO nanoparticles in the GBM cells, we conducted a FACS study after 24 h of incubation with different concentrations of PEGylated graphene oxide nanoparticles; MFI (Mean Fluorescence Intensity) in arbitrary units (AU); ****p <0.0001 and ***p <0.001.
Glioblastoma multiforme (GBM) is a type of high-grade primary brain cancer that comprises a subpopulation called glioblastoma stem cells (GSC), which are responsible for tumor initiation, development, and recurrence following treatment (3). Calcium (Ca2+) is a secondary messenger that plays a vital role in cell proliferation, cell death, differentiation, migration, metabolism, neural plasticity, and gene transcription, among other processes (43, 44). Calcium signaling is reported to have a significant impact on neuronal cell development and function (45). Glioblastoma is of neuronal origin, and therefore, calcium pathways are active in controlling and promoting various cellular functions (46). Therefore, intracellular calcium (Ca2+) levels were assessed in GBM U87 cells upon treatment with CPI444 and vatalanib-loaded PEGylated graphene oxide nanoparticles. Here, a significant reduction in Ca2+ levels was observed in CPI444 + vatalanib and CPI444 + vatalanib@GO-PEG treated cells compared to untreated or cells treated with either of the drugs individually (Figure 7A, Figure S3). A 2D colony forming assay was performed to identify the role of reduced intracellular calcium (Ca2+) in the inhibition of GBM stem cell properties. A combination of nanoconjugated CPI444 and vatalanib reduced the colony formation in GBM U87 cells (Figures 7B, C). This indicates that reduced cellular calcium levels affect the proliferation ability of glioblastoma stem cells (GSCs). A human pluripotent stem cell array analysis was performed under similar treatment conditions to further investigate the molecular targets that are affected. Here, markers for pluripotency such as Oct3/4, Nanog, and Sox2 exhibit significant downregulation upon treatment with CPI444 and vatalinib loaded on GO-PEG (Figure 7D). Additionally, markers associated with the epithelial to mesenchymal transition (EMT), such as Snail and Goosecoid (Gsc), as well as other markers for differentiation to other cell lineages exhibited downregulation (Figure 7D). This suggests that the GSCs are not undergoing differentiation into assume other cell fates.
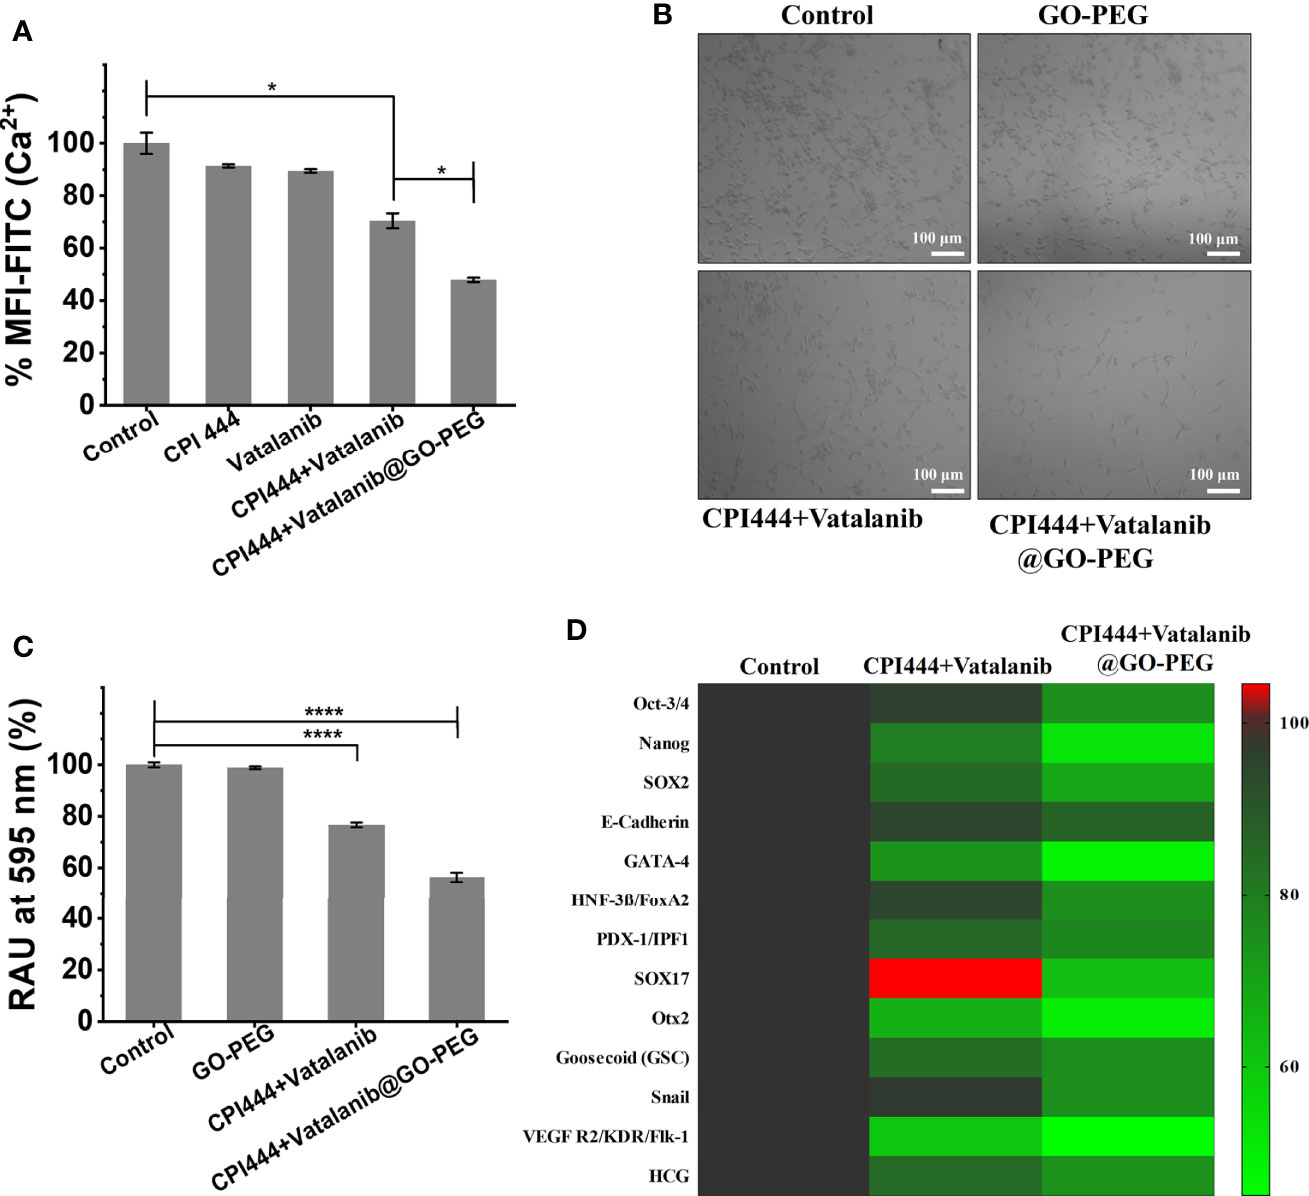
Figure 7 CPI444 and vatalanib-loaded GO-PEG affect the proliferation and stemness properties of GBM U87 cells. (A) Cellular calcium levels were estimated by FACS analysis using Fluo-4AM dye under different drug treatment conditions. (B) Colony forming assay of GBM U87 treated with untreated control, GO-PEG, CPI444 + vatalanib and CPI444 and vatalanib conjugated with GO-PEG. (C) Quantitation of colony forming assay, %RAU, relative absorbance units in percentage. (D) Heatmap depicting the expression levels of human pluripotent stem cell protein array for pluripotency and differentiation markers upon treatment with CPI444 and vatalanib loaded on GO-PEG with appropriate controls. MFI (Mean Fluorescence Intensity) in arbitrary units (AU); ****p <0.0001 and *p <0.05.
These observations suggest that combinatorial treatment of CPI444 with vatalanib with the aid of GO-PEG is effective in reducing the cellular calcium pool of GBM U87 cells. This is a very promising observation as Ca2+ levels play a critical role not only in GSC proliferation and in glial cell function that helps in the survival and fate determination process (44, 47).
Glioblastoma multiforme is an aggressive tumor that has an aggressive migratory property and invades the microenvironment and adjacent brain tissue. CD24, a motility and invasion marker, was overexpressed in gliomas, particularly in GBM (48–50). Therefore, to assess the effect of CPI444 and vatalanib loaded GO-PEG on CD24 expression in GBM U87 by FACS analysis is therefore necessary. A significant reduction in the CD24 expression was observed (Figure 8A, Figure S4). Further, the migration abilities of GBM U87 cells under similar treatment conditions were estimated by the Boyden chamber assay. Here, a drastic reduction in the cell numbers that have migrated to the Boyden chamber was observed (Figures 8B, C). Cell motility is linked to adhesive properties; an important reason for the decreased migration is the attenuation of adhesion. Therefore, we assessed the adhesive property of GBM U87 cells upon treatment with the CPI444 + vatalanib@GO-PEG along with the comparable controls and observed reduced cellular adhesion compared to the control conditions (Figure 8D). Finally, gelatin degradation assay was performed after treatment with CPI444 + vatalanib@GO-PEG, CPI444 + vatalanib, and compared with the untreated cells as a control. A visible reduction in the dark patches formed by invadopodia during cell migration in nanoparticles mediated drug-treated cells was evident (Figure 8E). This clearly demonstrates a profound impairment in the cellular migration of GBM U87 cells.
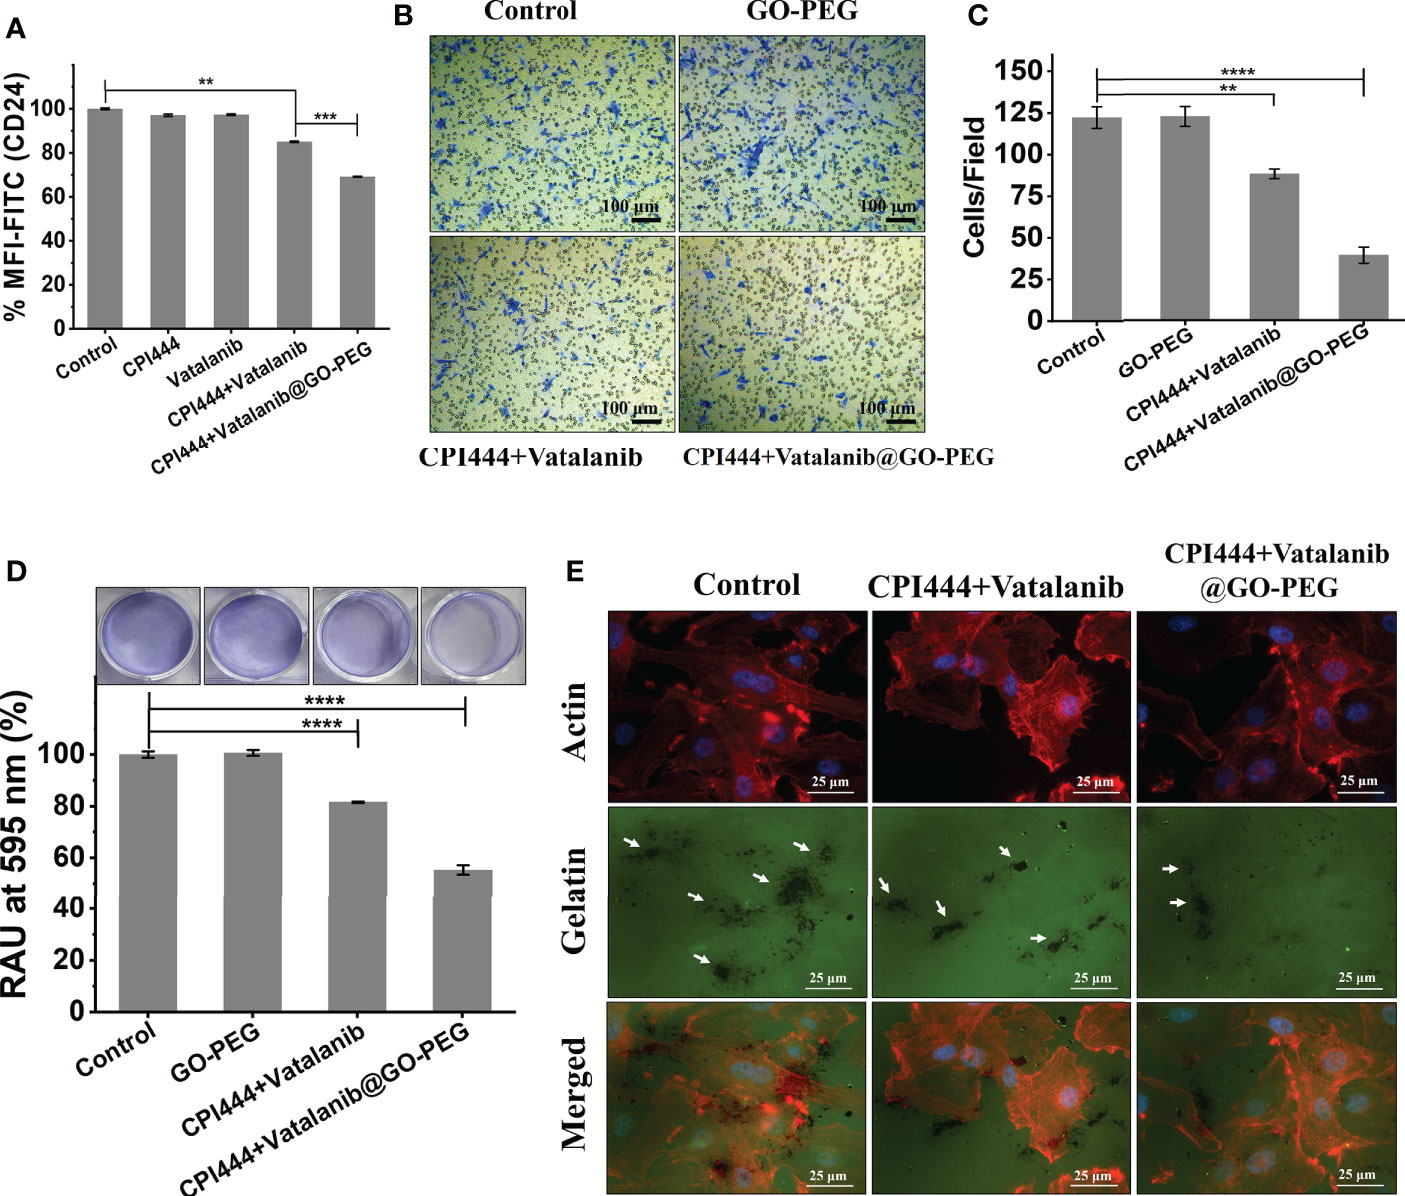
Figure 8 CPI444 and vatalanib@GO-PEG hindered the cellular migration and invasive behavior of GBM U87 cells. (A) CD24 expression levels in GBM U87, quantitated by FACS analysis after treatment with CPI444 and vatalanib-loaded GO-PEG and other combinations. (B, C) Boyden chamber analysis (Transwell migration assay) was performed for cell migration properties. The combination of nanoconjugate CPI444 and vatalanib-treated cells shows smaller numbers of migrated cells compared to control. (D) The adhesive property of GBM cells was significantly reduced after the treatment with the GO-PEG conjugated combination of CPI444 and vatalanib. RAU%, Relative absorbance units in percentage. (E) Invadopodia causing dark gelatin degradation patches (indicated by white arrows) were detected by the gelatin degradation assay under different treatment conditions. ****p <0.0001, ***p <0.001, and **p <0.01.
In the previous section, a drastic reduction in the cellular Ca2+ levels was observed upon treatment with CPI444 + vatalanib@GO-PEG. There are ever-growing studies suggesting the role of calcium-mediated signaling in cell migration during development and in cancer metastasis (51, 52). Previous reports have also shown that CD24 plays a critical role in the invasive properties of cancer/tumor cells (48, 50). Therefore, we hypothesize that the observed reduction in expression of CD24, along with the non-invasive phenotype of GBM U87, upon treatment with CPI444 and vatalanib via GO-PEG, could be due to reduced Ca2+ levels.
The glioblastoma tumor microenvironment exhibits characteristic vascularization mediated by various growth factors and conditions. GBM U87 cells secrete particular growth factors that cause neo-angiogenesis in pre-existing capillaries (49). We analyzed the effect of CPI444 and vatalanib loaded GO-PEG on the angiogenic potential of GBM U87. The essential developmental molecules for tube formation are found in the tissue culture media (TCM) of GBM U87 cells. The TCM of treated and untreated GBM U87 cells was collected and provided to the primary endothelial cells for tube formation. The TCM of control cells revealed a rich and progressive vasculature and showed a larger number of branches and nodes compared to the treated cells (Figures 9A–C). Previous reports have shown that vatalanib exhibits anti-angiogenic properties in multiple cancers, including tumors (53, 54). Purinergic signaling has also been shown to help in tumor neovascularization by inducing the secretion of VEGF into the tumor microenvironment (55, 56). Therefore, a combinatorial treatment with GO-PEG mediated high cellularity proves to be very effective in the inhibition of angiogenic signals from GBM U87 cells. The observed morphology also explains why VEGF2R was downregulated upon treatment with CPI444 + vatalanib@GO-PEG (Figure 7D).
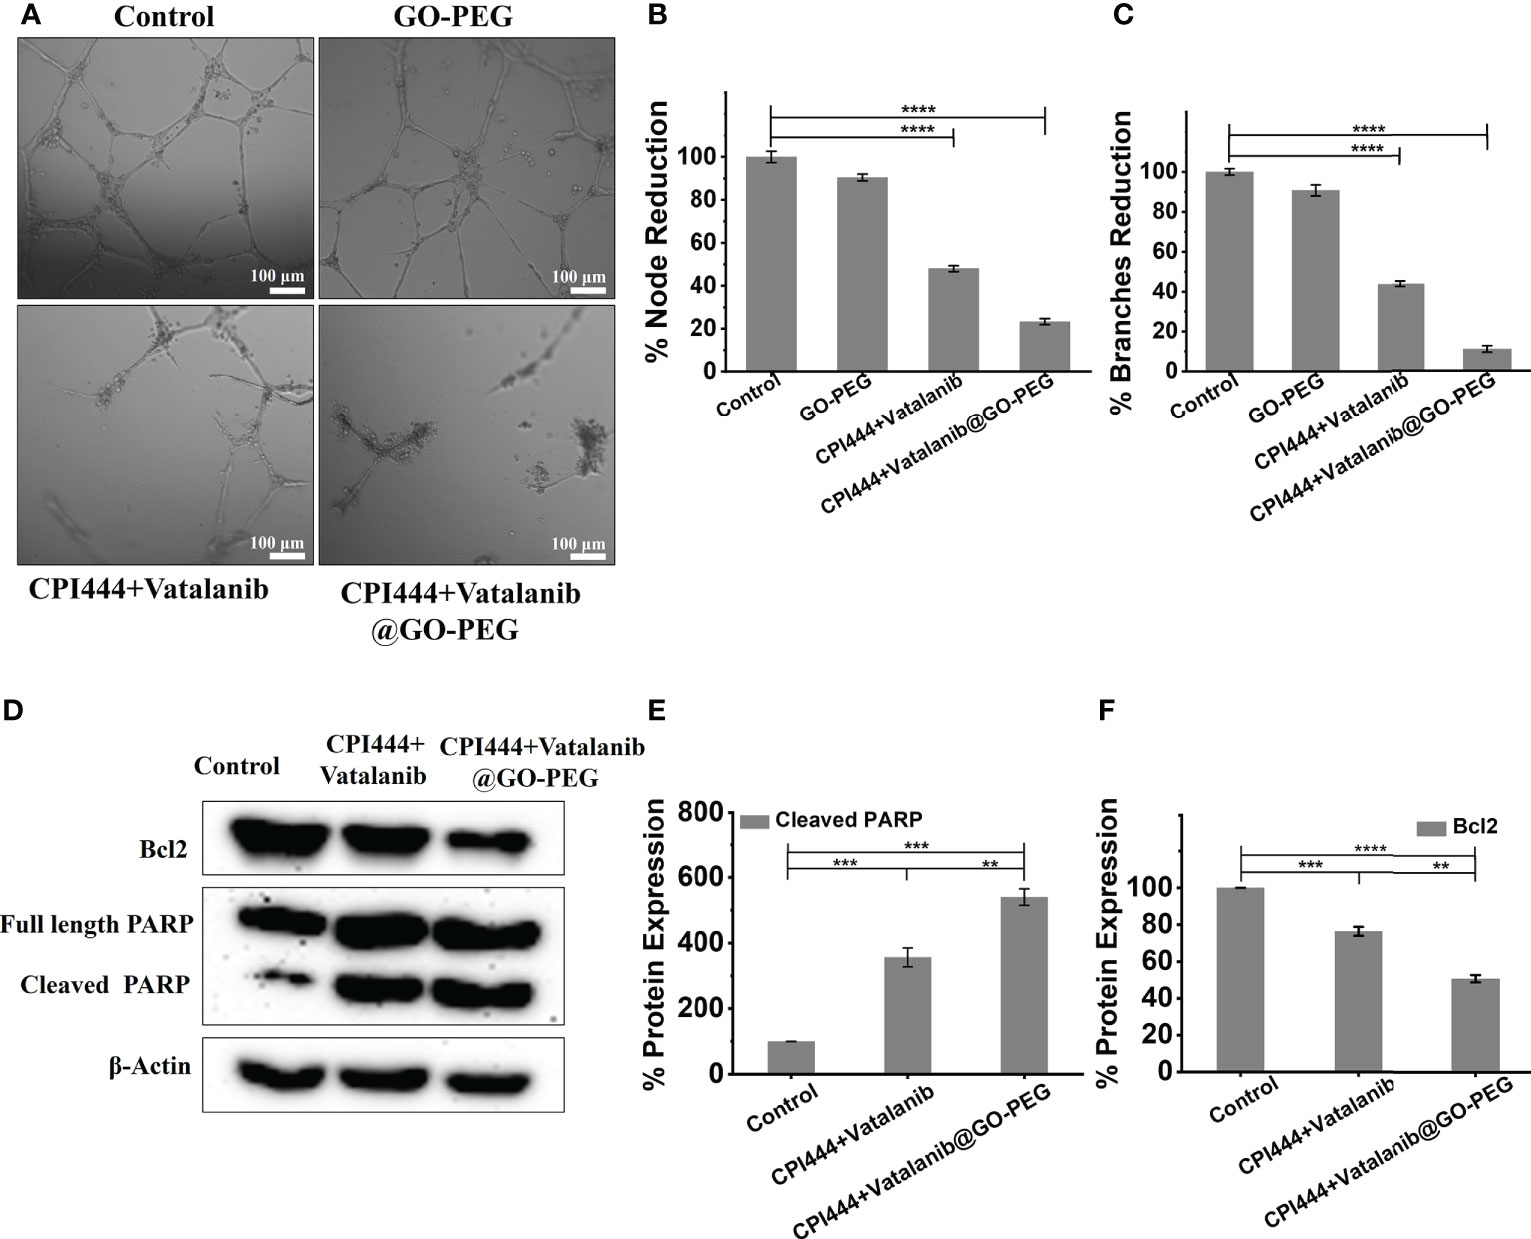
Figure 9 Treatment of CPI444 and vatalanib-loaded GO-PEG inhibits the angiogenic potential and causes apoptosis of GBM U87. (A–C) A tube formation assay was performed for angiogenesis analysis in GBM cells. GBM U87 cells showed a smaller number of nodes and branches compared to control cells. (D–F) Western blot analysis of Bcl2, intact PARP, cleaved PARP. β-actin was used as an internal control. The Western blot shown is a representative of three independent experiments. ****p <0.0001, ***p <0.001, and **p <0.01.
So far, in this study, multiple assays have indicated that the loss of stemness properties leads to reduced proliferation capacity upon CPI444 + vatalanib@GO-PEG treatment. At the same time, GBM U87 cells were also not differentiated into any specialized cell types (Figures 7D, 9A–C). This indicates that the cells might be exhibiting arrested growth or undergoing programmed cell death. To understand this, the expression of apoptotic markers such as the proteolytic cleavage product of poly (ADP-Ribose) polymerase (PARP) and B-cell lymphoma 2 (Bcl2) was scored (Figures 9D–F). Here, upregulated cleaved PARP and downregulation of Bcl2 clearly demonstrate that combinatorial treatment with improved cellular uptake results in apoptosis of GBM U87 cells.
In this study, a nanocarrier GO-PEG was synthesized and characterized. PEGylation of graphene oxide resulted in a significant reduction in hydrodynamic size, and zeta potential, which facilitated a high cellular uptake of GO-PEG. Additionally, PEGylation of graphene oxide led to reduced cytotoxicity. This nanocarrier was used to deliver potential therapeutic drug molecules, CPI444 and vatalanib, to target GBM U87 cells derived from glioblastoma multiforme. These drugs were mainly selected to target divergent cellular mechanisms as GBM exhibits molecular and cellular heterogeneity to its advantage. This study clearly demonstrates that the stem cell properties of GBM U87 were severely affected by custom-designed nanoformulation. Additionally, the treatment with CPI444 and vatalanib via GO-PEG led to a drastic reduction in the metastatic ability of GBM U87 cells. The current work has proven the importance of the novel formulation under study in the effective reduction of the angiogenic potential of GBM. Ultimately, this nanosized CPI444 and vatalanib caused elevated apoptosis, which will lead to a reduced tumor size. This nanoparticle-based combinatorial therapy approach enhances the efficacy of the existing therapeutic drugs by targeting the key molecular players at very low concentrations. This property will provide a huge advantage in tackling drug resistance exhibited by tumors and avoiding off-target effects due to overdosage.
The original contributions presented in the study are included in the article/Supplementary Material. Further inquiries can be directed to the corresponding authors.
BL conceived the concept and designed the chemical structures. PR designed the biological assays. SP performed the chemical synthesis, and characterization of nanoparticles. VM performed the biological assays. BL and PR interpreted the data. VM and SP made equal contributions. All authors listed have made a substantial, direct, and intellectual contribution to the work and approved it for publication.
BL and PR are thankful for the financial support received from the Shiv Nadar Foundation. PR is also supported by the Early Career Fellowship of the Wellcome Trust-DBT India Alliance (IA/E/16/1/503057).
VM and SP acknowledge the fellowship received from Shiv Nadar University. The authors thank Dr. Seema Sehrawat for the initial discussion. The authors would like to thank Dr. Sri Krishna Jayadev Magani (SNU, Delhi-NCR) for his kind gift of PARP and Bcl2 antibodies.
The authors declare that the research was conducted in the absence of any commercial or financial relationships that could be construed as a potential conflict of interest.
All claims expressed in this article are solely those of the authors and do not necessarily represent those of their affiliated organizations, or those of the publisher, the editors and the reviewers. Any product that may be evaluated in this article, or claim that may be made by its manufacturer, is not guaranteed or endorsed by the publisher.
The Supplementary Material for this article can be found online at: https://www.frontiersin.org/articles/10.3389/fonc.2022.953098/full#supplementary-material
1. Louis DN, Ohgaki H, Wiestler OD, Cavenee WK, Burger PC, Jouvet A, et al. The 2007 WHO classification of tumours of the central nervous system. Acta Neuropathol (2007) 114(2):97–109. doi: 10.1007/s00401-007-0243-4
2. Pearson JR, Regad T. Targeting cellular pathways in glioblastoma multiforme. Signal Transduct Target Ther (2017) 2(1):1–11. doi: 10.1038/sigtrans.2017.40
3. Lauko A, Lo A, Ahluwalia MS, Lathia JD. Cancer cell heterogeneity & plasticity in glioblastoma and brain tumors. Semin Cancer Biol (2022) 82:162–75. doi: 10.1016/j.semcancer.2021.02.014
4. Gerstner ER, Eichler AF, Plotkin SR, Drappatz J, Doyle CL, Xu L, et al. Phase I trial with biomarker studies of vatalanib (PTK787) in patients with newly diagnosed glioblastoma treated with enzyme inducing anti-epileptic drugs and standard radiation and temozolomide. J Neurooncol (2011) 103(2):325–32. doi: 10.1007/s11060-010-0390-7
5. Xu C, Wu X, Zhu J. VRGF promotes proliferation of human glioblastoma multiforme stem-like cells through VEGF receptor 2. Sci World J (2013). doi: 10.1155/2013/417413
6. Gramatzki D, Roth P, Rushing E, Weller J, Andratschke N, Hofer S, et al. Bevacizumab may improve quality of life, but not overall survival in glioblastoma: An epidemiological study. Ann Oncol (2018) 29(6):1431–6. doi: 10.1093/annonc/mdy106
7. Shankar A, Borin TF, Iskander A, Varma NR, Achyut BR, Jain M, et al. Combination of vatalanib and a 20-HETE synthesis inhibitor results in decreased tumor growth in an animal model of human glioma. Onco Targets Ther (2016) 9:1205. doi: 10.2147/OTT.S93790
8. Dragovich T, Laheru D, Dayyani F, Bolejack V, Smith L, Seng J, et al. Phase II trial of vatalanib in patients with advanced or metastatic pancreatic adenocarcinoma after first-line gemcitabine therapy (PCRT O4-001). Cancer Chemother Pharmacol (2014) 74(2):379–87. doi: 10.1007/s00280-014-2499-4
9. Jost LM, Gschwind H-P, Jalava T, Wang Y, Guenther C, Souppart C, et al. Metabolism and disposition of vatalanib (PTK787/ZK-222584) in cancer patients. Drug Metab Dispos (2006) 34(11):1817–28. doi: 10.1124/dmd.106.009944
10. Jeon SG, Lee H-J, Park H, Han K-M, Hoe H-S. The VEGF inhibitor vatalanib regulates AD pathology in 5xFAD mice. Mol Brain (2020) 13(1):131. doi: 10.1186/s13041-020-00673-7
11. Goldbrunner RH, Bendszus M, Wood J, Kiderlen M, Sasaki M, Tonn JC. PTK787/ZK222584, an inhibitor of vascular endothelial growth factor receptor tyrosine kinases, decreases glioma growth and vascularization. Neurosurgery (2004) 55(2):426–32. doi: 10.1227/01.neu.0000129551.64651.74
12. Jacobson KA, Gao Z-G. Adenosine receptors as therapeutic targets. Nat Rev Drug Discovery (2006) 5(3):247–64. doi: 10.1038/nrd1983
13. Fredholm BB, IJzerman AP, Jacobson KA, Linden J, Müller CE. International union of basic and clinical pharmacology. LXXXI. nomenclature and classification of adenosine receptors–an update. Pharmacol Rev (2011) 63(1):1–34. doi: 10.1124/pr.110.003285
14. Lecca D, Ceruti S, Fumagalli M, Abbracchio MP. Purinergic trophic signalling in glial cells: Functional effects and modulation of cell proliferation, differentiation, and death. Purinergic Signal (2012) 8(3):539–57. doi: 10.1007/s11302-012-9310-y
15. Willingham SB, Hotson AN, Miller RA. Targeting the A2AR in cancer; early lessons from the clinic. Curr Opin Pharmacol (2020) 53:126–33. doi: 10.1016/j.coph.2020.08.003
16. Ohta A, Sitkovsky M. Role of G-Protein-Coupled adenosine receptors in downregulation of inflammation and protection from tissue damage. Nature (2001) 414(6866):916–20. doi: 10.1038/414916a
17. Ohta A, Gorelik E, Prasad SJ, Ronchese F, Lukashev D, Wong MK, et al. A2A adenosine receptor protects tumors from antitumor T cells. Proc Natl Acad Sci (2006) 103(35):13132–7. doi: 10.1073/pnas.0605251103
18. Gillespie RJ, Cliffe IA, Dawson CE, Dourish CT, Gaur S, Jordan AM, et al. Antagonists of the human adenosine A2A receptor. part 3: Design and synthesis of pyrazolo [3, 4-d] pyrimidines, pyrrolo [2, 3-d] pyrimidines and 6-arylpurines. Bioorg Med Chem Lett (2008) 18(9):2924–9. doi: 10.1016/j.bmcl.2008.03.072
19. Fong L, Hotson A, Powderly JD, Sznol M, Heist RS, Choueiri TK, et al. Adenosine 2A receptor blockade as an immunotherapy for treatment-refractory renal cell cancer. Cancer Discovery (2020) 10(1):40–53. doi: 10.1158/2159-8290.CD-19-0980
20. Willingham SB, Ho PY, Hotson A, Hill C, Piccione EC, Hsieh J, et al. A2AR antagonism with CPI-444 induces antitumor responses and augments efficacy to anti–PD-(L) 1 and anti–CTLA-4 in preclinical models. Cancer Immunol Res (2018) 6(10):1136–49. doi: 10.1158/2326-6066.CIR-18-0056
21. Available at: https://www.sec.gov/Archives/edgar/data/1626971/000104746917001459/a2231221z10-k.htm (Accessed 02 July 2022).
22. Torchilin VP. Multifunctional, stimuli-sensitive nanoparticulate systems for drug delivery. Nat Rev Drug Discovery (2014) 13(11):813–27. doi: 10.1038/nrd4333
23. Yadav N, Kumar N, Prasad P, Shirbhate S, Sehrawat S, Lochab B. Stable dispersions of covalently tethered polymer improved graphene oxide nanoconjugates as an effective vector for siRNA delivery. ACS Appl Mat Interfaces (2018) 10(17):14577–93. doi: 10.1021/acsami.8b03477
24. Liu Z, Robinson JT, Sun X, Dai H. PEGylated nanographene oxide for delivery of water-insoluble cancer drugs. J Am Chem Soc (2008) 130(33):10876–7. doi: 10.1021/ja803688x
25. Li Y, Zhang T, Liu Q, He J. PEG-derivatized dual-functional nanomicelles for improved cancer therapy. Front Pharmacol (2019) 10:808. doi: 10.3389/fphar.2019.00808
26. Tabish TA, Narayan RJ. Crossing the blood–brain barrier with graphene nanostructures. Mat Today (2021) 51:393–401. doi: 10.1016/j.mattod.2021.08.013
27. Syama S, Paul W, Sabareeswaran A, Mohanan PV. Raman spectroscopy for the detection of organ distribution and clearance of PEGylated reduced graphene oxide and biological consequences. Biomaterials (2017) 131:121–30. doi: 10.1016/j.biomaterials.2017.03.043
28. Liu G, Shen H, Mao J, Zhang L, Jiang Z, Sun T, et al. Transferrin modified graphene oxide for glioma-targeted drug delivery: In vitro and in vivo evaluations. ACS Appl Mat Interfaces (2013) 5(15):6909–14. doi: 10.1021/am402128s
29. Louis DN, Perry A, Wesseling P, Brat DJ, Cree IA, Figarella-Branger D, et al. The 2021 WHO classification of tumors of the central nervous system: A summary. Neuro Oncol (2021) 23(8):1231–51. doi: 10.1093/neuonc/noab106
30. Cançado L, Takai K, Enoki T, Endo M, Kim Y, Mizusaki H, et al. General equation for the determination of the crystallite size l a of nanographite by raman spectroscopy. Appl Phys Lett (2006) 88(16):163106. doi: 10.1063/1.2196057
31. Díaz B. Invadopodia detection and gelatin degradation assay. Bio-protocol (2013) 3(24):e997. doi: 10.21769/BioProtoc.997
32. Kumar N, Prasad P, Jash E, Jayasundar S, Singh I, Alam N, et al. cAMP regulated EPAC1 supports microvascular density, angiogenic and metastatic properties in a model of triple negative breast cancer. Carcinogenesis (2018) 39(10):1245–53. doi: 10.1093/carcin/bgy090
33. Chua CK, Pumera M. Monothiolation and reduction of graphene oxide via one-pot synthesis: Hybrid catalyst for oxygen reduction. ACS Nano (2015) 9(4):4193–9. doi: 10.1021/acsnano.5b00438
34. Fang M, Wang K, Lu H, Yang Y, Nutt S. Covalent polymer functionalization of graphene nanosheets and mechanical properties of composites. J Mat Chem (2009) 19(38):7098–105. doi: 10.1039/b908220d
35. Yadav N, Lochab B. A comparative study of graphene oxide: Hummers, Intermediate and Improved method. FlatChem (2019) 13:40–9. doi: 10.1016/j.flatc.2019.02.001
36. Marcano DC, Kosynkin DV, Berlin JM, Sinitskii A, Sun Z, Slesarev A, et al. Improved synthesis of graphene oxide. ACS Nano (2010) 4(8):4806–14. doi: 10.1021/nn1006368
37. Kabiri S, Tran DN, Azari S, Losic D. Graphene-diatom silica aerogels for efficient removal of mercury ions from water. ACS Appl Mat Interfaces (2015) 7(22):11815–23. doi: 10.1021/acsami.5b01159
38. Chen J, Li Y, Huang L, Li C, Shi G. High-yield preparation of graphene oxide from small graphite flakes via an improved Hummers method with a simple purification process. Carbon (2015) 81:826–34. doi: 10.1016/j.carbon.2014.10.033
39. Yu F, Zhu C, Xie Q, Wang Y. Adenosine A2A receptor antagonists for cancer immunotherapy: Miniperspective. J Med Chem (2020) 63(21):12196–212. doi: 10.1021/acs.jmedchem.0c00237
40. Merighi S, Battistello E, Giacomelli L, Varani K, Vincenzi F, Borea PA, et al. Targeting A3 and A2A adenosine receptors in the fight against cancer. Expert Opin Ther Targets (2019) 23(8):669–78. doi: 10.1080/14728222.2019.1630380
41. Wood JM, Bold G, Buchdunger E, Cozens R, Ferrari S, Frei J, et al. PTK787/ZK 222584, a novel and potent inhibitor of vascular endothelial growth factor receptor tyrosine kinases, impairs vascular endothelial growth factor-induced responses and tumor growth after oral administration. Cancer Res (2000) 60(8):2178–89.
42. Peruzynska M, Cendrowski K, Barylak M, Tkacz M, Piotrowska K, Kurzawski M, et al. Comparative in vitro study of single and four layer graphene oxide nanoflakes–cytotoxicity and cellular uptake. Toxicol In Vitro (2017) 41:205–13. doi: 10.1016/j.tiv.2017.03.005
43. Berridge MJ, Bootman MD, Roderick HL. Calcium signalling: Dynamics, homeostasis and remodelling. Nat Rev Mol Cell Biol (2003) 4(7):517–29. doi: 10.1038/nrm1155
44. Terrié E, Déliot N, Benzidane Y, Harnois T, Cousin L, Bois P, et al. Store-operated calcium channels control proliferation and self-renewal of cancer stem cells from glioblastoma. Cancers (Basel) (2021) 13(14):3428. doi: 10.3390/cancers13143428
45. Rosenberg SS, Spitzer NC. Calcium signaling in neuronal development. Cold Spring Harb Perspect Biol (2011) 3(10):a004259. doi: 10.1101/cshperspect.a004259
46. Maklad A, Sharma A, Azimi I. Calcium signaling in brain cancers: Roles and therapeutic targeting. Cancers (Basel) (2019) 11(2):145. doi: 10.3390/cancers11020145
47. Leclerc C, Haeich J, Aulestia FJ, Kilhoffer M-C, Miller AL, Neant I, et al. Calcium signaling orchestrates glioblastoma development: Facts and conjunctures. Biochim Biophys Acta Mol Cell Res (2016) 1863(6):1447–59. doi: 10.1016/j.bbamcr.2016.01.018
48. Tiburcio PD, Locke MC, Bhaskara S, Chandrasekharan MB, Huang LE. The neural stem-cell marker CD24 is specifically upregulated in idh-mutant glioma. Transl Oncol (2020) 13(10):100819. doi: 10.1016/j.tranon.2020.100819
49. Mishra VS, Kumar N, Raza M, Sehrawat S. Amalgamation of PI3K and EZH2 blockade synergistically regulates invasion and angiogenesis: Combination therapy for glioblastoma multiforme. Oncotarget (2020) 11(51):4754. doi: 10.18632/oncotarget.27842
50. Deng J, Gao G, Wang L, Wang T, Yu J, Zhao Z. CD24 expression as a marker for predicting clinical outcome in human gliomas. J BioMed Biotechnol (2012) 517172. doi: 10.1155/2012/517172
51. Tsai F-C, Kuo G-H, Chang S-W, Tsai P-J. Ca2+ signaling in cytoskeletal reorganization, cell migration, and cancer metastasis. BioMed Res Int (2015):409245. doi: 10.1155/2015/409245
52. Davis FM, Azimi I, Faville RA, Peters AA, Jalink K, Putney J, et al. Induction of epithelial–mesenchymal transition (EMT) in breast cancer cells is calcium signal dependent. Oncogene (2014) 33(18):2307–16. doi: 10.1038/onc.2013.187
53. Scott EN, Meinhardt G, Jacques C, Laurent D, Thomas AL. Vatalanib: The clinical development of a tyrosine kinase inhibitor of angiogenesis in solid tumours. Expert Opin Investig Drugs (2007) 16(3):367–79. doi: 10.1517/13543784.16.3.367
54. Paesler J, Gehrke I, Razavi R, Gandhirajan RK, Filipovich A, Hertweck M, et al. Selective targeting of vascular endothelial growth factor (VEGF) receptor signaling with pazopanib and vatalanib induces apoptosis in chronic lymphoctic leukemia (CLL) cells in vitro inhibits growth of human CLL like tumor xenografts in mice. Blood (2009) 114(22):3451. doi: 10.1182/blood.V114.22.3451.3451
55. Montesinos MC, Desai A, Chen J-F, Yee H, Schwarzschild MA, Fink JS, et al. Adenosine promotes wound healing and mediates angiogenesis in response to tissue injury via occupancy of A2A receptors. Am J Pathol (2002) 160(6):2009–18. doi: 10.1016/S0002-9440(10)61151-0
Keywords: glioblastoma multiforme, A2A receptor, drug delivery, graphene oxide, PEGylation, CPI444, vatalanib, combination therapy
Citation: Mishra VS, Patil S, Reddy PC and Lochab B (2022) Combinatorial delivery of CPI444 and vatalanib loaded on PEGylated graphene oxide as an effective nanoformulation to target glioblastoma multiforme: In vitro evaluation. Front. Oncol. 12:953098. doi: 10.3389/fonc.2022.953098
Received: 25 May 2022; Accepted: 20 July 2022;
Published: 16 August 2022.
Edited by:
Sandeep Singh, Central University of Punjab, IndiaReviewed by:
Sandeep Kumar Yadav, University of Texas MD Anderson Cancer Center, United StatesCopyright © 2022 Mishra, Patil, Reddy and Lochab. This is an open-access article distributed under the terms of the Creative Commons Attribution License (CC BY). The use, distribution or reproduction in other forums is permitted, provided the original author(s) and the copyright owner(s) are credited and that the original publication in this journal is cited, in accordance with accepted academic practice. No use, distribution or reproduction is permitted which does not comply with these terms.
*Correspondence: Puli Chandramouli Reddy, cGMucmVkZHlAc251LmVkdS5pbg==; Bimlesh Lochab, YmltbGVzaC5sb2NoYWJAc251LmVkdS5pbg==
†These authors have contributed equally to this work
Disclaimer: All claims expressed in this article are solely those of the authors and do not necessarily represent those of their affiliated organizations, or those of the publisher, the editors and the reviewers. Any product that may be evaluated in this article or claim that may be made by its manufacturer is not guaranteed or endorsed by the publisher.
Research integrity at Frontiers
Learn more about the work of our research integrity team to safeguard the quality of each article we publish.