
94% of researchers rate our articles as excellent or good
Learn more about the work of our research integrity team to safeguard the quality of each article we publish.
Find out more
ORIGINAL RESEARCH article
Front. Oncol., 17 August 2022
Sec. Pharmacology of Anti-Cancer Drugs
Volume 12 - 2022 | https://doi.org/10.3389/fonc.2022.952425
This article is part of the Research TopicTargeting Cancer Cell Intracellular Metabolism as a Strategy against Therapy ResistanceView all 7 articles
Butyrophilin Subfamily 3 Member A3 (BTN3A3) is a type I transmembrane protein belonging to the immunoglobulin (Ig) superfamily, which is expressed in many cancers. Clinical data show that ovarian cancer patients with high expression of BTN3A3 have a longer survival time, but the mechanism of BTN3A3 in the occurrence and progression of ovarian cancer is still unclear. Here, we found that BTN3A3 knockdown can promote the proliferation, migration and invasion of ovarian cancer cells, while overexpression of BTN3A3 can inhibit the proliferation, migration and invasion of ovarian cancer cells. We analyzed the immunoprecipitated BTN3A3 complex by mass spectrometry and found that BTN3A3 binds to FGF2, and the overexpression of BTN3A3 leads to a decrease in the protein level of FGF2, which in turn leads to a decrease in the level of phosphorylation of ERK1/2. By increasing the protein level of FGF2, it was found that the level of ERK1/2 phosphorylation also increased. Finally, the cancer promotion phenomenon caused by BTN3A3 knockdown can be improved by using ERK1/2 inhibitor SCH772984. To sum up, BTN3A3 interacts with FGF2, which inhibits FGF2/ERK1/2 axis and ultimately inhibits the proliferation, migration and invasion of ovarian cancer cells. Our results suggest that BTN3A3 may be a prognostic marker and a potential therapeutic target for ovarian cancer.
Ovarian cancer is a highly malignant type of tumor. At present, it has been one of the main causes of death of gynecological cancer patients (1, 2). Ovarian cancer is the second most frequent cause of gynecologic cancer deaths in women worldwide (3). The high fatality rate of this malignant tumor is largely due to the fact that nearly 75% of patients with ovarian cancer are diagnosed at the advanced stage of the tumor and are accompanied by extensive abdominal metastasis (4). It has been reported that the incidence of ovarian cancer is related to fertility in women (5, 6), sex hormone stimulation (7), persistent ovulation (7), family genetic history (8–10), oral use of contraceptive (11, 12), age of first birth and menopause (13), but they are all uncertain factors. Currently, there are no very effective biomarkers for ovarian cancer (14, 15). Therefore, for ovarian cancer, a heterogeneous disease with complex molecular mechanisms and genetic changes (16), it is particularly important to study the molecular mechanism of its occurrence and progression.
Butyrophilin (BTN) family is a type I transmembrane protein belonging to the immunoglobulin (Ig) superfamily (17, 18). It has structural homology with B7 family members at the extracellular domain level and is considered to be B7 family related proteins (19). The BTN3A is a subfamily of BTN family, including BTN3A1, BTN3A2 and BTN3A3. At present, it has been confirmed that BTN3A1 can kill tumor cells by activating Vγ9Vδ2 T cells, which indicates that it is related to tumor immunity (20, 21), but little is known about BTN3A2 and BTN3A3. As far as BTN3A3 is concerned, studies have shown that it may play an important role in some types of cancer. For example, studies on gastric cancer have found that the expression of BTN3A3 can help predict the sensitivity of gastric cancer patients to the chemotherapeutic drug fluorouracil (22), while in breast cancer, BTN3A3 can enhance the stemness of breast cancer cells through interaction with LSECtin (23). Among the related studies of ovarian cancer, some results show that the single nucleotide polymorphism (SNP) of BTN3A3 is negatively correlated with the risk of ovarian cancer (24). However, the mechanism of BTN3A3 in the occurrence and progression of ovarian cancer is not known.
Fibroblast Growth Factor 2 (FGF2) is a member of the heparin-binding growth factor family. It is an important angiogenic molecule involved in tumor progression (25–27). Studies have shown that FGF2 is one of several growth factors that play a core role in ovarian carcinogenesis (25, 28). Compared with normal ovarian tissues, the expression of FGF2 in ovarian cancer tissues was significantly increased (29, 30), and negatively correlated with the overall survival time of patients with ovarian cancer (29). Some studies have shown that FGF2 is closely related to extracellular signal-regulated kinase 1/2 (ERK1/2)/MAPK pathway, which can promote the proliferation, migration and invasion of tumor cells through the activation of ERK1/2 (26, 30, 31). The results of studies in patients with ovarian cancer show that FGF2 is one of several growth factors that play a core role in the carcinogenesis of ovarian cancer (25), and it is also the main angiogenic factor expressed in ovarian cancer at mRNA level (28). After transcription, the mRNA of FGF2 is translated into its polypeptide product-a complex set of four co-expressed isomers with apparent molecular weights of 24, 23, 22 and 18 kDa, respectively (32).
Clinical data show that ovarian cancer patients with high expression of BTN3A3 have a longer survival time, suggesting that BTN3A3 may play an important role in the occurrence and progression of ovarian cancer. Therefore, we knocked down or overexpressed BTN3A3 in ovarian cancer cell lines to detect cell proliferation, migration and invasion ability, and used immunoprecipitation combined with mass spectrometry to explore the possible mechanism of BTN3A3 in the progression of ovarian cancer.
Human ovarian cancer cells ES-2 and NIH : OVCAR-3 were obtained from American Type Culture Collection (ATCC). HO-8910 and HO-8910PM cells were kindly provided by Cell Bank/Stem Cell Bank, Chinese Academy of Sciences (Shanghai, China). SK-OV-3 cells was obtained from Shanghai Zhong Qiao Xin Zhou Biotechnology Co., Ltd. (Shanghai, China).
The BTN3A3 short hairpin RNA (shRNA) lentivirus was produced by Cyagen Biosciences Inc. (Guangzhou, China). Oligonucleotides were synthesized to generate an annealing shRNA targeting the sequence of BTN3A3 from position 2238 to 2258 (5’-CCCTGTCGGGTAGTCAT ATTT-3’), from 1213 to 1233 (5’-GAGAAGTCTTTGGCCTATCAT-3’) and from 1254 to 1274 (5’-CAAACCTGCGGATGTGATTCT-3’).
The pWPXL-Puro-BTN3A3 or pWPXL-Puro plasmids was co-transfected into 293T cells with packaging plasmid psPAX2 and envelope plasmid pMD2.G, respectively. After 48 hours, the virus was collected and filtered to obtain BTN3A3 overexpression lentivirus and control lentivirus. The plasmids and the specific oligonucleotide sequences used for plasmid construction are shown in Table S1 and Table S2.
Assays were performed as previously described (33). The antibodies used were listed in Table S3.
The cells were dispersed into single cells and seeded into 60 mm culture dishes. After cultured in CO2 incubator for 2 weeks, the cells were stained with crystal violet staining and photographed.
The cells were seeded to a 96-well plate. On the 1st, 2nd, 3rd and 4th day, 10 μl CCK-8 reagent was added into each well and put back into the CO2 incubator for 1 hour. The absorbance at 450 nm was determined by Synergy H4 Hybrid Microplate Reader (BioTek, Winooski, VT, USA).
The cells were suspended in serum-free medium and seeded in the upper layer of Transwell chamber, and the complete medium was added in the lower layer. In the invasion experiment, the Matrigel basement membrane matrix (BD Biosciences, MA, USA) should be laid in advance. After 24 hours, the cells passing through the membrane were stained with crystal violet, and then observed and photographed.
The cells were cultured in a six-well plate and scratched with the pipet tip when they grew to 95% fusion. After the cells were photographed, they were placed back into the CO2 incubator for 24 hours and photographed again.
An appropriate amount of protease inhibitor (Roche Diagnostics GmbH, Mannheim, Germany) and phosphatase inhibitor (Beyotime Biotechnology, Shanghai, China) were added to Pierce IP Lysis Buffer (Thermo Scientific, Rockford, IL, USA). The above lysate was mixed and added to the cell culture dish, scraped off the cells with the cell scraper, and lysed the cells on the ice. Protein A/G PLUS-Agarose beads (sc-2003, Santa Cruz Biotechnology, Dallas, TX, USA) was added to the lysate and shaken on a rotating shaker at 4°C for 1 hour to remove non-specific proteins. After centrifugation at 4°C for 5 minutes, Protein A/G PLUS-Agarose beads was removed. The primary antibody or control IgG (Table S3) was added to the lysate, shaken on a rotating shaker at 4°C for 2 hours, and incubated overnight with Protein A/G PLUS-Agarose beads. The beads were washed three times at 4°C with IP Lysis Buffer for 5 minutes each time. Then 2 × loading buffer was added and boiled at 95°C for 10 minutes to separate the protein from beads. The supernatant was collected for Western blot analyses.
As mentioned above, the co-immunoprecipitation experiment was carried out with Flag-tag antibody, and the final collected supernatant was used for sodium dodecyl sulfate-polyacrylamide gel electrophoresis (SDS-PAGE), and the gel was stained with Coomassie Brilliant Blue staining solution. The gel with the sample was cut off and used for mass spectrometric analysis (Gene Denovo, Guangzhou, China).
The cells on the cover glass were fixed with 4% paraformaldehyde and permeabilized by 0.5% Trixton-100, then blocked with 5% BSA for 30 minutes. The cells were incubated with primary antibody (Table S3) at 37°C for 1 hour. After washing with PBST, the cells were incubated with the Alexa Fluor-conjugated secondary antibody (Table S3) at room temperature for 2 hours, and then incubated with 4’, 6-diamidino-2-phenylindole (DAPI) for 3 minutes to detect the nuclei. The cells were observed and photographed by confocal microscope (Leica TCS SP8, Leica Microsystems, Solms, Germany).
Data are presented as mean ± SEM and comparisons were made using one-way analysis of variance (ANOVA) or Student’s t test. All P-values below 0.05 were considered significant.
Human Protein Atlas (HPA) provides researchers with biomedical resources based on clinical pathology, from which we found that ovarian cancer patients with high expression of BTN3A3 had a longer survival (P = 0.00018) (Figure 1A), suggesting that BTN3A3 may play an important role in the occurrence and progression of ovarian cancer. In addition, the analysis of Clinical Proteomic Tumor Analysis Consortium (CPTAC) clinical database on UALCAN website showed that the protein level of BTN3A3 in ovarian cancer was significantly lower than that in normal ovarian tissue (P = 0.0013) (Figure 1B), including 25 normal ovarian samples and 100 ovarian cancer samples. In order to understand the expression level of BTN3A3 in different ovarian cancer cells, Western blot (Figure 1C) were used to detect the protein level of BTN3A3 in six ovarian cancer cell lines (ES-2, 3AO, HO-8910, HO-8910PM, NIH : OVCAR-3 and SK-OV-3). Then, we selected two ovarian cancer cell lines ES-2 and SK-OV-3 with high expression of BTN3A3. The two cell lines were infected with lentivirus encoding shRNA targeting BTN3A3, and their knockdown efficiency was detected by Western blot (Figures 1D, E). The results showed that the interference effect of BTN3A3-shRNA1 and BTN3A3-shRNA2 was better than that of BTN3A3-shRNA3 in ES-2 and SK-OV-3 cells. So we chose BTN3A3-shRNA1 and BTN3A3-shRNA2 to carry on the follow-up experiments. Then BTN3A3 was overexpressed in 3AO and NIH : OVCAR-3 cells with lentivirus. The effect of overexpression was detected by Western blot (Figures 1F, G).
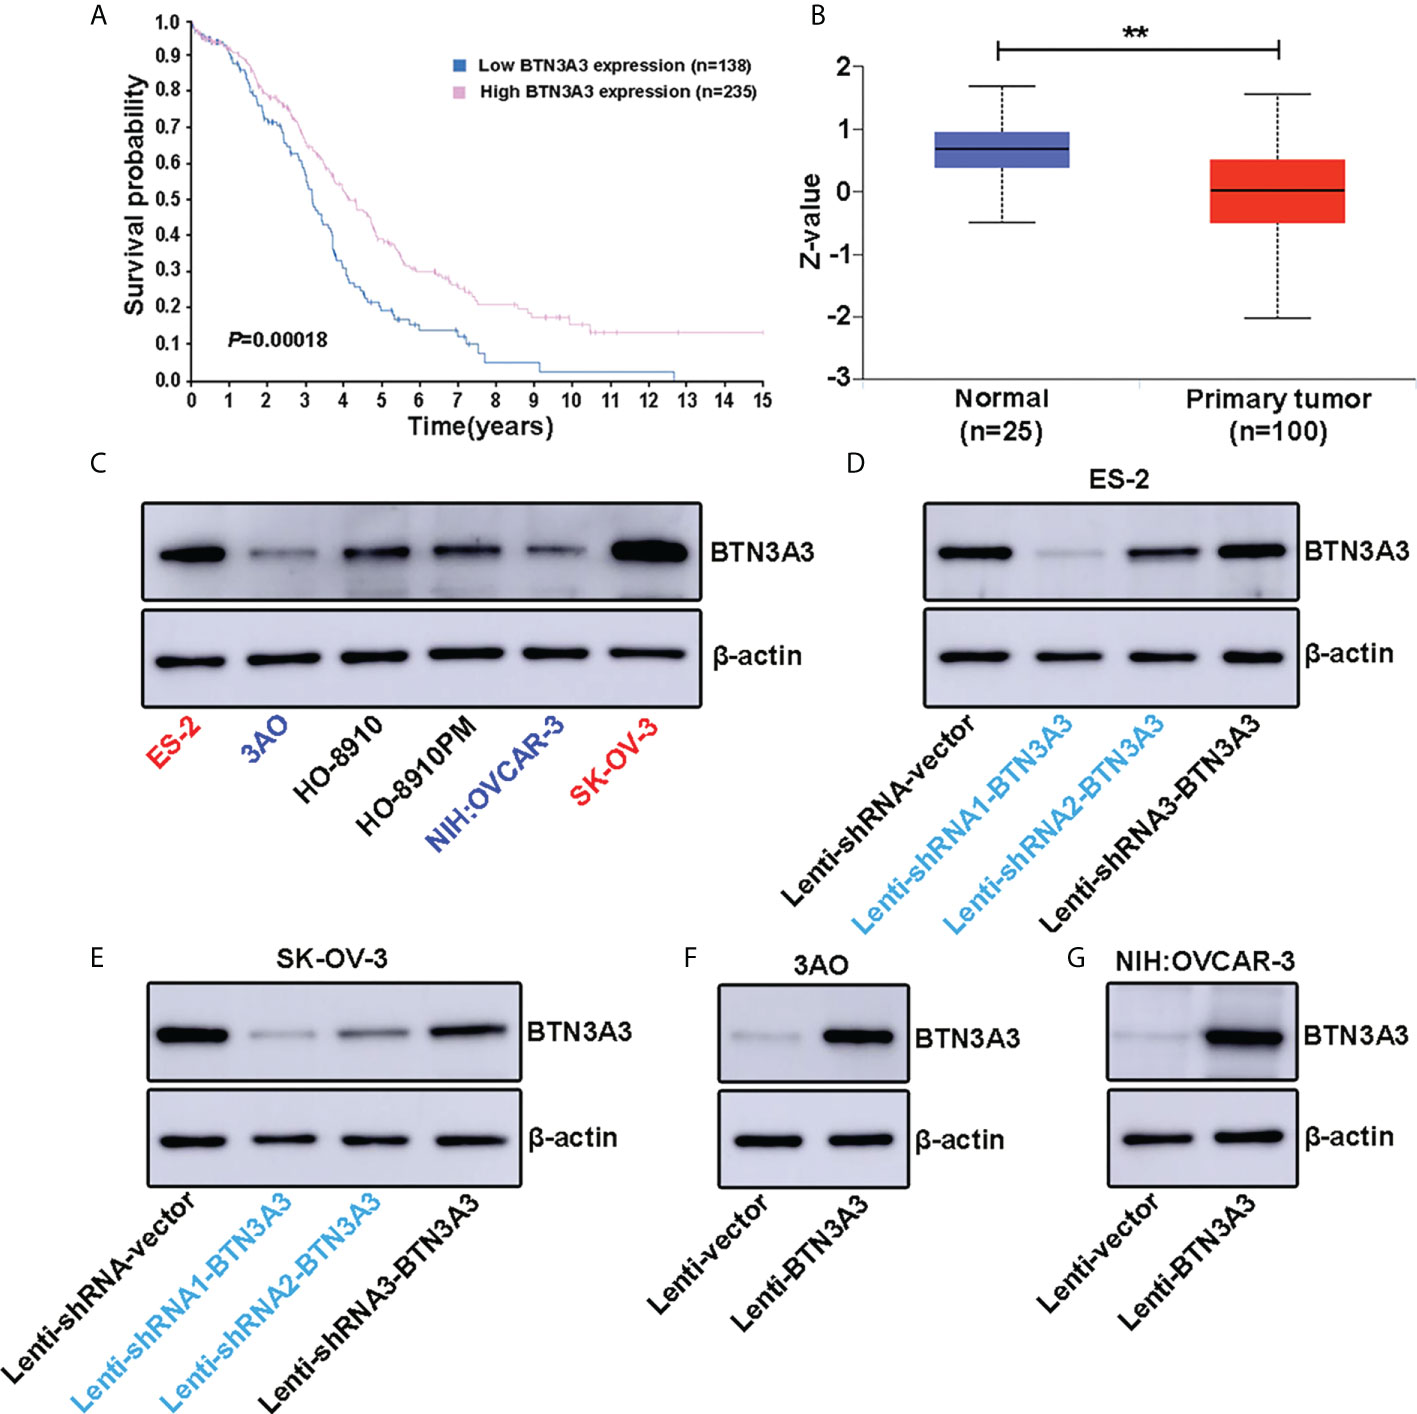
Figure 1 Expression level of BTN3A3 in ovarian cancer cell lines and establishment of stable transfection cell lines. (A) The Human Protein Atlas (HPA) website (https://www.proteinatlas.org/ENSG00000111801-BTN3A3/pathology/ovarian+cancer) shows the relationship between BTN3A3 expression and the prognosis of patients with ovarian cancer. (B) The CPTAC database analysis results on the UALCAN website (https://ualcan.path.uab.edu/cgi-bin/CPTAC-Result.pl?genenam=BTN3A3&ctype=OV) show that the protein level of BTN3A3 differs between normal ovarian and ovarian cancer tissues. The expression of BTN3A3 in six ovarian cancer cell lines was detected by Western blot (C). Western blot was also used to detect the effect of BTN3A3 knockdown in ES-2 (D) and SK-OV-3 (E) cells and the overexpression of BTN3A3 in 3AO (F) and NIH : OVCAR-3 (G) cells. ** P < 0.01.
We examined the effect of BTN3A3 knockdown on cell proliferation by colony formation assay. The results showed that after BTN3A3 knockdown, the proliferation ability of two cell lines ES-2 and SK-OV-3 cells was significantly higher than that of control cells (Figures 2A–D). Transwell migration assay (Figures 2E-H) and wound-healing assay (Figures 2I, J) were used to detect the migration ability of cells. The results showed that the migration ability of ES-2 and SK-OV-3 cells was significantly enhanced after BTN3A3 knockdown. Transwell invasion assay showed that the invasion ability of ES-2 and SK-OV-3 was significantly enhanced after BTN3A3 knockdown (Figures 2K–N).
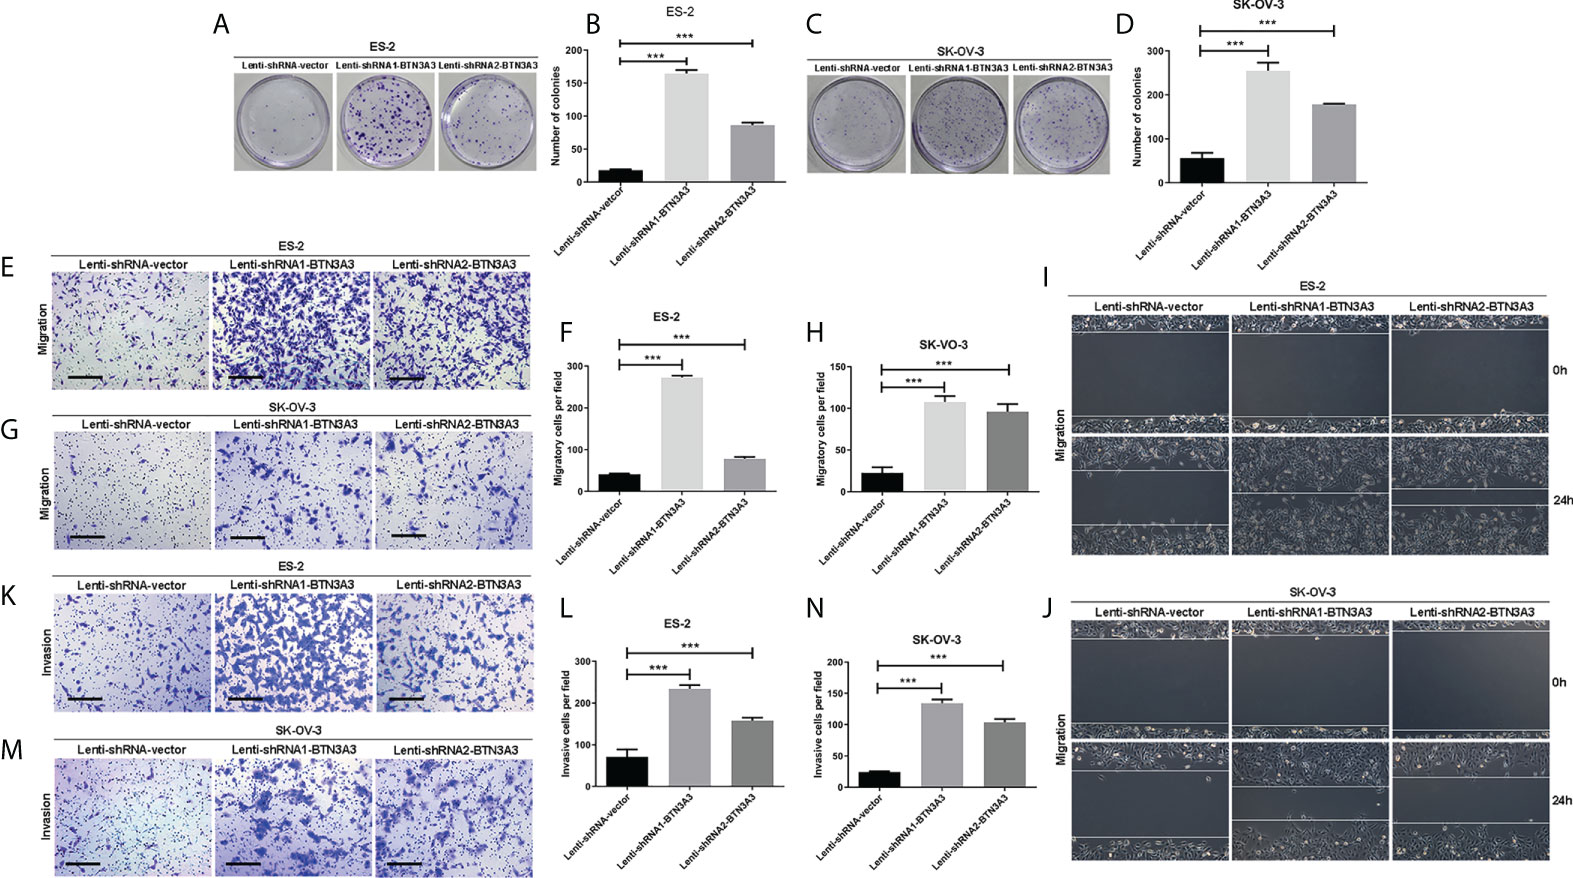
Figure 2 Knockdown of BTN3A3 promotes the proliferation, migration and invasion of ovarian cancer cells. The colony formation assay was used to detect the proliferation ability of ES-2 (A, B) and SK-OV-3 (C, D) cells after BTN3A3 knockdown. Transwell assay was used to detect the migration (E-H) and invasion (K-N) ability of ES-2 cells and SK-OV-3 cells. The migration ability of ES-2 (I) and SK-OV-3 (J) cells was also detected by wound-healing experiment. Data are expressed as mean ± SEM of three replicates. *** P < 0.001. (E, G, K, M) Scale bars: 50 µm.
Similarly, we used clone formation assay (Figures 3A–D) to determine the changes in cell proliferation after overexpression of BTN3A3. In 3AO and NIH : OVCAR-3 cells, the proliferation ability of overexpressed BTN3A3 cells was significantly inhibited compared with control cells. The results of Transwell migration assay (Figures 3E–H) and wound-healing assay (Figures 3I, J) showed that the migration ability of 3AO and NIH : OVCAR-3 cells decreased significantly after overexpression of BTN3A3. Transwell invasion assay showed that the invasion ability of 3AO and NIH : OVCAR-3 cells decreased significantly after overexpression of BTN3A3 (Figures 3K-N).
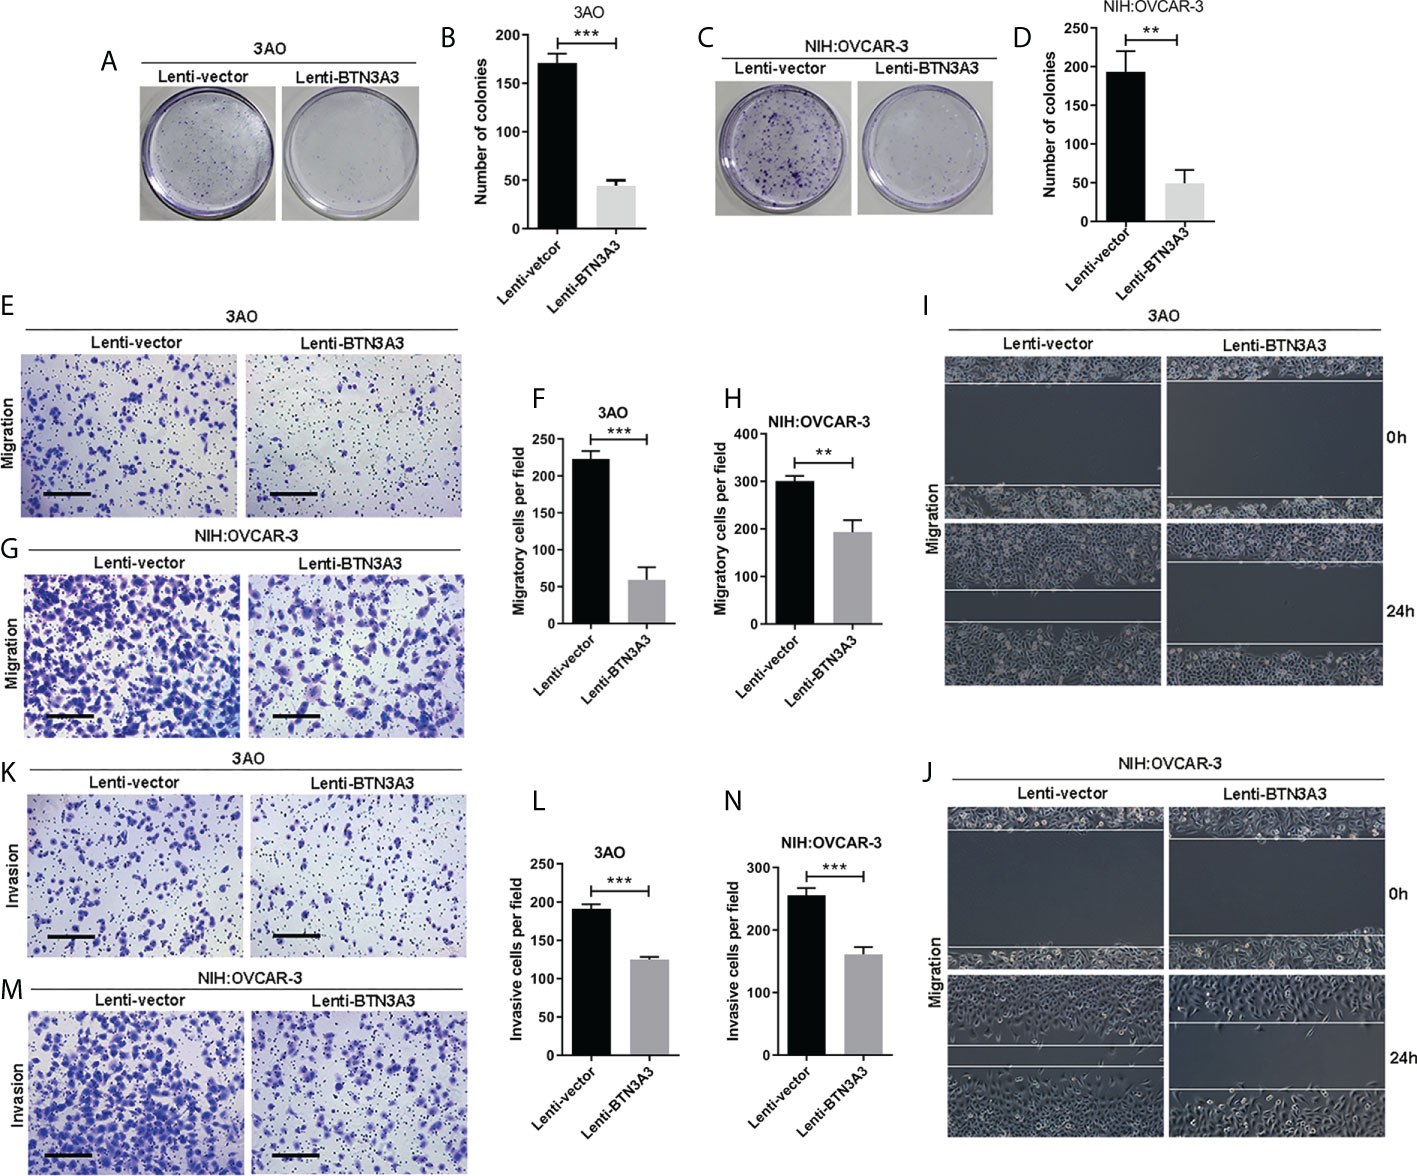
Figure 3 Overexpression of BTN3A3 inhibits the proliferation, migration and invasion of ovarian cancer cells. The colony formation assay was used to detect the proliferation ability of 3AO (A, B) and NIH : OVCAR-3 (C, D) cells. Transwell assay was used to detect the migration (E–H) and invasion (K-N) ability of 3AO cells and NIH : OVCAR-3 cells. The migration ability of 3AO (I) and NIH : OVCAR-3 (J) cells was also detected by wound-healing experiment. Data are expressed as mean ± SEM of three replicates. **P < 0.01, ***P < 0.001. (E, G, K, M) Scale bars: 50 µm.
In order to further explore the mechanism of BTN3A3 inhibiting the progression of ovarian cancer, we constructed the BTN3A3 overexpression plasmid with 3 × Flag tag and the control plasmid with 3 × Flag (Table S1), which were transfected into NIH : OVCAR-3 cells respectively. Then the co-immunoprecipitation assay was carried out, and the immunoprecipitation protein complex was analyzed by mass spectrometry (Figure 4A). Among the putative binding proteins (Table S4), we confirmed the interaction between BTN3A3 and FGF2 by plasmid co-transfection, followed by IP (immunoprecipitation) pull-down and IB (immunoblotting) detection. We co-transfected 3 × Flag-BTN3A3 and 3 × HA-FGF2 plasmids (Table S1) in 293T cells, and carried out exogenous co-immunoprecipitation assay (Figure 4B). Endogenous co-immunoprecipitation assay was carried out in 3AO and NIH : OVCAR-3 cells (Figures 4C, D). The results further confirmed the binding of BTN3A3 and FGF2. The results of immunofluorescence detection showed that BTN3A3 and FGF2 were co-located in NIH : OVCAR-3 cells (Figure 4E).
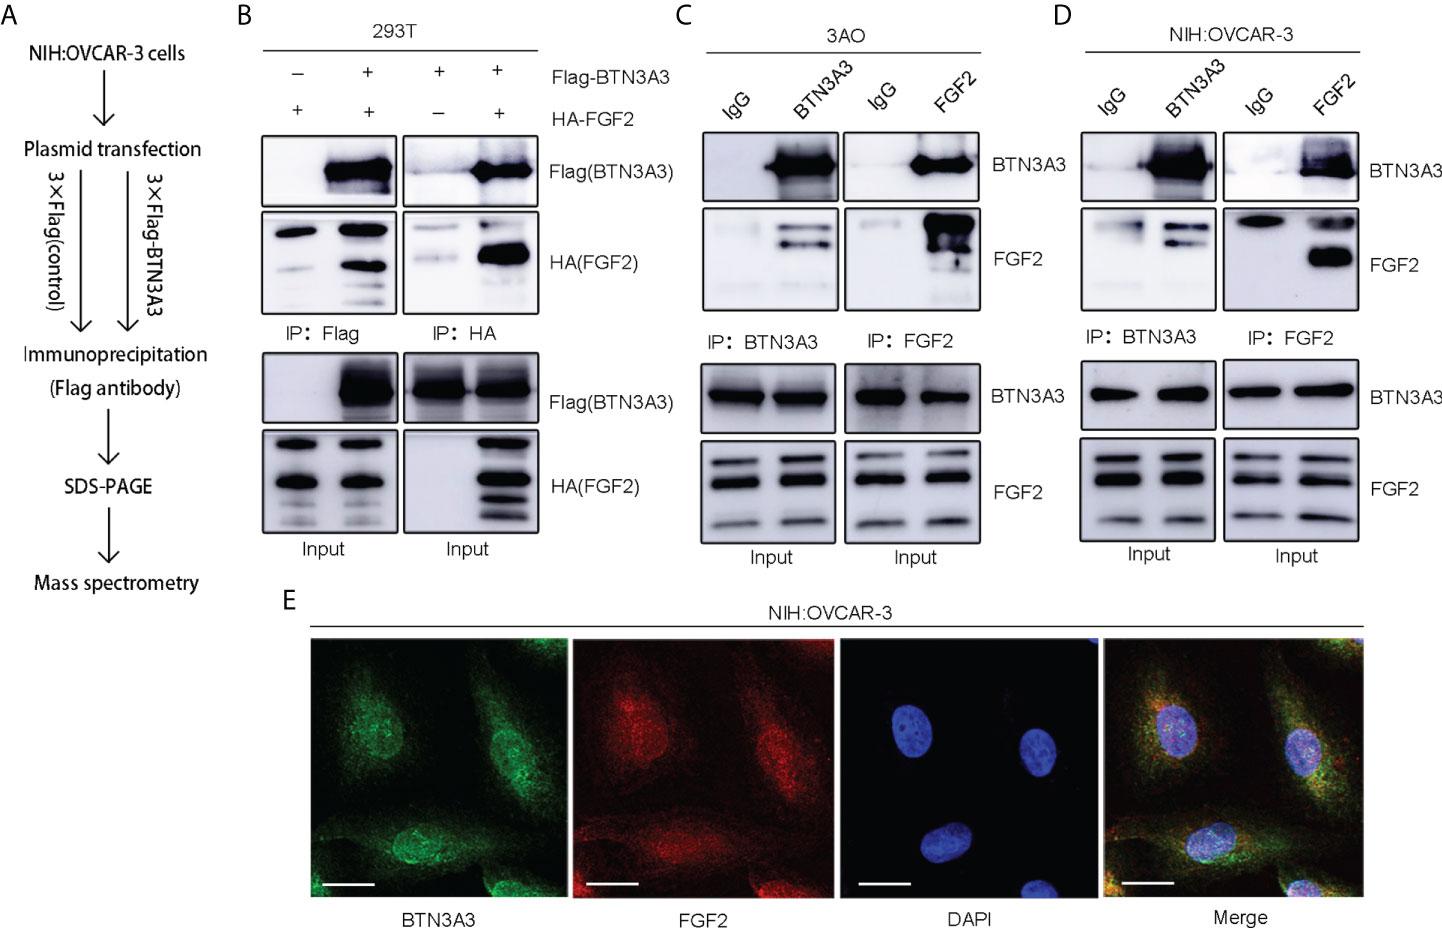
Figure 4 Identification of FGF2 as a binding protein of BTN3A3. (A) The Flag-labeled BTN3A3 recombinant plasmid was transfected into NIH : OVCAR-3 cells. The cell lysate was co-immunoprecipitated with Flag-tag antibody, and the immunoprecipitation complex was detected by mass spectrometry. (B) 293T cells were transfected with Flag-BTN3A3 plasmid and HA-FGF2 plasmid respectively for co-immunoprecipitation to detect the exogenous binding of BTN3A3 and FGF2. The 3AO (C) and NIH : OVCAR-3 (D) cells were used for co-immunoprecipitation to detect the endogenous binding of BTN3A3 and FGF2. (E) Cellular immunofluorescence assay showed the co-localization of BTN3A3 and FGF2 in NIH : OVCAR-3 cells. Scale bars: 20 µm.
After overexpression of BTN3A3, we found that the expression of FGF2 decreased, and the phosphorylation of ERK1/2 also decreased. We used FGF2 overexpression plasmid to rescue FGF2 in 3AO BTN3A3 overexpression cells and NIH : OVCAR-3 BTN3A3 overexpression cells respectively. The results showed that the level of ERK1/2 phosphorylation in BTN3A3 overexpressed cells increased significantly after FGF2 rescue (Figure 5). Therefore, we found that the protein level of BTN3A3 could affect the activation of ERK1/2. In addition, we found that overexpression of BTN3A3 in 3AO and NIH : OVCAR-3 cells significantly inhibited the proliferative capacity of the cells. In BTN3A3 overexpressed cells, further increasing the level of FGF2 protein significantly increased the proliferative capacity of the cells (Figure S1).
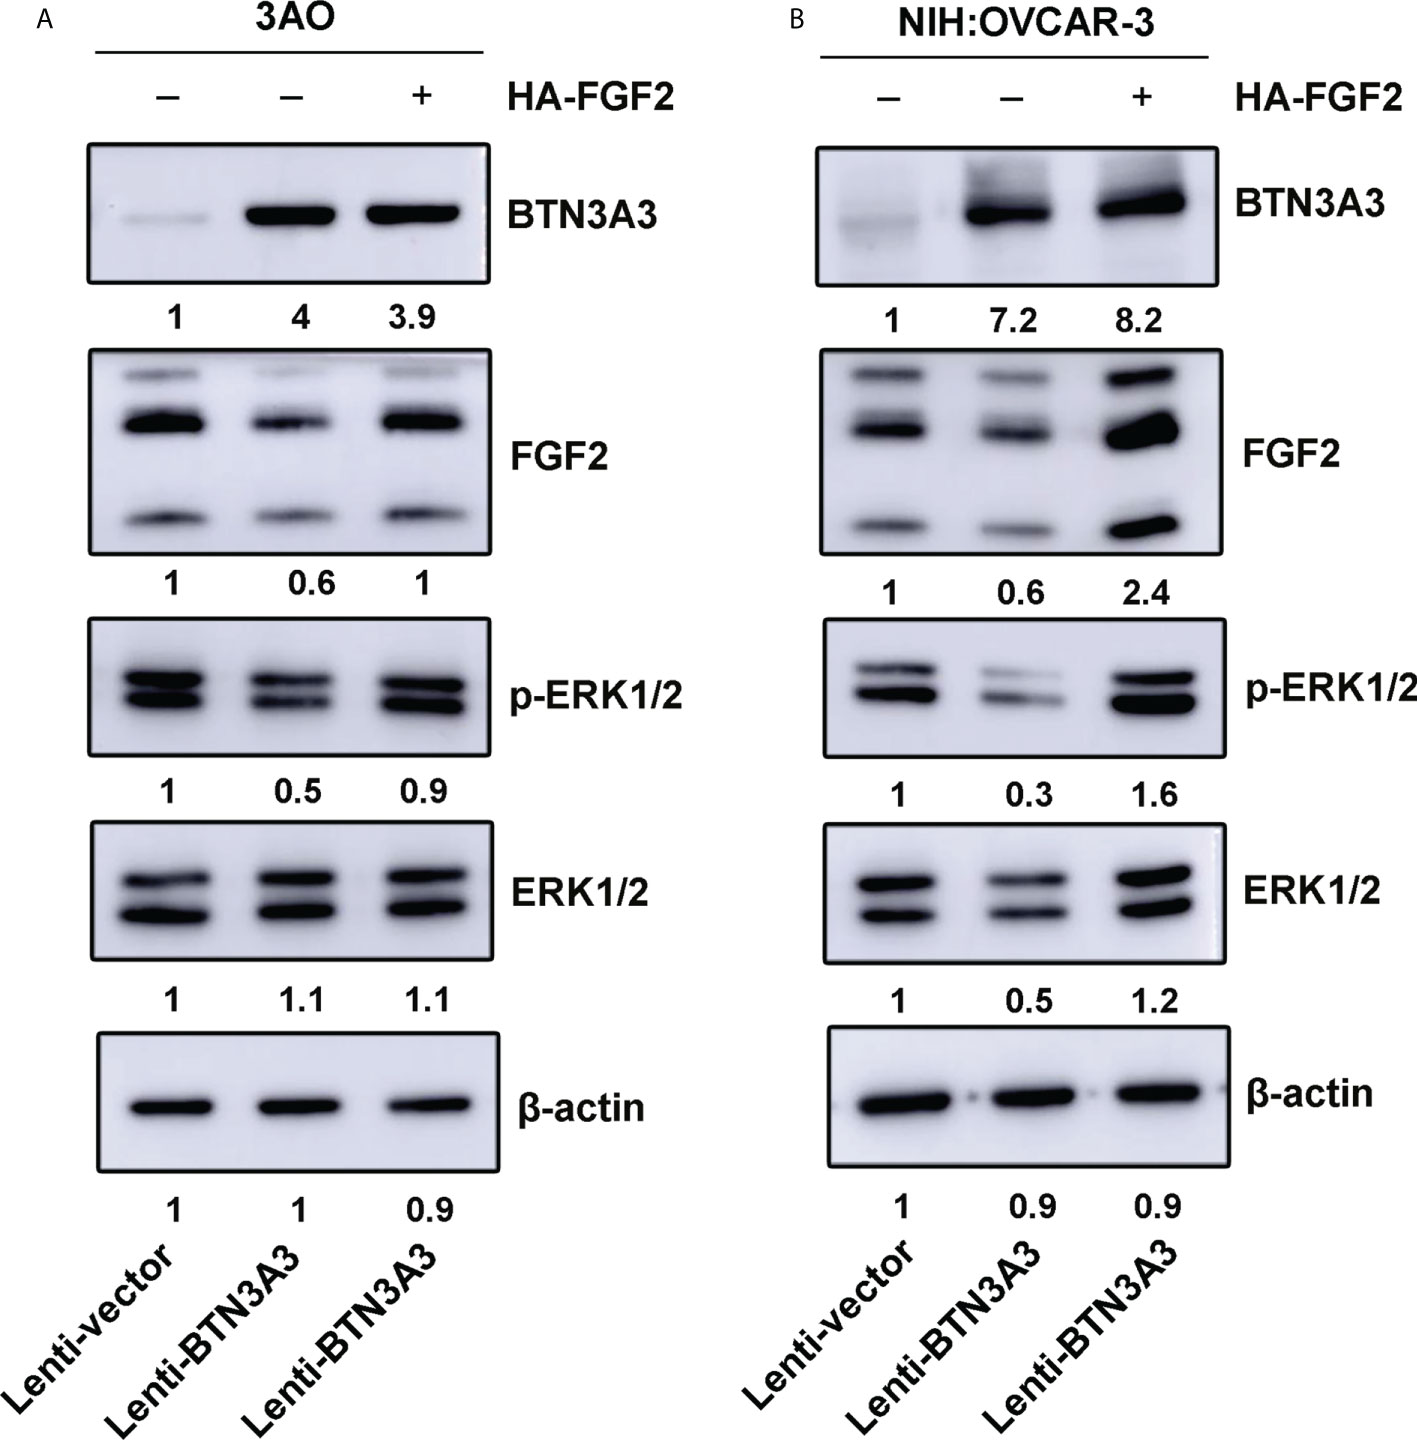
Figure 5 FGF2 rescue increases phosphorylation of ERK1/2. The FGF2 recombinant plasmids were transfected into 3AO (A) and NIH : OVCAR-3 (B) cells respectively, and the changes of FGF2 protein level and ERK1/2 phosphate level were detected by Western blot.
We found that BTN3A3 knockdown in ovarian cancer cells showed an increase in the level of ERK1/2 phosphorylation, so we treated the cells with ERK1/2 inhibitor SCH772984 (HY-50846, MedChemExpress, NJ, USA) at the final concentration of 100 nM, and found that the level of ERK1/2 phosphorylation decreased significantly (Figures 6A, B). The proliferation capability of SCH772984-treated BTN3A3-shRNA1 and BTN3A3-shRNA2 cells was examined using a colony formation assay. We found that the ability of cells to form colonies was significantly reduced (Figures S2A, B; Figures 6C, D). Then, we used the wound-healing experiment to further detect the migration ability of ovarian cancer cells. Compared with BTN3A3 knockdown group, BTN3A3 knockdown combined with SCH772984 treatment significantly inhibited the migration ability of ovarian cancer cells (Figures 6E, F). The Transwell migration assay showed the same results (Figures S2C, D; Figures 6G, H). Finally, we used Transwell invasion assay to detect the invasive ability of cells (Figures S2E, F; Figures 6I, J), results also showed that compared with BTN3A3 knockdown group, BTN3A3 knockdown combined with SCH772984 treatment significantly inhibited the invasive ability of cells.
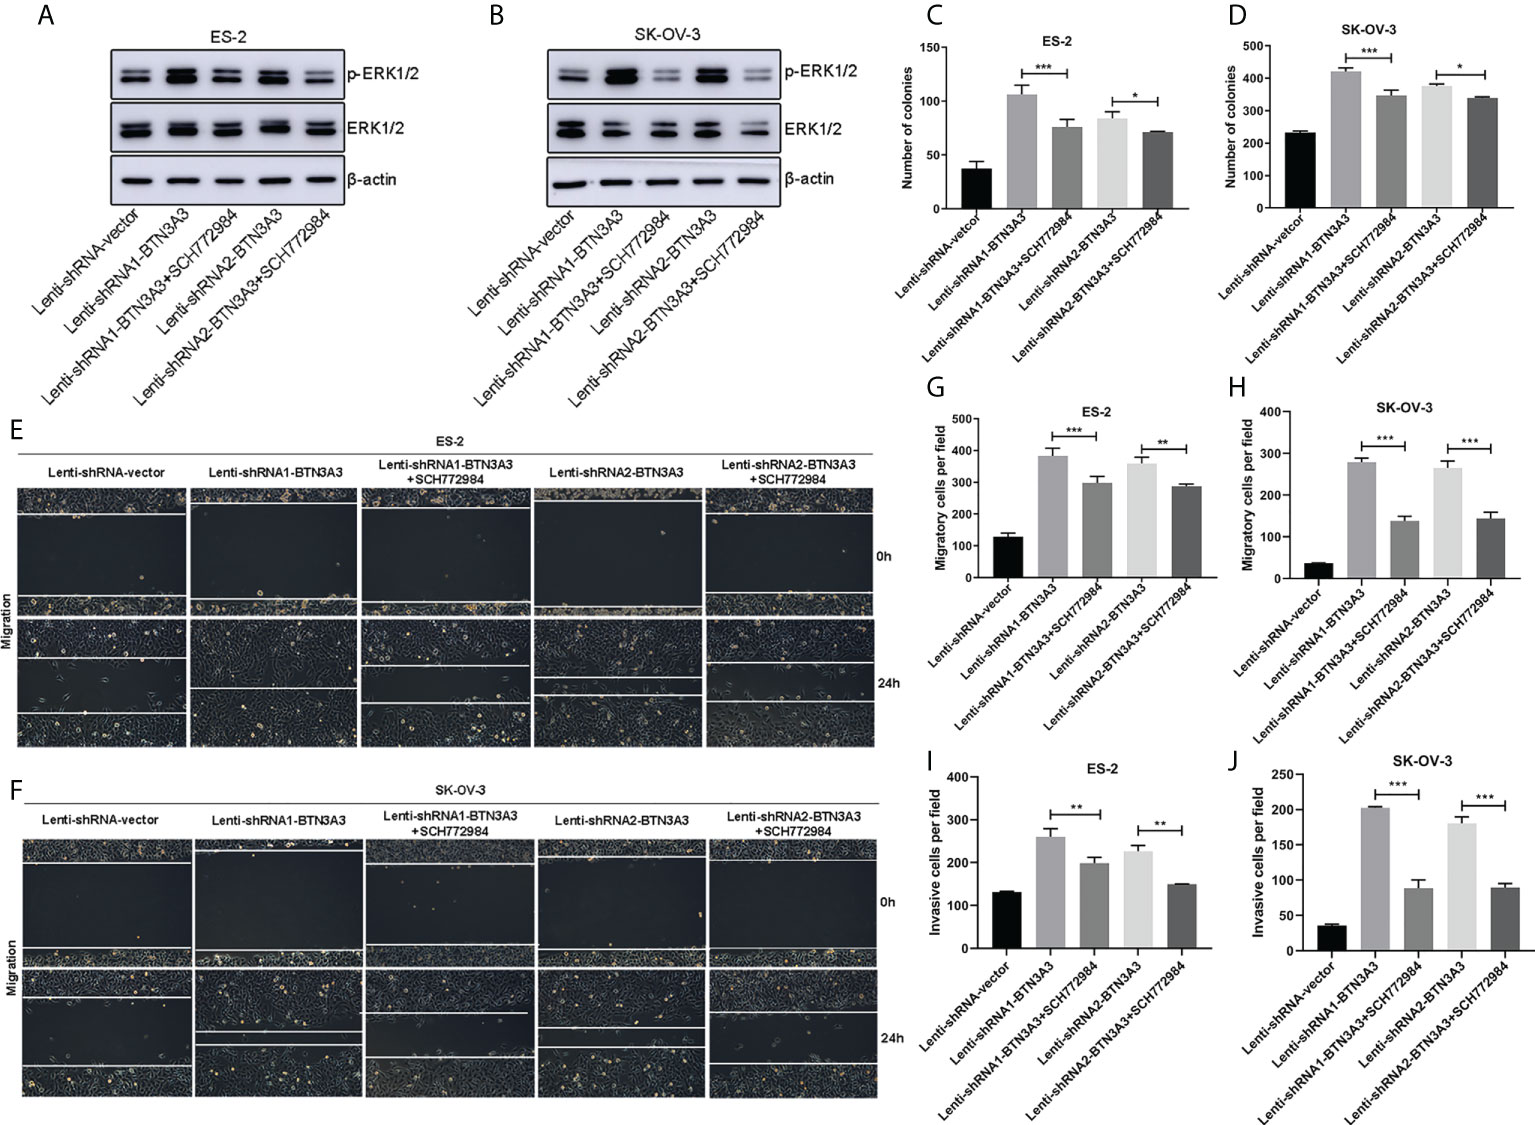
Figure 6 Effect of ERK1/2 inhibitor SCH772984 on ES-2 and SK-OV-3 cells after BTN3A3 knockdown. In BTN3A3 knockdown cells, ES-2 (A) and SK-OV-3 (B) were treated with SCH772984 with a final concentration of 100 nM, respectively, and the phosphorylation level of ERK1/2 was detected by Western blot. In BTN3A3 knockdown cells, colony formation assay (C, D) showed the change of proliferation ability after treatment with SCH772984. Wound-healing assay (E, F) and Transwell migration assay (G, H) showed the change of migration ability after treatment with SCH772984 in BTN3A3 knockdown cells, while the change of invasive ability was detected by Transwell invasion assay (I, J). For the representative images of the results of colony formation assay and Transwell migration and invasion assays, please see Figure S2. Data are expressed as mean ± SEM of three replicates. *P < 0.05, **P < 0.01, ***P < 0.001.
The role of BTN3A3 in the occurrence and progression of ovarian cancer is unknown, but it is mentioned in only one article that BTN3A3’s SNP is negatively correlated with the risk of ovarian cancer (24). In the clinicopathological data of HPA, we found that BTN3A3 expression was correlated with the prognosis of ovarian cancer. This makes us very interested in the relationship between BTN3A3 and ovarian cancer, so a series of studies have been carried out.
Firstly, we found that BTN3A3 can inhibit the proliferation, migration and invasion of ovarian cancer cells. Then we analyzed the immunoprecipitation BTN3A3 complex by mass spectrometry and found that FGF2 may bind to BTN3A3, which was further confirmed by a series of co-immunoprecipitation experiments. FGF2 is a relatively complex protein, and its mRNA is translated into a complex set of protein isomers with apparent molecular weights of 24, 23, 22 and 18 kDa, respectively (32). Most of our Western blot results show only three of these bands, while four bands are shown in 293T cells. It is speculated that 293T is a human embryonic kidney cell and expresses a wider range of proteins.
The combination of BTN3A3 and FGF2 suggests that BTN3A3 may play a role in regulating FGF2 signal. In addition, several laboratories have reported that there is a close relationship between the protein level of FGF2 and the phosphorylation level of ERK1/2 (19, 21, 30). The overexpression of BTN3A3 leads to the decrease of FGF2 protein level. It is speculated that FGF2 may be degraded by ubiquitin or secreted outside the cell as a secretory protein, and the specific mechanism needs to be further studied. In order to further determine whether ERK1/2 is a downstream target of BTN3A3, we used ERK1/2 inhibitor SCH772984 to inhibit the increased phosphorylation of ERK1/2, caused by BTN3A3 knockdown. Experiments on proliferation, migration and invasion have proved that inhibition of ERK1/2 activation can save cancer promotion caused by BTN3A3 knockdown.
In addition, we also found that overexpression of BTN3A3 could reduce the protein level of FGF2 in the nucleus of ovarian cancer cell line 3AO (Figure S3). It has been reported that the deletion of FGF2 in nucleus of pancreatic stellate cells significantly inhibits the invasive ability of pancreatic cancer cells (34). In human glioblastoma multiforme, FGF2’s nuclear import promoted the proliferation and survival of cancer cells (35). This proved that the decrease or increase of FGF2 in the nucleus may have an effect on the proliferation and invasion of cancer cells, but the cause of this phenomenon remains to be further studied.
To sum up, our studies have shown that BTN3A3 inhibits the proliferation, migration and invasion of ovarian cancer cells. BTN3A3 can bind to FGF2, regulate the protein level of FGF2, and then regulate the phosphorylation level of ERK1/2, thus affecting the proliferation, migration and invasion of ovarian cancer cells. These results suggest that BTN3A3 may play an important role in the progression of ovarian cancer, and may be a candidate protein to predict the prognosis of ovarian cancer patients and a potential therapeutic target for ovarian cancer.
The original contributions presented in the study are included in the article/Supplementary Material. Further inquiries can be directed to the corresponding authors.
All authors were involved in the experiments or discussion for this paper. SC, ZL, and SF participated in the writing of the manuscript. All authors contributed to the article and approved the submitted version.
This work was supported by the Xuzhou Municipal Science and Technology Project (KC20106 and KC21209); “333 Project” Award of Jiangsu Province (BRA2020252); “Six-one” Project for High-level Health Talents in Jiangsu Province (LGY2019057).
The authors declare that the research was conducted in the absence of any commercial or financial relationships that could be construed as a potential conflict of interest.
All claims expressed in this article are solely those of the authors and do not necessarily represent those of their affiliated organizations, or those of the publisher, the editors and the reviewers. Any product that may be evaluated in this article, or claim that may be made by its manufacturer, is not guaranteed or endorsed by the publisher.
The Supplementary Material for this article can be found online at: https://www.frontiersin.org/articles/10.3389/fonc.2022.952425/full#supplementary-material
Figure S1 | FGF2 rescue promotes the proliferation of ovarian cancer cells. The FGF2 recombinant plasmids were transfected into 3AO (A) and NIH : OVCAR-3 (B) cells respectively, and the change of proliferative ability was detected by CCK-8 assay. Data are expressed as mean ± SEM of four replicates. * represents the comparison between the Lenti-vector group and the Lenti-BTN3A3 group. # represents the comparison between the Lenti-BTN3A3 group and the Lenti-BTN3A3+FGF2 group. *P < 0.05, ***P < 0.001, ##P < 0.01, ###P < 0.001.
Figure S2 | The representative images of the results of colony formation assay and Transwell migration and invasion assays. In BTN3A3 knockdown cells, colony formation assay (A, B) showed the change of proliferation ability after treatment with SCH772984. Transwell migration assay (C, D) showed the change of migration ability after treatment with SCH772984 in BTN3A3 knockdown cells, while the change of invasive ability was detected by Transwell invasion assay (E, F). (C–F) Scale bars: 50 µm.
Figure S3 | The overexpression of BTN3A3 results in the decrease of FGF2 in the nucleus of 3AO cells. The results of cellular immunofluorescence assay showed that the FGF2 protein in the nucleus of 3AO cells decreased significantly after BTN3A3 overexpression. Scale bars: 20 µm.
1. Siegel RL, Miller KD, Fuchs HE, Jemal A. Cancer statistics, 2022. CA Cancer J Clin (2022) 72(1):7–33. doi: 10.3322/caac.21708
2. Silwal-Pandit L, Langerod A, Borresen-Dale AL. TP53 mutations in breast and ovarian cancer. Cold Spring Harb Perspect Med (2017) 7(1):a026252. doi: 10.1101/cshperspect.a026252
3. Lheureux S, Braunstein M, Oza AM. Epithelial ovarian cancer: Evolution of management in the era of precision medicine. CA Cancer J Clin (2019) 69(4):280–304. doi: 10.3322/caac.21559
4. Lengyel E. Ovarian cancer development and metastasis. Am J Pathol (2010) 177(3):1053–64. doi: 10.2353/ajpath.2010.100105
5. Toufakis V, Katuwal S, Pukkala E, Tapanainen JS. Impact of parity on the incidence of ovarian cancer subtypes: A population-based case-control study. Acta Oncol (2021) 60(7):850–5. doi: 10.1080/0284186X.2021.1919754
6. Skold C, Bjorge T, Ekbom A, Engeland A, Gissler M, Grotmol T, et al. Preterm delivery is associated with an increased risk of epithelial ovarian cancer among parous women. Int J Cancer (2018) 143(8):1858–67. doi: 10.1002/ijc.31581
7. Wentzensen N, Poole EM, Trabert B, White E, Arslan AA, Patel AV, et al. Ovarian cancer risk factors by histologic subtype: An analysis from the ovarian cancer cohort consortium. J Clin Oncol (2016) 34(24):2888–98. doi: 10.1200/JCO.2016.66.8178
8. Kumerow MT, Rodriguez JL, Dai S, Kolor K, Rotunno M, Peipins LA. Prevalence of americans reporting a family history of cancer indicative of increased cancer risk: Estimates from the 2015 national health interview survey. Prev Med (2022) 159:107062. doi: 10.1016/j.ypmed.2022.107062
9. Shao D, Cheng S, Guo F, Zhu C, Yuan Y, Hu K, et al. Prevalence of hereditary breast and ovarian cancer (HBOC) predisposition gene mutations among 882 HBOC high-risk Chinese individuals. Cancer Sci (2020) 111(2):647–57. doi: 10.1111/cas.14242
10. Lavoro A, Scalisi A, Candido S, Zanghì GN, Rizzo R, Gattuso G, et al. Identification of the most common BRCA alterations through analysis of germline mutation databases: Is droplet digital PCR an additional strategy for the assessment of such alterations in breast and ovarian cancer families? Int J Oncol (2022) 60(5):58. doi: 10.3892/ijo.2022.5349
11. Michels KA, Pfeiffer RM, Brinton LA, Trabert B. Modification of the associations between duration of oral contraceptive use and ovarian, endometrial, breast, and colorectal cancers. JAMA Oncol (2018) 4(4):516–21. doi: 10.1001/jamaoncol.2017.4942
12. Karlsson T, Johansson T, Hoglund J, Ek WE, Johansson A. Time-dependent effects of oral contraceptive use on breast, ovarian, and endometrial cancers. Cancer Res (2021) 81(4):1153–62. doi: 10.1158/0008-5472.CAN-20-2476
13. Webb PM, Jordan SJ. Epidemiology of epithelial ovarian cancer. Best Pract Res Clin Obstet Gynaecol (2017) 41:3–14. doi: 10.1016/j.bpobgyn.2016.08.006
14. Bonifácio VDB. Ovarian cancer biomarkers: moving forward in early detection. Adv Exp Med Biol (2020) 1219:355–63. doi: 10.1007/978-3-030-34025-4_18
15. Mallen A, Soong TR, Townsend MK, Wenham RM, Crum CP, Tworoger SS. Surgical prevention strategies in ovarian cancer. Gynecol Oncol (2018) 151(1):166–75. doi: 10.1016/j.ygyno.2018.08.005
16. Grunewald T, Ledermann JA. Targeted therapies for ovarian cancer. Best Pract Res Clin Obstet Gynaecol (2017) 41:139–52. doi: 10.1016/j.bpobgyn.2016.12.001
17. Afrache H, Gouret P, Ainouche S, Pontarotti P, Olive D. The butyrophilin (BTN) gene family: From milk fat to the regulation of the immune response. Immunogenetics (2012) 64(11):781–94. doi: 10.1007/s00251-012-0619-z
18. Cavaletto M, Giuffrida MG, Fortunato D, Gardano L, Dellavalle G, Napolitano L, et al. A proteomic approach to evaluate the butyrophilin gene family expression in human milk fat globule membrane. Proteomics (2002) 2(7):850–6. doi: 10.1002/1615-9861(200207)2:7<850::AID-PROT850>3.0.CO;2-C
19. Arnett HA, Viney JL. Immune modulation by butyrophilins. Nat Rev Immunol (2014) 14(8):559–69. doi: 10.1038/nri3715
20. Gu S, Borowska MT, Boughter CT, Adams EJ. Butyrophilin3A proteins and Vγ9Vδ2 T cell activation. Semin Cell Dev Biol (2018) 84:65–74. doi: 10.1016/j.semcdb.2018.02.007
21. Moulin M, Alguacil J, Gu S, Mehtougui A, Adams EJ, Peyrottes S, et al. Vγ9Vδ2 T cell activation by strongly agonistic nucleotidic phosphoantigens. Cell Mol Life Sci (2017) 74(23):4353–67. doi: 10.1007/s00018-017-2583-0
22. Pan J, Dai Q, Xiang Z, Liu B, Li C. Three biomarkers predict gastric cancer patients' susceptibility to fluorouracil-based chemotherapy. J Cancer (2019) 10(13):2953–60. doi: 10.7150/jca.31120
23. Liu D, Lu Q, Wang X, Wang J, Lu N, Jiang Z, et al. LSECtin on tumor-associated macrophages enhances breast cancer stemness via interaction with its receptor BTN3A3. Cell Res (2019) 29(5):365–78. doi: 10.1038/s41422-019-0155-6
24. Peedicayil A, Vierkant RA, Hartmann LC, Fridley BL, Fredericksen ZS, White KL, et al. Risk of ovarian cancer and inherited variants in relapse-associated genes. PloS One (2010) 5(1):e8884. doi: 10.1371/journal.pone.0008884
25. Johnatty SE, Beesley J, Chen X, Spurdle AB, Defazio A, Webb PM, et al. Polymorphisms in the FGF2 gene and risk of serous ovarian cancer: Results from the ovarian cancer association consortium. Twin Res Hum Genet (2009) 12(3):269–75. doi: 10.1375/twin.12.3.269
26. Lau MT, So WK, Leung PC. Fibroblast growth factor 2 induces e-cadherin down-regulation via PI3K/Akt/mTOR and MAPK/ERK signaling in ovarian cancer cells. PLoS One (2013) 8(3):e59083. doi: 10.1371/journal.pone.0059083
27. Jia T, Jacquet T, Dalonneau F, Coudert P, Vaganay E, Exbrayat-Héritier C, et al. FGF-2 promotes angiogenesis through a SRSF1/SRSF3/SRPK1-dependent axis that controls VEGFR1 splicing in endothelial cells. BMC Biol (2021) 19(1):173. doi: 10.1186/s12915-021-01103-3
28. Davidson B, Goldberg I, Gotlieb WH, Kopolovic J, Ben-Baruch G, Nesland JM, et al. The prognostic value of metalloproteinases and angiogenic factors in ovarian carcinoma. Mol Cell Endocrinol (2002) 187(1-2):39–45. doi: 10.1016/s0303-7207(01)00709-2
29. Huang YS, Wang TX, Lin XM, Wang H, Li RZ, Zeng X, et al. Antitumor effect of a short peptide on p53-null SKOV3 ovarian cancer cells. Anticancer Drugs (2019) 30(10):973–82. doi: 10.1097/CAD.0000000000000830
30. Teng Y, Guo B, Mu X, Liu S. KIF26B promotes cell proliferation and migration through the FGF2/ERK signaling pathway in breast cancer. BioMed Pharmacother (2018) 108:766–73. doi: 10.1016/j.biopha.2018.09.036
31. Wang WM, Xu Y, Wang YH, Sun HX, Sun YF, He YF, et al. HOXB7 promotes tumor progression via bFGF-induced activation of MAPK/ERK pathway and indicated poor prognosis in hepatocellular carcinoma. Oncotarget (2017) 8(29):47121–35. doi: 10.18632/oncotarget.17004
32. Florkiewicz RZ, Shibata F, Barankiewicz T, Baird A, Gonzalez AM, Florkiewicz E, et al. Basic fibroblast growth factor gene expression. Ann N Y Acad Sci (1991) 638:106–26. doi: 10.1111/j.1749-6632.1991.tb49022.x
33. Fan SH, Wang YY, Lu J, Zheng YL, Wu DM, Li MQ, et al. Luteoloside suppresses proliferation and metastasis of hepatocellular carcinoma cells by inhibition of NLRP3 inflammasome. PLoS One (2014) 9(2):e89961. doi: 10.1371/journal.pone.0089961
34. Coleman SJ, Chioni AM, Ghallab M, Anderson RK, Lemoine NR, Kocher HM, et al. Nuclear translocation of FGFR1 and FGF2 in pancreatic stellate cells facilitates pancreatic cancer cell invasion. EMBO Mol Med (2014) 6(4):467–81. doi: 10.1002/emmm.201302698
Keywords: BTN3A3, ovarian cancer, ERK1/2, FGF2, SCH772984
Citation: Chen S, Li Z, Wang Y and Fan S (2022) BTN3A3 inhibits the proliferation, migration and invasion of ovarian cancer cells by regulating ERK1/2 phosphorylation. Front. Oncol. 12:952425. doi: 10.3389/fonc.2022.952425
Received: 25 May 2022; Accepted: 01 August 2022;
Published: 17 August 2022.
Edited by:
Zhengzhi Zou, South China Normal University, ChinaReviewed by:
Teng Ma, Capital Medical University, ChinaCopyright © 2022 Chen, Li, Wang and Fan. This is an open-access article distributed under the terms of the Creative Commons Attribution License (CC BY). The use, distribution or reproduction in other forums is permitted, provided the original author(s) and the copyright owner(s) are credited and that the original publication in this journal is cited, in accordance with accepted academic practice. No use, distribution or reproduction is permitted which does not comply with these terms.
*Correspondence: Shaohua Fan, ZnNoZmx5QGpzbnUuZWR1LmNu; Yanyan Wang, bHVsaXpoYW4zMzVAMTI2LmNvbQ==
†These authors have contributed equally to this work and share first authorship
Disclaimer: All claims expressed in this article are solely those of the authors and do not necessarily represent those of their affiliated organizations, or those of the publisher, the editors and the reviewers. Any product that may be evaluated in this article or claim that may be made by its manufacturer is not guaranteed or endorsed by the publisher.
Research integrity at Frontiers

Learn more about the work of our research integrity team to safeguard the quality of each article we publish.