 Mo Li†
 HongMei He
- Second Affiliated Hospital of Dalian Medical University, Dalian, China
According to statistics, lung cancer kills 1.8 million people each year and is the main cause of cancer mortality worldwide. Non-small cell lung cancer (NSCLC) accounts for over 85% of all lung cancers. Lung cancer has a strong genetic predisposition, demonstrating that the susceptibility and survival of lung cancer are related to specific genes. Genome-wide association studies (GWASs) and next-generation sequencing have been used to discover genes related to NSCLC. However, many studies ignored the intricate interaction information between gene pairs. In the paper, we proposed a novel deep learning method named Deep-LC for predicting NSCLC-related genes. First, we built a gene interaction network and used graph convolutional networks (GCNs) to extract features of genes and interactions between gene pairs. Then a simple convolutional neural network (CNN) module is used as the decoder to decide whether the gene is related to the disease. Deep-LC is an end-to-end method, and from the evaluation results, we can conclude that Deep-LC performs well in mining potential NSCLC-related genes and performs better than existing state-of-the-art methods.
Introduction
Statistics show that lung cancer causes 1.8 million deaths each year and remains the leading cause of cancer deaths all over the world (1). Small cell lung cancer (SCLC) and non-SCLC (NSCLC) are two main types. NSCLC accounts for almost 85% of all types of lung cancer (2). Lung cancer has a strong genetic predisposition, and the specific genes are responsible for enhanced risk (3), in addition to being affected by external incentives such as smoking, secondhand or passive smoking, alcohol, and air pollution (4).
Genome-wide association studies (GWASs) have been widely used to identify which genes are related to lung cancer. Hung et al. (5) first utilized GWAS to examine single-nucleotide polymorphisms (SNPs) and discovered a locus in chromosome region 15q25 that was substantially linked to lung cancer. Six genes are found, including three subunits of the nicotinic acetylcholine receptor (CHRNA5, CHRNA3, and CHRNB4). Hu et al. (6) did GWAS on 5,408 subjects and demonstrated that the 5p15 locus is specific to lung cancer. In addition, they found that an independent locus, 22q12.2, may be linked to the susceptibility to lung cancer. Genes are associated not only with the susceptibility to lung cancer but also with lung cancer survival. The 9p21.3 locus was demonstrated to be linked to susceptibility (7) and survival (8).
In addition to GWAS, some studies discovered new variants through next-generation sequencing (NGS), like whole-exome sequencing (WES) and whole-genome sequencing (WGS). Xiong et al. (9) found an uncommon mutation in PARK2 that causes the tumor suppressor gene to lose function in a five-generation family with lung cancer. Exome sequencing of sporadic and familial lung cancer patients also revealed infrequent detrimental mutations in GWAS-nominated sites in DBH and CDC147 genes (10).In a family with a high prevalence of lung adenocarcinoma, it was found that a functional missense mutation in the oncogene YAP1 was linked to the likelihood of getting the illness through WGS (11).
With a more comprehensive understanding of genes, more and more studies take gene interaction information into account. Maurano et al. (12) demonstrated that the regulation relationship between genes plays a vital role in the disease research field. Although GWAS, WES, and WGS demonstrated the effectiveness of mining disease-related genes in previous studies, this method ignores a large amount of complex information about interactions between gene pairs. Interaction networks have proven effective in the field of biological information, like identifying disease-related molecules (13) and predicting protein–metabolite interactions (14). Graph convolutional network (GCN) (15) is one type of neural network architecture to learn nodes and edges of graphs. It has been proved that GCN enhances algorithms of abilities to mine information and make decisions in the bioinformatics field. For example, Deep-DRM was proposed to identify disease-related metabolites (16). In Deep-DRM, GCN was applied as an encoder to integrate features of metabolites and disease. In DeepLGP, GCN was applied to convolve a gene interaction network for encoding the features of genes and lncRNAs (17). Cheng et al. (18) proposed a deep learning method to predict cell type-specific genes of lung cancer based on SC2disease (19) and other databases. This task only inferred cell type-specific genes of lung cancer in 8 cell types, instead of directly demonstrating whether the gene is related to lung cancer.
Interaction relationships of genes can be translated into a graph network. We treated the task of identifying NSCLC-related genes as a binary classification and proposed a novel deep learning method named DEEP-LC to solve it. GCN was applied to learn and extract relevant features from gene interaction networks, and CNN was the classification module to identify target genes.
Method
The method called Deep-LC that we proposed includes two parts. The structure is shown in Figure 1. First, we constructed a graph network by gene interaction information related to lung cancer and used a GCN to extract features of interaction information between genes. Then, we constructed a small convolutional neural network (CNN) to identify potential lung cancer-related genes.
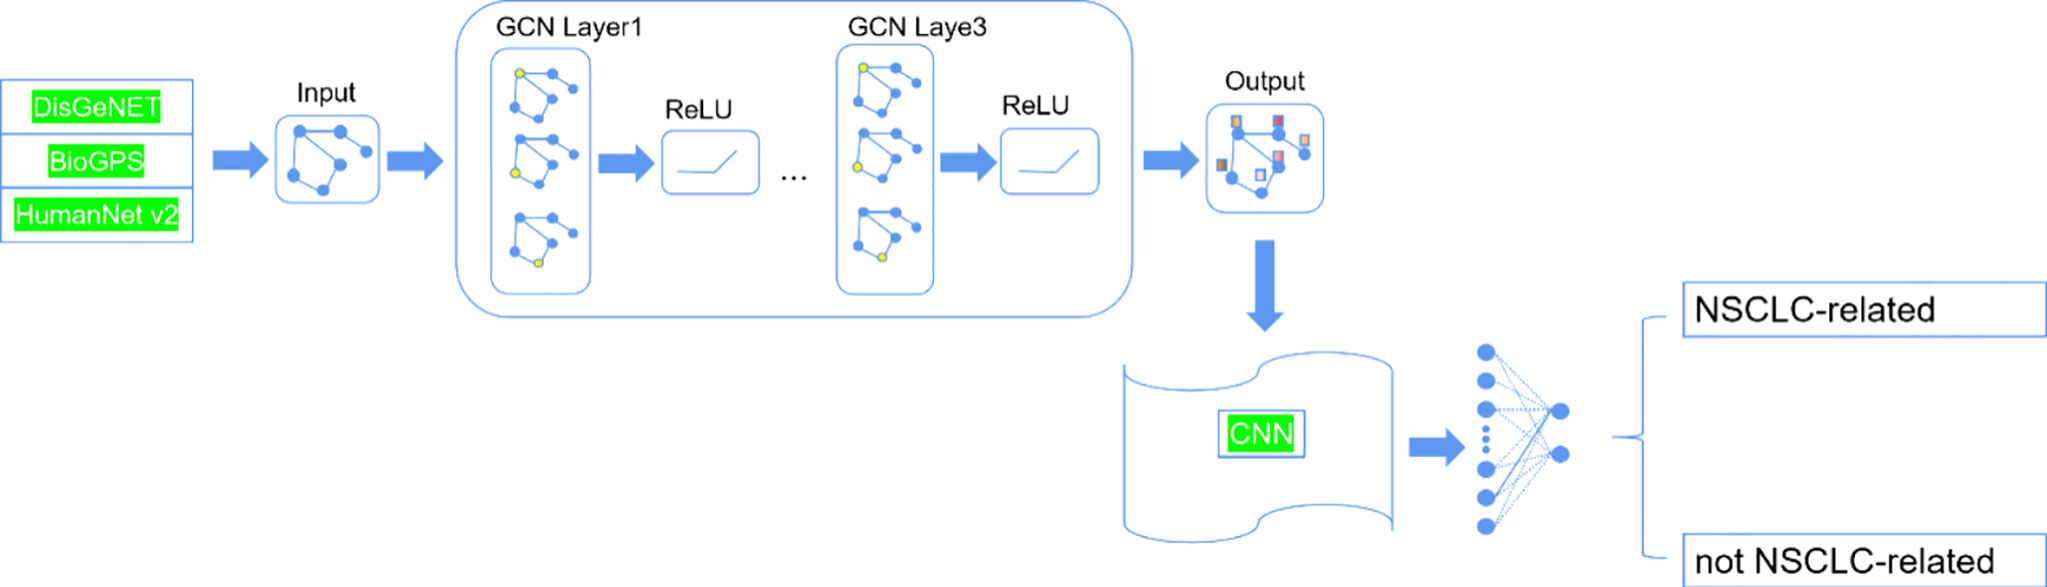
Figure 1 The structure of Deep-LC.
Construction of the Graph Network of Genes
The graph network of genes represents the genes interaction network. The graph network contains nodes and edges. In the study, the genes that we selected are the nodes, and interaction information between gene pairs is the edges. Interactions information was obtained from the public database. It should be noted that outliers that had no interaction with other genes were removed.
Extracting Features by Graph Convolutional Network
Since the interactions between genes were expressed by the gene network, we use a GCN to extract features from the gene network. The graph network we built can be expressed as G = (V,E,W). V represents the nodes of the network, E represents the edges, and W represents the weighted matrix encoding the connection weight between vertices.
The Laplacian matrix is defined as
where D means the degree matrix of the network and A is the adjacency matrix.
Since the features of genes should contain not only connections between nodes but also the information itself, we can get
where I is the identity matrix.
Then the inverse degree matrix D’ can be obtained.
Last, we can get the features, as follows:
where X is the features map of each node and σ is the activation function. In the study, we use rectified linear unit (ReLU) function as the activation function. The expression is as follows:
Identifying Non-Small Cell Lung Cancer-Related Genes by Convolutional Neural Network
CNN excels at computer vision and is gaining traction in the field of bioinformatics. In comparison to a pure deep neural network, CNN performs better due to the following characteristics: 1) by utilizing the sparsity of connections and parameter sharing, the convolutional layer has fewer parameters. In other words, under the same amount of parameters, CNN is superior at mining and learning characteristics from nodes. 2) The convolutional layer gathers data from both global and local features. Because the features of disease-related genes focused on some specific areas, global features are redundant when it comes to identifying disease-related genes. As a result, studying local features can assist us in extracting crucial information from features. Therefore, CNN is applied as the supervised model to decide which genes are associated with NSCLC in the study.
The structure of the CNN is shown in Table 1. Our CNN module has four convolutional layers and a full-connected layer. We still used ReLU as the activation function the same as the GCN. Between layers, we added batch normalization (20) to avoid gradient disappearance and gradient explosion and avoid over-fitting. Both the above layers strengthen the ability of the features fusion learning and decision making.

Table 1 The structure of CNN.
It should be noted that the activation function we used after the full-connected layer is softmax function. Because our task is the binary classification task, we used binary cross-entropy as the loss function, as follows:
where yi means the true value and pi means the predicted value.
For training details, we used dropout to avoid over-fitting, and we set the rate at 0.5. We used Adam with default parameters as the optimization algorithm. We trained our method 50 epochs. The initial learning rate is 0.01 and reduced to 1/10 after 40 epochs.
Result
Datasets
In the paper, we selected genes that are related to NSCLC disease from DisGeNET (21), which is a platform that integrates information on gene–disease associations. NSCLC includes stage I, II, III, IIIA, and IIIB types; they are 115, 11, 16, 12, and 11 disease-related genes for the different types of NSCLC, respectively. After integrating the same genes with different types of NSCLC, we obtained 142 NSCLC-related genes. We obtained gene expression of different tissues from BioGPS (22). After deleting genes that lacked information on the probe set, we obtained 142 positive samples finally. Considering data balance, we randomly selected 142 genes that were reported as not being related to NSCLC as the negative samples. Then we obtained interactions between genes from the HumanNet database (23). In the gene interaction network, the nodes are genes that we selected, and the edges are interactions between gene pairs. In the paper, we used log likelihood score (LLS) as the weight of the edges because these scores can represent the interactions between genes.
Experiment Setup
Cross validation was used to demonstrate the performance of the algorithm in the study. The fold number was set to 10. Specifically, the dataset including the test set and the train set was divided into 10 subsets. One subset was randomly selected as the test set, and the remaining subsets were selected as the train set. In other words, every experiment was repeated 10 times totally in the paper.
The task of identifying lung cancer-related genes can be treated as a binary classification problem. The precision–recall curve is plotted based on different precision and recall, and the receiver operating characteristic curve (ROC curve) is based on different recall and false-positive rates (FPRs). Precision, recall, and FPR can be calculated as follows:
where TP is a true positive, FP is a false positive, FN is a false negative, and TN is a true negative. We used the area under the precision–recall curve (AUPR) and the area under the ROC curve (AUC) as evaluating indicators. AUPR and AUC can help us demonstrate the effectiveness of the classification algorithm.
Performance
Stacking N-level GCN layers can convolve information from its N-order neighbors. Stacking too many GCN layers may lead to the vanishing gradient problem (24). Too little layers may cause feature learning insufficiency. So we evaluated the influence of different numbers of GCN layers on Deep-LC. The results are shown in Table 2. Deep-LC with three GCN layers has the best performance.
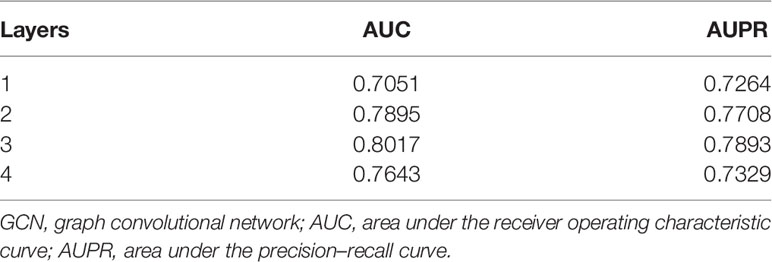
Table 2 The performance of Deep-LC with different of GCN layers.
If the number of layers is more than three, both AUC and AUPR scores decrease. This result might be related to the gradient vanishing problem to some extent. We can conclude that the performance of the Deep-LC method is enhanced by stacking layers. This operation can strengthen the capability of feature fusion and be helpful for feature mining.
Comparison Experiments
We compared Deep-LC with the other four methods, including GCN, CNN, random forest (RF), and K-nearest neighbor (KNN). Table 3 shows the specific results, and Figure 2 depicts the outcomes.
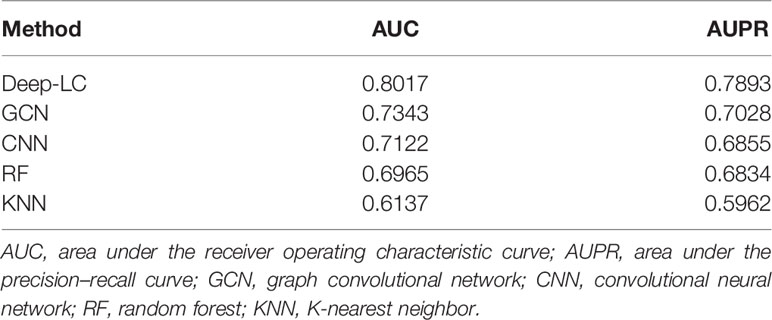
Table 3 The AUC and AUPR scores of Deep-LC and other four methods.
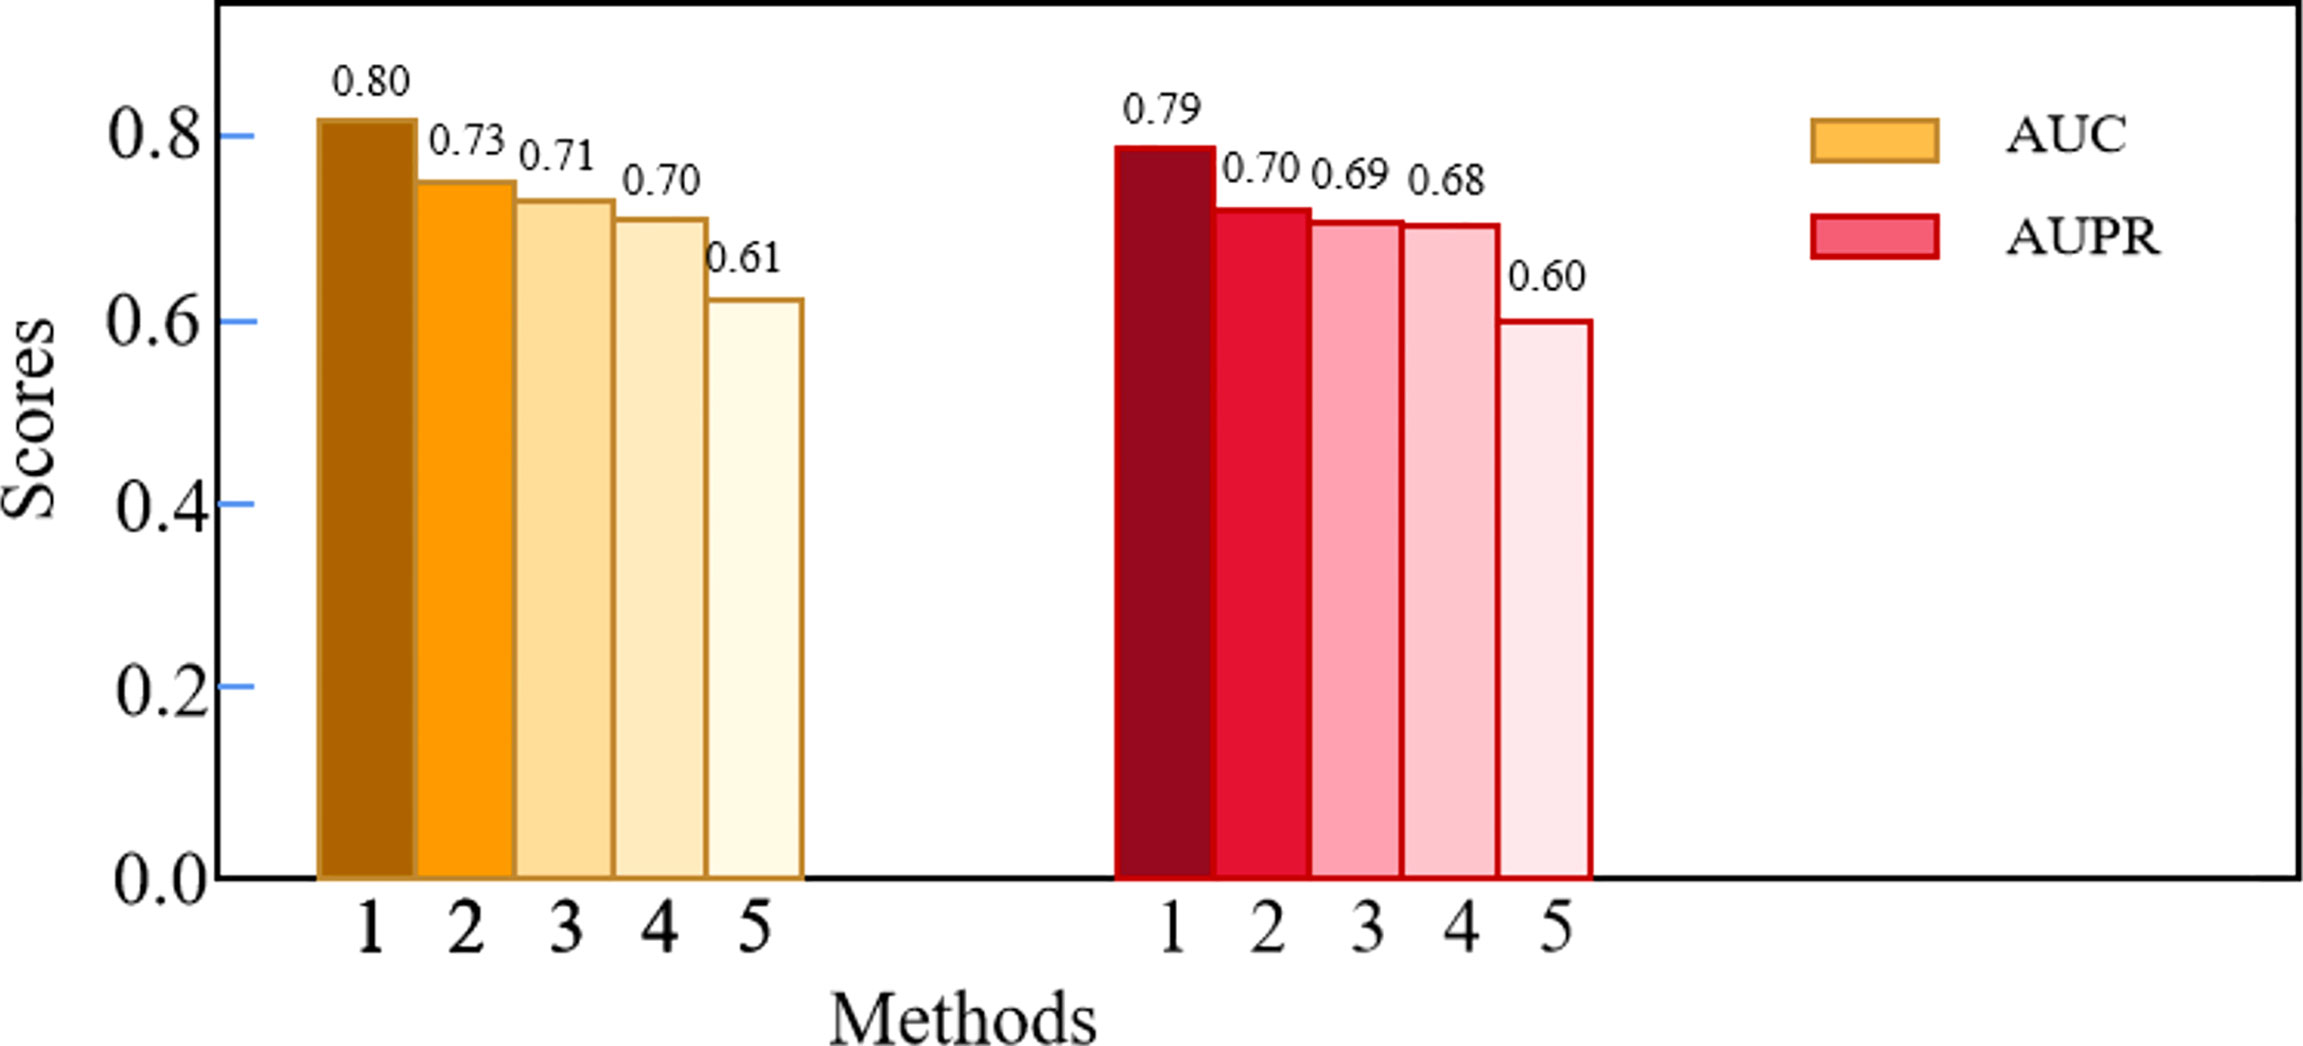
Figure 2 The comparison results of Deep-LC and other four methods.
According to the results of the trial, Deep-LC outperforms all other approaches in terms of AUC and AUPR scores of 0.8017 and 0.7893. As compared to GCN, CNN, RF, and KNN, Deep-LC’s AUC scores increase by 9.18%, 12.56%, 15.09%, and 30.63%, respectively, and AUPR scores rise by 12.31%, 15.13%, 15.49%, and 32.38%, respectively. KNN had the lowest results, with AUC and AUPR of 0.6137 and 0.5962, respectively. In conclusion, the results reveal that Deep-LC outperforms various state-of-the-art approaches in terms of identifying NSCLC-related genes. The performance of using GCN and CNN is better than using one alone.
Case Study
To further demonstrate the effectiveness of Deep-LC, we did case studies. We aimed to identify some genes that may be related to NSCLC disease and not a positive sample that we selected. At last, we found several genes and relevant papers to support them. Table 4 lists the genes.
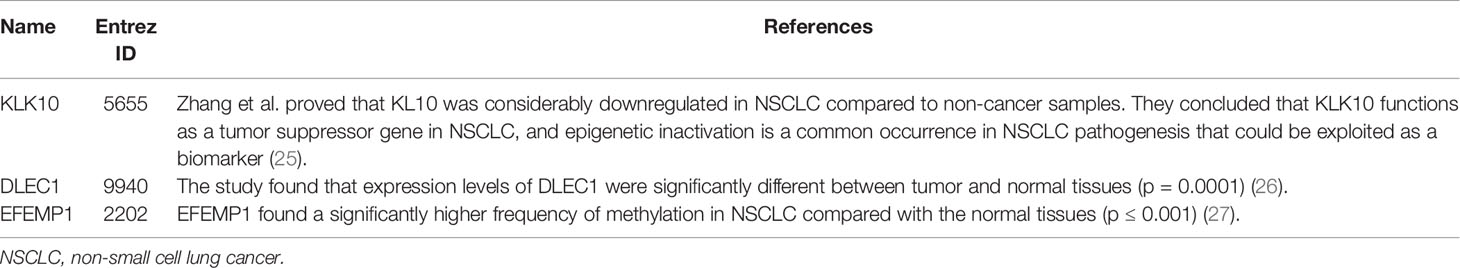
Table 4 The details of genes that we mined by Deep-LC method.
Conclusion
Lung cancer is the main cause of cancer mortality worldwide. NSCLC accounts for over 85% of all lung cancers. GWAS and NGS have been used to discover genes related to NSCLC. However, many studies ignored the intricate interaction information between gene pairs. In the paper, we proposed a novel deep learning method named Deep-LC for identifying NSCLC-related genes. We treated the task as a binary classification problem and integrated information to build a gene interaction network. GCNs were applied as an encoder to extract features of gene interactions network, and a simple CNN module was applied as the decoder to decide whether the gene is related to the disease. Deep-LC is an end-to-end method, and from the evaluation results, we can conclude that Deep-LC performs better than existing state-of-the-art methods.
Data Availability Statement
The original contributions presented in the study are included in the article/supplementary material. Further inquiries can be directed to the corresponding authors.
Author Contributions
ML and GM designed the experiments, analyzed the data, and wrote the manuscript. XL and TM analyzed the bioinformatic data. GS provided important ideas. This whole work is guided by HH. All authors contributed to the article and approved the submitted version.
Funding
This study was supported by the Science and Technology funds from Liaoning Education Department (No. LZ2020038 ) and Wu Jieping Medical Foundation (No. 320.6750.2021-16-47).
Conflict of Interest
The authors declare that the research was conducted in the absence of any commercial or financial relationships that could be construed as a potential conflict of interest.
Publisher’s Note
All claims expressed in this article are solely those of the authors and do not necessarily represent those of their affiliated organizations, or those of the publisher, the editors and the reviewers. Any product that may be evaluated in this article, or claim that may be made by its manufacturer, is not guaranteed or endorsed by the publisher.
References
1. Zitnik M, Agrawal M, Leskovec J. Modeling Polypharmacy Side Effects With Graph Convolutional Networks. Bioinformatics (2018) 34(13):i457–66. doi: 10.1093/bioinformatics/bty294
2. Navada S, Lai P, Schwartz AG, Kalemkerian GP. Temporal Trends in Small Cell Lung Cancer: Analysis of the National Surveillance, Epidemiology, and End-Results (SEER) Database. J Clin Oncol (2006) 24(18_suppl):7082–2. doi: 10.1200/jco.2006.24.18_suppl.7082
3. Matakidou A, Eisen T, Houlston R. Systematic Review of the Relationship Between Family History and Lung Cancer Risk. Br J Cancer (2005) 93(7):825–33. doi: 10.1038/sj.bjc.6602769
4. Molina JR, Yang P, Cassivi SD, Schild SE, Adjei AA. Non-Small Cell Lung Cancer: Epidemiology, Risk Factors, Treatment, and Survivorship. In Mayo Clinic Proc Elsevier (2008) 83(5):584–94. doi: 10.1016/S0025-6196(11)60735-0
5. Hung RJ, McKay JD, Gaborieau V, Boffetta P, Hashibe M, Zaridze D, et al. A Susceptibility Locus for Lung Cancer Maps to Nicotinic Acetylcholine Receptor Subunit Genes on 15q25. Nature (2008) 452(7187):633–7. doi: 10.1038/nature06885
6. Hu Z, Wu C, Shi Y, Guo H, Zhao X, Yin Z, et al. A Genome-Wide Association Study Identifies Two New Lung Cancer Susceptibility Loci at 13q12. 12 and 22q12. 2 in Han Chinese. Nat Genet (2011) 43(8):792–6.
7. Wang Z, Seow WJ, Shiraishi K, Hsiung CA, Matsuo K, Liu J, et al. Meta-Analysis of Genome-Wide Association Studies Identifies Multiple Lung Cancer Susceptibility Loci in Never-Smoking Asian Women. Hum Mol Genet (2016) 25(3):620–9. doi: 10.1093/hmg/ddv494
8. Hu L, Wu C, Zhao X, Heist R, Su L, Zhao Y, et al. Genome-Wide Association Study of Prognosis in Advanced Non–Small Cell Lung Cancer Patients Receiving Platinum-Based Chemotherapy. Clin Cancer Res (2012) 18(19):5507–14. doi: 10.1158/1078-0432.CCR-12-1202
9. Xiong D, Wang Y, Kupert E, Simpson C, Pinney SM, Gaba CR, et al. A Recurrent Mutation in PARK2 Is Associated With Familial Lung Cancer. Am J Hum Genet (2015) 96(2):301–8. doi: 10.1016/j.ajhg.2014.12.016
10. Liu Y, Kheradmand F, Davis CF, Scheurer ME, Wheeler D, Tsavachidis S, et al. Focused Analysis of Exome Sequencing Data for Rare Germline Mutations in Familial and Sporadic Lung Cancer. J Thorac Oncol (2016) 11(1):52–61. doi: 10.1016/j.jtho.2015.09.015
11. Chen HY, Yu S-L, Ho B-C, Su K-Y, Hsu Y-C, Chang C-S, et al. R331W Missense Mutation of Oncogene YAP1 Is a Germline Risk Allele for Lung Adenocarcinoma With Medical Actionability. J Clin Oncol (2015) 33(20):2303. doi: 10.1200/JCO.2014.59.3590
12. Maurano MT, Humbert R, Rynes E, Thurman RE, Haugen E, Wang H, et al. Systematic Localization of Common Disease-Associated Variation in Regulatory DNA. Science (2012) 337(6099):1190–5. doi: 10.1126/science.1222794
13. Peng J, Zhao T. Reduction in TOM1 Expression Exacerbates Alzheimer’s Disease. Proc Natl Acad Sci (2020) 117(8):3915–6. doi: 10.1073/pnas.1917589117
14. Zhao T, Liu J, Zeng W, Wang X, Li S, Zang T, et al. Prediction and Collection of Protein–Metabolite Interactions. Briefings Bioinf (2021) 22(5):bbab014. doi: 10.1093/bib/bbab014
15. Kipf TN, Welling M. Semi-Supervised Classification With Graph Convolutional Networks. arXiv (2016). doi: 10.48550/arXiv.1609.02907
16. Zhao T, Hu Y, Cheng L. Deep-DRM: A Computational Method for Identifying Disease-Related Metabolites Based on Graph Deep Learning Approaches. Briefings Bioinformatics (2021) 22(4):bbaa212. doi: 10.1093/bib/bbaa212
17. Zhao T, Hu Y, Peng J, Cheng L. DeepLGP: A Novel Deep Learning Method for Prioritizing lncRNA Target Genes. Bioinformatics (2020) 36(16):4466–72. doi: 10.1093/bioinformatics/btaa42818
18. Cheng N, Chen C, Li C, Huang J. Inferring Cell-Type-Specific Genes of Lung Cancer Based on Deep Learning. Curr Gene Ther (2022). doi: 10.2174/1566523222666220324110914
19. Zhao T, Lyu S, Lu G, Juan L, Zeng X, Wei Z, et al. SC2disease: A Manually Curated Database of Single-Cell Transcriptome for Human Diseases. Nucleic Acids Res (2021) 49(D1):D1413–9. doi: 10.1093/nar/gkaa838
20. Ioffe S, Szegedy C. Batch Normalization: Accelerating Deep Network Training by Reducing Internal Covariate Shift. PMLR (2015). doi: 10.5555/3045118.304
21. Piñero J, Bravo À, Queralt-Rosinach N, Gutiérrez-Sacristán A, Deu-Pons J, Centeno E, et al. DisGeNET: A Comprehensive Platform Integrating Information on Human Disease-Associated Genes and Variants. Nucleic Acids Res (2016) 45(D1):833–9. doi: 10.1093/nar/gkw943
22. Wu C, Orozco C, Boyer J, Leglise M, Goodale J, Batalov S, et al. BioGPS: An Extensible and Customizable Portal for Querying and Organizing Gene Annotation Resources. Genome Biol (2009) 10(11):1–8. doi: 10.1186/gb-2009-10-11-r130
23. Hwang S, Kim CY, Yang S, Kim E, Hart T, Marcotte EM, et al. HumanNet V2: Human Gene Networks for Disease Research. Nucleic Acids Res (2019) 47(D1):D573–80. doi: 10.1093/nar/gky1126
24. Li G, Muller M, Thabet A, Ghanem B. Deepgcns: Can Gcns Go as Deep as Cnns? In Proc IEEE/CVF Int Conf Comput Vision (2019), 9267–76. doi: 10.1109/ICCV.2019.00936
25. Zhang Y, Song H, Miao Y, Wang R, Chen L. Frequent Transcriptional Inactivation of Kallikrein 10 Gene by CpG Island Hypermethylation in Non-Small Cell Lung Cancer. Cancer Sci (2010) 101(4):934–40. doi: 10.1111/j.1349-7006.2009.01486.x
26. Pastuszak-Lewandoska D, Kordiak J, Antczak A, Migdalska-Sęk M, Czarnecka KH, Górski P, et al. Expression Level and Methylation Status of Three Tumor Suppressor Genes, DLEC1, ITGA9 and MLH1, in Non-Small Cell Lung Cancer. Med Oncol (2016) 33(7):1–8. doi: 10.1007/s12032-016-0791-3
Keywords: non-small cell lung cancer, genome-wide association analysis, graph convolutional networks, convolutional neural network (CNN) accelerator, Deep-LC
Citation: Li M, Meng Gx, Liu Xw, Ma T, Sun G and He H (2022) Deep-LC: A Novel Deep Learning Method of Identifying Non-Small Cell Lung Cancer-Related Genes. Front. Oncol. 12:949546. doi: 10.3389/fonc.2022.949546
Received: 21 May 2022; Accepted: 16 June 2022;
Published: 22 July 2022.
Edited by:
Tianyi Zhao, Harbin Institute of Technology, ChinaReviewed by:
Ningyi Zhang, Harbin Institute of Technology, ChinaSheng Li, Zhongnan Hospital, Wuhan University, China
Copyright © 2022 Li, Meng, Liu, Ma, Sun and He. This is an open-access article distributed under the terms of the Creative Commons Attribution License (CC BY). The use, distribution or reproduction in other forums is permitted, provided the original author(s) and the copyright owner(s) are credited and that the original publication in this journal is cited, in accordance with accepted academic practice. No use, distribution or reproduction is permitted which does not comply with these terms.
*Correspondence: Ge Sun, c3VuZ2U4NkAxMjYuY29t; HongMei He, aG9uZ21laWhlMTk3NkAxNjMuY29t
†These authors have contributed equally to this work