 Yaxin Chen1
 Lei Xia
 Yuxuan Peng
 Gang Wang
 Weimin Li
94% of researchers rate our articles as excellent or good
Learn more about the work of our research integrity team to safeguard the quality of each article we publish.
Find out more
ORIGINAL RESEARCH article
Front. Oncol. , 11 October 2022
Sec. Thoracic Oncology
Volume 12 - 2022 | https://doi.org/10.3389/fonc.2022.947808
Lung adenocarcinoma (LUAD) is the most frequent subtype of lung cancer, with a 5-year survival rate of less than 20%. N6-methyladenosine (m6A) is the most prevalent RNA epigenetic modification in eukaryotic cells, and post-transcriptionally regulates gene expression and function by affecting RNA metabolism. The alterations of functionally important m6A sites have been previously shown to play vital roles in tumor initiation and progression, but little is known about the extent to which m6A-regulated genes play in prognostic performance for patients with LUAD. Here, we presented an overview of the m6A methylome in LUAD tissues using transcriptome-wide m6A methylation profiles, and found that differentially methylated transcripts were significantly enriched in tumor-related processes, including immune response, angiogenesis and cell-substrate adhesion. Joint analysis of m6A modification and gene expression suggested that 300 genes were regulated by m6A. Furthermore, we developed a m6A-regulated prognosis-associated signature (m6A-PPS) by performing a multi-step process. The m6A-PPS model, a 15-gene set, was qualified for prognosis prediction for LUAD patients. By regrouping the patients with this model, the OS of the high-risk group was shorter than that of the low-risk group across all datasets. Importantly, patients with high m6A-PPS scores respond better to immunotherapeutic. Our results provide a valuable resource for understanding the important role of epitranscriptomic modifications in the pathogenesis of LUAD, and obtain potential prognostic biomarkers.
Lung cancer is the leading cause of cancer-related deaths in China and worldwide, and lung adenocarcinoma (LUAD) is the most frequent subtype of non-small cell lung cancer, with less than a 20% 5-year survival rate (1). Despite significant improvements in diagnosis, surgery, radiotherapy and molecular therapeutics, sustained responses are rare and prognosis remains poor (2). Tumor molecular heterogeneity among patients is one of the key factors that may contribute to worse therapeutic outcomes. Thus, combining more comprehensive molecular characterization may aid in biomarker discovery to improve the prognosis of LUAD patients.
As an important mediator in almost all the RNA cycle stages, N6-methyladenosine (m6A) is the most abundant internal modification in eukaryotic mRNA, and is dynamic and reversible (3). It is deposited by m6A writers (in particular the METTL3-METTL14 complex (4)), and erased by m6A erasers (FTO (5) and ALKBH5 (6)). With recognized by specific m6A reader proteins, m6A modulates different post-transcriptional processes. For example, the well-studied reader YTHDF2 recognizes m6A and regulates mRNA degradation (7), and YTHDC1 affects alternative splicing and nuclear export of mRNA (8). Accumulating studies have reported that alterations in functionally important m6A sites were correlated with the risk of malignancy of tumors at multiple levels (9). The m6A-mediated regulatory pathways affect different biological processes, such as drug and stress response, development and immune (10, 11). However, the roles and function of m6A in the development and tumorigenesis of LUAD have not been fully clarified. Furthermore, prognosis biomarkers selected from m6A targeting genes remain undiscovered.
Considerable evidences have shown that m6A-mediated expression changes in tumor-related genes are critical to cancer progression and clinical outcome (12). For example, m6A-mediated transcript stability leads to increased expression of lncRNA ABHD11-AS1, which promotes tumor cell proliferation and results in the poor prognosis of NSCLC patients (13). Previous studies have explored the molecular characteristics, potential functions and prognostic values of m6A regulators (writers, erasers and readers) and m6A-related lncRNAs (14–17). However, to date, comprehensive and integrated m6A modification and transcriptomic analyses that identify m6A-regulated genes as candidate prognostic markers remain scarce, and there is a lack of MeRIP-Seq data from tumor tissues. Most recently, Sun et al. (18) profiled m6A map of six paired tissue specimens using microarray technology and identified 10 prognostic m6A-regulated mRNAs in LUAD. Nevertheless, the prognostic value of m6A-marked mRNAs/lncRNAs for lung cancer has not been well explored.
In this study, we not only depicted the features of m6A methylome in LUAD by parsing transcriptome-wide m6A profiles, but also developed a prognostic signature based on m6A-regulated genes. A m6A-regulated prognosis-associated signature (m6A-PPS, a 15-gene set) had a superior ability to predict survival, and patients with high risk had shorter overall survival than those with low risk across all datasets. Furthermore, high-risk individuals could have a better response to immunotherapy. Taken together, our results demonstrated that developing a prognostic signature by fully taking advantage of m6A-mediated epigenetic alternations on expression is competent to improve the ability of prognostic prediction for LUAD patients.
All specimens used in the study were collected from West China Hospital of Sichuan University (Chengdu, China). Patients with primary LUAD were randomly selected from October 2019 to December 2020 and did not undergo any anti-cancer treatments before surgery. Primary tumor tissue and paired non-cancerous adjacent tissues (NATs, ≥5 cm from the tumor margin) were surgically resected, immediately preserved in RNAlater stabilization solution and then stored in a -80°C refrigerator until being used for RNA extraction. A total of 12 specimens were collected with clinical information including age, gender, pathology, tumor size and tumor stage (TNM staging according to AJCC cancer staging system 8th edition), smoking status, and family history. The detailed clinical information of the patients was listed in Supplementary Table S1. All patient samples were obtained with the hospital’s approval of the Research Ethics Committee and all participants provided written informed consent.
Tissues were ground by using the Tissue Lyser System (Tissuelyser-24, Shanghai Jing Xin) and RNA was extracted from tissues by using the phenol–chloroform method. Samples exhibiting an RNA integrity number (RIN) greater than 6.0 were included in the study. The quality of total RNA was detected by Bioptic Qseq100 Bio-Fragment Analyzer. All samples had an RIN of 6.9 or greater. DNase I (Invitrogen™, Cat# EN0525) treatment was adopted to remove DNA contamination.
m6A immunoprecipitation was performed by using an Epi™ m6A immunoprecipitation kit (Epibiotek™, Cat#R1804). Purified RNA (20μg) was fragmented into ~200 nucleotide-long fragments by incubation in magnesium RNA fragmentation buffer for 6 min at 70°C. The fragmentation was stopped by adding EDTA. Then, Zymo RNA clean and the concentrator-5 kit was used to purify fragmented total RNA (Zymo Research™, Cat# R1013). Fragmented total RNA (Input) and immunoprecipitated RNA (IP) were subjected to library construction by using Epi™ mini longRNA-seq kit (Epibiotek, Cat# E1802) according to the manufacturer’s protocols. Libraries’ quality was validated on Qseq100 Bio-Fragment Analyzer. The strand-specific libraries were sequenced on the Illumina NovaSeq 6000 platform and 150bp paired-end reads were generated.
RNA expression and relevant clinical features of The Cancer Genome Atlas (TCGA) LUAD, TCGA-LUSC and Genotype-Tissue Expression (GTEx) were downloaded from the UCSC Xena database (https://xenabrowser.net/datapages/). Gene expression was further normalized to the TPM value based on the longest transcript length and sequencing depth. The DNA copy number and somatic mutation data were downloaded from the cBioPortal database (https://www.cbioportal.org/). For microarray datasets, 6 datasets (GSE10072, GSE115002, GSE75037, GSE40791, GSE68465 and GSE72094) were downloaded from the Gene Expression Omnibus (GEO) database (https://www.ncbi.nlm.nih.gov/geo/). For datasets from platform GPL570, we downloaded raw CEL files and performed uniform process using the robust multichip average (rma) algorithm for background correction and normalization. When multiple probes correspond to the same gene symbol, the mean value was considered as the final value. Those datasets listed above were different independent studies of LUAD, among which 4 datasets (GSE10072, GSE115002, GSE75037 and GSE40791) contained paired adjacent normal samples, and another two datasets (GSE68465 and GSE72094) were employed as validation sets for the m6A-PPS model.
Reads from the MeRIP-seq and RNA-seq were first filtered by removing adaptor primers and low-quality reads using Cutadapt (version 2.5). The high-quality reads were aligned to the human reference genome (GRCh38) using HISAT2 (version 2.1.0) with “–rna-strandness RF” and other default parameters. Only reads with mapping quality of more than 20 were retained using SAMtools (v1.7.0). Aligned reads were converted into bigwig format based on BPM normalization in 1 bp bin size with deepTools (v3.5.0) and visualized with Integrative Genomics Viewer (IGV). The gene expression raw counts were calculated using featureCounts (v2.0.1). TPM normalization was performed as described above. DESeq2 (v1.26.0) was utilized to identify differentially expressed genes (FDR ≤ 0.05 and | log2 (fold change) | ≥ 2).
m6A peak calling and analysis of differential m6A peaks were carried out using exomePeak (v2.13.2) with default parameters. The significantly differential peaks were defined by the thresholds of P ≤ 0.01 and |log2(fold change) | ≥1. The peak annotation and motif enrichment were analyzed by HOMER with “-len 6 -rna”. Metagene plots of m6A peaks and reads were created by the Bioconductor Guitar package (v1.16.0). Differentially m6A-methylated mRNA/ncRNA in all chromosomes (except chrX, chrY, and chrM) were displayed as a circle plot by the R package circlize (v0.4.14).
GO enrichment and KEGG pathway enrichment analyses of m6A peaks, differential m6A modification and differentially expressed genes were performed using ClusterProfile (v3.6.0). FDR<0.05 indicates that the functional comment is significantly enriched.
Patients with LUAD (N = 462) from TCGA were randomly divided into a training set (N = 324) and a testing set (N = 138) to construct and assess the prognostic model. The glmnet R package (v4.1.2) was used to perform a least absolute shrinkage and selection operator (LASSO) Cox regression (iteration = 1000 and 10-fold cross-validation) to penalize a m6A-regulated-RNA prognostic signature for LUAD patients. The signature can stratify patients into high-risk and low-risk groups. The risk score calculation formula is:
where Coefi is the coefficient, and xi is the expression value of each m6A-regulated RNA. The Kaplan–Meier log-rank test (survival v3.2.13), and univariate and multivariate Cox regression analyses were performed to evaluate the predictive ability of the prognostic m6A-PPS. Spearman’s correlation analysis was applied to evaluate the association between 23 m6A regulators (writers/readers/erasers) and 15 m6A-PPS genes using R package ggstatsplot (v0.8.0) and plots visualized with the ggcorrplot package (v0.1.3).
We downloaded targets of 151 RBPs from POSTAR3 (http://postar.ncrnalab.org) (19). For each RBP, the significance of overlapping between targets of the RBP and m6A-regulated genes identified in our study was calculated by testing whether m6A-regulated genes and other genes (as background) had equal fractions when identified as the targets of the RBP using chi-square tests. The q-values, an indicator of FDR, were calculated for all RBPs to screen out significant overlapping RBPs (q< 0.05).
The R package maftools v2.6.5 was used to sum and evaluate TMB score of LUAD samples (20). The TIDE score was directly downloaded from the TIDE database (http://tide.dfci.harvard.edu/) to evaluate the likelihood of the immunotherapeutic response. A higher TIDE score indicated that tumor cells were more likely to induce immune escape, thus indicating a lower response rate to immune checkpoint inhibitors treatment (21).
All statistical analyses were implemented in R statistical software (v4.0.5). The time-dependent area under the ROC curve (AUC) for survival variables was conducted by the timeROC package (v0.4.0). Patients were separated into two subgroups according to the expression level of genes or risk scores, and the R package survminer (v.0.4.9) was used to determine the optimal cutoff value. The Kaplan–Meier curve of each group with the survival data was plotted using the R package survival (v3.2.13). Survival differences were measured by the log-rank test (pairwise and/or multivariate). Log rank score test was applied in Cox proportional hazards models. Statistical significance values in the figure legends correspond to p values, FDR or q values as follows: ns ≥ 0.05, *< 0.05, **< 0.01, ***< 0.0001.
The overall design of this study is displayed in Figure 1A. To measure the topology of the m6A methylome in LUAD patients, six lung adenocarcinoma and paired adjacent normal fresh tissue samples collected during surgery were subjected to generate MeRIP-seq and RNA-seq data (Figure S1A, Supplementary Table S1). After quality control and filtering, the number of m6A peak calling per sample ranged from 5,175 to 15,383 (Figure 1B). Across all tissue samples per group, a total of 21,822 and 22,315 m6A peaks were detected in tumors and paired NATs, respectively. Of these detected peaks, approximately 70% of genes were detected as modified in both sample groups (Figure 1C). Furthermore, through consistent m6A peak calling, 154 m6A peaks located in 137 genes and 2,110 m6A peaks located in 1588 genes were detected in tumors and NATs, respectively. Some genes with m6A modification were shared between tumors and NATs (Figure 1D), including EGFR, a driver gene for LUAD, with enriched m6A modification, which is consistent with the previous finding that EGFR contains lung-specific m6A (22). By the unbiased motif search, m6A peaks were enriched for the known canonical RRACH motif (where R represents A or G; H represents A, C, or U) (Figure 1E). Metagene and distribution analysis of the m6A modification revealed that m6A peaks were gathered mostly in the coding sequence (CDS) and near stop codons (Figure S1B, C), consistent with the results of previous reports (3, 22, 23).
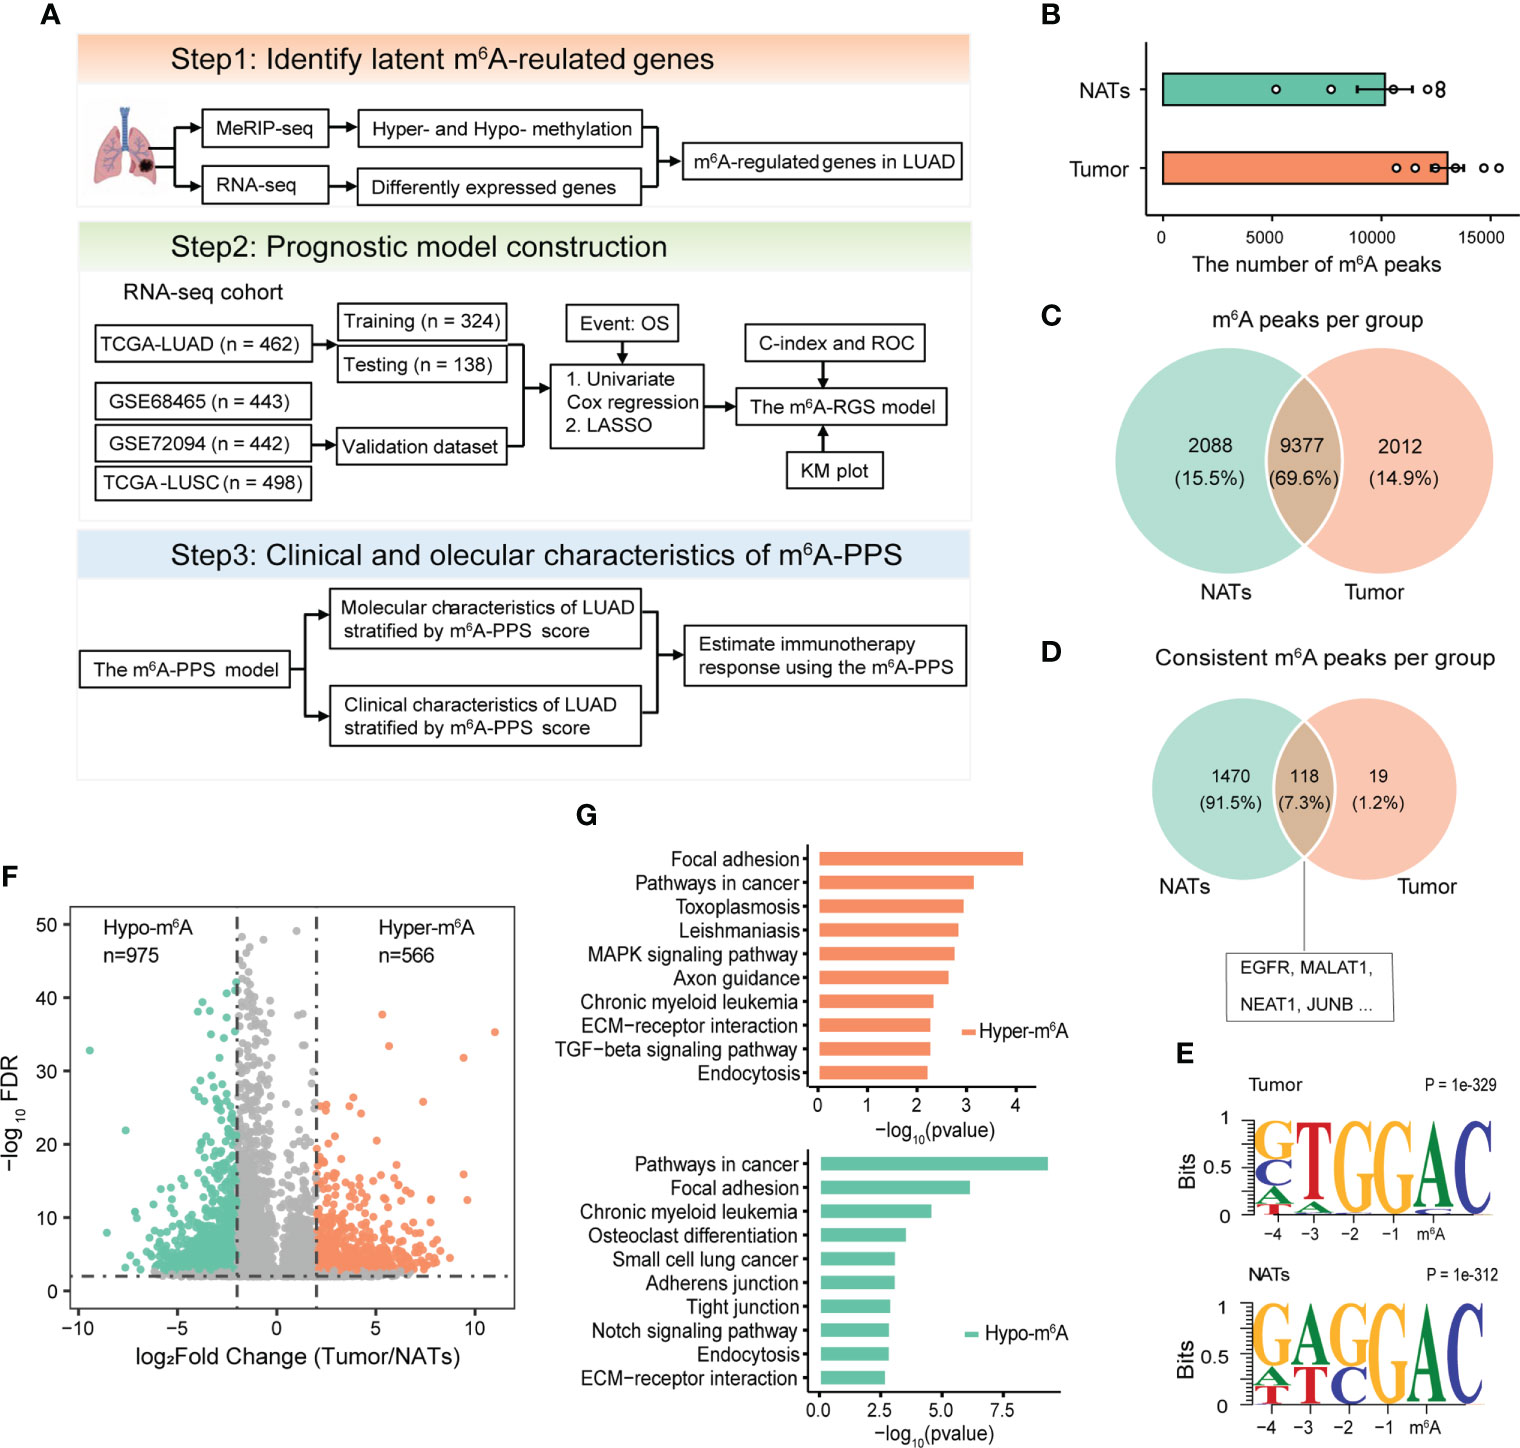
Figure 1 Design overview and analyses of the m6A methylomes of LUAD. (A) Schematic flow chart to identify a prognostic signature based on m6A-regulated genes. (B) The number of m6A peaks detected per sample in tumors and paired NATs. (C, D) Venn diagrams showing the overlapping m6A methylated transcripts (C) and consistent m6A methylated transcripts (D) in tumors and paired NATs. (E) Motif analysis for detected m6A peaks revealing similar consensus in tumors and paired NATs. (F) Volcano plot showing the differentially methylated peaks (log2FC > 1 and P-adjusted< 0.05). (G) KEGG pathway enrichment analysis of hyper- and hypo-methylated genes.
m6A aberrations are associated with the progression of cancers (24). To investigate the potential tumor specificity of the m6A methylome, we performed a differential m6A methylation analysis based on MeRIP-seq data. In total, 1,514 distinct m6A peaks located in the transcripts of 1,419 genes were identified, including 566 hypermethylated and 975 hypomethylated peaks (Figures 1F, S1D). Our profiling included the previously known set of m6A methylated sites, where > 150 transcripts were with m6A content in LUAD cell lines (including A549 and H1299) (Figure S1E). GO and KEGG pathway enrichment analyses for all m6A hypo- and hyper-methylated mRNA/ncRNA demonstrated that abnormal m6A methylation played an important role in the immune response and tumor-related processes, including positive regulation of nuclear factor-κB (NF-κB) transcription factor activity, angiogenesis and cell-substrate adhesion (Figures 1G, S1F). Taken together, these results imply that tumor-related genes are likely to be regulated by m6A in patients with LUAD.
It is intriguing that whether abnormal m6A methylation affects the expression of these genes. To explore the potential function of m6A in regulating gene expression, m6A-mediated alteration of gene expression was detected regarding the MeRIP-seq input library as RNA-seq data. RNA-seq data showed that the samples from the tumor and NAT groups were separated from each other, representing a distinct expression landscape (Figure S2A). In total, 461 up-regulated and 379 down-regulated genes were detected in the tumor tissues (Figure 2A, Supplementary Table S2). Joint analysis of m6A methylation and gene expression showed 300 genes with changes in m6A levels and expression levels (Figure 2B, Supplementary Table S3). We defined those genes as m6A-regulated genes, among which 115 hypermethylated genes were significantly up-regulated (Hyper-up: 47) or down-regulated (Hyper-down: 68) and 185 hypomethylated genes were significantly differentially expressed (Hypo-up: 69 and Hypo-down: 116). Two genes with hypo-methylated (AKAP12) and the hyper-methylated (TRIM2) m6A peak were listed as examples and demonstrated via IGV tracks (Figures S2B-D). The m6A level of AKAP12 was significantly down-regulated in the tumor by 8.88-fold and conversely that of TRIM2 was significantly up-regulated by 2.38-fold.
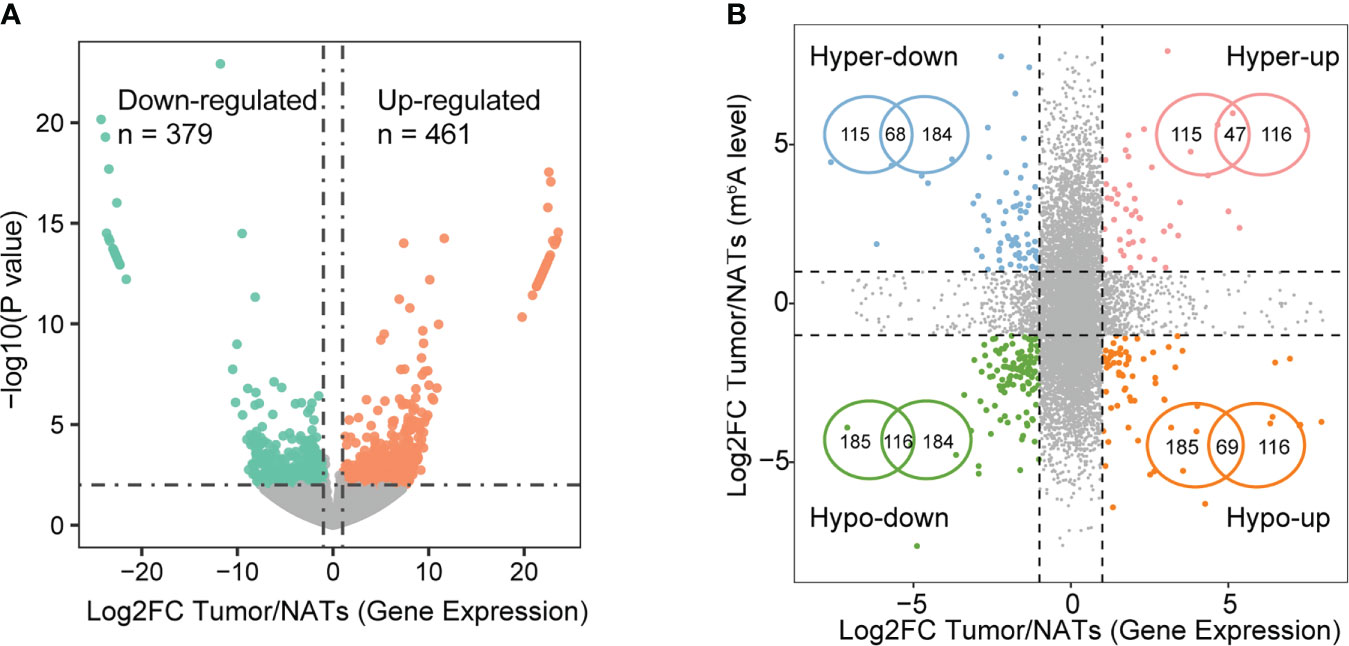
Figure 2 Expression alterations modulated by m6A signal. (A) Volcano plot of differentially expressed genes based on p-value< 0.01 and |log2FC| > 1. (B) Four-quadrant plots (left) showing genes with significant changes in both m6A levels and expression levels in tumors compared with NATs. Significance signals correspond to DEG and differential m6A methylation as follows: peaks with FDR< 0.05 and |log2FC| > 2, genes with p-value< 0.01 and |log2FC| > 1. Venn diagrams (right) showing the overlapping hyper- and hypo-methylated genes with significantly differential expression.
To explore enriched regulators of m6A-regulated genes identified in this study, targets of 151 RBPs were enrolled. The top enriched RBP were transforming growth factor beta regulator 4 (TBRG4) and RNA splicing factor SRRM4, which are important regulators in the tumorigenic progression of several tumors (Figure S2E). The specific m6A demethylase ALKBH5 and reader YTHDF2 were also identified. Our results showed that the majority (64.4%) of m6A-regulated transcripts were hypo-methylated (Figure 1F). YTHDF2 mediates m6A promoting the decay of mRNA, while ALKBH5 erases m6A modification, which both explained the observed hypo-methylation trend in this study.
Previous studies have reported that m6A regulators can be used as potential molecular markers for diagnosis and prognosis assessment, and m6A modification regulated by m6A regulators can facilitate or inhibit malignant behaviors primarily through regulating the expression of target oncogenes or tumor suppressor genes. Therefore, we next explored the clinical significance of 300 m6A-regulated genes in 1347 LUAD patients from three clinical cohorts (TCGA-LUAD, GSE68465 and GSE72094). A total of 462 TGCA-LUAD patients were divided into training and testing cohorts and were used to develop the prognostic signature. First, according to univariate Cox proportional hazards regression analysis, 67 m6A-regulated genes were significantly correlated with OS (P< 0.001). Next, LASSO Cox regression analysis was performed to discern the most available forecast markers and produce a prognostic indicator to predict clinical results (Figure 3A). A 15-gene set in the model was considered the m6A-regulated prognosis-associated signature (m6A-PPS) (Figure 3B). A Cox multivariate regression model was then used to calculate the Cox regression coefficient of m6A-PPS genes, and the m6A-PPS score of each patient was defined as taking the sum of the regression coefficient for each of m6A-PPS genes multiplied by its expression value. Detailed information on the 15 m6A-PPS genes was listed in Supplementary Table S4.
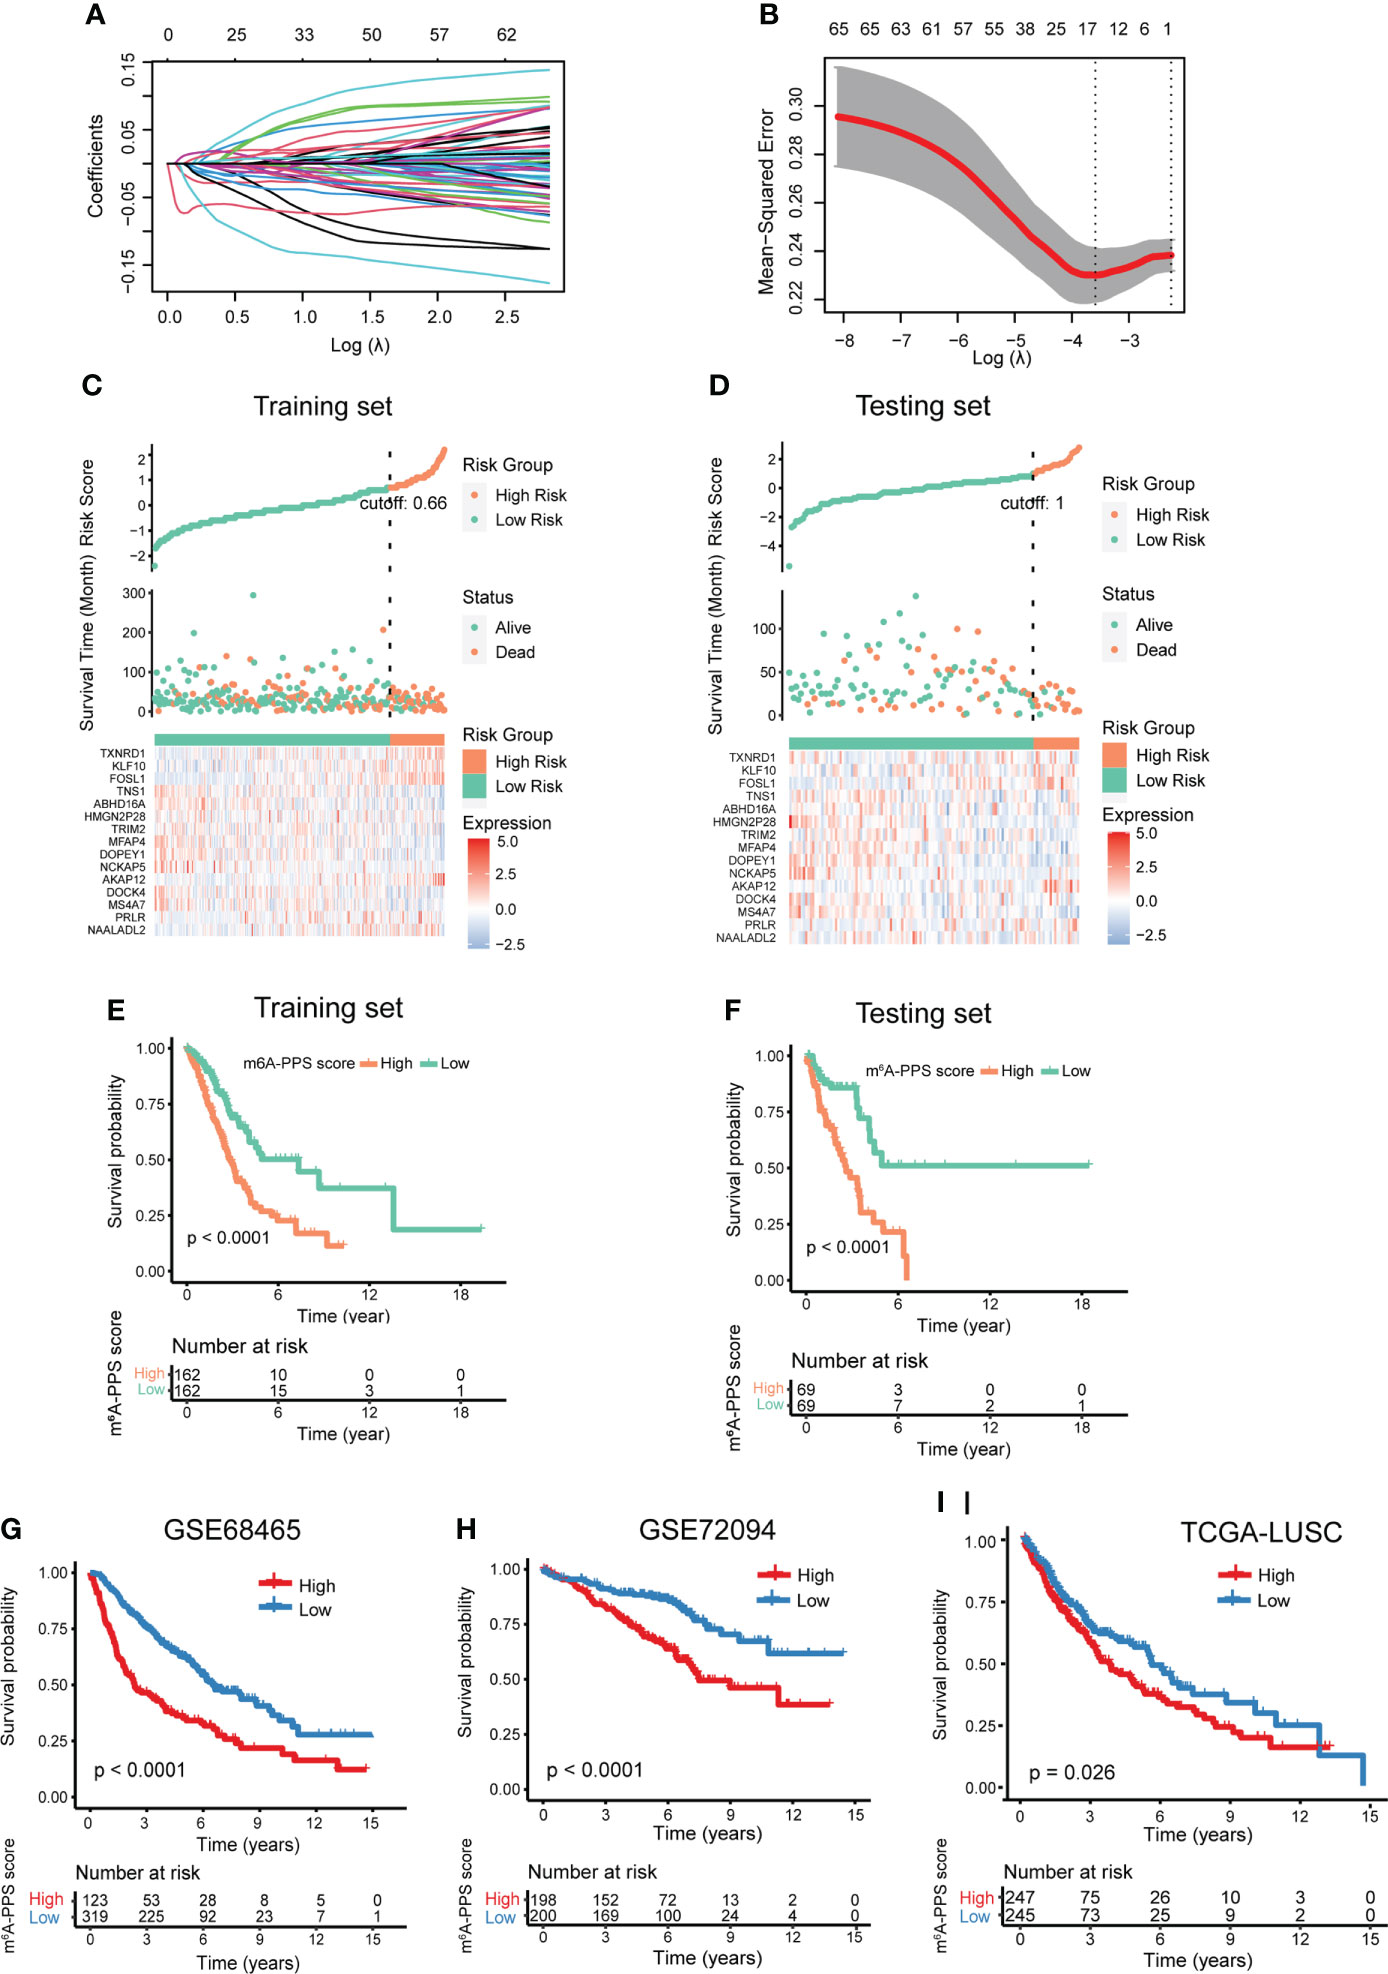
Figure 3 Development and validation of the m6A-PPS and evaluation of the prognostic value. (A) The tuning parameters [log(lambda)] of OS-related genes were selected to cross-verify the error curve. According to the minimal criterion and 1-se criterion, perpendicular imaginary lines were drawn at the optimal value. (B) The LASSO coefficient profile of 15 OS-related m6A-regulated genes and perpendicular imaginary lines were drawn at the value chosen by 10-fold cross-validation. (C, D) Distribution of risk score, survival status of LUAD patients and heatmap expression of 15 m6A-regulated genes in the training set (C) and testing set (D). (E, F) Kaplan–Meier curves of OS for LUAD patients stratified by the median m6A-PPS score in the training set (E) and testing set (F). (G–I) Validation of the m6A-PPS model in three independent cohorts.
To test the prognostic capability of the proposed model, patients were divided into a low m6A-PPS score group and a high m6A-PPS score group in the training, testing and entire set using the median score or optimal score as the cutoff point. ROC curve analyses were conducted to assess the prognostic accuracy of the 15 m6A-PPS-based classifier, with 1-, 3-, and 5-year AUCs of 0.745, 0.670 and 0.726 in training set; 0.652, 0.739 and 0.666 in testing set, respectively (Figures S3A, B). The calibration curve of the model demonstrated good agreement between prediction and observation in two sets (Figures S3C, D). We depicted the distribution of risk grades, the pattern of survival status and survival time, and expression of the m6A-regulated genes in the training set and testing set (Figures 3C, D). Kaplan–Meier survival curves demonstrated that the OS of the high m6A-PPS score group was shorter than that of the low m6A-PPS score group in the training set and testing set (Figures 3E, F). In addition, the m6A-PPS score for every individual in the entire set was calculated using the uniform formula, and there was no difference in the outcomes compared with the training set and testing set. A significant prognostic difference was observed between the two groups, where the higher m6A-PPS score group demonstrated worse survival than the lower group (Figures S3E, F). To further verify the grouping ability of the m6A-regulated gene model, principal component analysis (PCA) was conducted to test the difference between groups. The distributions of the high- and low-risk groups based on the entire gene expression profiles were relatively scattered (Figure S3G). However, the results obtained based on our model illustrated that the low- and high-risk groups had different distributions (Figure S3H), suggesting that the m6A-PPS can distinguish between the low- and high-risk groups.
To confirm the similar prognostic potentiality of the m6A-PPS-based classifier in different populations, three independent cohorts were employed. In GSE68465 and GSE72094 cohorts, the results of Kaplan–Meier survival analyses also revealed that the prognostic difference of LUAD patients stratified by the m6A-PPS score was statistically significant (Figures 3G, H). For the LUSC population, patients with a higher relative risk showed a trend toward higher mortality (Figure 3I). Taken together, the m6A-PPS was competent to predict the outcomes of non-small cell lung cancer.
Univariate and multivariate analysis were performed to evaluate the prognostic value of the m6A-PPS and other clinicopathological characteristics in the training set and testing set. The results showed that m6A-PPS was significantly associated with tumor stage (Training set: HR = 1.710, 95% CI: 1.450–2.01, p< 0.001; Testing set: HR = 1.630, 95% CI: 1.240–2.130; p< 0.001) (Figures 4A, B), while the risk model was unrelated to age and gender. According to the subgroups classified by tumor stage, similar results were observed in early-stage (stage I-II) and advanced stage (stage III-IV) patients, and the OS of low-risk patients tended to be superior to that of high-risk individuals (Figures 4C, D). The nomogram comprising clinical risk features and the risk grade was fabricated to predict the one-, two- and three-year OS incidences, which suggested that the risk grade had a predominant ability in prognosis prediction, compared with clinical factors (Figure S4). Together, these data indicate that m6A-PPS was an independent prognostic factor for patients with LUAD and might be useful for clinical prognosis evaluation.
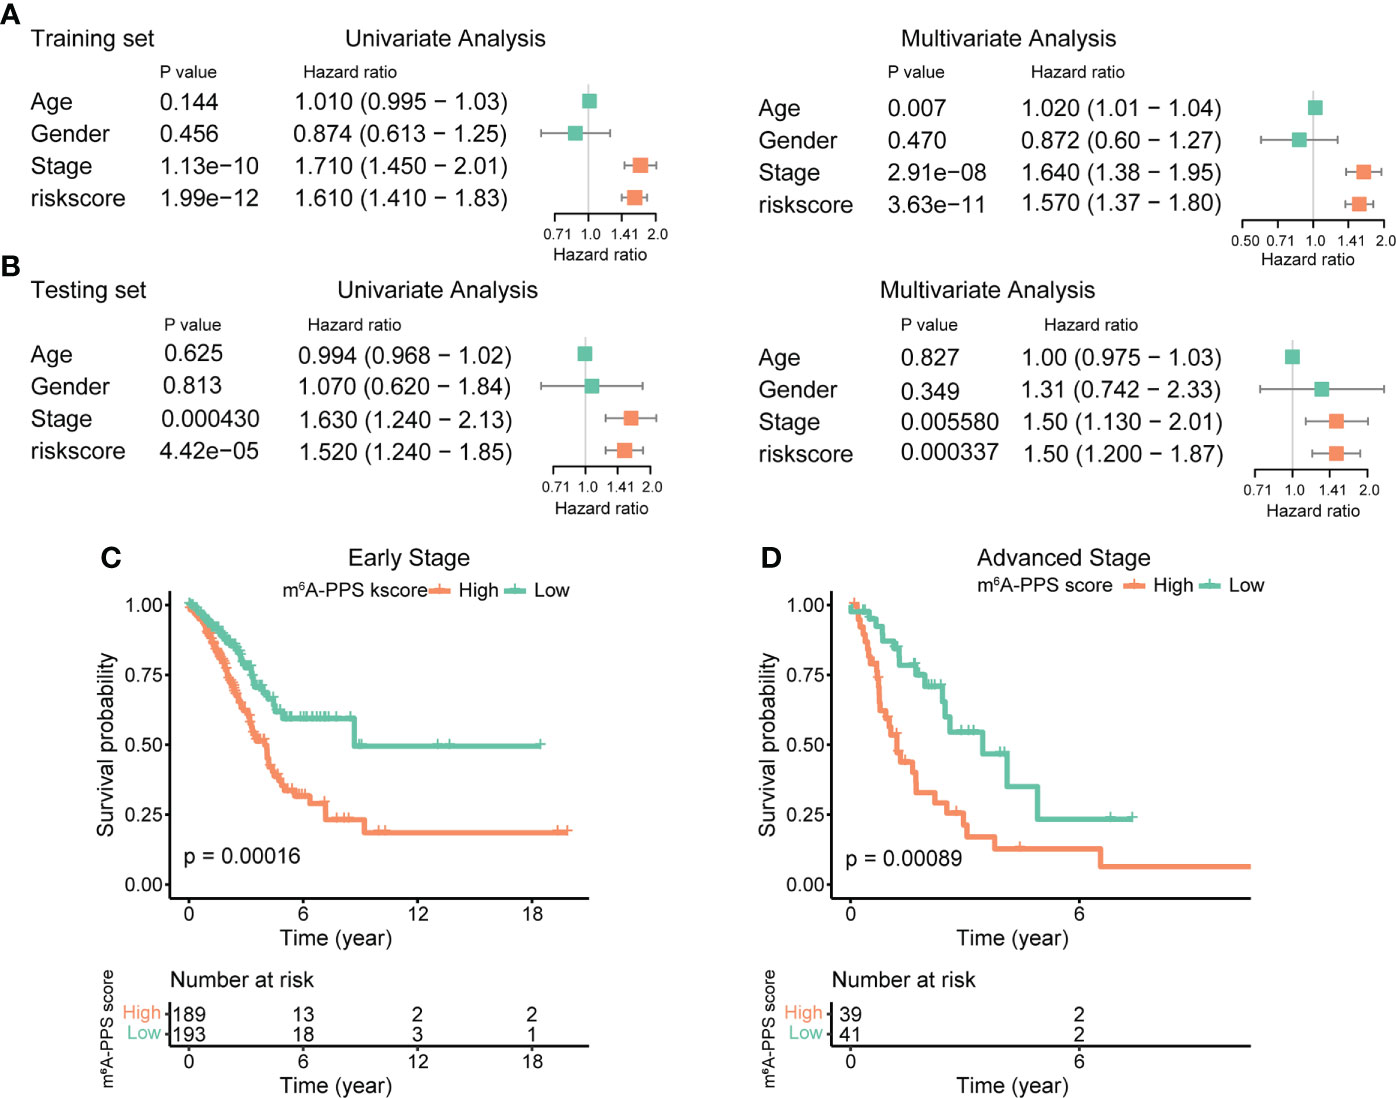
Figure 4 Assessment of the prognostic risk model of the m6A-RPS and clinical features. (A, B) Univariate and multivariate Cox regression analyses of correlations between the risk score for the m6A-RPS and clinical features in the training set (A) and validation set (B). (C, D) Kaplan–Meier survival analysis of m6A-RPS prognostic value in stage I–II (C) and stage III–IV (D) patients in the TCGA LUAD cohort.
We investigated genetic alterations of 15 m6A-PPS genes using somatic mutations and copy number variations (CNVs) in LUAD cohorts. NCKAP5 showed the highest mutation frequency (11%), followed by DOCK4 (5%), and the frequency of other genes was less than 3% (Figure S5A). For CNV, the overall average frequency of m6A-PPS genes was prevalently low (Figure S5B). We evaluated the expression of 15 m6A-PPS genes in normal tissues from healthy human, tumor and paired normal tissues from patients with LUAD. All m6A-PPS genes were differentially expressed (Figure S5C). When only compared with paired non-cancerous adjacent tissues in 58 LUAD patients, the expression of 12 of 15 genes was significantly differentially regulated in tumors (Figure S6).
To investigate the relationship between m6A-PPS and 23 m6A regulators (including 8 writers, 2 erasers and 13 readers), we conducted Spearman correlation analysis between the mRNA expression of m6A regulators and the m6A-PPS score and between the mRNA expression of m6A regulators and 15 m6A-PPS-associated genes. The results showed that the expression of IGF2BP1/2/3 (r > 0.3, P< 0.05) and METTL3 (r< -0.3, P< 0.05) was significantly correlated with the m6A-PPS score (Figure 5A). IGF2BP3 was significantly upregulated in tumors compared with paired normal tissues across five independent cohorts and was identified as a risk factor in LUAD (HR = 1.241, P< 0.001) (Figures 5B, C). Several highly correlated relationships were observed between m6A regulators and m6A-PPS genes, among which there was a higher correlation between DOPEY1 and YTHDC2 than others (Figure 5D, r = 0.57).
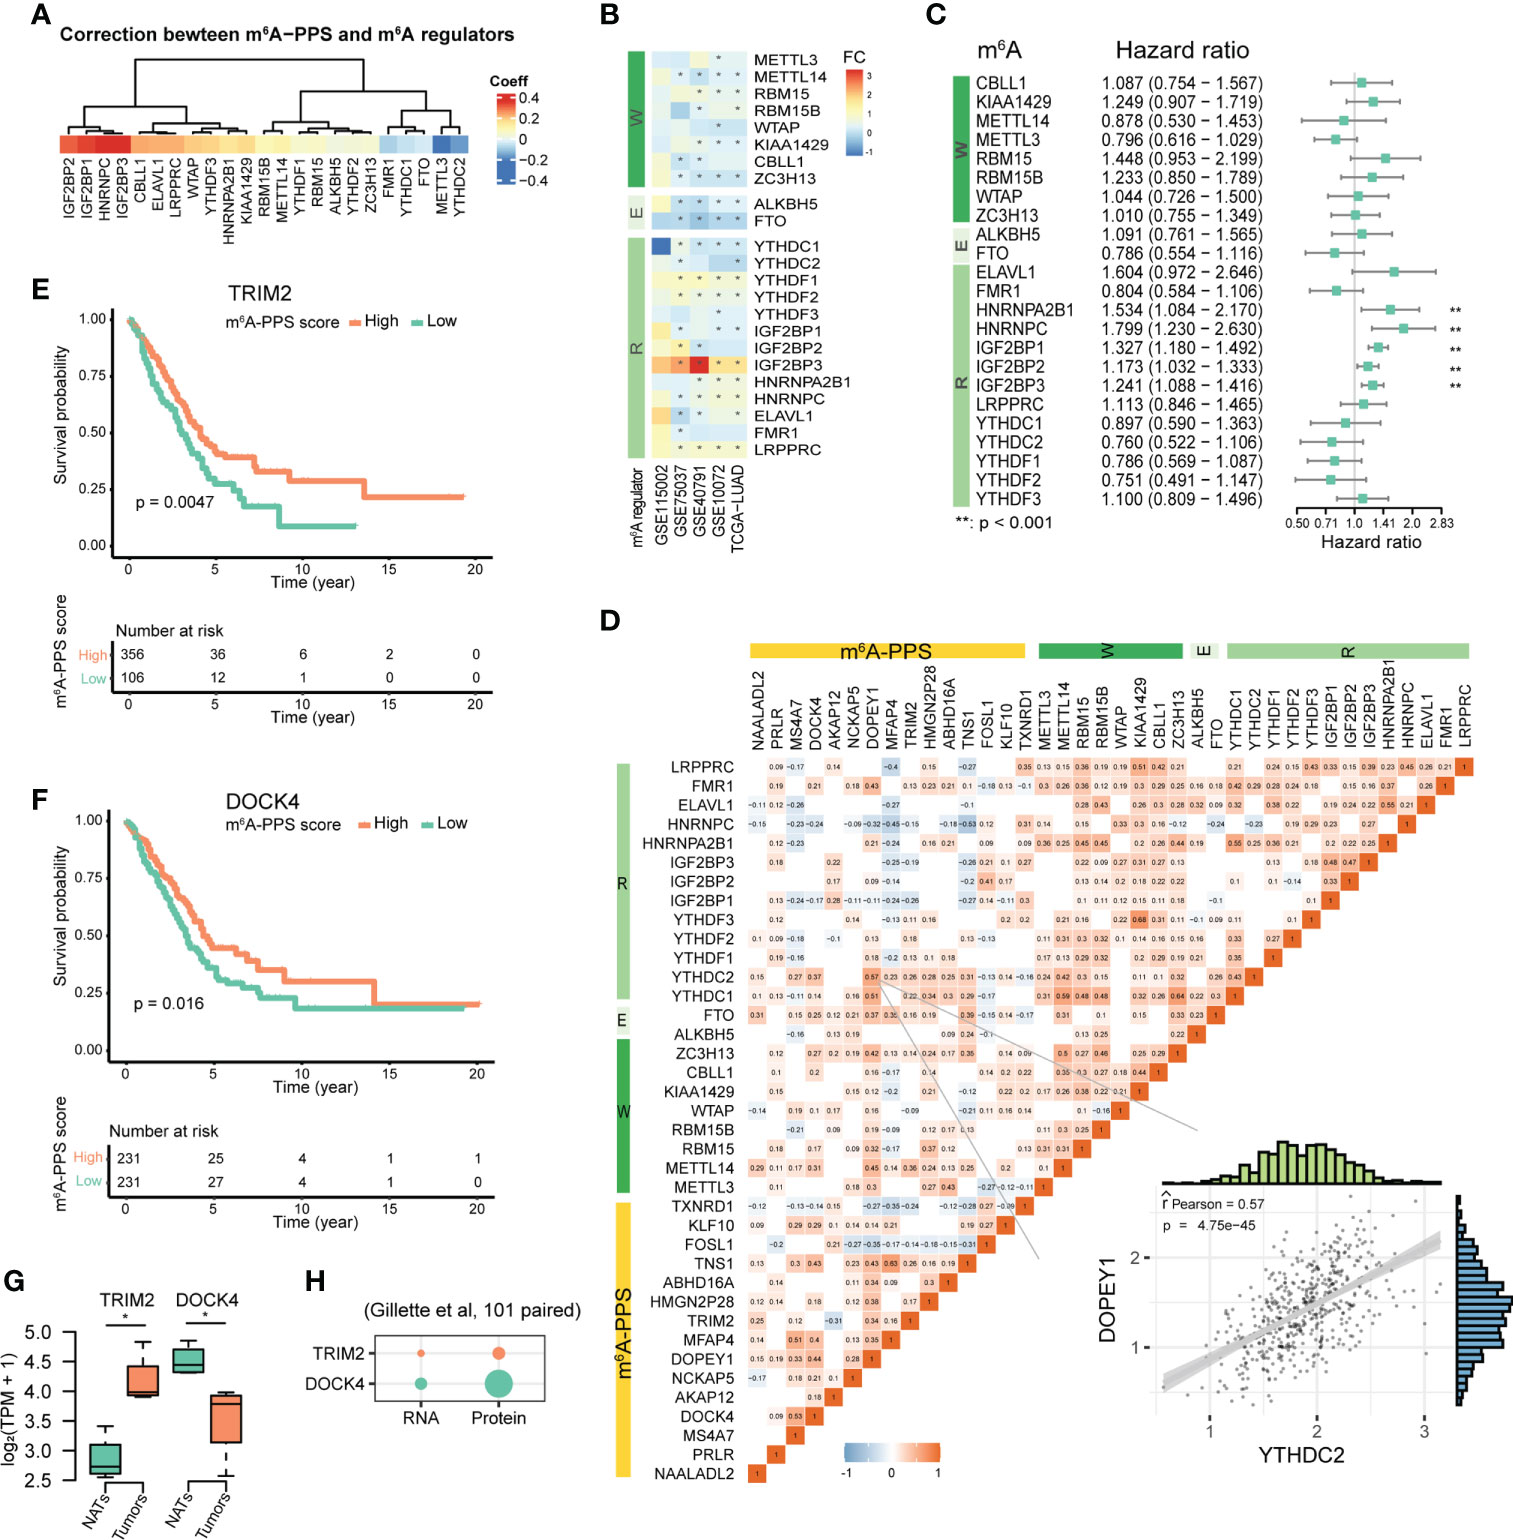
Figure 5 Molecular features of m6A-PPS and its correlation with m6A regulators. (A) Correlation between m6A-PPS and m6A regulators. (B) Heatmap showing the alternate expression of 23 m6A regulators across five independent LUAD cohorts. The asterisk represents an adjusted P value< 0.05. FC denotes log2Fold change between tumor vs. normal. (C) Forest plot of the prognostic ability of 23 m6A regulators. (D) Heatmap for the correlations between 23 m6A regulators and 15 prognostic m6A-regulated genes in the TCGA-LUAD cohort. Scatterplot showing an example of the Pearson correlation between YTHDC2 and DOPEY1 (Pearson R = 0.57). (E, F) OS of LUAD patients stratified by the expression levels of TRIM2 (E) and DOCK4 (F). (G) Box plots showing the transcript-level differences of TRIM2 and DOCK4 in this study. (H) Dot plot depicting the differential expression of TRIM2 and DOCK4 at the RNA and protein levels in 101 tumors and 101 matched NATs. p-value from Wilcoxon rank-sum test (*P<0.05).
The results of multivariate Cox regression analysis showed that the expression levels of TRIM2 and DOCK4 were associated with increased risk scores (Figure S5D), which was consistent with the results of LASSO Cox regression analysis (Figures 3C, D). Kaplan–Meier survival curves confirmed that higher expression of TRIM2 and DOCK4 were both prognostic for longer survival in the TCGA dataset (Figures 5E, F). We further verified the expression of TRIM2 and DOCK4 based on RNA-seq data from 5 LUAD patients, which suggested that TRIM2 was up-regulated and DOCK4 was down-regulated in tumor tissues compared with NATs (Figure 5G), which was consistent with the results from the GEPIA2 database (483 tumor and 347 normal samples) (Figure S5E). The Pearson correlation coefficients of the two genes and the m6A writer METTL14 were both more than 0.3 (P<0.001; TRIM2, r = 0.38; DOCK4, r = 0.31) (Figure 5D). Although the m6A levels of TRIM2 and DOCK4 were both hypo-methylation in tumors (Supplementary Table S3), the protein expression level of DOCK4 was increased, while TRIM2 protein expression was unchanged (Figure 5H), which was coherent with the fact that RNA m6A affects mRNA translation.
Gene Ontology (GO) enrichment analysis of tumor-enriched m6A modification revealed the involvement of immune-related biological processes (Figure 1F). Thus, we investigated the correlations between m6A-PPS and immunotherapeutic biomarkers. We discovered that the high m6A-PPS score group was more likely to respond to immunotherapy than the low m6A-PPS score group, indicating that m6A-PPS might serve as an indicator for predicting Tumor Immune Dysfunction and Exclusion (TIDE) (Figure 6A). Tumor mutational burden (TMB) was employed as a valid biomarker to predict the response to PD-L1 treatment (25). Based on somatic mutation data from the TGCA-LUAD cohort, the top 20 driver genes with the highest alteration frequency between the high- and low-risk subgroups were listed (Figure 6B). We found that the TMB scores in the high-risk group exceeded those in the low-risk group, implying that the m6A-PPS had a high correlation with TMB (Figure 6C). TP53 was used as a prognostic marker and its mutation was correlated with worse survival of LUAD patients (26). Therefore, we validated whether the m6A-PPS could better predict the OS outcome than TP53 mutation status (wild-type or mutated). The patients with TP53 mutation and high-risk had the worst survival outcomes compared with the other three groups (Figure 6D). In conclusion, patients in the high- and low-risk subgroup were distinguished more effectively in terms of the immunotherapeutic response.
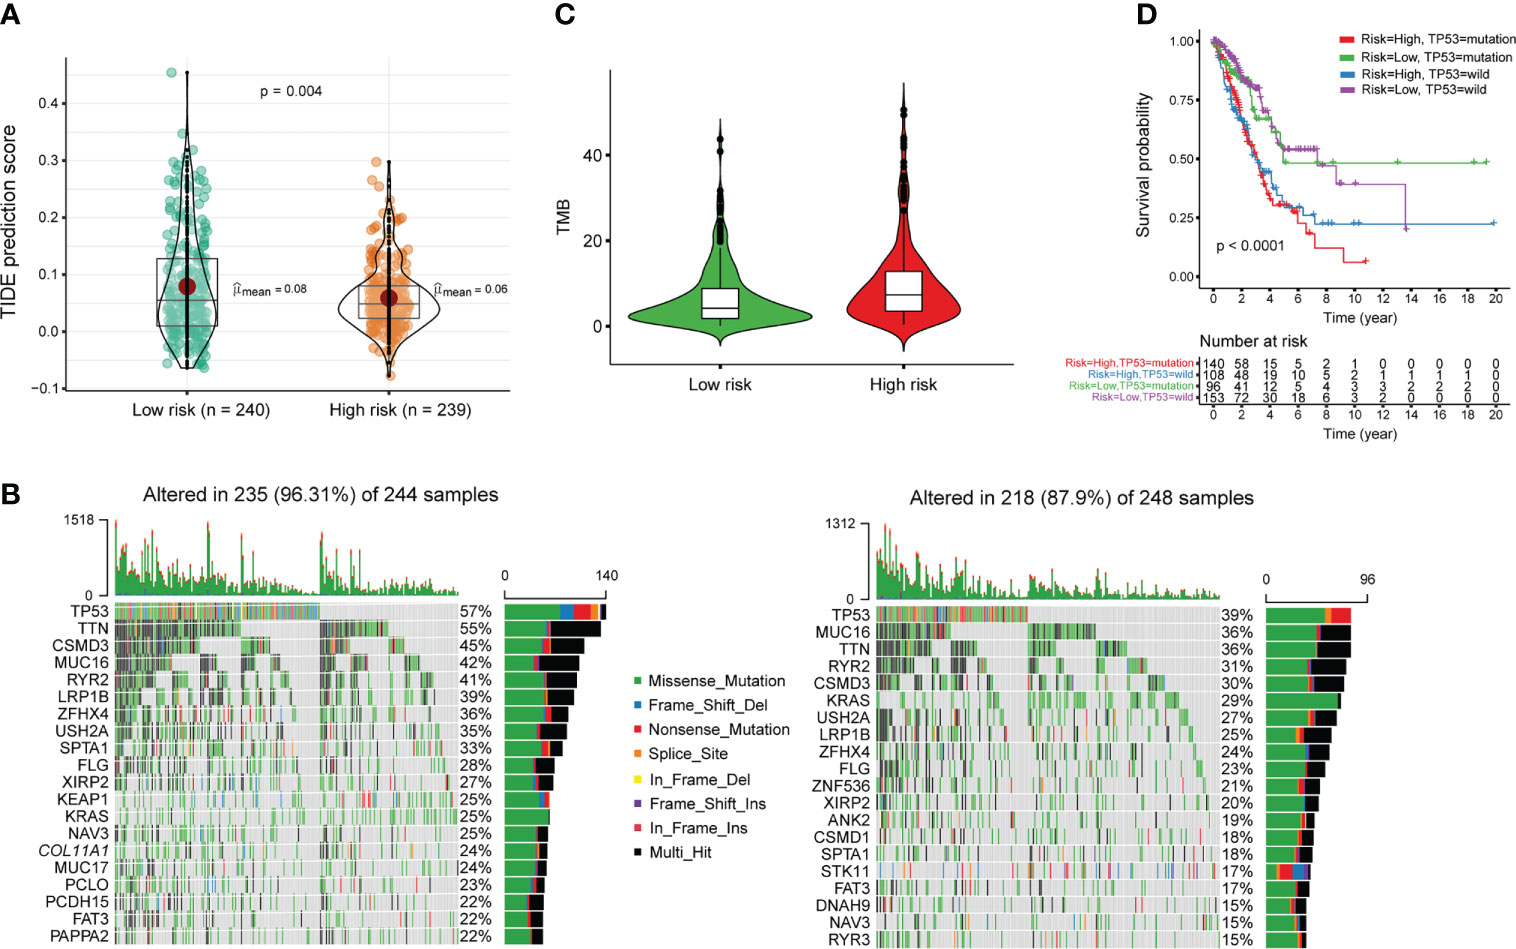
Figure 6 Estimation of the immunotherapy response of m6A-PPS in the entire TCGA cohort. (A) TIDE prediction difference in the high- and low-risk patients. (B) Oncoplot of genomic alterations of the top 20 frequently mutated genes in the high-risk group (left) and low-risk group (right). Each column corresponds to every patient. The upper bar plot shows the TMB of every individual. The right panel shows the mutation frequency and proportion of each variant type for each gene. (C) TMB difference in the high- and low-risk patients. (D) Kaplan–Meier curve analysis of OS for LUAD patients classified according to TP53 mutation status and m6A-PPS.
Cancer is a heterogeneous disease, and molecular characterization of patients’ tumors becomes increasingly important to direct treatment efforts. Over the last decade, high-throughput analyses of large number of samples have significantly propelled the understanding of lung carcinogenesis, and identified biomarkers have shed light on improving patient’s outcomes. m6A, the most frequent modification on RNA, plays a critical role in many regulatory processes and m6A-mediated regulatory pathways affect disease development. Despite rapid progress, there are still noteworthy gaps in the understanding of m6A-regulation and function in LUAD. Here, our aim was to develop a prognostic predictor based on m6A-mediated genes for LUAD patients. As expected, m6A-PPS, a 15-gene set, had markedly better performance in prognostication than other direct gene-expression-based signatures, as well as a better response to immunotherapy, and higher TMB scores. These results implied a precise prognosis prediction approach toward patients with similar biological patterns, which was bound to achieve more reliable prognostication.
Different LUAD subtypes have distinct clinical and molecular characteristics, as well as clinical outcomes, making it almost impossible to find a therapy that fits all LUAD cases (1). Thus, many studies have focused on identifying more precise molecular signatures to predict the survival and immunotherapeutic response of LUAD patients. Molecular features, such as expression level, protein level, gene mutation or DNA methylation, provide further prognosis insights but have yet been limited to the use of single information (27, 28). m6A, an important regulator of gene expression, has been found to play an essential role in the prognosis, progression, and immune microenvironment of LUAD (29). However, studies on the pathological role and function of m6A and its target mRNAs/lncRNAs in LUAD progression remain limited, the feasibility of serving the m6A-regulated gene as a candidate prognostic marker in particular. Therefore, developing a m6A-mediated-gene-expression-based signature, as one of the main purposes of this study, is of great significance to optimize the prognostic evaluation, and m6A-PPS could be a novel biomarker set to guide targeted treatment for subsequent studies.
Using an analysis that correlates m6A effects on expression level, we identified 300 m6A-regulated genes, such as AKAP12 (Figure S2), a kinase anchor protein 12, which is critical for signal transduction and cell structure maintenance (30). However, due to the heterogeneity of tumor molecules and the small sample sizes of this study, it may also be underpowered to detect many more m6A-regulated genes. For potential enriched RBPs of 300 m6A-regulated genes, some transcription factors were identified, such as TBRG4 (Figure S2D), which may be a trans regulator of m6A in LUAD. Previous reports have shown that transcription factor-m6A regulator interactions may broadly exist and participate in common diseases (31).
The m6A-PPS consisted of 15 genes, including NAALADL2, PRLR, MS4A7, DOCK4, AKAP12, NCKAP5, DOPEY1, MFAP4, TRIM2, HMGN2P28, ABHD16A, TNS1, FOSL1, KLF10 and TXNRD1, which is not in line with previous works that reported 10 prognostic m6A-regulated genes (RFXAP, KHDRBS2, MAPRE3, TXN, EGFR, MGST3, USP1, ARHGEF4, CDHR5, and ADAMTS6) (18). A possible explanation for this apparent discrepancy is that m6A methylation is dynamic, and m6A motifs are methylated depending on diverse conditions. For example, for pathological stage, LUAD patients in this study stemmed from early stage, not advanced stage, and the expression level of cis and trans regulators of m6A and related-regulation network were variable range from in different stages. Another example is genetic determinants of m6A methylation (32). HMGN2P28, one of 15-gene sets, is a processed pseudogene and its expression was significantly lower in tumors than NATs in this study, but was higher in special groups (Figure S5). Zhao et al. reported that the m6A-modified pseudogene HSPA7 was identified as a novel prognostic risk factor and immunotherapy target for glioblastoma patients (33). These processed pseudogenes have evolved surveillance mechanisms through m6A modification instead of nonsense-mediated decay, keeping necessary pseudogene transcripts to interfere with the regulatory network of protein-coding genes (34).
Almost every stage of RNA metabolism, such as stability and translation efficiency, is regulated by m6A (35). In this study, most of the genes with altered m6A methylation levels were not accompanied by changes in expression levels, which may be because m6A modification of transcripts not only regulates expression levels but also influences chromatin state, RNA structure, and its interactions with specific RNA binding proteins (36, 37). Among 15 m6A-PPS genes, TRIM2 and DOCK4 exhibited independent prognostic value. TRIM2 (tripartite motif-containing 2), a member of the TRIM superfamily, is involved in a variety of physiological processes, including DNA repair, cell proliferation and pluripotency, transcription and signal transduction, and is also associated with carcinogenic effects in several malignancies, such as lung cancer (38) and pancreatic cancer (39). DOCK4 (dedicator of cytokinesis 4), a member of the CDM gene family encoding regulators of small GTPases, is mainly involved in maintaining cellular homeostasis (40). Mutations or reduced expression of DOCK4 can lead to lung malignancies as well as solid tumor metastasis (41). We found that although both TRIM2 and DOCK4 were hypermethylated, the expression level of TRIM2 was increased, while that of DOCK4 was decreased. The results suggested that m6A methylation affected on gene expression, but the regulatory function of m6A in mRNA remained to be fully explored.
As a decisive factor of the prognosis, different pathological stages tend to exhibit different clinical outcomes in LUAD patients. Unfortunately, patients with LUAD at the same stage could have different clinical outcomes. The established m6A-PPS model, based on m6A-regulated genes, not m6A-related genes, outputs a more accurate prediction for prognosis in LUAD patients. The results also provide insights for future studies on the process and mechanism of m6A modification of mRNAs. In this study there are shortcomings and limitations, especially the small number of specimens used, which may affect the screening of candidate m6A-regulated genes. Additionally, external independent datasets would be employed to validate the prediction model and the biological mechanism of m6A-PPS would be elucidated. Nevertheless, our results can still provide novel information for prognosis using m6A-PPS, thereby providing insights into their potential roles in LUAD tumorigenesis and progression.
In this study, we developed and validated a m6A-regulated prognosis-associated signature (m6A-PPS) for LUAD. The 15-gene signature was qualified for prognosis prediction for LUAD patients as well as predicted response to immunotherapeutic.
The data presented in this study have been deposited in the Genome Sequence Archive (GSA) in BIG Data Center, Beijing Institute of Genomics (BIG) under accession number HRA003044 (https://ngdc.cncb.ac.cn/gsa-human/browse/HRA003044).
The studies involving human participants were reviewed and approved by The study was approved by the Ethics Committee of West China Hospital of Sichuan University (Ethics: Project identification code: 2021.292). The patients/participants provided their written informed consent to participate in this study.
WL and YC conceived and designed the project, performed bioinformatic analyses and drafted and edited the manuscript with all authors providing feedback. LX and YP helped with data analysis and revised the paper. CL conducted experiments. XX collected human clinical samples. GW and LB contributed to interpreting the results. All authors contributed to the article and approved the submitted version.
This study was supported by National Natural Science Foundation of China (Nos. 81871890, 91859203 to WL), Post-Doctor Research Project, West China Hospital, Sichuan University (2021HXBH051), Sichuan Science and Technology Support Project (No. 2022NSFSC1516 to YC) and the Fundamental Research Funds for the Central Universities (No. 2022SCU12047 to YC).
The authors declare that the research was conducted in the absence of any commercial or financial relationships that could be construed as a potential conflict of interest.
All claims expressed in this article are solely those of the authors and do not necessarily represent those of their affiliated organizations, or those of the publisher, the editors and the reviewers. Any product that may be evaluated in this article, or claim that may be made by its manufacturer, is not guaranteed or endorsed by the publisher.
The Supplementary Material for this article can be found online at: https://www.frontiersin.org/articles/10.3389/fonc.2022.947808/full#supplementary-material
Supplementary Figure 1 | Landscape of the m6A methylome in LUAD patients. (A) Overview of the collected specimens, the corresponding clinical features of donors and high-throughput sequencing of tissues. (B) Metagene distribution of the enriched m6A peaks in tumor tissue and paired NATs. Each segment was normalized according to its average length in Refseq annotation. (C) Pie charts showing the distribution of enriched m6A peaks in tumors and paired NATs. (D) Circle plot showing differential m6A modification peaks. The statistical significance of the difference between tumor and paired NATs was determined based on log2FC > 1 and P-adjusted< 0.05. The first track indicates altered m6A peaks and the second track indicates the density distribution of altered m6A peaks. (E) Venn diagrams showing the overlapping m6A methylated genes among A549, H1299 and LUAD tissues. (F) Biology process enrichment analysis of hyper- and hypo-methylated genes.
Supplementary Figure 2 | Representative IGV views of m6A signals and identification of enriched RBPs of m6A-regulated genes. (A–C) Tracks showing the read coverage of the IPs and inputs of the representative individuals as well as highlighted m6A peaks on EGFR, AKAP12 and TRIM2. The peaks are located in the 3’UTR of EGFR (A) and the exon regions of AKAP12 (B) and TRIM2 (C). The tracks are shown for optimal viewing. (D) Bubble chart presenting enriched regulators of m6A-regulated genes detected in this study.
Supplementary Figure 3 | Evaluation of the prognostic value of a 15-gene set. (A, B) Time-dependent ROC analysis for the prognosis prediction of the signature of OS in the training set (A) and testing set (B) and the area under curve (AUC) was calculated. (C, D) Calibration curve of the nomogram in the training set (C) and testing set (D). (E, F) Distribution of risk score, survival status of LUAD patients and heatmap expression of 15 m6A-regulated genes in the entire set (E). Kaplan–Meier survival curves of LUAD patients with high- and low-risk scores in the entire set (F). (G, H) Principal component analysis between the high- and low-risk groups based on the entire gene expression profiles (G) and 15 m6A-regulated genes (H).
Supplementary Figure 4 | A nomogram predicting the probability of the one-, two- and three-year overall survival.
Supplementary Figure 5 | The landscape of genetic and expression alterations of m6A-PPS. (A) A total of 155 of 567 LUAD patients experienced genetic alterations of 15 m6A-PPS genes. The number on the right indicates the mutation frequency in each gene, and each column represents every individual. (B) The CNV frequency of m6A-PPS was low. (C) Average expression of 15 m6A-PPS genes in normal tissues from the GTEx database, tumor tissues and paired normal tissues from the TCGA-LUAD cohort. Asterisks show the level of significance among different tissue types based on the Kruskal–Wallis test (**P< 0.01, *** P< 0.001, ****P< 0.0001). (D) Forest plot of the prognostic ability of 15 m6A-regulated genes using the multivariate Cox proportional hazard model. (E) The mRNA expression levels of TRIM2 and DOCK4 in 483 tumors and 347 normal tissues from the GEPIA2 database.
Supplementary Figure 6 | The expression overview of 15 m6A-PPS genes between tumor and paired normal tissues. (ns P>0.05, **P< 0.01, *** P< 0.001, ****P< 0.0001).
1. Xu JY, Zhang C, Wang X, Zhai L, Ma Y, Mao Y, et al. Integrative proteomic characterization of human lung adenocarcinoma. Cell (2020) 182(1):245–61.e17. doi: 10.1016/j.cell.2020.05.043
2. Gillette MA, Satpathy S, Cao S, Dhanasekaran SM, Vasaikar SV, Krug K, et al. Proteogenomic characterization reveals therapeutic vulnerabilities in lung adenocarcinoma. Cell (2020) 182(1):200–25 e35. doi: 10.1016/j.cell.2020.06.013
3. Dominissini D, Moshitch-Moshkovitz S, Schwartz S, Salmon-Divon M, Ungar L, Osenberg S, et al. Topology of the human and mouse M6a rna methylomes revealed by M6a-seq. Nature (2012) 485(7397):201–6. doi: 10.1038/nature11112
4. Liu J, Yue Y, Han D, Wang X, Fu Y, Zhang L, et al. A Mettl3-Mettl14 complex mediates mammalian nuclear rna N6-adenosine methylation. Nat Chem Biol (2014) 10(2):93–5. doi: 10.1038/nchembio.1432
5. Jia G, Fu Y, Zhao X, Dai Q, Zheng G, Yang Y, et al. N6-methyladenosine in nuclear rna is a major substrate of the obesity-associated fto. Nat Chem Biol (2011) 7(12):885–7. doi: 10.1038/nchembio.687
6. Zheng GQ, Dahl JA, Niu YM, Fedorcsak P, Huang CM, Li CJ, et al. Alkbh5 is a mammalian rna demethylase that impacts rna metabolism and mouse fertility. Mol Cell (2013) 49(1):18–29. doi: 10.1016/j.molcel.2012.10.015
7. Hou G, Zhao X, Li L, Yang Q, Liu X, Huang C, et al. Sumoylation of Ythdf2 promotes mrna degradation and cancer progression by increasing its binding affinity with M6a-modified mrnas. Nucleic Acids Res (2021) 49(5):2859–77. doi: 10.1093/nar/gkab065
8. Xiao W, Adhikari S, Dahal U, Chen YS, Hao YJ, Sun BF, et al. Nuclear M(6)a reader Ythdc1 regulates mrna splicing. Mol Cell (2016) 61(4):507–19. doi: 10.1016/j.molcel.2016.01.012
9. Shen C, Xuan B, Yan T, Ma Y, Xu P, Tian X, et al. M(6)a-dependent glycolysis enhances colorectal cancer progression. Mol Cancer (2020) 19(1):72. doi: 10.1186/s12943-020-01190-w
10. Liu C, Yang Z, Li R, Wu Y, Chi M, Gao S, et al. Potential roles of N6-methyladenosine (M6a) in immune cells. J Transl Med (2021) 19(1):251. doi: 10.1186/s12967-021-02918-y
11. Shulman Z, Stern-Ginossar N. The rna modification N(6)-methyladenosine as a novel regulator of the immune system. Nat Immunol (2020) 21(5):501–12. doi: 10.1038/s41590-020-0650-4
12. Cheng Y, Wang M, Zhou J, Dong H, Wang S, Xu H. The important role of N6-methyladenosine rna modification in non-small cell lung cancer. Genes (Basel) (2021) 12(3):440. doi: 10.3390/genes12030440
13. Xue L, Li J, Lin Y, Liu D, Yang Q, Jian J, et al. M(6) a transferase Mettl3-induced lncrna Abhd11-As1 promotes the warburg effect of non-Small-Cell lung cancer. J Cell Physiol (2021) 236(4):2649–58. doi: 10.1002/jcp.30023
14. Zhou Z, Zhang J, Xu C, Yang J, Zhang Y, Liu M, et al. An integrated model of N6-methyladenosine regulators to predict tumor aggressiveness and immune evasion in pancreatic cancer. EBioMedicine (2021) 65:103271. doi: 10.1016/j.ebiom.2021.103271
15. Zhang Z, Zhang C, Yang Z, Zhang G, Wu P, Luo Y, et al. M(6)a regulators as predictive biomarkers for chemotherapy benefit and potential therapeutic targets for overcoming chemotherapy resistance in small-cell lung cancer. J Hematol Oncol (2021) 14(1):190. doi: 10.1186/s13045-021-01173-4
16. Qu J, Wang L, Jiang M, Wei Z, Fu G, Zhang X. Survival-associated N6-adenosine methyltransferase signatures in lung squamous cell carcinoma and clinical verification. BMC Cancer (2021) 21(1):1265. doi: 10.1186/s12885-021-08939-6
17. Xu F, Huang X, Li Y, Chen Y, Lin L. M(6)a-related lncrnas are potential biomarkers for predicting prognoses and immune responses in patients with luad. Mol Ther Nucleic Acids (2021) 24:780–91. doi: 10.1016/j.omtn.2021.04.003
18. Sun J, Ping Y, Huang J, Zeng B, Ji P, Li D. N6-Methyladenosine-Regulated mrnas: Potential prognostic biomarkers for patients with lung adenocarcinoma. Front Cell Dev Biol (2021) 9:705962. doi: 10.3389/fcell.2021.705962
19. Zhao W, Zhang S, Zhu Y, Xi X, Bao P, Ma Z, et al. Postar3: An updated platform for exploring post-transcriptional regulation coordinated by rna-binding proteins. Nucleic Acids Res (2022) 50(D1):D287–D94. doi: 10.1093/nar/gkab702
20. Wu ZL, Wang MR, Liu QG, Liu YX, Zhu KJ, Chen LP, et al. Identification of gene expression profiles and immune cell infiltration signatures between low and high tumor mutation burden groups in bladder cancer. Int J Med Sci (2020) 17(1):89–96. doi: 10.7150/ijms.39056
21. Jiang P, Gu S, Pan D, Fu J, Sahu A, Hu X, et al. Signatures of T cell dysfunction and exclusion predict cancer immunotherapy response. Nat Med (2018) 24(10):1550–8. doi: 10.1038/s41591-018-0136-1
22. Liu J, Li K, Cai J, Zhang M, Zhang X, Xiong X, et al. Landscape and regulation of M(6)a and M(6)Am methylome across human and mouse tissues. Mol Cell (2020) 77(2):426–40 e6. doi: 10.1016/j.molcel.2019.09.032
23. Xiong X, Hou L, Park YP, Molinie B, Consortium GT, Gregory RI, et al. Genetic drivers of M(6)a methylation in human brain, lung, heart and muscle. Nat Genet (2021) 53(8):1156–65. doi: 10.1038/s41588-021-00890-3
24. Uddin MB, Wang Z, Yang C. The M(6)a rna methylation regulates oncogenic signaling pathways driving cell malignant transformation and carcinogenesis. Mol Cancer (2021) 20(1):61. doi: 10.1186/s12943-021-01356-0
25. Creelan BC, Wang C, Teer JK, Toloza EM, Yao J, Kim S, et al. Tumor-infiltrating lymphocyte treatment for anti-Pd-1-Resistant metastatic lung cancer: A phase 1 trial. Nat Med (2021) 27(8):1410–8. doi: 10.1038/s41591-021-01462-y
26. Costa DB. Tp53 mutations are predictive and prognostic when Co-occurring with alk rearrangements in lung cancer. Ann Oncol (2018) 29(10):2028–30. doi: 10.1093/annonc/mdy339
27. Ardeshir-Larijani F, Wildey G, Fu PF, Bhateja P, Lipka MB, Dowlati A. Association of Mll2 mutation positive non-small cell lung cancer with prognosis. J Clin Oncol (2017) 35:11598. doi: 10.1200/JCO.2017.35.15_suppl.11598
28. Hua X, Zhao W, Pesatori AC, Consonni D, Caporaso NE, Zhang T, et al. Genetic and epigenetic intratumor heterogeneity impacts prognosis of lung adenocarcinoma. Nat Commun (2020) 11(1):2459. doi: 10.1038/s41467-020-16295-5
29. Wang T, Kong S, Tao M, Ju S. The potential role of rna N6-methyladenosine in cancer progression. Mol Cancer (2020) 19(1):88. doi: 10.1186/s12943-020-01204-7
30. Wu X, Luo Y, Wang S, Li Y, Bao M, Shang Y, et al. Akap12 ameliorates liver injury Via targeting Pi3k/Akt/Pcsk6 pathway. Redox Biol (2022) 53:102328 doi: 10.1016/j.redox.2022.102328
31. Barbieri I, Tzelepis K, Pandolfini L, Shi J, Millan-Zambrano G, Robson SC, et al. Promoter-bound Mettl3 maintains myeloid leukaemia by M(6)a-dependent translation control. Nature (2017) 552(7683):126–31. doi: 10.1038/nature24678
32. Zhang Z, Luo K, Zou Z, Qiu M, Tian J, Sieh L, et al. Genetic analyses support the contribution of mrna N(6)-methyladenosine (M(6)a) modification to human disease heritability. Nat Genet (2020) 52(9):939–49. doi: 10.1038/s41588-020-0644-z
33. Zhao R, Li B, Zhang S, He Z, Pan Z, Guo Q, et al. The N(6)-Methyladenosine-Modified pseudogene Hspa7 correlates with the tumor microenvironment and predicts the response to immune checkpoint therapy in glioblastoma. Front Immunol (2021) 12:653711. doi: 10.3389/fimmu.2021.653711
34. Tan L, Cheng W, Liu F, Wang DO, Wu L, Cao N, et al. Positive natural selection of N6-methyladenosine on the rnas of processed pseudogenes. Genome Biol (2021) 22(1):180. doi: 10.1186/s13059-021-02402-2
35. Huang H, Weng H, Sun W, Qin X, Shi H, Wu H, et al. Recognition of rna N(6)-methyladenosine by Igf2bp proteins enhances mrna stability and translation. Nat Cell Biol (2018) 20(3):285–95. doi: 10.1038/s41556-018-0045-z
36. Liu N, Pan T. N6-Methyladenosine-Encoded epitranscriptomics. Nat Struct Mol Biol (2016) 23(2):98–102. doi: 10.1038/nsmb.3162
37. Liu J, Dou X, Chen C, Chen C, Liu C, Xu MM, et al. N (6)-methyladenosine of chromosome-associated regulatory rna regulates chromatin state and transcription. Science (2020) 367(6477):580–6. doi: 10.1126/science.aay6018
38. Lin Z, Lin X, Zhu L, Huang J, Huang Y. Trim2 directly deubiquitinates and stabilizes Snail1 protein, mediating proliferation and metastasis of lung adenocarcinoma. Cancer Cell Int (2020) 20:228. doi: 10.1186/s12935-020-01316-6
39. Sun Q, Ye Z, Qin Y, Fan G, Ji S, Zhuo Q, et al. Oncogenic function of Trim2 in pancreatic cancer by activating ros-related Nrf2/Itgb7/Fak axis. Oncogene (2020) 39(42):6572–88. doi: 10.1038/s41388-020-01452-3
40. Yajnik V, Paulding C, Sordella R, McClatchey AI, Saito M, Wahrer DCR, et al. Dock4, a gtpase activator, is disrupted during tumorigenesis. Cell (2003) 112(5):673–84. doi: 10.1016/S0092-8674(03)00155-7
Keywords: m6A, prognosis, signature, lung adenocarcinoma, epitranscriptomic
Citation: Chen Y, Xia L, Peng Y, Wang G, Bi L, Xiao X, Li C and Li W (2022) Development and validation of a m6A -regulated prognostic signature in lung adenocarcinoma. Front. Oncol. 12:947808. doi: 10.3389/fonc.2022.947808
Received: 14 June 2022; Accepted: 26 July 2022;
Published: 11 October 2022.
Edited by:
Deguan Lv, University of Pittsburgh Medical Center, United StatesReviewed by:
Yao Tong, The Scripps Research Institute, United StatesCopyright © 2022 Chen, Xia, Peng, Wang, Bi, Xiao, Li and Li. This is an open-access article distributed under the terms of the Creative Commons Attribution License (CC BY). The use, distribution or reproduction in other forums is permitted, provided the original author(s) and the copyright owner(s) are credited and that the original publication in this journal is cited, in accordance with accepted academic practice. No use, distribution or reproduction is permitted which does not comply with these terms.
*Correspondence: Weimin Li, d2VpbWkwMDNAc2N1LmVkdS5jbg==
Disclaimer: All claims expressed in this article are solely those of the authors and do not necessarily represent those of their affiliated organizations, or those of the publisher, the editors and the reviewers. Any product that may be evaluated in this article or claim that may be made by its manufacturer is not guaranteed or endorsed by the publisher.
Research integrity at Frontiers
Learn more about the work of our research integrity team to safeguard the quality of each article we publish.