
94% of researchers rate our articles as excellent or good
Learn more about the work of our research integrity team to safeguard the quality of each article we publish.
Find out more
ORIGINAL RESEARCH article
Front. Oncol., 02 August 2022
Sec. Cancer Imaging and Image-directed Interventions
Volume 12 - 2022 | https://doi.org/10.3389/fonc.2022.945362
This article is part of the Research TopicBig Data Analytics for Smart Healthcare applicationsView all 109 articles
 Wenle Li1†
 Genyang Jin2†Huitao Wu3
 Rilige Wu4
 Chan Xu5
 Bing Wang5Qiang Liu5Zhaohui Hu6
 Haosheng Wang7
 Shengtao Dong8
 Zhi-Ri Tang9
 Haiwen Peng10*Wei Zhao1*
 Chengliang Yin11*
Background: Currently, the clinical prediction model for patients with osteosarcoma was almost developed from single-center data, lacking external validation. Due to their low reliability and low predictive power, there were few clinical applications. Our study aimed to set up a clinical prediction model with stronger predictive ability, credibility, and clinical application value for osteosarcoma.
Methods: Clinical information related to osteosarcoma patients from 2010 to 2016 was collected in the SEER database and four different Chinese medical centers. Factors were screened using three models (full subset regression, univariate Cox, and LASSO) via minimum AIC and maximum AUC values in the SEER database. The model was selected by the strongest predictive power and visualized by three statistical methods: nomogram, web calculator, and decision tree. The model was further externally validated and evaluated for its clinical utility in data from four medical centers.
Results: Eight predicting factors, namely, age, grade, laterality, stage M, surgery, bone metastases, lung metastases, and tumor size, were selected from the model based on the minimum AIC and maximum AUC value. The internal and external validation results showed that the model possessed good consistency. ROC curves revealed good predictive ability (AUC > 0.8 in both internal and external validation). The DCA results demonstrated that the model had an excellent clinical predicted utility in 3 years and 5 years for North American and Chinese patients.
Conclusions: The clinical prediction model was built and visualized in this study, including a nomogram and a web calculator (https://dr-lee.shinyapps.io/osteosarcoma/), which indicated very good consistency, predictive power, and clinical application value.
Osteosarcoma, the most frequent primary malignancy of bone, accounting for approximately 35% of bone malignancy (1), originates from malignant mesenchymal cells (2), which produce osteoid and/or immature bone (3). Surgery combined with peri-operative chemotherapy is the current treatment while local therapy alone is insufficient (4). The presence or absence of metastases has become an important prognostic factor. Studies have shown that the 5-year survival rate for primary focus without metastases is more than 65% (5–7). Certain variables cannot explain the complicated survival rate. For diagnosis and treatment option, the American Joint Committee on Cancer (AJCC) system (8) and Enneking system (9) are popular. Factors of these systems can imply survival duration with treatment option roughly, but it is limited. A prediction model for survival is urgent for further prognosis prediction and instructive therapy selection (10, 11).
Osteosarcoma incidence remains low relative to other tumors (12). Therefore, a sufficient number of subjects are quite challenging. The Surveillance, Epidemiology, and End Results (SEER) database is an authoritative cancer statistics database in the United States that records morbidity, mortality, and incidence information for millions of patients with malignancies. Currently, although there have been relevant studies on osteosarcoma based on the SEER database, these prediction models showed a lower power (almost AUC < 0.8) or have no external data validation (13–15).
In this study, we built models based on osteosarcoma patients’ data in the SEER database using three models, and the apt model was visualized. The validation data set from four different regional medical centers in China presented great power and credibility of the apt model. The nomogram and the web calculator were visualized, possessing good consistency and clinical application value.
SEER*STAT (version 8.3.5) software was used to extract data including patient demographic characteristics, clinicopathological treatment, and patient treatment (surgery, radiotherapy, and chemotherapy) information.
SEER data inclusion criteria were as follows: (1) primary malignant tumor of osteosarcoma with International Classification of Diseases of Oncology ICD-O codes 9180, 9181, 9182, 9183, 9184, 9185, 9186, 9187, 9192, 9193, 9194, and 9200; (2) SEER database after 2010 incorporated relevant metastatic site information and included patients diagnosed between 2010 and 2016; (3) osteosarcoma was the first and only primary malignancy; (4) complete clinical information, including age at diagnosis, sex, race, primary site, tumor size, tumor stage and grade, metastatic site, surgery, and whether radiotherapy and chemotherapy were administered; (5) diagnosis was from surviving patients and did not include cadavers; (6) complete follow-up information was available; and (7) known cause of death and survival time after diagnosis.
The multicenter data were obtained from four medical institutions in China: the Second Affiliated Hospital of Jilin University, the Second Affiliated Hospital of Dalian Medical University, Liuzhou People’s Hospital, and Xianyang Central Hospital. The follow-up period was more than 3 years. Three investigators were responsible for data acquisition at each institution during the survey period. Tumor size and stage were provided by the surgeon, and pathological grading was diagnosed by a senior pathologist at each hospital, or in case of uncertainty, confirmed by a pathologist at the Second Affiliated Hospital of Jilin University. Data were extracted by two of the three investigators, and data check was performed by the third one. All data were checked for consistency and date was sorted using Microsoft Excel (Microsoft Excel, 2013, Redmond, USA).
Exclusion criteria were as follows: (1) incomplete clinicopathological and survival information; (2) unknown tumor size, stage, and race; and (3) vacant data.
Considering the characteristics of the SEER database and the multicenter study, we tried to unify the data standard. Three categories of race in SEER data were white, black, and other without specific subdivisions, while the race of real multicenter data from China was classified to “other”. Treatment modality included surgery, chemotherapy, and radiotherapy, but the SEER database did not record treatment details; thus, it could only be classified as No (treatment) or Yes (treatment). Some patients were coded “999” on tumor size in the SEER database, which meant that their tumor size could not be assessed. To minimize data bias, we used x-tile to find the cutoff value of the data that can assess the tumor size, converting the tumor size from a continuous variable to a categorical variable.
Baseline tables were drawn for the modeling and validation group data, independent samples t-tests were used for continuous variables, and chi-square tests were used for categorical variables. Heat maps were plotted to show the frequencies and correlations between the parameters.
Three methods were used to screen variables in this study: (1) univariate Cox with p < 0.05 as a cutoff for screening variables and forest plot; (2) full subset regression to adjust for R² maxima to determine the best combination of variables; and (3) the LASSO regression and cross-validation to determine the combination of variables by the λ value while the mean squared error (MSE) was minimal.
The variables of the three methods were screened by using stepwise backward regression to achieve the minimum value of Akaike’s Information Criterion (AIC). The models constructed by the three methods were compared by receiver operating characteristic (ROC) curves, and that with the largest area under the curve (AUC) was selected as the final model.
In the prognostic analysis, Kaplan–Meier was used to estimate survival curves for each variable, and a log-rank test was used to determine the significant difference. Multivariate Cox regression analysis was used, and forest plots were drawn.
A nomogram was constructed using the parameters screened from the multivariate Cox results. For application convenience, a user-friendly web calculator was provided. Meanwhile, we built the decision tree.
The actual and predicted probabilities were compared using calibration curves for the training and validation sets to evaluate the model consistency. The ROC of the validation set was plotted, and AUC was calculated to evaluate the prediction accuracy of the prediction model. Decision curve analysis (DCA) was used to evaluate the clinical application value.
Cutoff values were obtained by x-title software. Statistical methods and plotting, including t-test, chi-square test, LASSO, full subset regression, heat map, Kaplan–Meier, forest plot, nomogram, ROC curve, calibration plot, and DCA curve, were performed by R version 4.0.5. p < 0.05 was considered statistical significance.
In Figure 1, the x-tile software calculated the optimal division of tumor size into the following groups: less than or equal to 95 mm, 95–127 mm, and more than 127 mm. Therefore, the continuous variable in tumor size was transformed into categorical variables in the three groups of ≤95, 95–127, and >127. Other patients coded “999” on tumor size were allocated to “Unable to evaluate”.
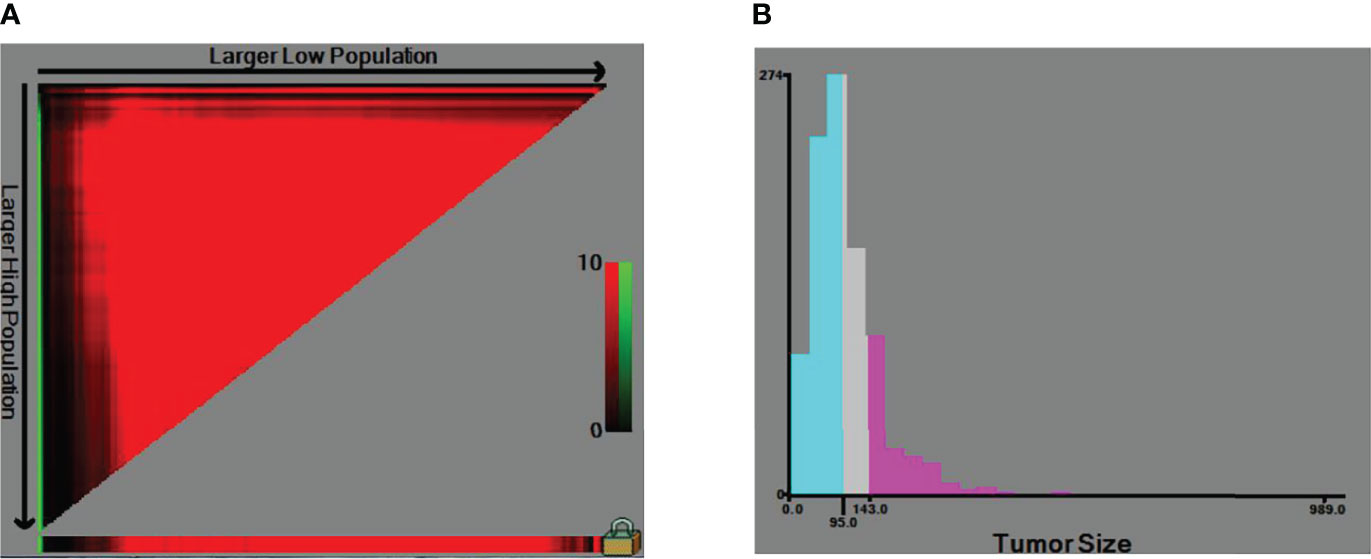
Figure 1 The cut-off of tumor size. (A) The x-tile software calculated the optimal division of tumor size. (B) Categorical variables.
Based on the SEER database, information was collected on all patients with osteosarcoma between 2010 and 2016, and according to inclusion and exclusion criteria, 1,144 patients were finally included, while a total of 112 patients were included in the Chinese multicenter data. Flowchart of data collection and analysis was shown in Figure S1.
Table 1 showed the demographic, clinicopathological, and treatment data characteristics of the SEER database versus the Chinese multicenter. Among the statistically significant differences between the two cohorts were race and chemotherapy. In the SEER data, Caucasians predominated, followed by blacks and other ethnicities. The multicenter data had a only Chinese population and a higher proportion of chemotherapy for osteosarcoma in China. No significant differences existed regarding other characteristics between the two groups (Table 1).
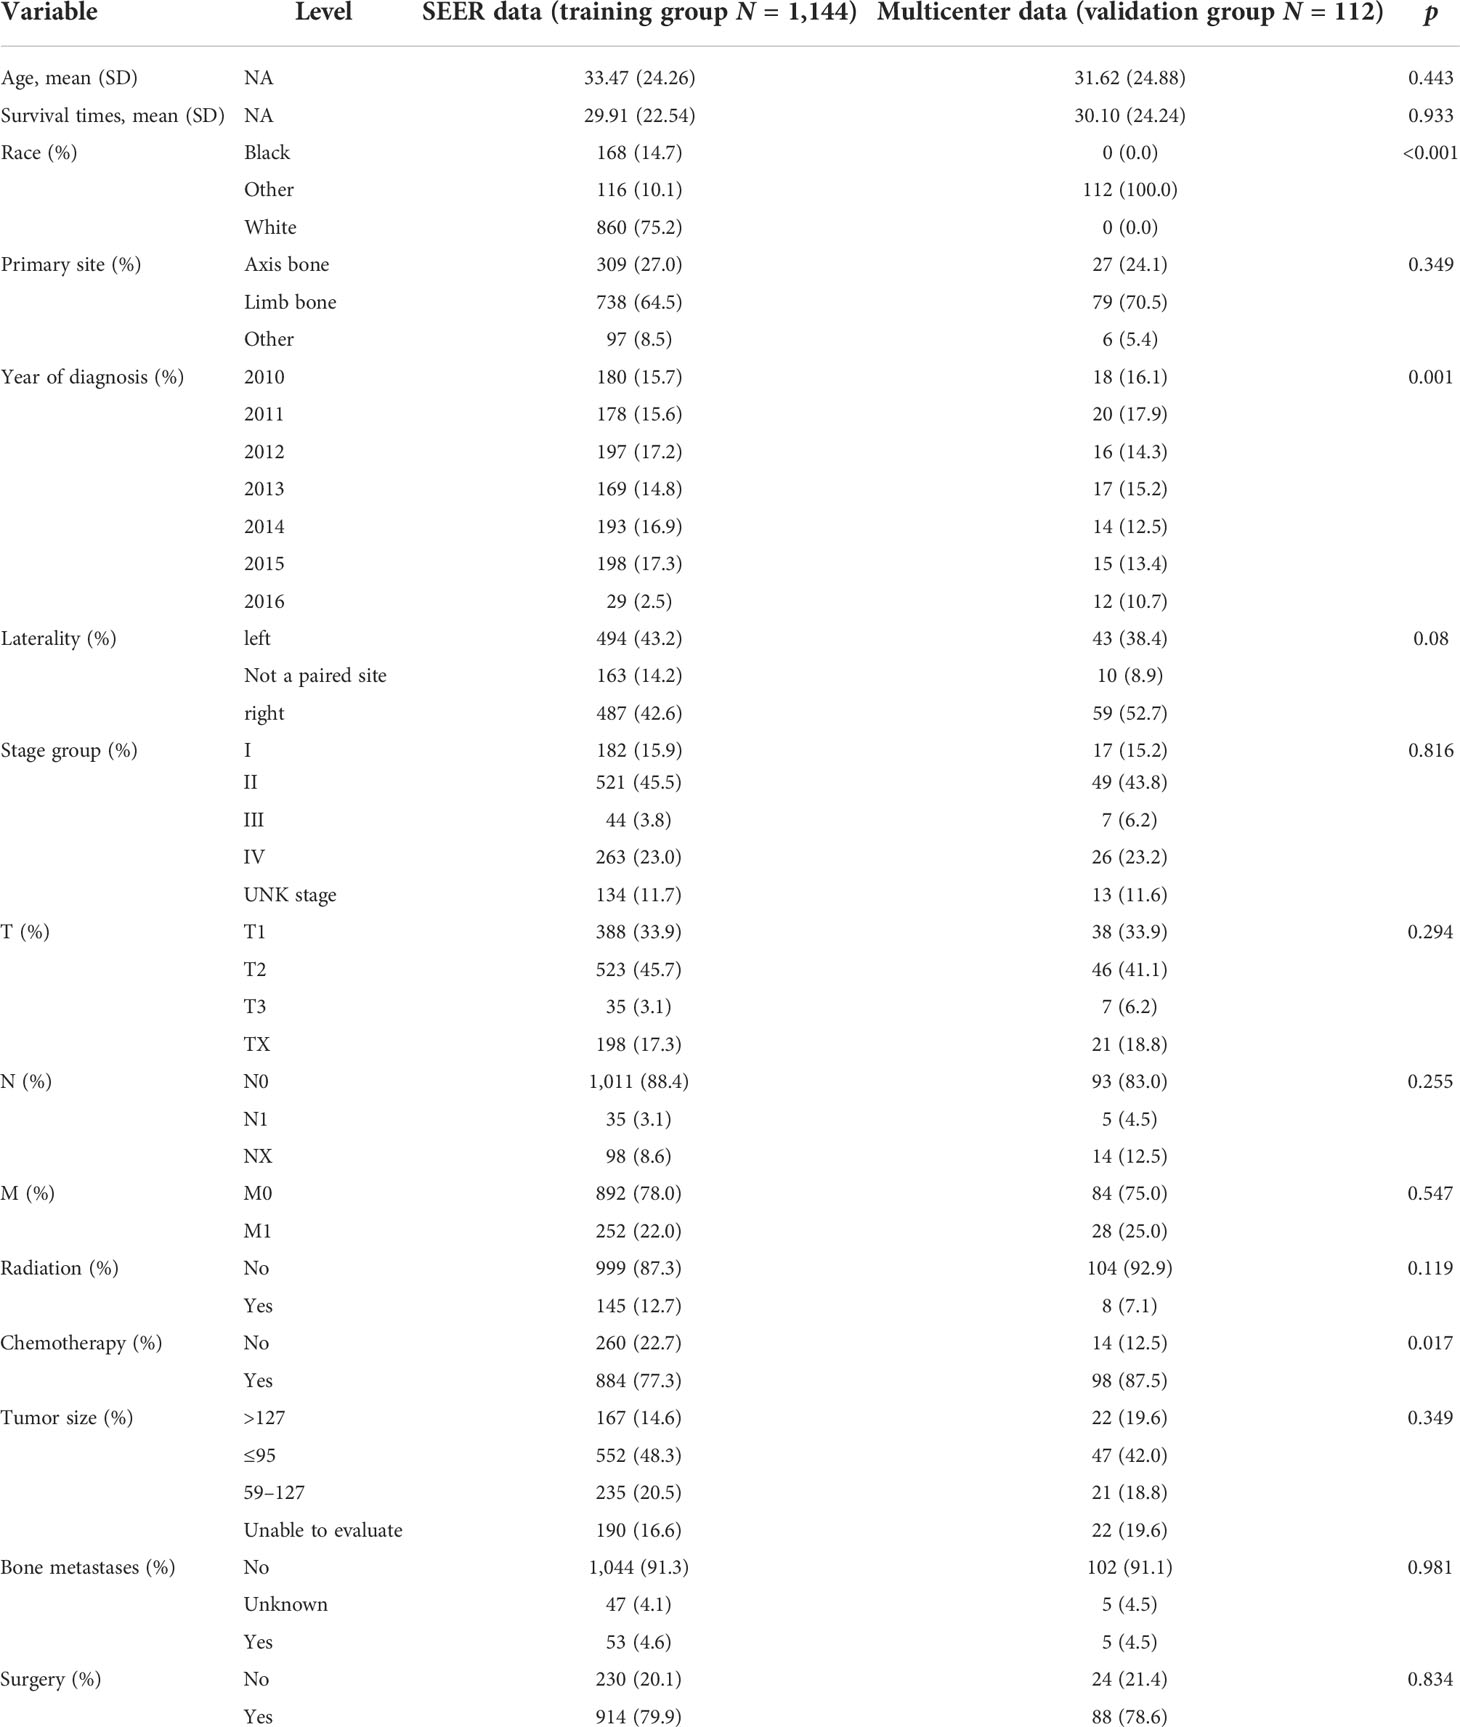
Table 1 Baseline data table of the training group and the validation group.
The heat map in Figure 2A showed the correlation between each parameter, and that in Figure 2B showed the frequency in each parameter. In Figure 2A, we could find moderate correlations for tumor size with T and stage group, race with category, and bone metastasis versus lung metastasis. In Figure 2B, the frequencies of each parameter were shown, and the data distribution could be observed visually from the colors (Figure 2).
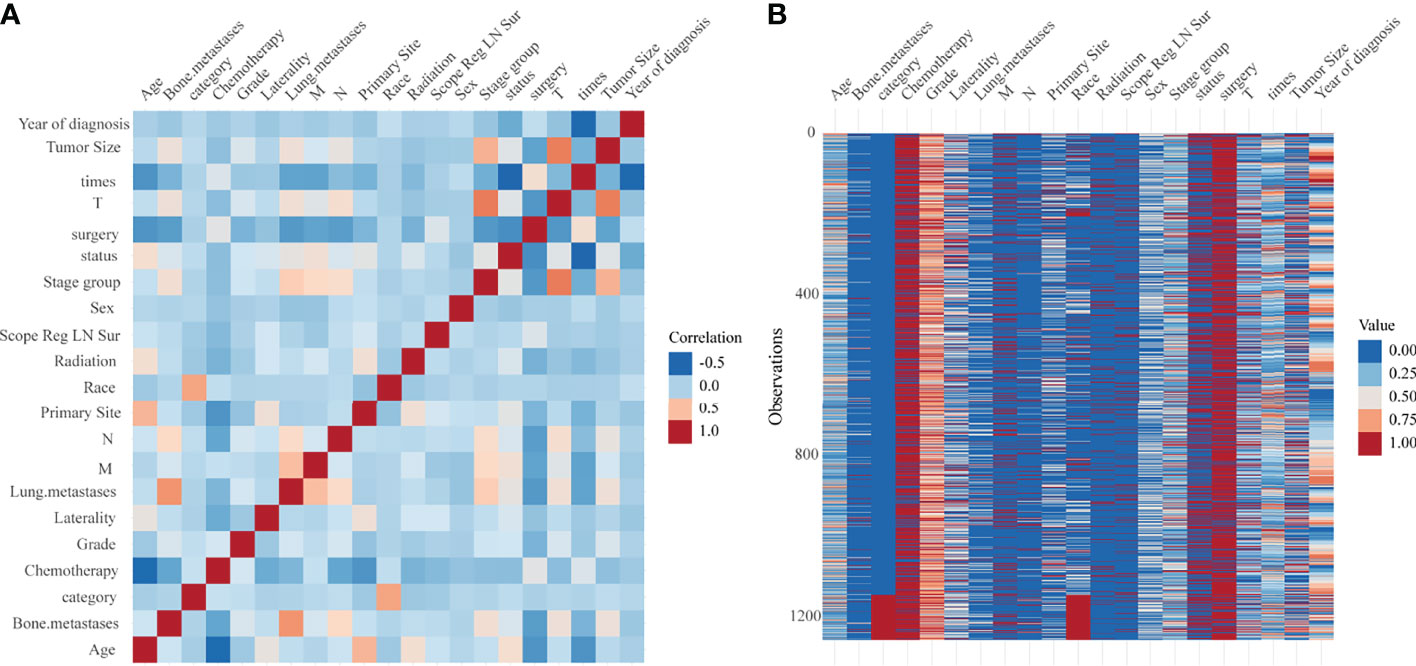
Figure 2 (A) Heat map of the correlation between each factor. (B) Heat map of the frequency in each factor.
According to the results of the univariate Cox regression, the forest plot was drawn (Figure 3). According to the results of the univariate Cox regression forest plot, 14 variables (p < 0.5) were screened by univariate Cox regression, namely, age, primary site, grade, laterality, stage group, T stage, N stage, M stage, surgery, radiation, chemotherapy, bone metastases, lung metastases, and tumor size.
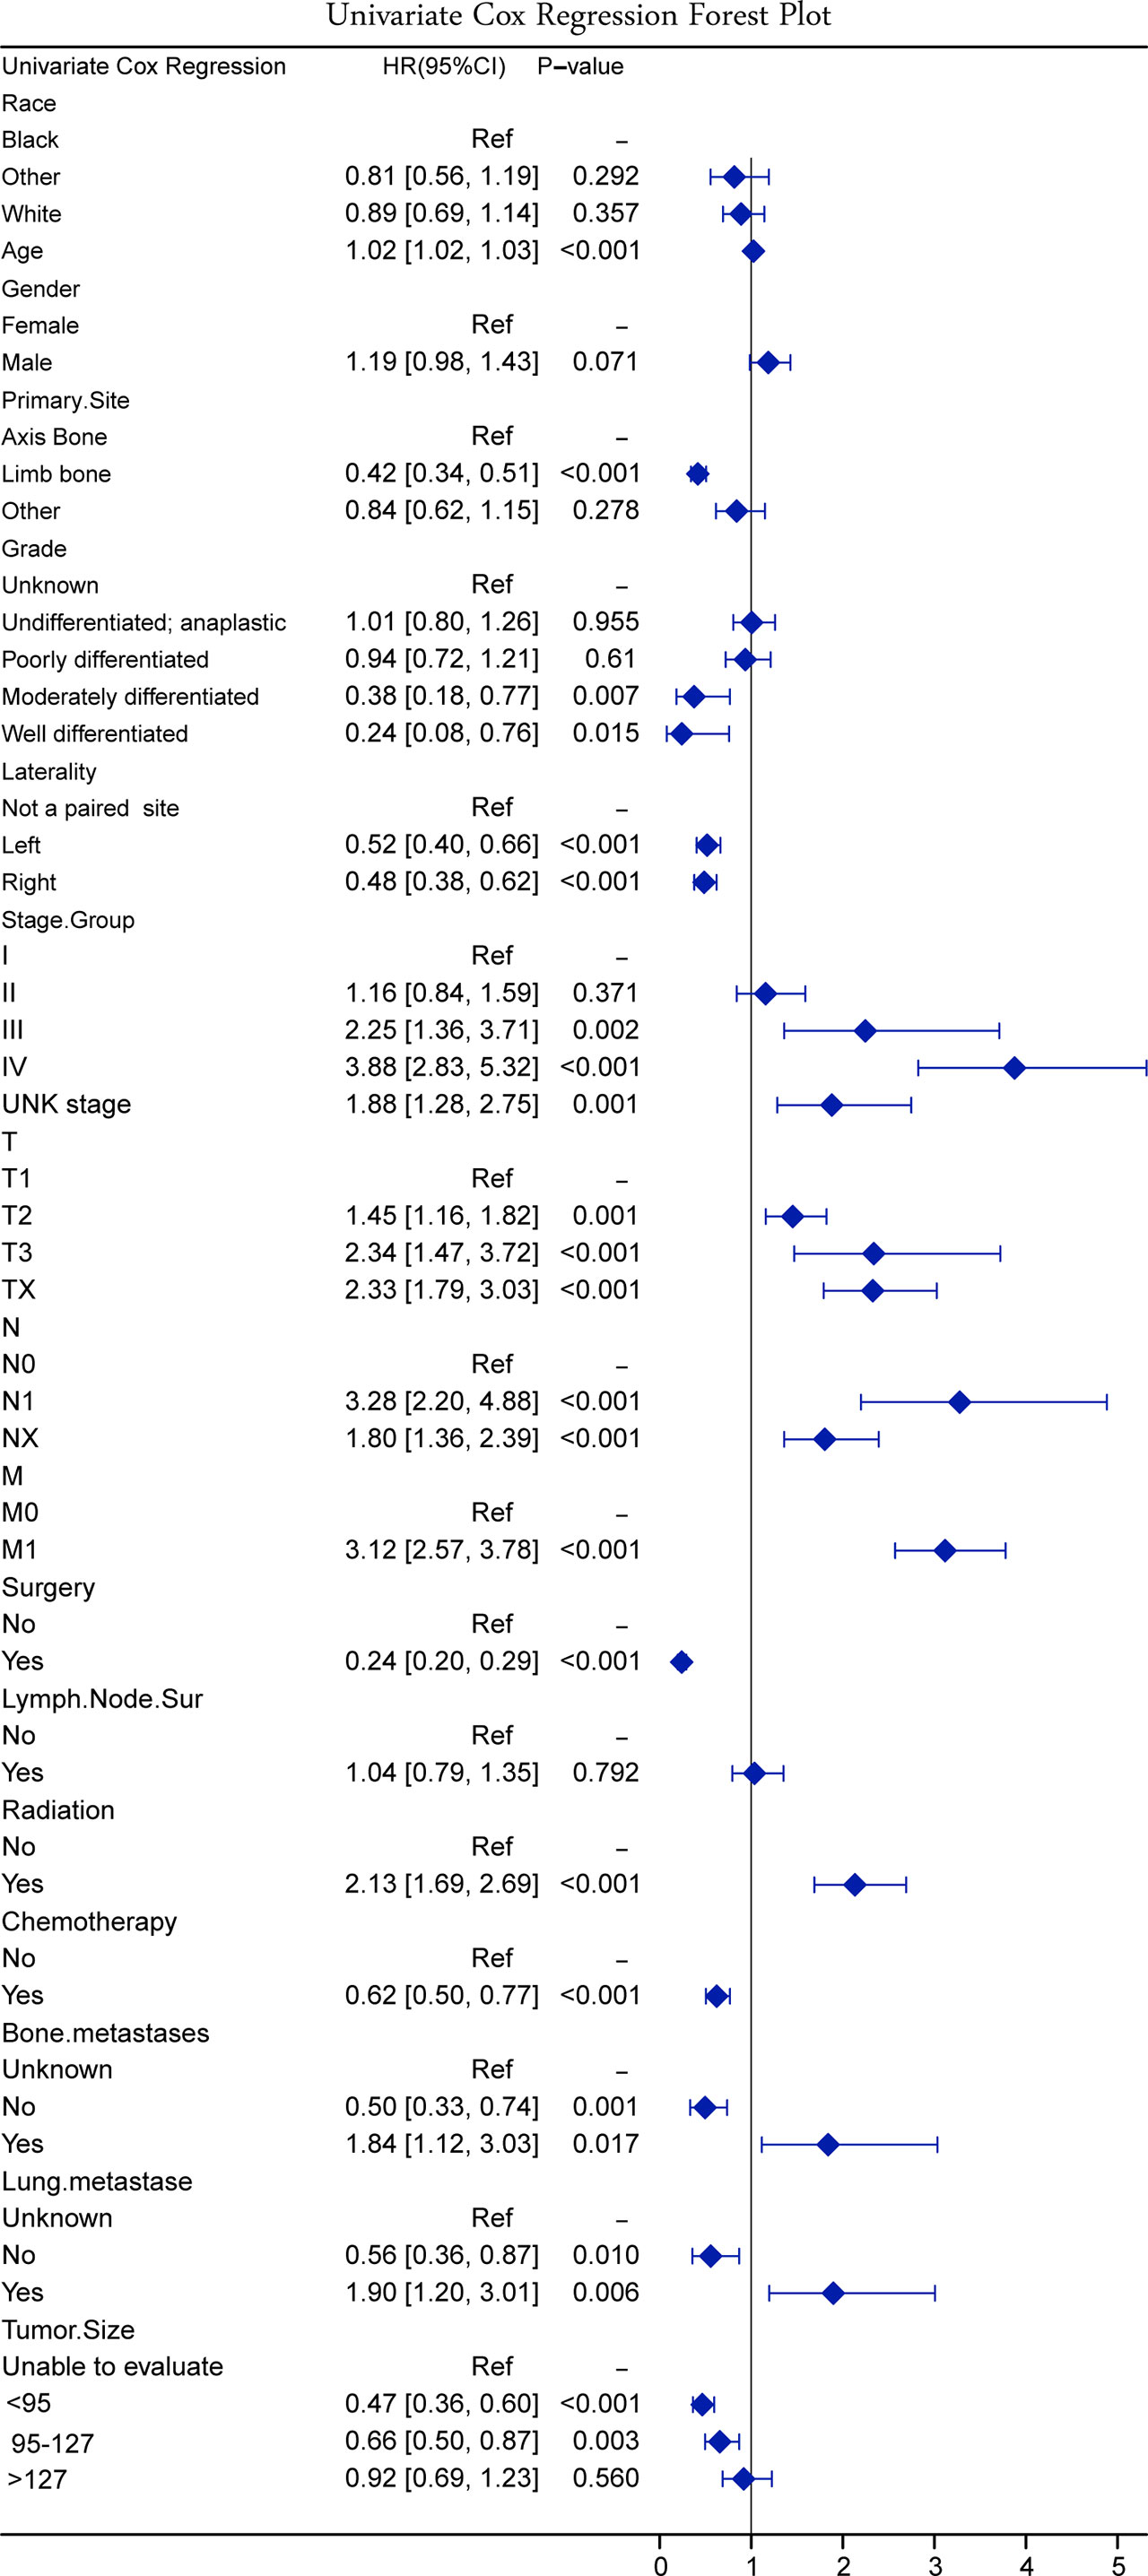
Figure 3 Forest plot on univariate Cox regression.
The full subset regression was performed using the R packages’ (leaps) regsubsets function to find the best combination according to the optimal subset regression model evaluation criteria, through adjusting the Marlowe’s CP value to minimum, R2 value to maximum, and Bayesian information criterion to minimum. The combination of variables was determined with the adjustment R2 as criterion. Optimal full subset regression selected eight variables (age, grade, laterality, stage group, M stage, surgery, chemotherapy, and tumor size) (Figure 4).
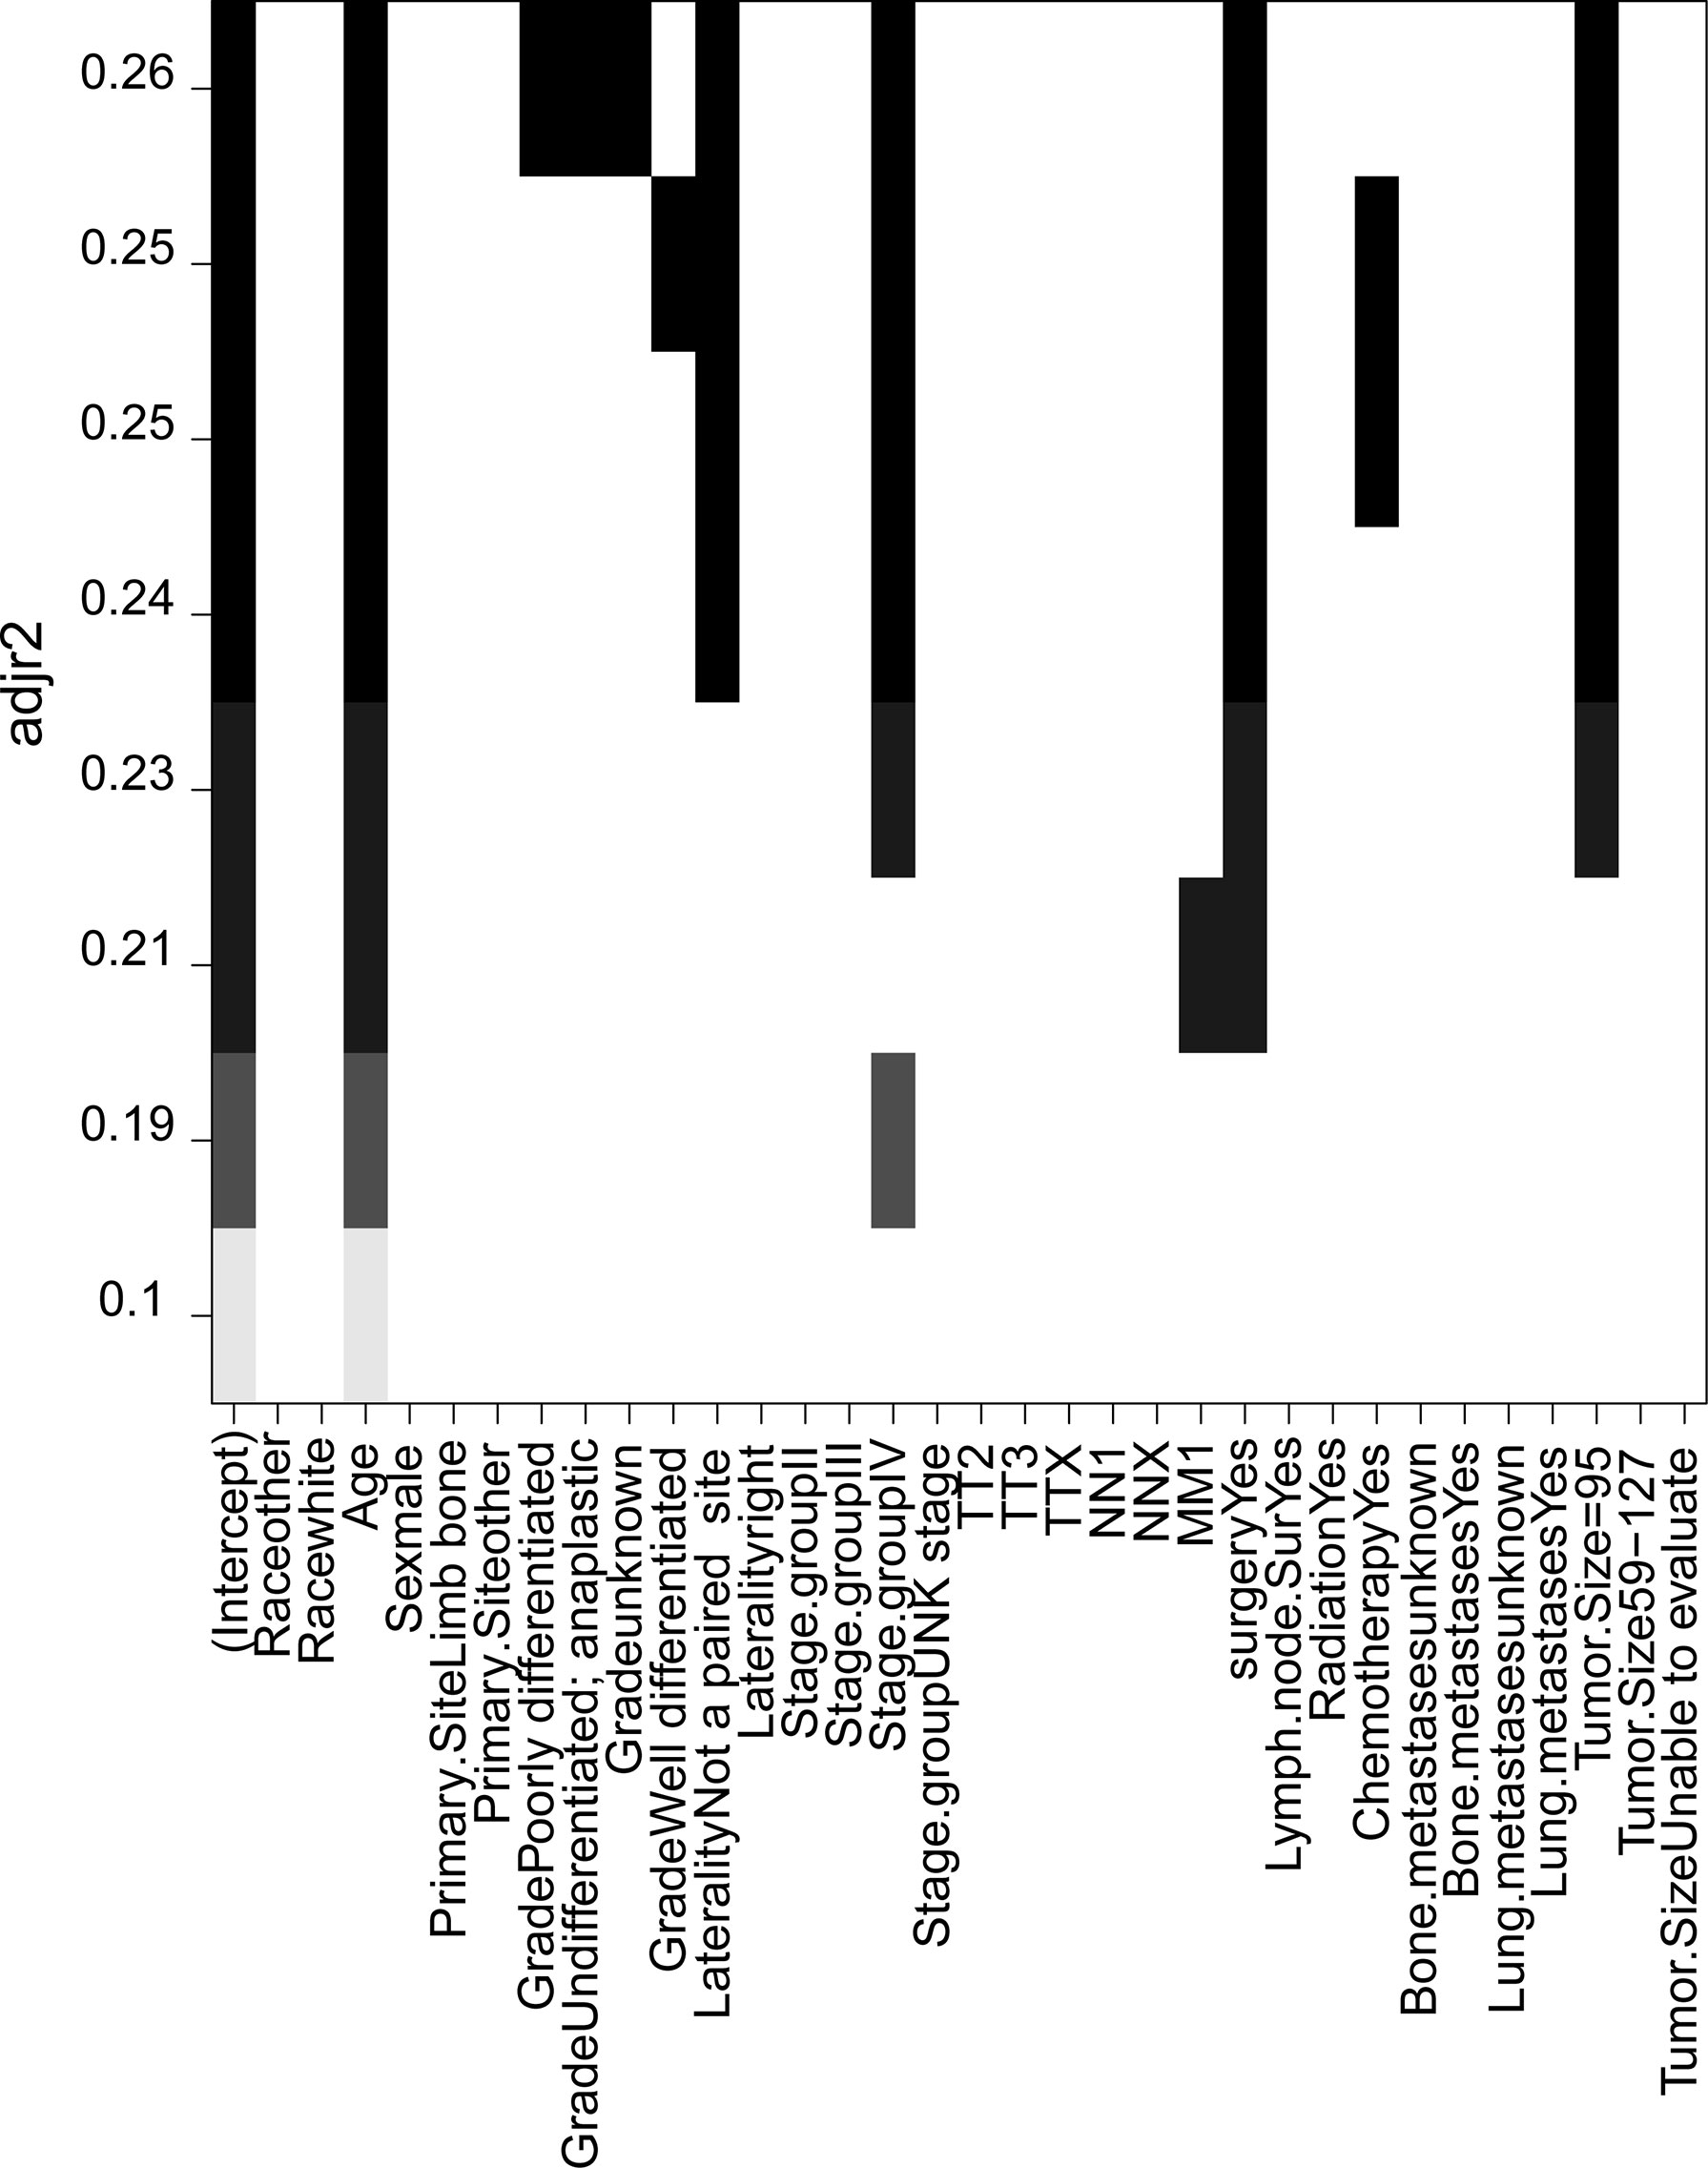
Figure 4 The combination of variables were determined with the adjustment R² as criterion in the full subset regression.
LASSO introduced the variable λ to find the most appropriate model. As λ increased, the regression coefficient β of each variable decreased, and some became zero, indicating that the variable contributed little to the model and could be eliminated. λ value determined which variables optimized the model, and the best λ value could be found using cross-validation (Figure 5A).
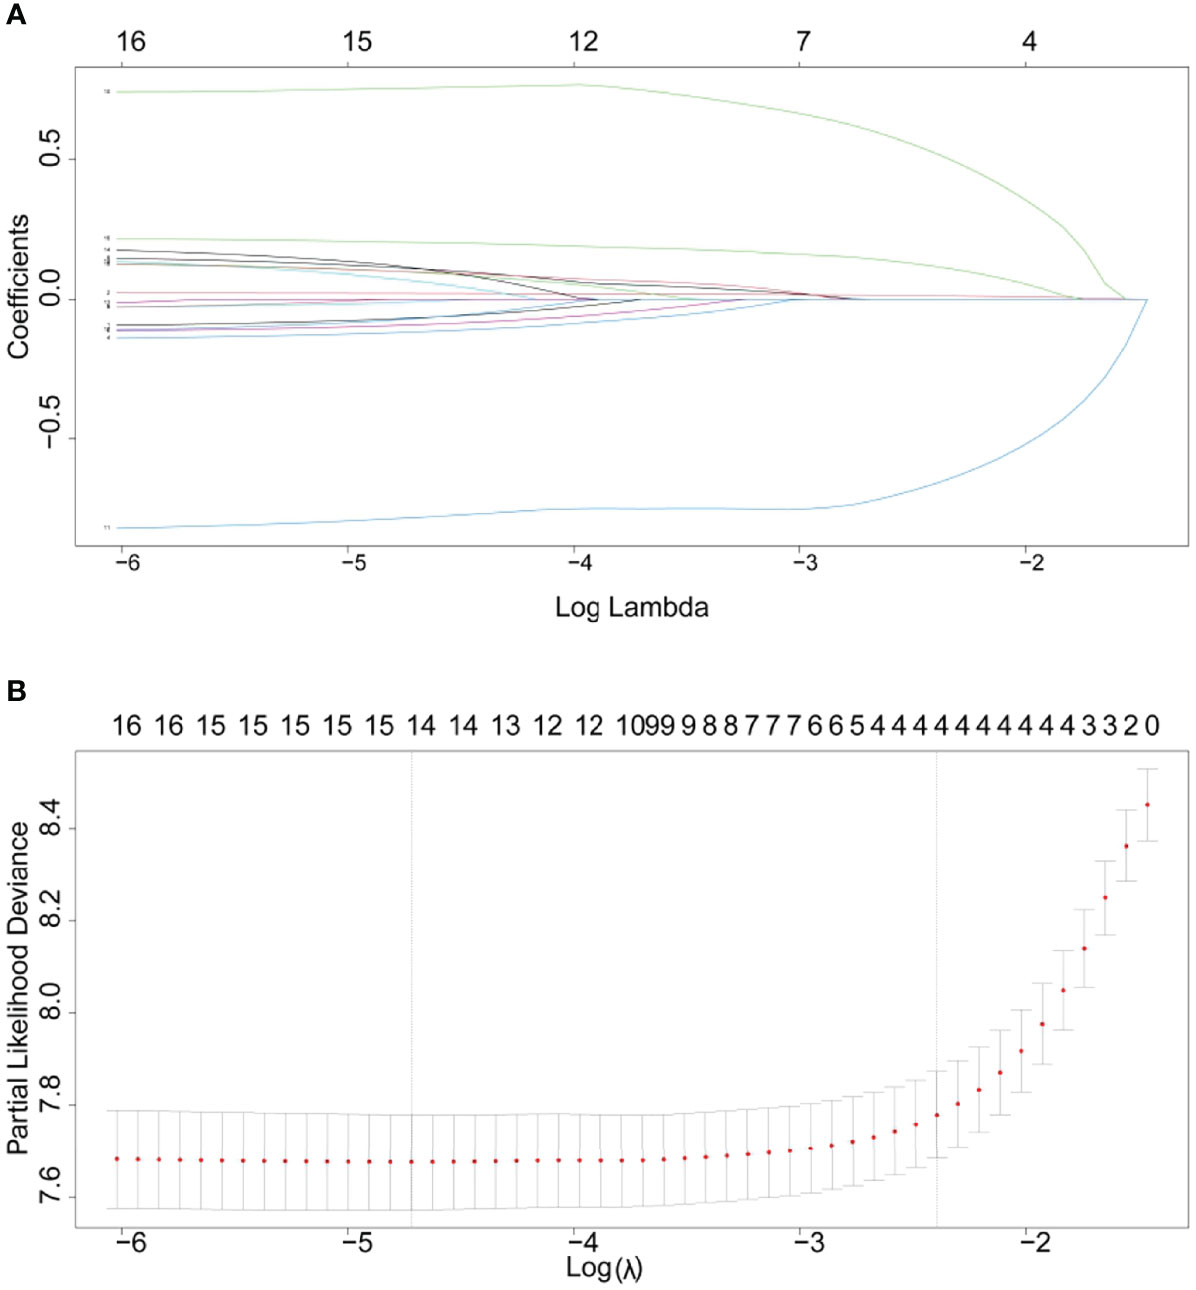
Figure 5 (A) LASSO coefficient profile. (B) Cross-validation for tuning parameter selection in the LASSO model.
Figure 5B showed the Partial-likelihood deviance curve with Log(λ). The value (λ.min and λ.1se) was used to choose the good performance model in a minimum number of independent variables. Four combinations of variables (age, M, surgery, and lung metastases) were chosen via the LASSO regression.
A total of 14 variables were screened by univariate Cox regression. Based on adjusted R² maxima, eight variables (age, grade, laterality, stage group, stage M, surgery, chemotherapy, and tumor size) were screened by optimal subset regression (OSR). LASSO regression and cross-validation using a tuning factor (λ.1se) built an excellent model with a minimum number of four independent variables (age, M stage, surgery, and lung metastases).
The combinations of variables screened by each of the three methods were analyzed in a multivariate Cox model, and the final models of the three methods were determined using stepwise backward regression with minimum AIC values. After stepwise backward regression, eight variables were included in the univariate Cox (age, grade, laterality, M, surgery, bone metastases, lung metastases, and tumor size). Six variables were included in the optimal subset regression (age, grade, laterality, M stage, surgery, and tumor size). Four variables were included in LASSO regression (age, M stage, surgery, and lung metastases).
The AIC of the three models were 5,552.849 in univariate Cox, 5,570.204 in OSR and 5,611.193 in LASSO regression. ROC curves in three models were drawn at 1-year, 3-year, and 5-year survival. The models were evaluated by AUC values (Figure 6). The model constructed by univariate Cox was optimal with the largest AUC and the smallest AIC.
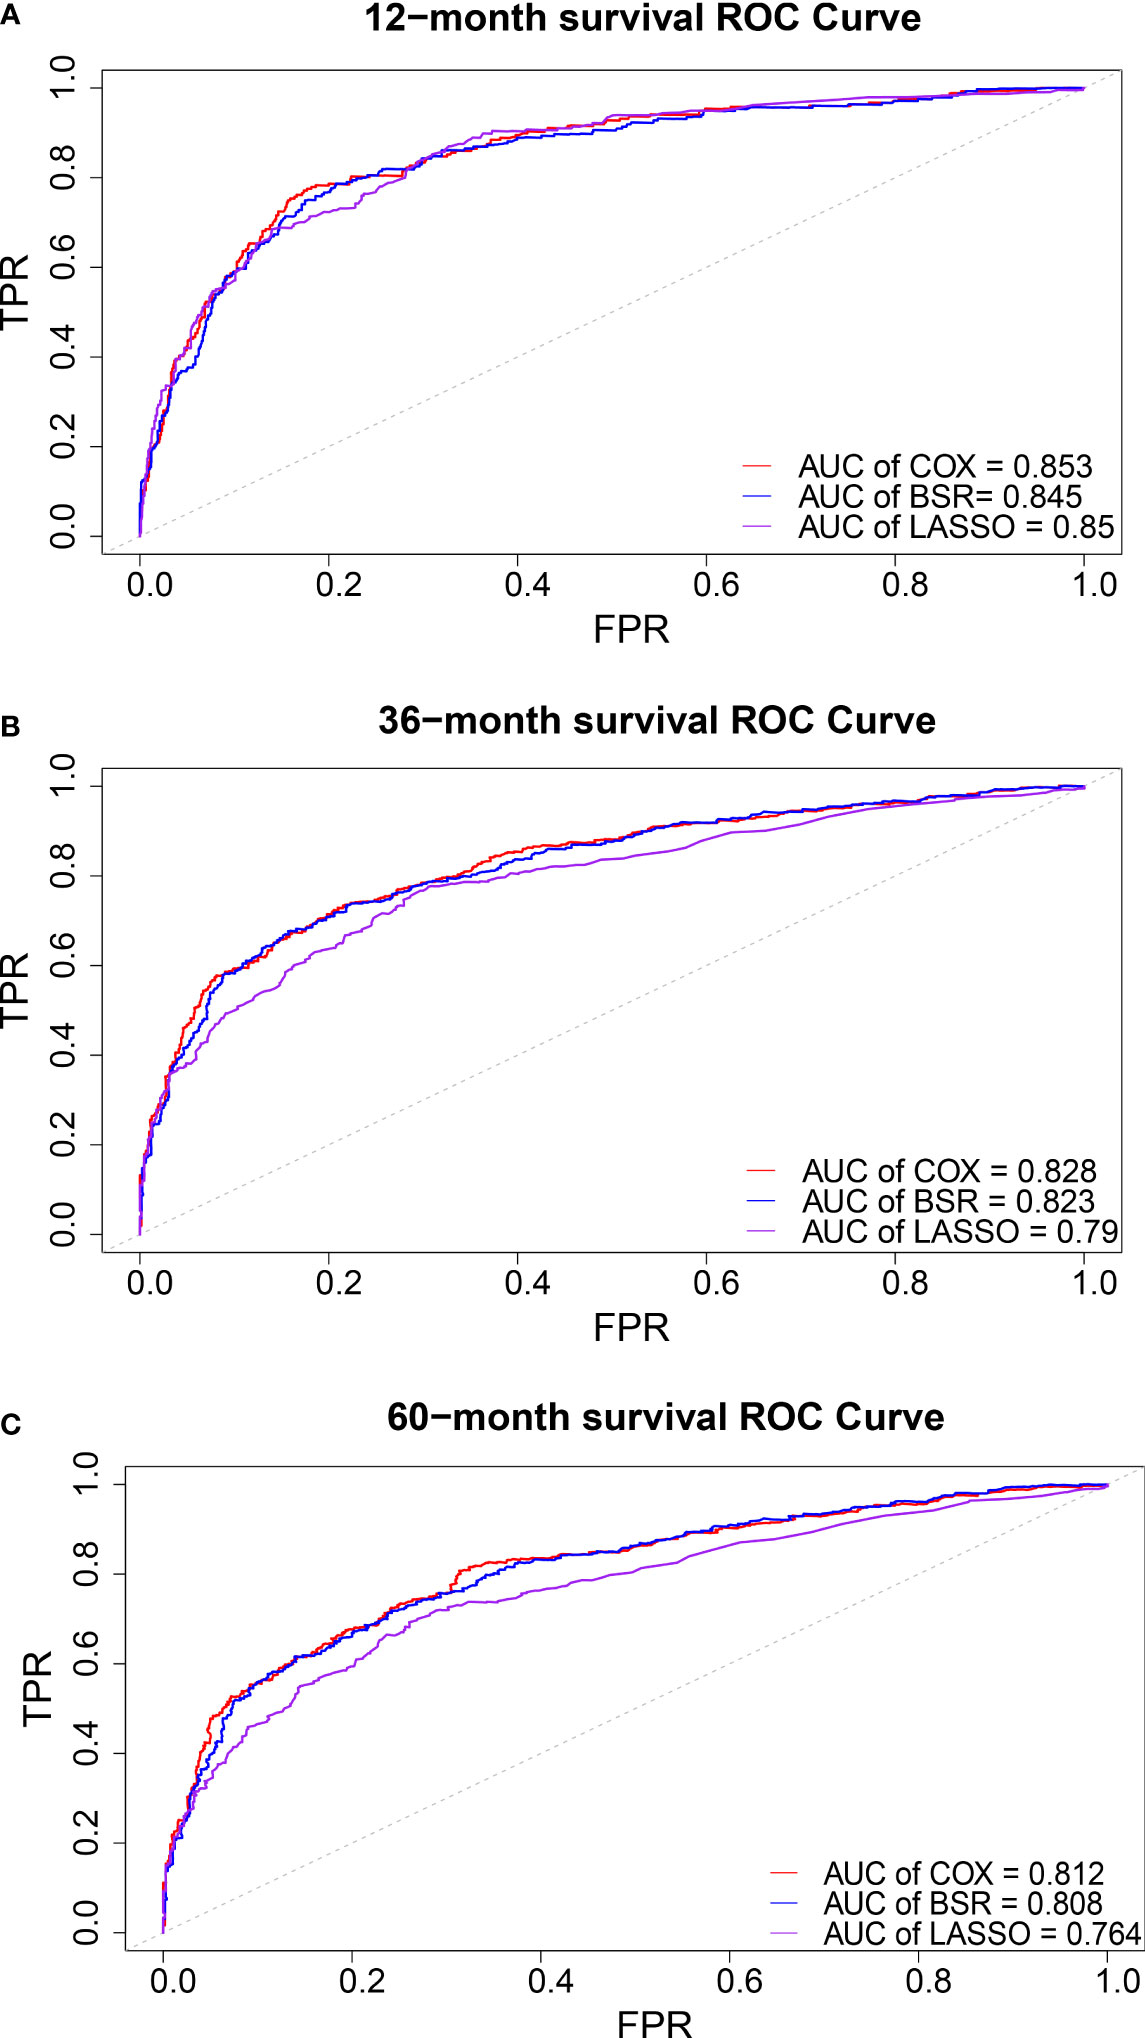
Figure 6 ROC cure in 1-(A), 3-(B), and 5- (C) years overall survival.
The multivariate Cox forest plot showed that eight univariate Cox parameters were independent risk factors (p < 0.05, Figure 7).
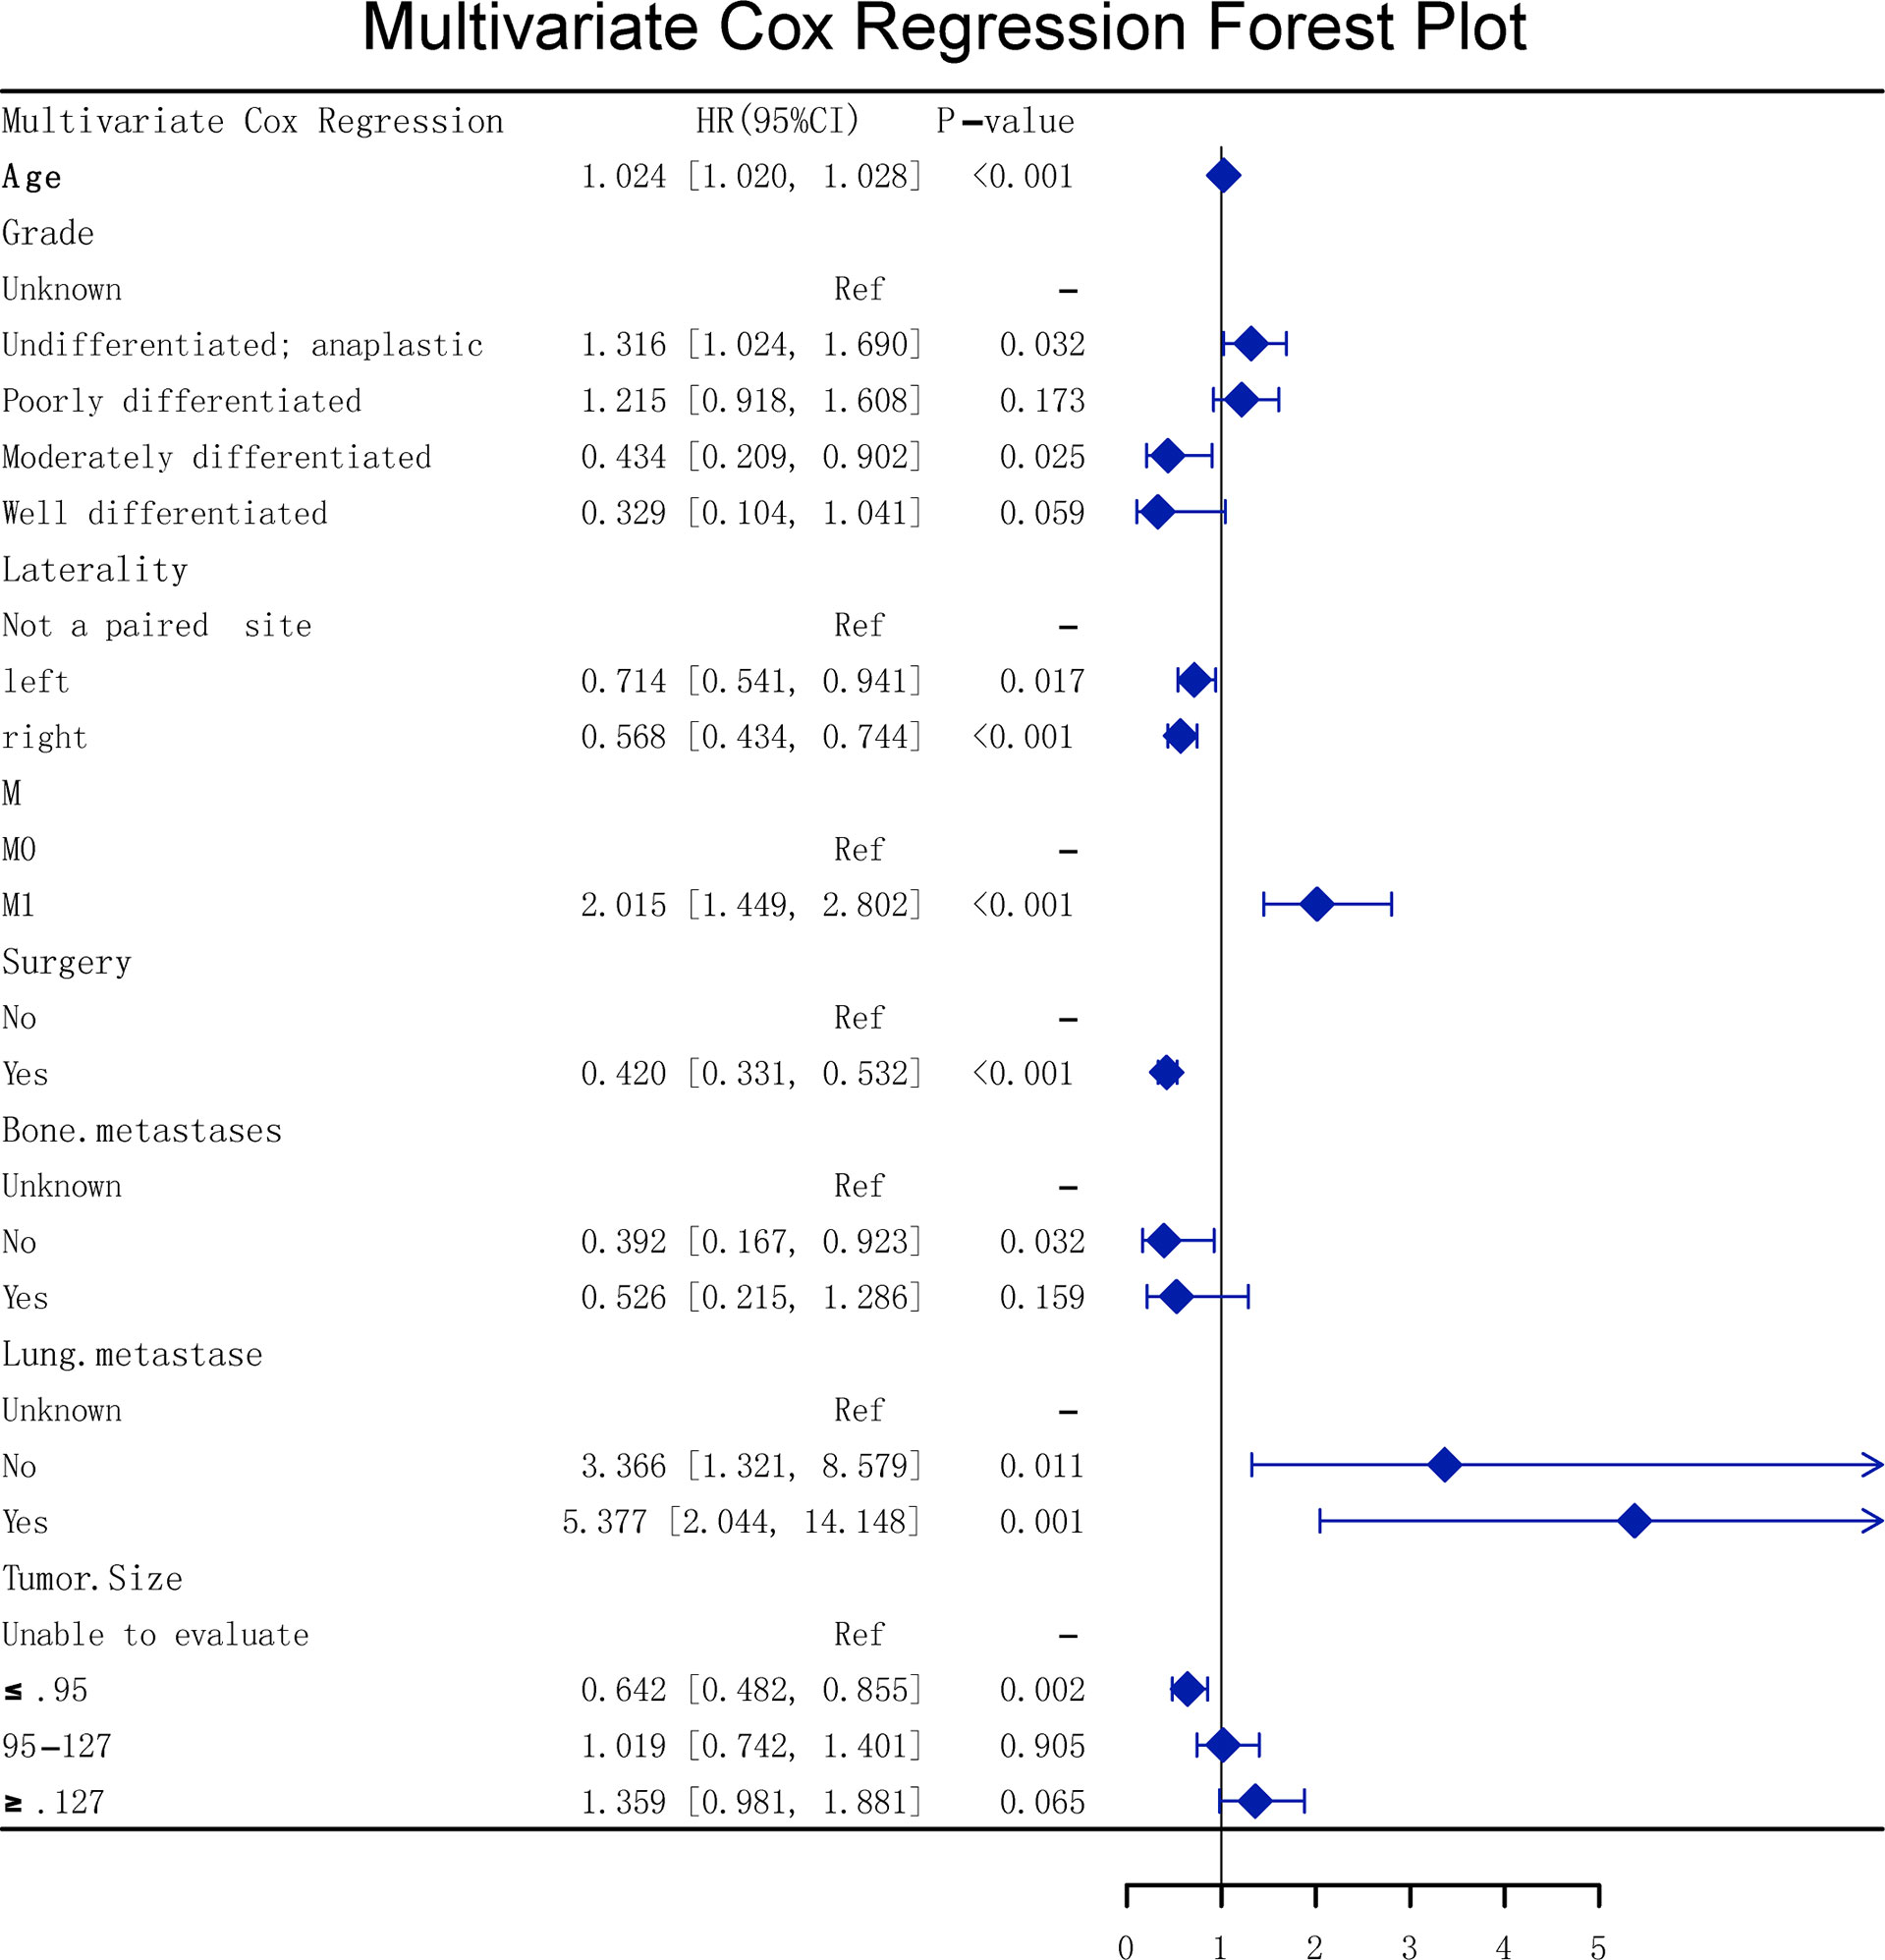
Figure 7 Multivariate Cox forest plot.
Kaplan–Meier survival curves revealed that there was no significant difference in patient survival between the SEER data and the real Chinese multicenter data (p > 0.05, Figure 8A). Kaplan–Meier survival curves about all patients are presented in Figure 8B. Bone metastases were at higher risk than no bone metastases (p < 0.05, Figure 8C). Well-differentiated grade patients held longer survival (p > 0.05, Figure 8D). Kaplan–Meier survival curves almost overlapped in left and right laterality, showing no difference (p > 0.05, Figure 8E). Lung metastases were at higher risk than no bone metastases (p < 0.05, Figure 8F). M1 showed a lower survival rate than M0 (p < 0.05, Figure 8G). Patients with surgery showed higher survival rate than no surgery (p < 0.05, Figure 8H). The larger the tumor size of patients was, the shorter was their survival (p < 0.05, Figure 8I). The consistent results were proved in the validation cohort (Figure S2).
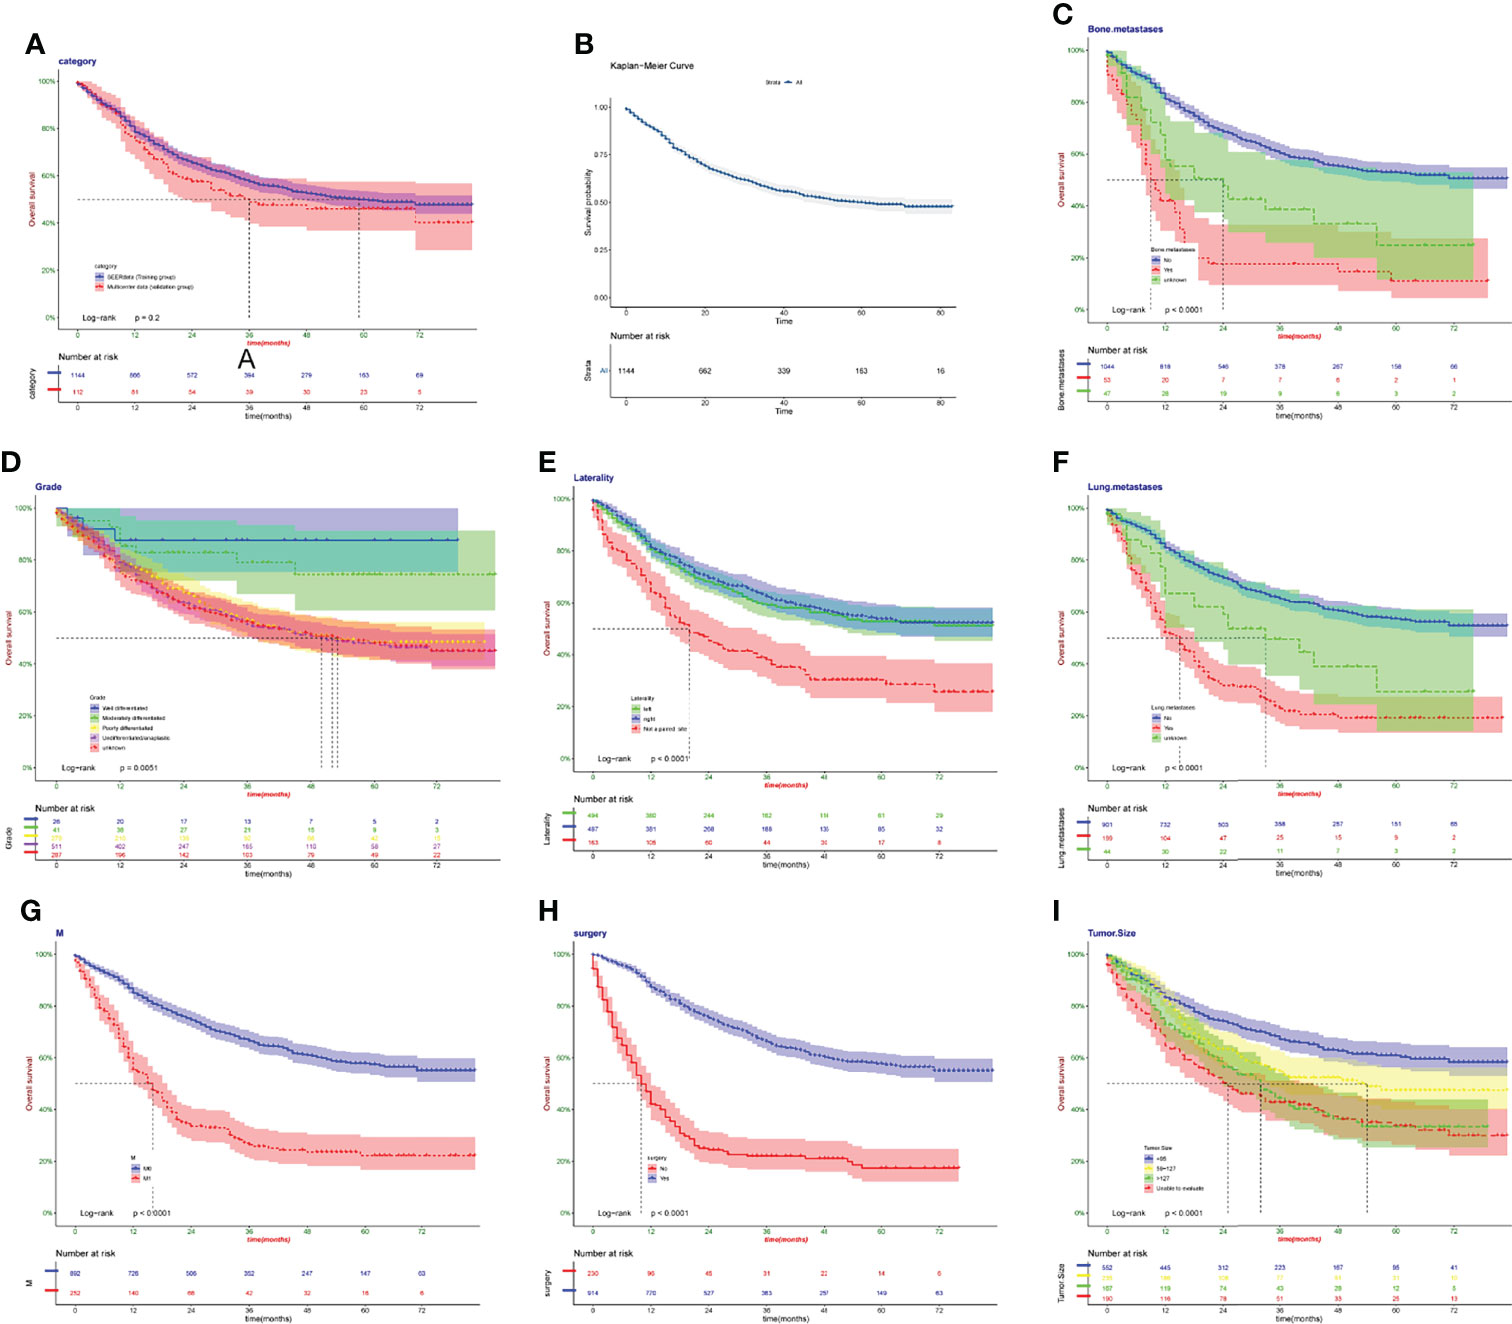
Figure 8 Kaplan–Meier survival curves in the training cohort. (A) The SEER data and the real Chinese multicenter data. (B) Patients in SEER data. (C) Bone metastases. (D) Grade. (E) Laterality. (F) Lung metastases. (G) M. (H) Surgery. (I) Tumor size.
A nomogram is a method that allows quantification and visualization of Cox regression (16). The nomogram is evaluated by two methods: (1) Each variable is listed, and each sub-variable is quantified into a specific score. The cumulative scores of all variables are matched to the outcome scale to obtain predicted probabilities. (2) Web calculators or dynamic line graphs are developed to input specific variables and calculate the probability of an event. In this study, we constructed the nomogram using multivariate Cox variables (Figure 9A). Moreover, an online web calculator (https://dr-lee.shinyapps.io/osteosarcoma//) was designed to facilitate the user. A decision tree model was also provided as a supplement for the prediction model (Figure 9B).
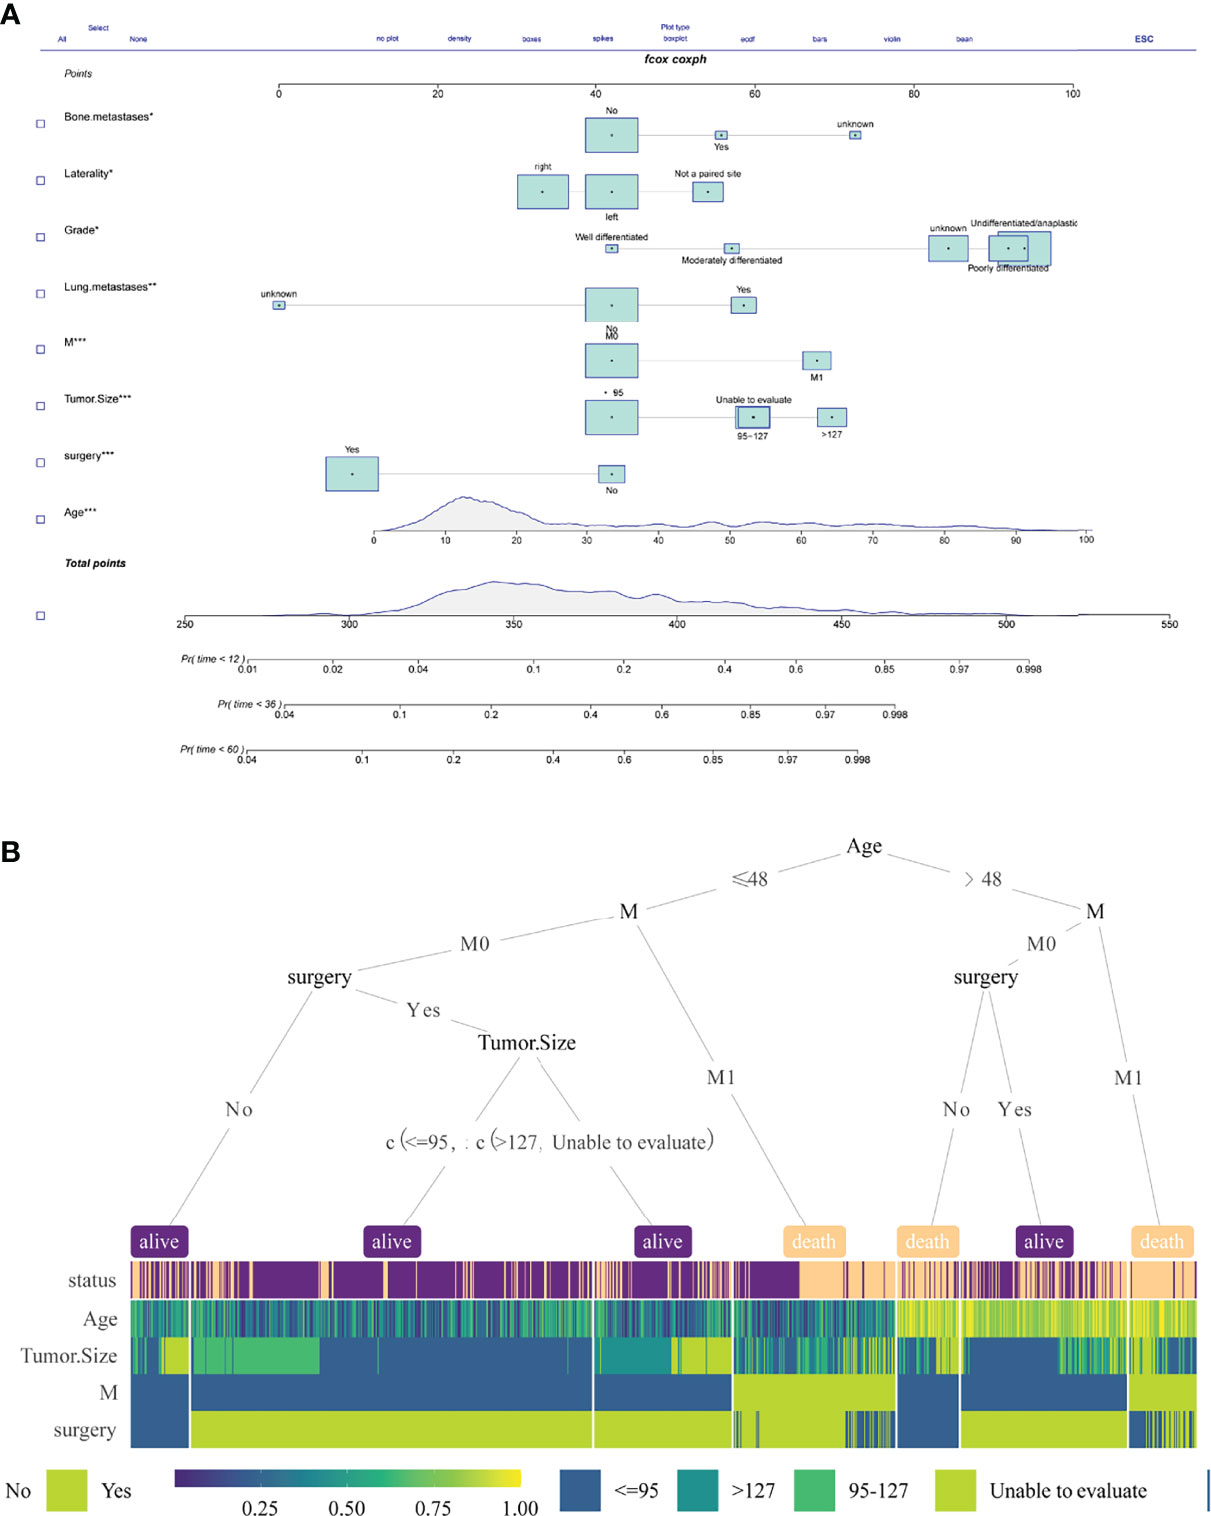
Figure 9 (A) A nomogram was constructed using multivariate Cox variables. (B) The decision tree of multivariate Cox variables.
The calibration chart was an assessment of how close the estimated risk of the line plot was to the actual risk. SEER data were applied for internal validation, and multicenter data were applied for external validation. The internal validation results (Figures 10A–C) and external validation results (Figures 10D–F) showed that the predicting outcomes were consistent with the actual outcome and the prediction model was well preformed in 1, 3, and 5 years. The ROC curves of the model were plotted in multicenter data. It proved the excellent predictive ability in 1, 3, and 5 years (AUC > 0.8, respectively) in Figure S3.
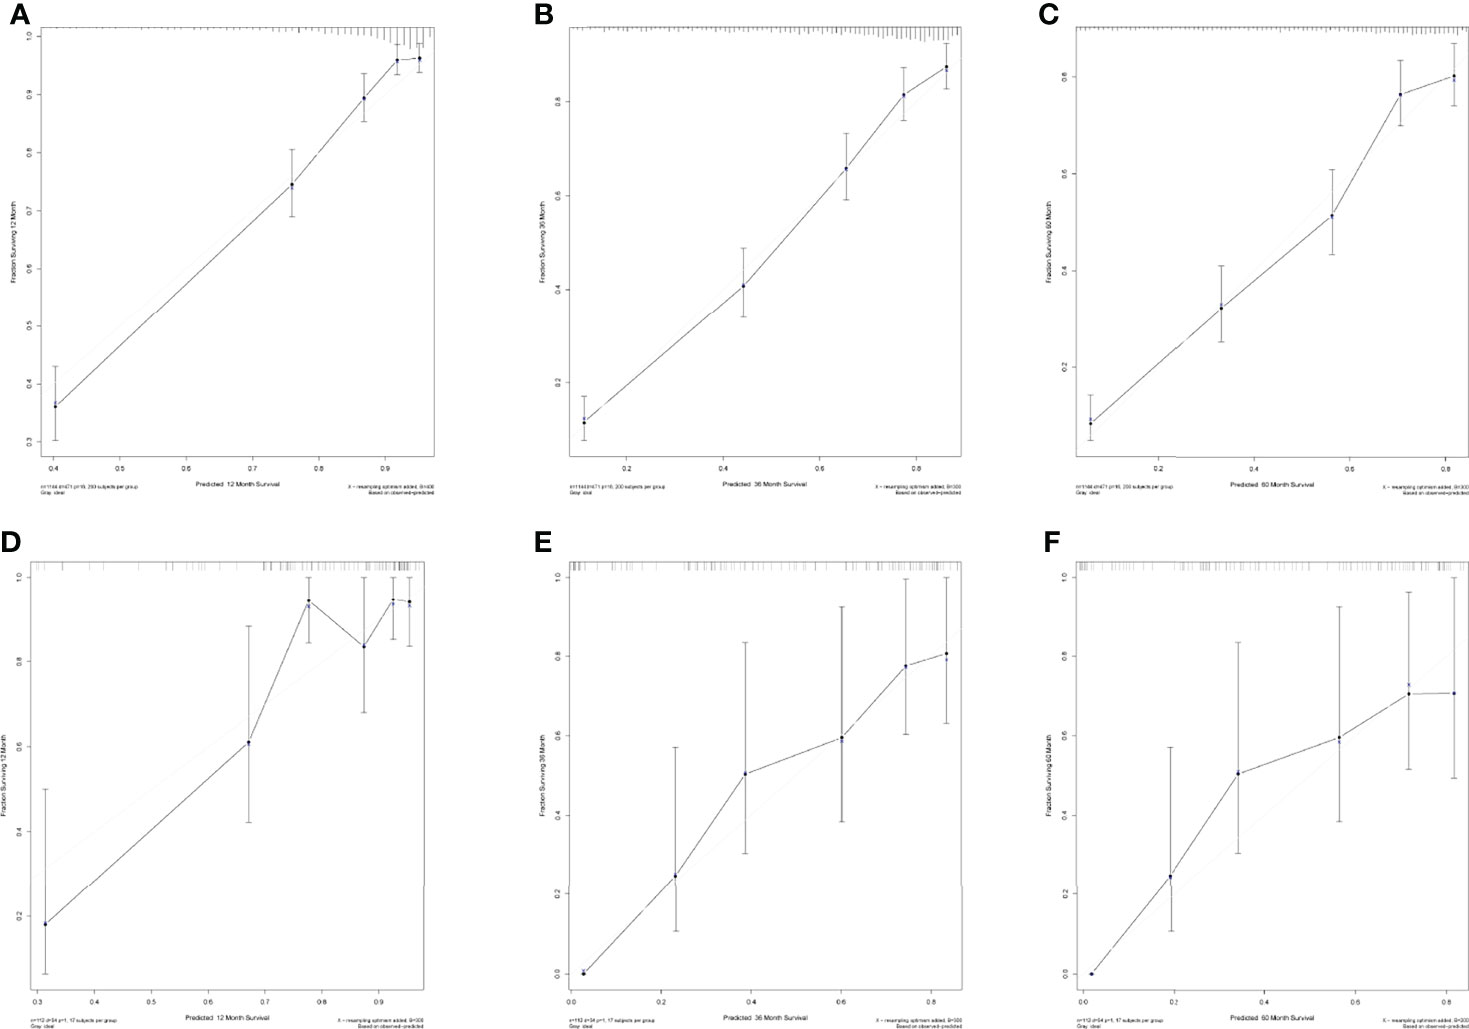
Figure 10 (A–C) Internal calibration diagram in 1 year, 3 years, and 5 years. (D–F) External calibration diagram in 1 year, 3 years, and 5 years.
The risk score plots were used to visualize Cox survival risk models. Figure 11 could illustrate the risk factors heat map, the scatter plot of patients’ status, survival time, and high/low risk group, in the training and validation groups, respectively.
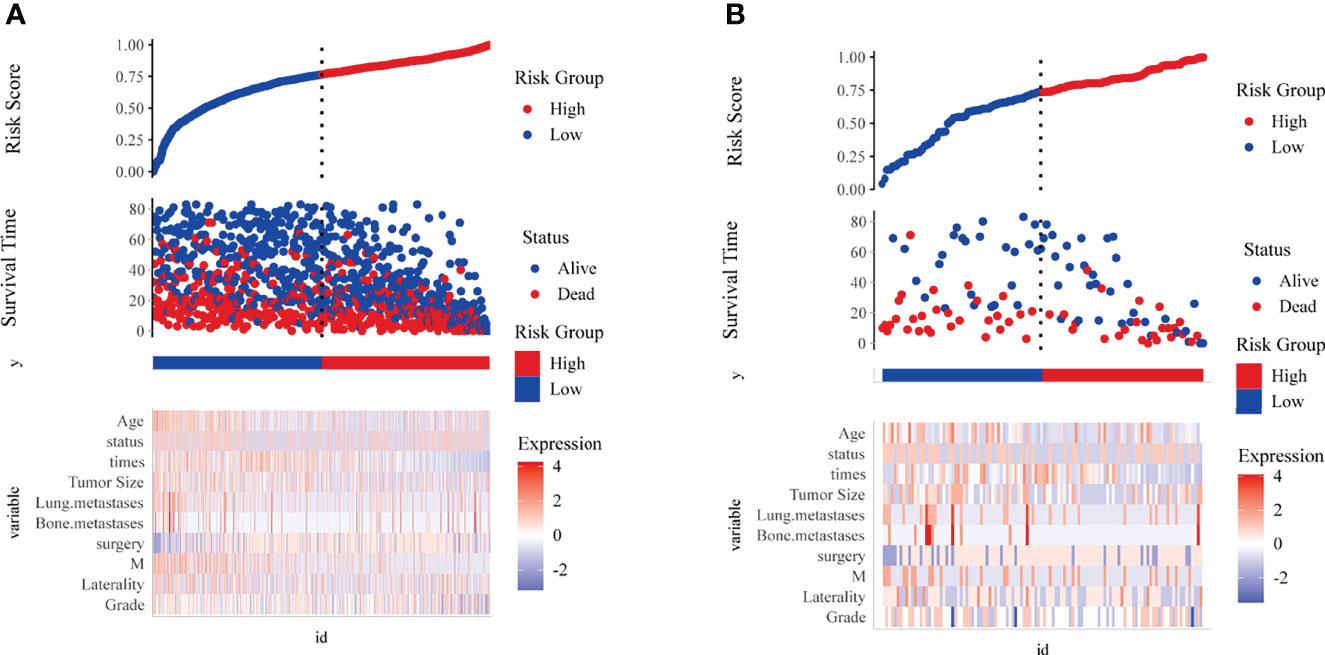
Figure 11 Risk score visualization. The scatter plot of risk score, the scatter plot of survival time and survival status for high and low risk, and the heat map of expression of key risk factors in the training group (A) and validation group (B).
As in Figure 12, in both the training and validation groups, there was no significant benefit for 1-year patients. In 3 years and 5 years, it was clear that the dashed line received a higher net benefit than the 1 year in both. Considering that osteosarcoma patients do not have a high mortality rate within 1 year of diagnosis, the prediction model developed in this study proved to have excellent clinical utility.
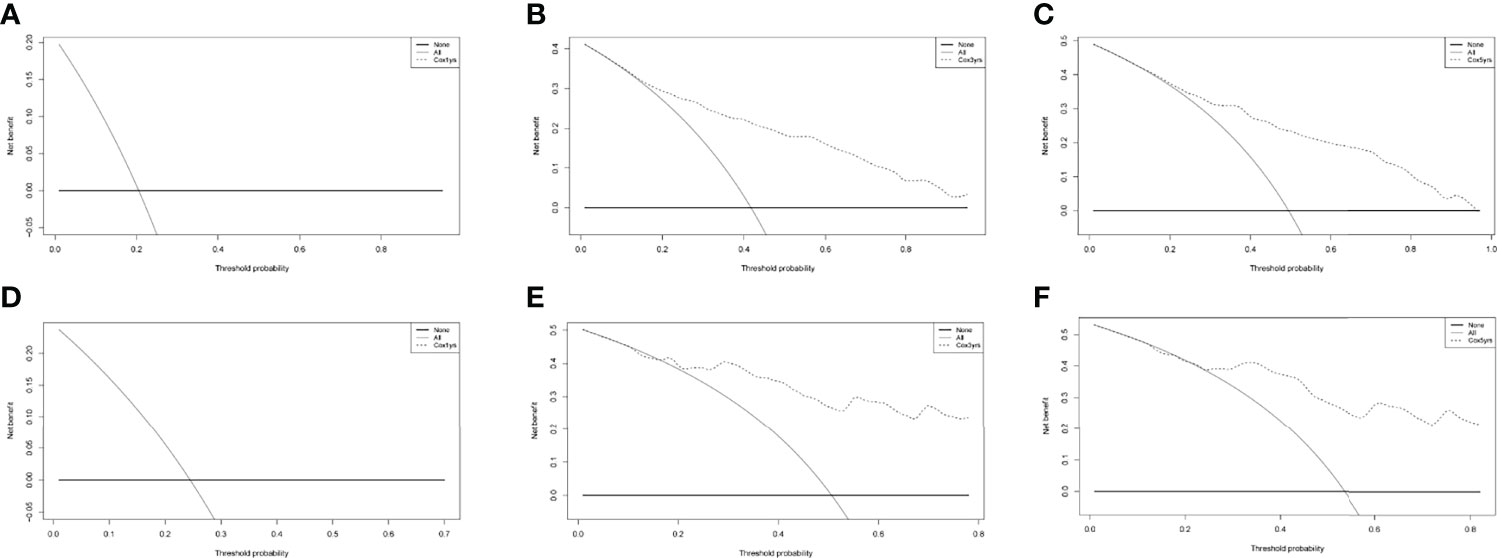
Figure 12 The DCA curves of the nomograms comparison for 1 year (A), 3 year (B), 5 year (C) in the training group, and for 1 year (D), 3 year (E), 5 year (F) in the validation group, respectively.
Since the mid-1980s, with the standardization of treatment and the use of adjuvant chemotherapy, the 5-year survival rate for patients with osteosarcoma has arrived to approximately 65% (17). No statistically significant differences were found between osteosarcoma patients from the United States and China, except in the ethnic distribution and the proportion of chemotherapy use (Table 1). All races were categorized as white, black, and other in SEER data, with other including Chinese. However, race was excluded as a predictor in three models (univariate Cox, full subset regression, and LASSO). In clinical practice, chemotherapy became a routine treatment option for metastases, especially concomitant lymphatic or vascular micrometastases (18). The proportion of chemotherapy in China was 87.5%, higher than that of the SEER database (Table 1). This might be related to the clinicians’ preference and financial cause. Chemotherapy was a protective factor for patients with osteosarcoma in the univariate Cox results (Figure 3). However, the overall survival time from the multicenter data was not significantly different from the SEER database (Figure 8A). Proper indications for chemotherapy needed future research. This study had limitations since a retrospective study had bias in multicenter data collection, resulting in a higher proportion of chemotherapy.
In 2020, approximately 3,600 new cases with bone tumors and approximately 1,720 patients would die from the malignancy in the United States (19). Osteosarcoma with metastases clinically detected at initial presentation were approximately 20% of all osteosarcoma patients (17, 20). Approximately 30% of patients developed lung metastases within 1 year after diagnosis (21). Early detection of metastases could improve prognosis. Lung metastases had a strong correlation with bone metastases (M stage) and lymphatic metastases (N stage) (Figure 2). Bone metastases had a strong correlation with N. The mechanism of lymphatic metastasis from osteosarcoma has not been clear (22). Some studies found that osteosarcoma metastases disrupted the cortex, and the metastatic route might be through the lymphatic vessels of the synovial membrane and bursa (23). The incidence of lymphatic metastasis in patients with osteosarcoma did not exceed 5% in both SEER data and multicenter data, while lymphatic metastasis was a risk factor for patients with osteosarcoma in the univariate Cox results (Figure 3). Thus, we suggested that oncologists could not ignore the examination on lymph nodes. A nomogram has been constructed to predict distal metastases from osteosarcoma, which can be used as a method to screen for people at high risk of developing metastases (12). The first peak of mobility occurred at the age of 10–14 years, coinciding with pubertal growth (24, 25). Older patients may be less tolerant to treatment, and had a poorer prognosis. Osteosarcoma in an axial location showed poorer survival, and it was more difficult to completely resect focus due to location. Similarly, the larger tumor volume had poorer prognosis due to difficulty in complete resection, which was similar to previous studies (26).
AJCC (8) and Enneking (9) staging systems can only vaguely assess the clinical risk of osteosarcoma based on initial clinical features to help make treatment decision. Clinical prediction models are widely used today as tools for predicting the occurrence of specific events and estimating medical prognosis, especially in clinical oncology. Clinical prediction models generate probabilities of individual clinical events by integrating different predictor and decision variables, and their visualization and quantification advantages are also of great practical value in clinical practice (27). Most prediction models are developed based on logistic regression and Cox regression models. However, the full model equation remains difficult. In our study, three models (univariate Cox, full subset regression, and LASSO) were performed in the SEER database. Univariate Cox model and eight predicting factors (age, grade, laterality, stage M, surgery, bone metastases, lung metastases, and tumor size) were selected based on the minimum AIC and maximum AUC value. The model was further externally validated and evaluated for its clinical utility with data from four medical centers in China. ROC curves revealed good predictive ability (AUC > 0.8 in both internal and external validation, Figure 6).
A nomogram and web calculators were applied and visualized. Decision trees were provided as prediction model aids. A major advantage of the web calculator is that, compared to a rating scale or approximations calculated by the nomogram, the full model equation can be embedded in a backend web page, is more accurate in its calculation, and is more convenient to use. Web calculators can provide user-friendly graphical interfaces for complex mathematical models reducing the learning cost for users in today’s world of smartphones and mobile networks. The nomogram is an effective quantitative method to assess risk and benefit and is widely used in clinical decision-making in a variety of diseases (28). In previous studies, several nomograms have been developed and validated to predict specific survival and overall survival in chondrosarcoma (29, 30).
In this study, a clinical prediction model to predict the overall survival of patients with osteosarcoma was developed to provide an objective reference for clinicians when making medical decisions. In clinical practice, lacking large-scale prognosis statistics for osteosarcoma patients in China, we chose the SEER database to develop the prediction model, and collected patient data from four medical centers in China to verify the feasibility of the model. In terms of clinical utility, the risk factor plots showed good stratification in both cohorts, effectively differentiating between high- and low-risk patient populations (Figure 10). The DCA displayed that both cohorts had better patient benefit from medical interventions in 3 years and 5 years. The 1-year model did not have a great net benefit, which may be related to the low mortality within 1 year (31).
Despite our efforts to refine the clinical prediction model, some limitations remained. (1) Training data (SEER database) to develop the prediction model were from North American patients, while the multicenter external data of China were tested for the model’s predictive power. (2) The model was based on retrospective data and inevitably had inherent biases. (3) Previous studies showed that metastasis of osteosarcoma was associated with genes, metastatic mechanisms, proteins, and RNAs (32, 33). Since the SEER database did not contain relevant information, there was still room to improve the predictive power of the model.
In this study, based on the SEER database and data of osteosarcoma patients from 4 different regional medical centers in China, the model with the highest predictive ability was selected by three methods of screening model predictors, and the model was visualized for predicting the overall survival of osteosarcoma patients using three methods: nomogram, web calculator, and decision tree. The model was shown to have very good predictive power and consistency by both calibration plots and ROC curves. DCA demonstrated that the predictive model could provide greater benefit to patients. External validation results show that it still has predictive power and clinical use outside of North America.
The data analyzed in this study is subject to the following licenses/restrictions: SEER database within the article is public data set. The clinical information data of China’s multicenter, analyzed during the current study are not publicly available for patient privacy purposes, but are available from the corresponding author upon reasonable request. Requests to access these datasets should be directed to CY, Y2hlbmdsaWFuZ3lpbkAxNjMuY29t.
This study was exempted from Institutional Review Board approval, in view of the SEER’s use of unidentifiable patient information. Due to the strict register-based nature of thestudy, informed consent was waived. The study of multicenter data was approved by the ethics review committee of the Second Affiliated Hospital of Jilin University, the Second Affiliated Hospital of Dalian Medical University, Liuzhou People’s Hospital, and Xianyang Central Hospital (No. 20210021).
CLY, WZ, HWP: study conception and design; WLL, GYH: manuscript writing; HTW, RLGW, CX, BW, QL: literature review; all authors: data interpretation and discussion; all authors: final editing and approval of the manuscript in its present form.
We thank all individuals who took part in this research.
Author HW was employed by the company Baidu Inc.
The remaining authors declare that the research was conducted in the absence of any commercial or financial relationships that could be construed as a potential conflict of interest.
All claims expressed in this article are solely those of the authors and do not necessarily represent those of their affiliated organizations, or those of the publisher, the editors and the reviewers. Any product that may be evaluated in this article, or claim that may be made by its manufacturer, is not guaranteed or endorsed by the publisher.
The Supplementary Material for this article can be found online at: https://www.frontiersin.org/articles/10.3389/fonc.2022.945362/full#supplementary-material
Supplementary Figure 1 | Flow chart of data collection and analysis
Supplementary Figure 2 | Kaplan–Meier survival curves in validation cohort. (A) the SEER data and the real Chinese multicenter data. (B) patients in multicenter data. (C) Bone metastases. (D) grade. (E) Laterality. (F) Lung metastases. (G) M. (H) surgery. i tumor size.
Supplementary Figure 3 | External ROC curve in 1 year, 3 years, 5 years.
AJCC, The American Joint Committee on Cancer; AIC, Akaike’s Information Criterion; AUC, area under the curve; DCA, decision curve analysis; MSE, mean squared error; ROC, receiver operating characteristic curve; SEER, The Surveillance, Epidemiology, and End Results.
1. Jawad MU, Cheung MC, Clarke J, Koniaris LG, Scully SP. Osteosarcoma: Improvement in survival limited to high-grade patients only. J Cancer Res Clin Oncol (2011) 137:597–607. doi: 10.1007/s00432-010-0923-7
2. Mirabello L, Troisi RJ, Savage SA. Osteosarcoma incidence and survival rates from 1973 to 2004: Data from the surveillance, epidemiology, and end results program. Cancer (2009) 115:1531–43. doi: 10.1002/cncr.24121
3. Marina N, Gebhardt M, Teot L, Gorlick R. Biology and therapeutic advances for pediatric osteosarcoma. Oncol (2004) 9:422–41. doi: 10.1634/theoncologist.9-4-422
4. Messerschmitt PJ, Garcia RM, Abdul-Karim FW, Greenfield EM, Getty PJ. Osteosarcoma. J Am Acad Orthopaedic Surgeons (2009) 17:515–27. doi: 10.5435/00124635-200908000-00005
5. Meyers PA, Schwartz CL, Krailo M, Kleinerman ES, Betcher D, Bernstein ML, et al. Osteosarcoma: A randomized, prospective trial of the addition of ifosfamide and/or muramyl tripeptide to cisplatin, doxorubicin, and high-dose methotrexate. J Clin Oncol (2005) 23:2004–11. doi: 10.1200/JCO.2005.06.031
6. Bacci G, Bertoni F, Longhi A, Ferrari S, Forni C, Biagini R, et al. Neoadjuvant chemotherapy for high-grade central osteosarcoma of the extremity. histologic response to preoperative chemotherapy correlates with histologic subtype of the tumor. Cancer (2003) 97:3068–75. doi: 10.1002/cncr.11456
7. Chou AJ, Geller DS, Gorlick R. Therapy for osteosarcoma: Where do we go from here? Paediatric Drugs (2008) 10:315–27. doi: 10.2165/00148581-200810050-00005
8. Greene F, Page D, Fleming I, Fritz A, Balch C, Haller D, et al. AJCC cancer staging manual. JAMA J Am Med Assoc (2010) 304:1726–7. doi: 10.1001/jama.2010.1525
9. William EF. Osteosarcoma. Clin Orthopaedics Related Res (1975) 111:2–4. doi: 10.1097/00003086-197509000-00001
10. Liu R-Z, Zhao Z-R, Ng CSH. Statistical modelling for thoracic surgery using a nomogram based on logistic regression. J Thorac Dis (2016) 8:E731. doi: 10.21037/jtd.2016.07.91
11. Li W, Dong S, Wang H, Wu R, Wu H, Tang ZR, et al. Risk analysis of pulmonary metastasis of chondrosarcoma by establishing and validating a new clinical prediction model: A clinical study based on SEER database. BMC Musculoskeletal Disord (2021) 22:529. doi: 10.1186/s12891-021-04414-2
12. Lu S, Wang Y, Liu G, Wang L, Wu P, Li Y, et al. Construction and validation of nomogram to predict distant metastasis in osteosarcoma: A retrospective study. J Orthopaedic Surg Res (2021) 16:231. doi: 10.1186/s13018-021-02376-8
13. He Y, Liu H, Wang S, Zhang J. A nomogram for predicting cancer-specific survival in patients with osteosarcoma as secondary malignancy. Sci Rep (2020) 10:12817. doi: 10.1038/s41598-020-69740-2
14. Fu P, Shi Y, Chen G, Fan Y, Gu Y, Gao Z. Prognostic factors in patients with osteosarcoma with the surveillance, epidemiology, and end results database. Technol Cancer Res Treat (2020) 19:1533033820947701. doi: 10.1177/1533033820947701
15. Qi L, Ren X, Liu Z, Li S, Zhang W, Chen R, et al. Predictors and survival of patients with osteosarcoma after limb salvage versus amputation: A population-based analysis with propensity score matching. World J Surg (2020) 44:2201–10. doi: 10.1007/s00268-020-05471-9
16. Balachandran VP, Gonen M, Smith JJ, Dematteo RP. Nomograms in oncology: More than meets the eye. Lancet Oncol (2015) 16:e173–80. doi: 10.1016/S1470-2045(14)71116-7
17. Ritter J, Bielack SS. Osteosarcoma. Ann Oncol (2010) 21 Suppl 7:vii320–5. doi: 10.1093/annonc/mdq276
18. Isakoff MS, Bielack SS, Meltzer P, Gorlick R. Osteosarcoma: Current treatment and a collaborative pathway to success. J Clin Oncol (2015) 33:3029–35. doi: 10.1200/JCO.2014.59.4895
19. Siegel RL, Miller KD, Jemal A. Cancer statistics, 2020. CA: Cancer J Clin (2020) 70:7–30. doi: 10.3322/caac.21590
20. Kager L, Zoubek A, Pötschger U, Kastner U, Flege S, Kempf-Bielack B, et al. Primary metastatic osteosarcoma: Presentation and outcome of patients treated on neoadjuvant cooperative osteosarcoma study group protocols. J Clin Oncol (2003) 21:2011–8. doi: 10.1200/JCO.2003.08.132
21. Vormoor B, Knizia HK, Batey MA, Almeida GS, Wilson I, Dildey P, et al. Development of a preclinical orthotopic xenograft model of Ewing sarcoma and other human malignant bone disease using advanced In vivo imaging. PLoS One (2014) 9:e85128. doi: 10.1371/journal.pone.0085128
22. Dirik Y, Çınar A, Yumrukçal F, Eralp L. Popliteal lymph node metastasis of tibial osteoblastic osteosarcoma. Int J Surg Case Rep (2014) 5:840–4. doi: 10.1016/j.ijscr.2014.09.029
23. Edwards JR, Williams K, Kindblom LG, Meis-Kindblom JM, Hogendoorn PC, Hughes D, et al. Lymphatics and bone. Hum Pathol (2008) 39:49–55. doi: 10.1016/j.humpath.2007.04.022
24. Ottaviani G, Jaffe N. The epidemiology of osteosarcoma. Cancer Treat Res (2009) 152:3–13. doi: 10.1007/978-1-4419-0284-9_1
25. Simpson E, Brown HL. Understanding osteosarcomas. JAAPA: Off J Am Acad Phys Assist (2018) 31:15–9. doi: 10.1097/01.JAA.0000541477.24116.8d
26. Misaghi A, Goldin A, Awad M, Kulidjian AA. Osteosarcoma: A comprehensive review. Sicot-j (2018) 4:12. doi: 10.1051/sicotj/2017028
27. Sannino G, Orth MF, Grünewald TG. Next steps in Ewing sarcoma (Epi-) genomics. Future Oncol (London England) (2017) 13:1207–11. doi: 10.2217/fon-2017-0159
28. Li G, Tian ML, Bing YT, Wang HY, Yuan CH, Xiu DR. Nomograms predict survival outcomes for distant metastatic pancreatic neuroendocrine tumor: A population based STROBE compliant study. Medicine (2020) 99:e19593. doi: 10.1097/MD.0000000000019593
29. Gao Z, Lu T, Song H, Gao Z, Ren F, Ouyang P, et al. Prognostic factors and treatment options for patients with high-grade chondrosarcoma. Med Sci monitor (2019) 25:8952–67. doi: 10.12659/MSM.917959
30. Tang Z, Zhu R, Hu R, Chen Y, Wu EQ, Wang H, et al. A multilayer neural network merging image preprocessing and pattern recognition by integrating diffusion and drift memristors. IEEE Trans Cogn Dev Syst (2020). doi: 10.1109/TCDS.2020.3003377
31. Luetke A, Meyers PA, Lewis I, Juergens H. Osteosarcoma treatment - where do we stand? a state of the art review. Cancer Treat Rev (2014) 40:523–32. doi: 10.1016/j.ctrv.2013.11.006
32. Xiao Y, Zhao Q, Du B, Chen HY, Zhou DZ. MicroRNA-187 inhibits growth and metastasis of osteosarcoma by downregulating S100a4. Cancer Invest (2018) 36:1–9. doi: 10.1080/07357907.2017.1415348
Keywords: osteosarcoma, SEER, multicenter study, nomogram, web calculator, prediction model
Citation: Li W, Jin G, Wu H, Wu R, Xu C, Wang B, Liu Q, Hu Z, Wang H, Dong S, Tang Z-R, Peng H, Zhao W and Yin C (2022) Interpretable clinical visualization model for prediction of prognosis in osteosarcoma: a large cohort data study. Front. Oncol. 12:945362. doi: 10.3389/fonc.2022.945362
Received: 16 May 2022; Accepted: 24 June 2022;
Published: 02 August 2022.
Edited by:
Thippa Reddy Gadekallu, VIT University, IndiaReviewed by:
Zishao Zhong, Guangdong Provincial Hospital of Chinese Medicine, ChinaCopyright © 2022 Li, Jin, Wu, Wu, Xu, Wang, Liu, Hu, Wang, Dong, Tang, Peng, Zhao and Yin. This is an open-access article distributed under the terms of the Creative Commons Attribution License (CC BY). The use, distribution or reproduction in other forums is permitted, provided the original author(s) and the copyright owner(s) are credited and that the original publication in this journal is cited, in accordance with accepted academic practice. No use, distribution or reproduction is permitted which does not comply with these terms.
*Correspondence: Chengliang Yin, Y2hlbmdsaWFuZ3lpbkAxNjMuY29t; Wei Zhao, MzQzMDI2MDNAcXEuY29t; Haiwen Peng, cGVuZ2hhaXdlbmRvY3RvckBzaW5hLmNvbQ==
†These authors have contributed equally to this work
Disclaimer: All claims expressed in this article are solely those of the authors and do not necessarily represent those of their affiliated organizations, or those of the publisher, the editors and the reviewers. Any product that may be evaluated in this article or claim that may be made by its manufacturer is not guaranteed or endorsed by the publisher.
Research integrity at Frontiers
Learn more about the work of our research integrity team to safeguard the quality of each article we publish.