 Lin Shi
 Ling Wang1†
 Cuiyun Wu
 Yang Zhang
 Junfa Chen
95% of researchers rate our articles as excellent or good
Learn more about the work of our research integrity team to safeguard the quality of each article we publish.
Find out more
ORIGINAL RESEARCH article
Front. Oncol. , 06 July 2022
Sec. Cancer Imaging and Image-directed Interventions
Volume 12 - 2022 | https://doi.org/10.3389/fonc.2022.927077
This article is part of the Research Topic Radiomics-based Theranostics in Cancer Precision Medicine View all 11 articles
Purpose: This study aims to uncover and validate an MRI-based radiomics nomogram for detecting lymph node metastasis (LNM) in pancreatic ductal adenocarcinoma (PDAC) patients prior to surgery.
Materials and Methods: We retrospectively collected 141 patients with pathologically confirmed PDAC who underwent preoperative T2-weighted imaging (T2WI) and portal venous phase (PVP) contrast-enhanced T1-weighted imaging (T1WI) scans between January 2017 and December 2021. The patients were randomly divided into training (n = 98) and validation (n = 43) cohorts at a ratio of 7:3. For each sequence, 1037 radiomics features were extracted and analyzed. After applying the gradient-boosting decision tree (GBDT), the key MRI radiomics features were selected. Three radiomics scores (rad-score 1 for PVP, rad-score 2 for T2WI, and rad-score 3 for T2WI combined with PVP) were calculated. Rad-score 3 and clinical independent risk factors were combined to construct a nomogram for the prediction of LNM of PDAC by multivariable logistic regression analysis. The predictive performances of the rad-scores and the nomogram were assessed by the area under the operating characteristic curve (AUC), and the clinical utility of the radiomics nomogram was assessed by decision curve analysis (DCA).
Results: Six radiomics features of T2WI, eight radiomics features of PVP and ten radiomics features of T2WI combined with PVP were found to be associated with LNM. Multivariate logistic regression analysis showed that rad-score 3 and MRI-reported LN status were independent predictors. In the training and validation cohorts, the AUCs of rad-score 1, rad-score 2 and rad-score 3 were 0.769 and 0.751, 0.807 and 0.784, and 0.834 and 0.807, respectively. The predictive value of rad-score 3 was similar to that of rad-score 1 and rad-score 2 in both the training and validation cohorts (P > 0.05). The radiomics nomogram constructed by rad-score 3 and MRI-reported LN status showed encouraging clinical benefit, with an AUC of 0.845 for the training cohort and 0.816 for the validation cohort.
Conclusions: The radiomics nomogram derived from the rad-score based on MRI features and MRI-reported lymph status showed outstanding performance for the preoperative prediction of LNM of PDAC.
Pancreatic cancer, as a highly malignant gastrointestinal tumor, has a five-year mortality rate close to its morbidity rate (1, 2). Pancreatic ductal adenocarcinoma (PDAC) is the predominant histological subtype, accounting for 85% of all pancreatic cancer cases (3). Schwarz et al. (4) conducted a retrospective analysis of 2787 patients who underwent surgical resection (SR) for pancreatic cancer in the United States and found that 54% of patients had lymph node metastasis (LNM), suggesting that LNM is a potential key to assess the state of the disease, as it influences the formulation of surgical procedures and patient prognosis (5). Different preoperative noninvasive examinations, including computed tomography (CT), magnetic resonance imaging (MRI) and positron emission tomography (PET), are commonly used to identify LNM of pancreatic cancer (6–11). Unfortunately, all of these technologies are still inadequate for assessing LNM status because enlarged lymph nodes are often caused by nonspecific inflammation (12). In addition, although endoscopic ultrasonography (EUS) has high sensitivity for the diagnosis of pancreatic primary lesions and LNM and sufficient histological information can be obtained from a small sample of tissue, it is an invasive method (13, 14). Its use is also limited by several other factors, such as the focal size and surrounding anatomical environment, yielding an accuracy of 41-86% for lymph node staging of pancreatic adenocarcinoma (14). Recent studies have shown that Ki-67 and serum MMP7 have the potential to predict LNM, but their sensitivities remain insufficient (15, 16).
Radiomics approaches allow for the quantitative analysis of images and can reflect heterogeneity in the region of interest (ROI), providing more information through feature analysis than can be recognized by the naked eye, making it helpful for clarifying the nature of lesions (17). T2-weighted imaging (T2WI) and the dynamic enhanced portal venous phase (PVP) of MRI can better depict the biological characteristics of pancreatic lesions and have therefore been applied to radiomics studies of pancreatic cancer (18–20), including for differential diagnosis, prognosis evaluations, and treatment response predictions. Although studies have shown that radiomics can be used for the preoperative prediction of LNM of malignant tumors (21–24), few radiomics studies based on MRI image texture analysis have been conducted for the preoperative prediction of LNM of PDAC. Therefore, this study aimed to explore whether the use of T2WI and PVP features was feasible for predicting LNM of PDAC. We sought to develop and validate a radiomics nomogram as a noninvasive and feasible approach for the preoperative detection of LNM in PDAC patients.
This study was approved by the Ethics Committee of the Zhejiang Provincial People’s Hospital, Affiliated People’s Hospital of Hangzhou Medical College. The requirement for informed consent was waived due to the retrospective nature of this study. Clinical and MRI databases of patients were retrospectively reviewed to identify candidate patients who were treated between January 2017 and December 2021. The inclusion criteria were as follows: (1) patients who received radical resection and regional lymph node dissection for PDAC diagnosed by postoperative pathology and (2) patients with PDAC who underwent dynamic enhancement MRI scanning within two weeks before SR. The exclusion criteria were as follows: (1) images with artifacts that affected lesion observation; (2) patients who received any treatment for PDAC before SR, such as neoadjuvant chemoradiotherapy; and (3) patients with PDAC and other malignant tumors. Among the 141 patients who met these criteria, 58 were diagnosed with LNM. All patients were randomly divided into training (n = 98) and validation (n = 43) cohorts at a ratio of 7:3. Clinical data of the patients were collected, including sex, age, primary tumor site, the maximum diameter of the tumor, MRI tumor stage (mTs), MRI-reported lymph node status, and the levels of carbohydrate antigen 19-9 (CA19-9), carbohydrate antigen 125 (CA125) and carcinoma embryonic antigen (CEA). A positive lymph node on MRI was defined as a nodule at least 10 mm in the short-axis diameter or a nodule with a round shape, heterogeneous enhancement and low ADC value (25). The patient selection flowchart is shown in Figure 1.
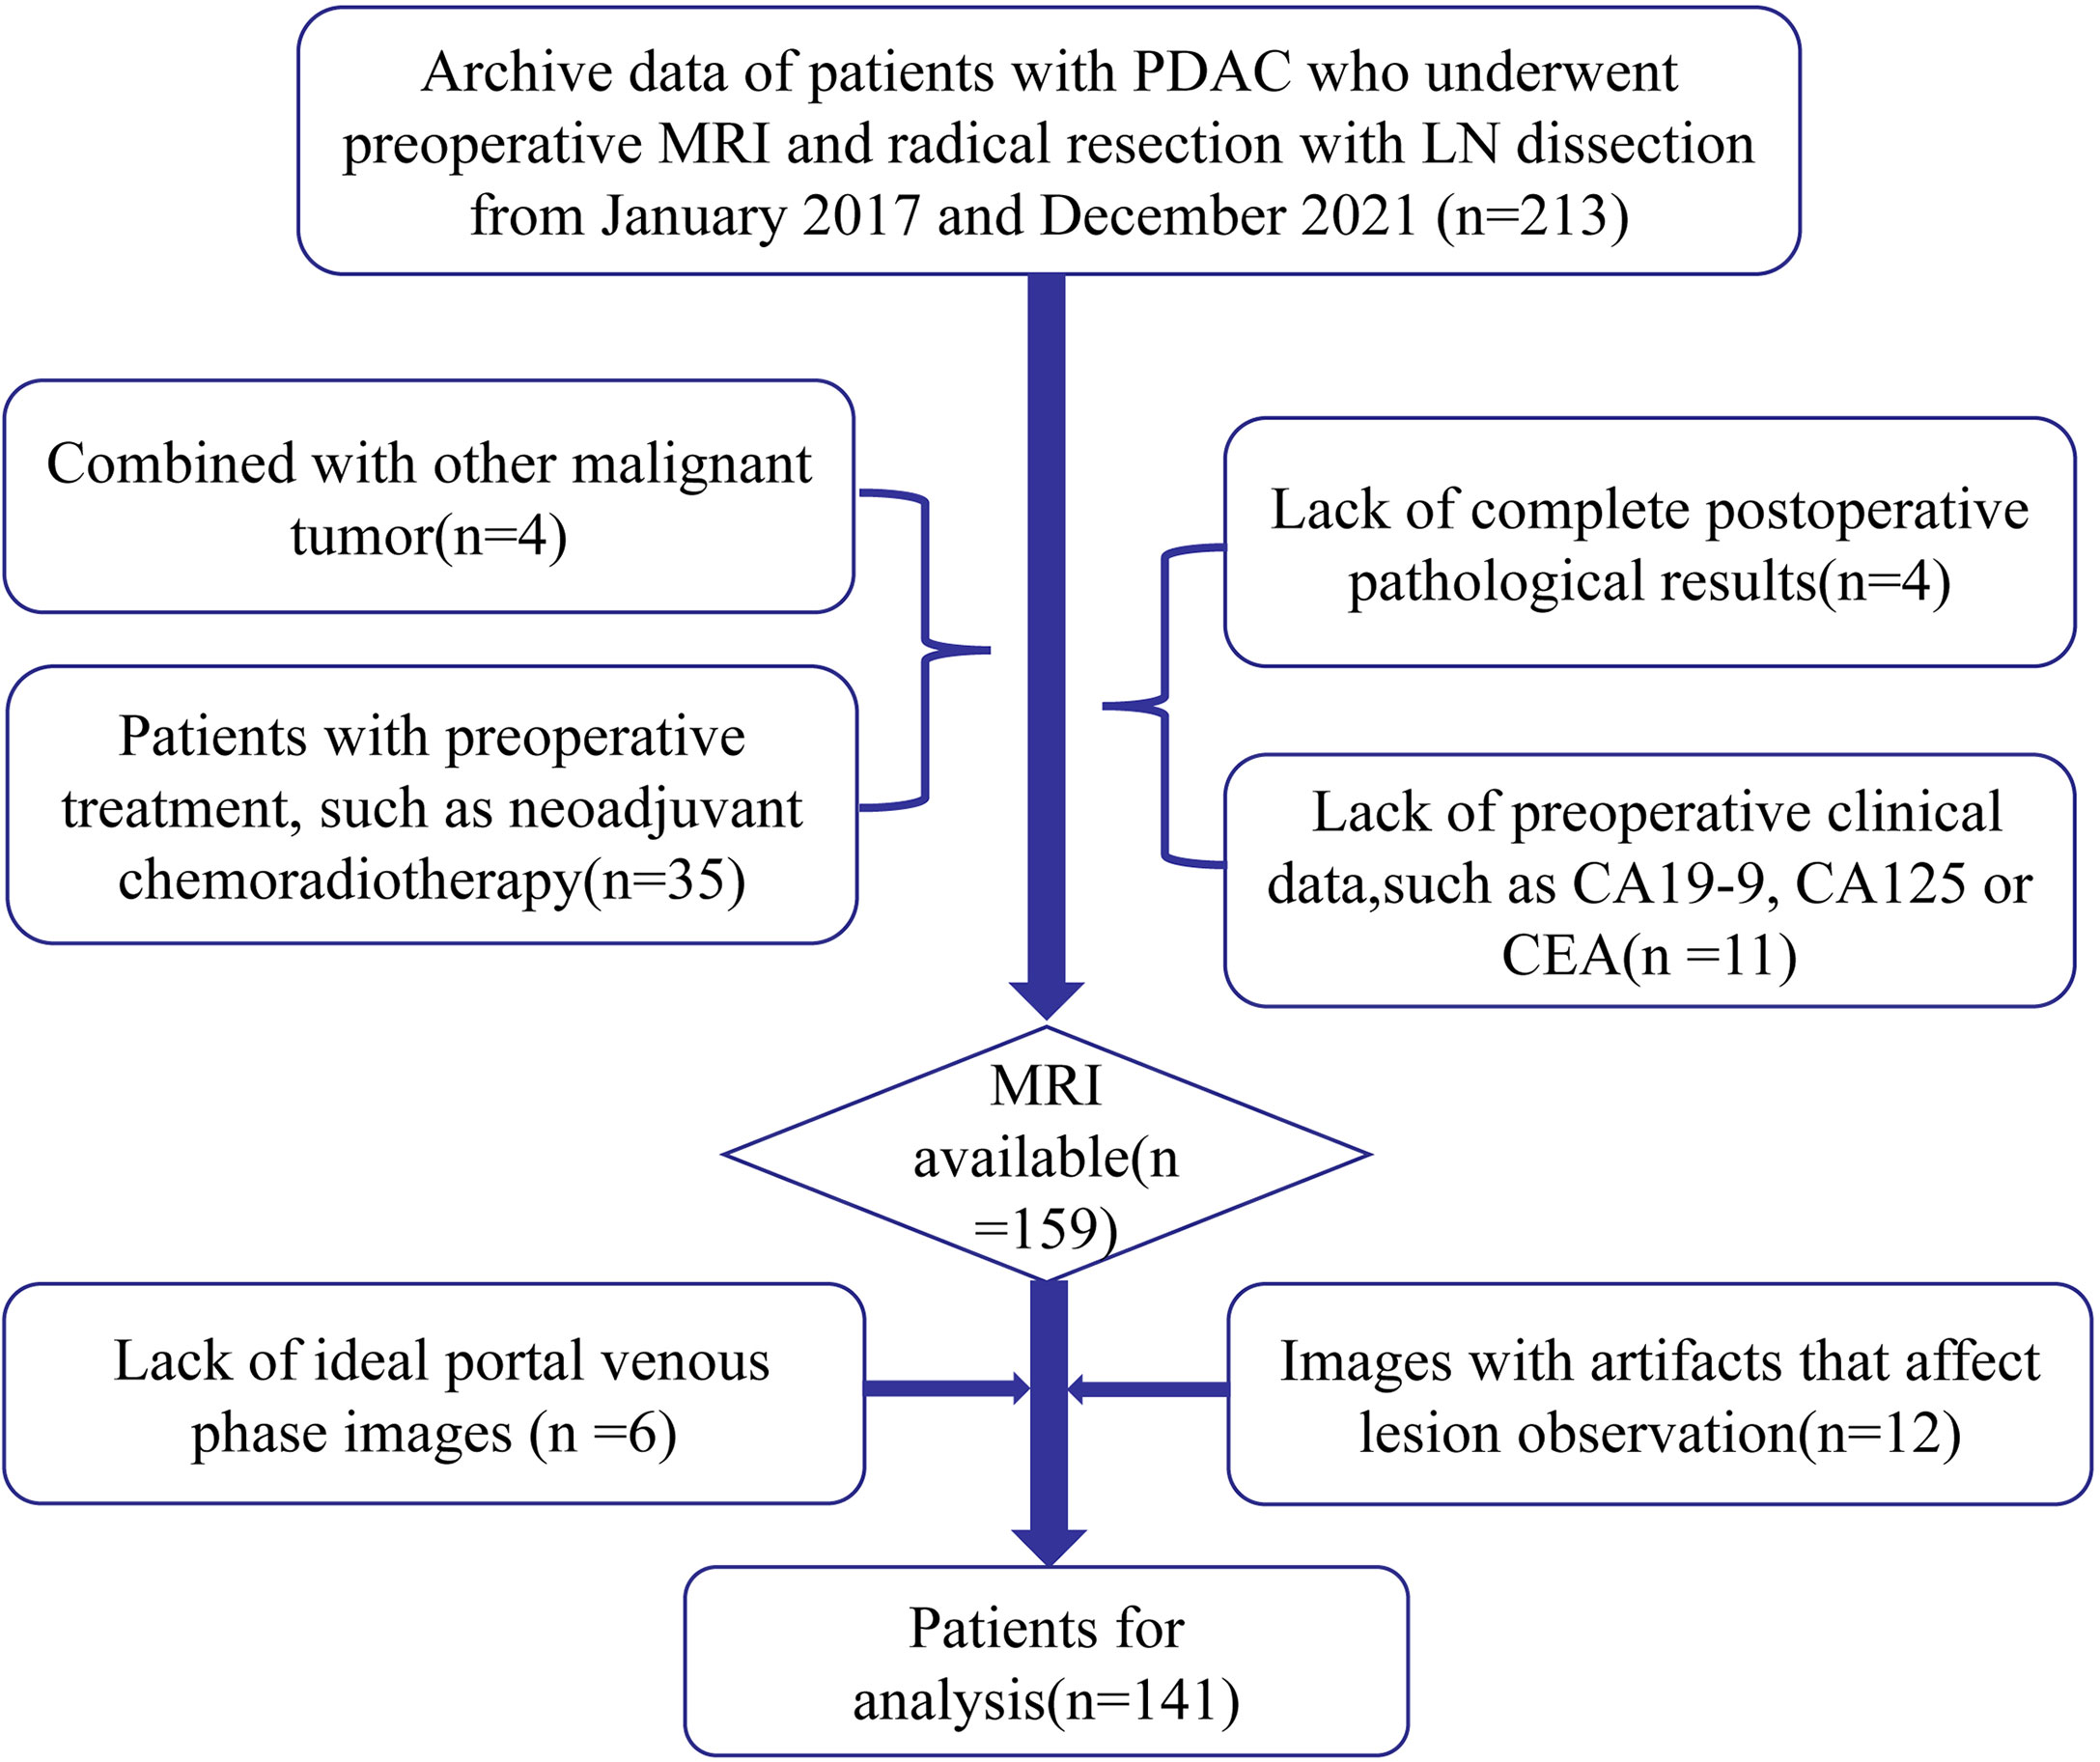
Figure 1 Patient selection flowchart.
MRI was performed with a 3.0 T Discovery MR 750 scanner (GE Healthcare, Waukesha, WI, United States). (1) The following parameters were used for fat-suppressed fast spin-echo T2-weighted imaging (T2WI): repetition time (TR)/echo time (TE), 12000/72 ms; matrix size, 320 × 320; field of view (FOV), 360 × 360 mm2; slice thickness, 3 mm; spacing between slices, 0.6 mm; number of excitation (NEX), 2; and bandwidth, 83.3 kHz. (2) Gd-diethylenetriamine pentaacetic acid (Gd-DTPA) was injected at a dose of 0.1 mmol/kg through the median cubital vein at an injection rate of 2.0 mL/s, followed by 15 ml of saline at the same flow rate. A fat-suppressed T1-weighted three-dimensional (3D) gradient-recalled-echo sequence was used to collect dynamic enhanced images with the following parameters: TR/TE, 4.1/1.2 ms; matrix size, 260 × 240; FOV, 360 × 360 mm2; slice thickness, 3 mm; spacing between slices, 0 mm; NEX, 1; and bandwidth, 142.8 kHz. The late arterial phase (LAP), portal venous phase (PVP), and delayed phase (DP) were acquired at 25 seconds, 45 seconds, and 80 seconds. Other scanning sequence conditions not used for radiomics are not listed in this study.
Using ITK-SNAP software (26) (Figure 2), segmentation of the regions of interest (ROIs) was performed by two independent radiologists with 5 and 15 years of experience in abdominal radiology, named reader 1 and reader 2, respectively. With reference to diffusion weighted imaging (DWI) and dynamic enhanced images, 3D ROIs based on T2WI and PVP were drawn manually. Features of ROIs were extracted by PHIgo software (GE Healthcare, V1.2.0, China), which is based on pyradiomics, and complies with the image biomarker standardization initiative (IBSI) (27). Prior to this, all images underwent standardized preprocessing, including image resampling at the same resolution (1*1*1 mm3) and dividing the gray level into grades 1-10. A total of 1037 features were obtained, including first-order features, shape features, gray level cooccurrence matrix (GLCM) features, gray level size zone matrix (GLSZM) features, gray level run length matrix (GLRLM) features, neighboring gray tone difference matrix (NGTDM) features and gray level dependence matrix (GLDM) features. The stability and reliability were evaluated using intraclass correlation coefficients (ICCs) by comparing 30 random patients’ ROIs drawn by reader 1 and reader 2. Features with ICC values > 0.8 were interpreted as almost perfect and recorded.
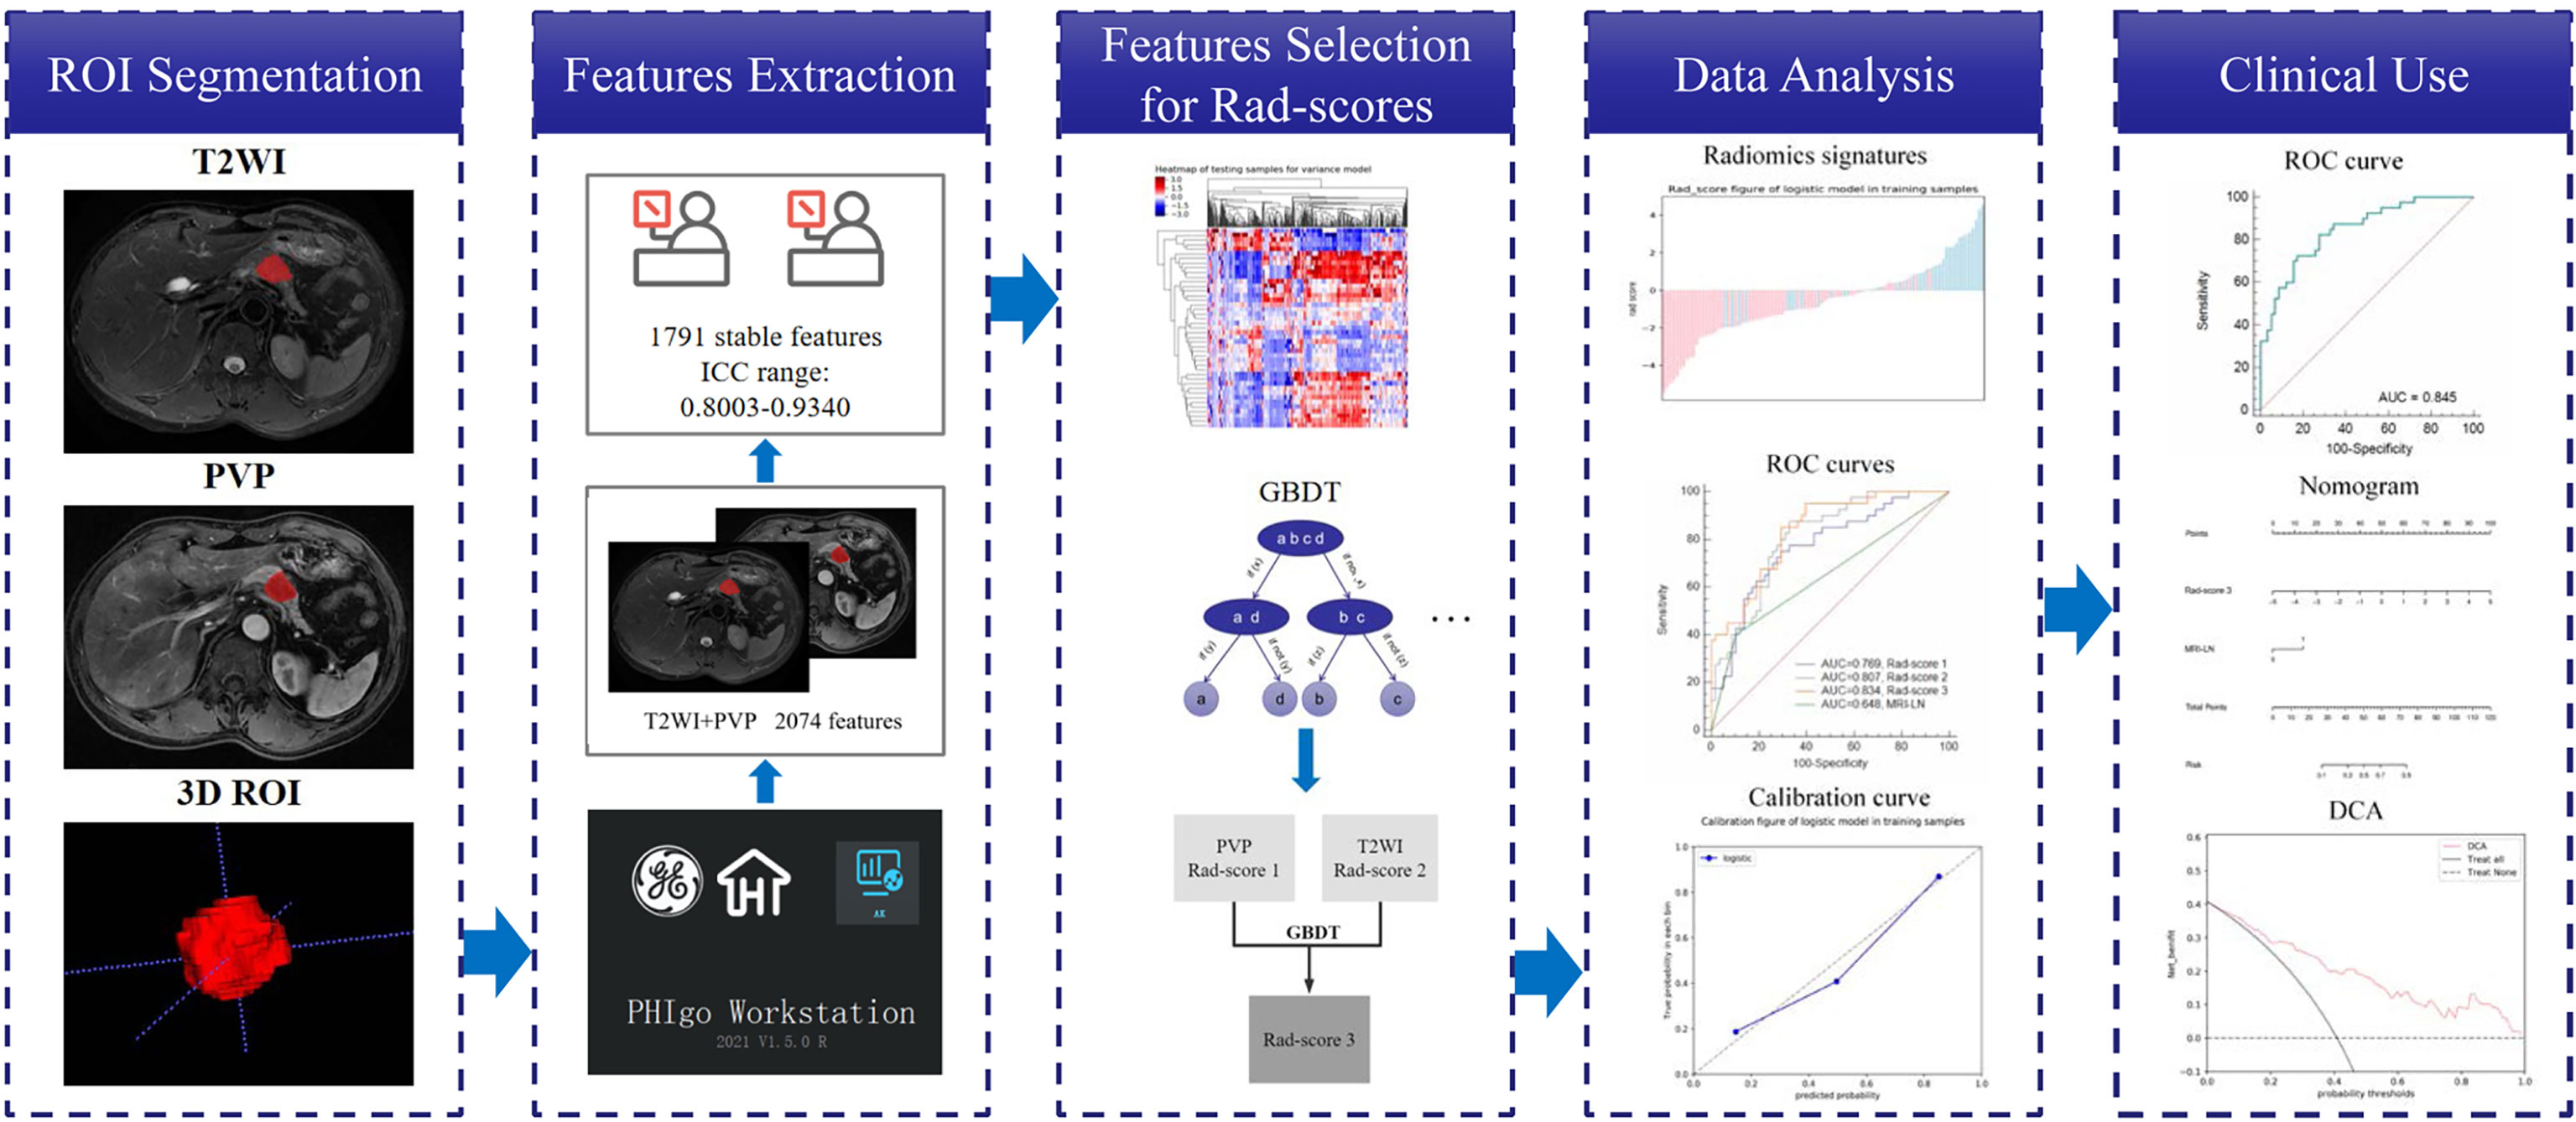
Figure 2 Radiomics and model construction workflow.
Dimensionality reduction for T2WI and PVP was performed using analysis of variance and the Mann–Whitney U test, Spearman’s correlation, and gradient boosting decision tree (GBDT) in sequence. Combining the selected features from T2WI and PVP, GBDT was again used to select significant features. Radiomics scores (rad-score 1, rad-score 2 and rad-score 3) were calculated based on the remaining features from T2WI, PVP and T2WI combined with PVP by multivariate logistic regression.
Univariate logistic regression analysis and multivariate logistic regression analysis were performed with the clinical characteristics and rad-score 3 to identify potential and independent predictors of LNM, respectively (28). Finally, a radiomics nomogram was constructed with the identified predictors of LNM. The Hosmer–Lemeshow test and calibration curves were used to assess the goodness-of-fit and calibration of the nomogram (29). The predictive performances of the clinical model, three rad-scores, and the nomogram for LNM were evaluated by receiver operator characteristic (ROC) curve analysis, and the areas under the curve (AUCs) were calculated. Decision curve analysis (DCA) was performed to determine the clinical efficiency of the nomogram.
The data were analyzed by SPSS 22.0 (IBM Corporation), MedCalc (Version 14.10.20) and Microsoft R Open (version 3.3.1) software. Univariate analysis was used to assess the correlations between the clinical characteristics and LNM, with the chi-square test used for categorical variables and the two-sample t test used for continuous variables. Normality was assessed by the Kolmogorov–Smirnov test. The variables that followed a normal distribution are expressed as the mean ± standard deviation, and nonnormally distributed variables are expressed as the median (interquartile range). The De-Long test was used for statistical comparison of the AUCs of the models. Calibration plots and DCA were performed using the “rms” and “dca” packages in R (Microsoft R Open; version 3.3.1), respectively. All statistical tests were two-tailed, and significance was set at P<0.05.
There were no significant differences in any of the clinical characteristics between the training and validation cohorts (Table 1), and the LN positivity rate was not significantly different between the two cohorts (40.8% (40/98) vs. 41.9% (18/43), respectively; P=0.908). The only significant difference among the clinical characteristics was in the MRI-reported LNM status between patients with LNM and those with non-lymph node metastasis (nLNM) in both the training and validation cohorts (P<0.05) (Table 1).
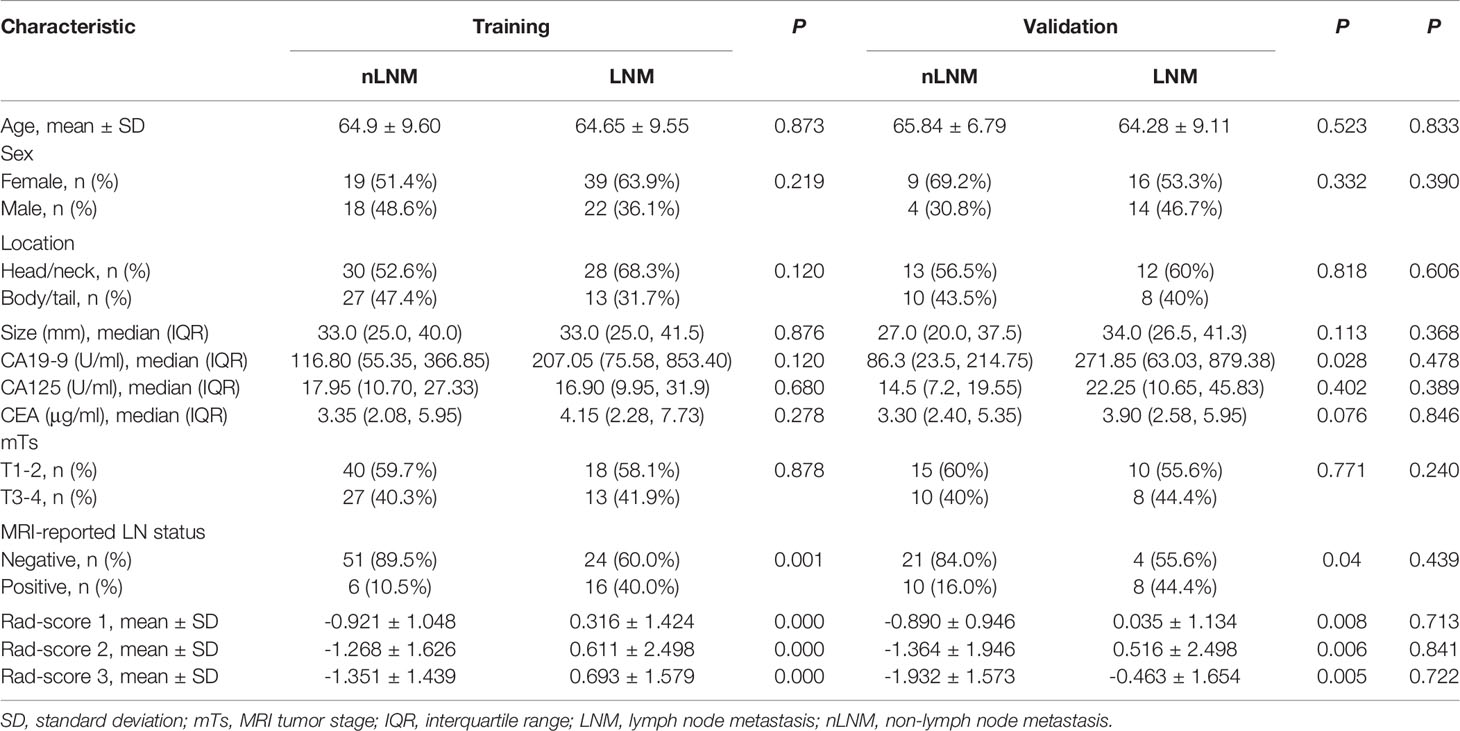
Table 1 Patients’ clinical characteristics and rad-scores in the training and validation cohorts.
The ICC values for feature extraction between reader 1 and reader 2 ranged from 0.773 to 0.934, suggesting high agreement. A total of 1791 features were proven to have high consistency (ICCs: 0.8003-0.934). For the T2WI and PVP sequences, analysis of variance and the Mann-Whitney U test identified 480 and 478 important features, respectively. Following Spearman correlation analysis, the number of important features was reduced to 14 and 19. Finally, 6 and 8 features were ultimately identified by further GBDT dimensionality reduction. The corresponding rad-scores (1 and 2) were calculated based on the retained features included in the multivariable logistic regression. After merging the 14 features and using GBDT again, 10 features were obtained to calculate rad-score 3. Various features and coefficients of rad-score 3 are shown in Table 2, which are all wavelet features. The three rad-scores were significantly different between LNM and nLNM patients in both the training and validation cohorts (P <0.01), but there was no difference between the cohorts (Table 1).
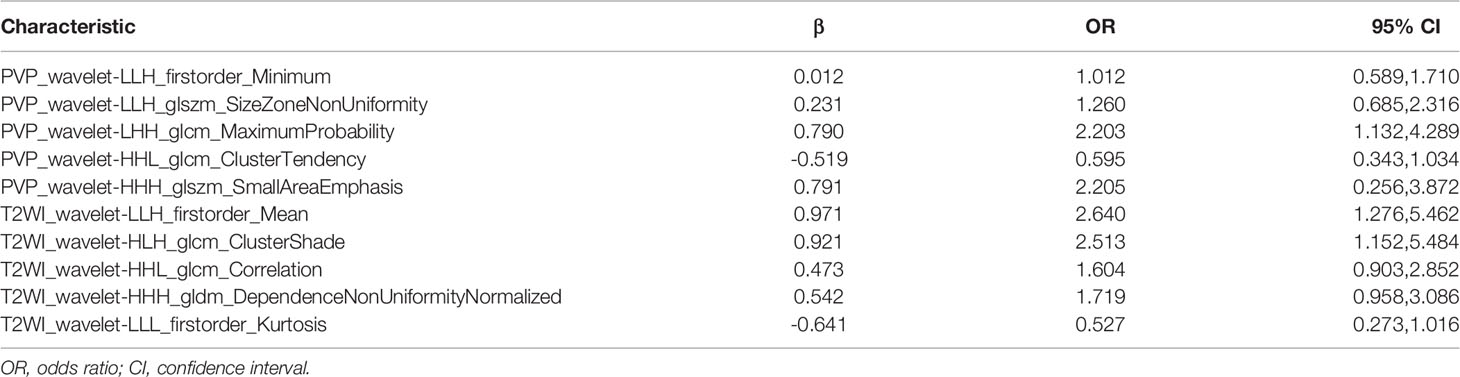
Table 2 Radiomics features selected by GBDT.
The ROC curve demonstrates the predictive performance of the clinical model, rad-score 1, rad-score 2, and rad-score 3, as shown in Figure 3. In the training and validation cohorts, the AUCs of the clinical model, rad-score 1, rad-score 2 and rad-score 3 were 0.648, 0.642; 0.769, 0.751; 0.807, 0.784 and 0.834, 0.807, respectively. The thresholds for predicting LNM using rad-score 1, rad-score 2, and rad-score 3 were -0.441, -0.696, and -0.807, respectively, in the training cohort. Although the AUC value of rad-score 3 was the largest among the rad-scores in both the training and validation cohorts, the difference was not significant. Rad-score 2 and rad-score 3 had higher predictive efficacy than the clinical model in the training cohort (P<0.05), while rad-score 3 showed better performance than the clinical model in the validation cohort (P <0.05). Detailed results are shown in Table 3.
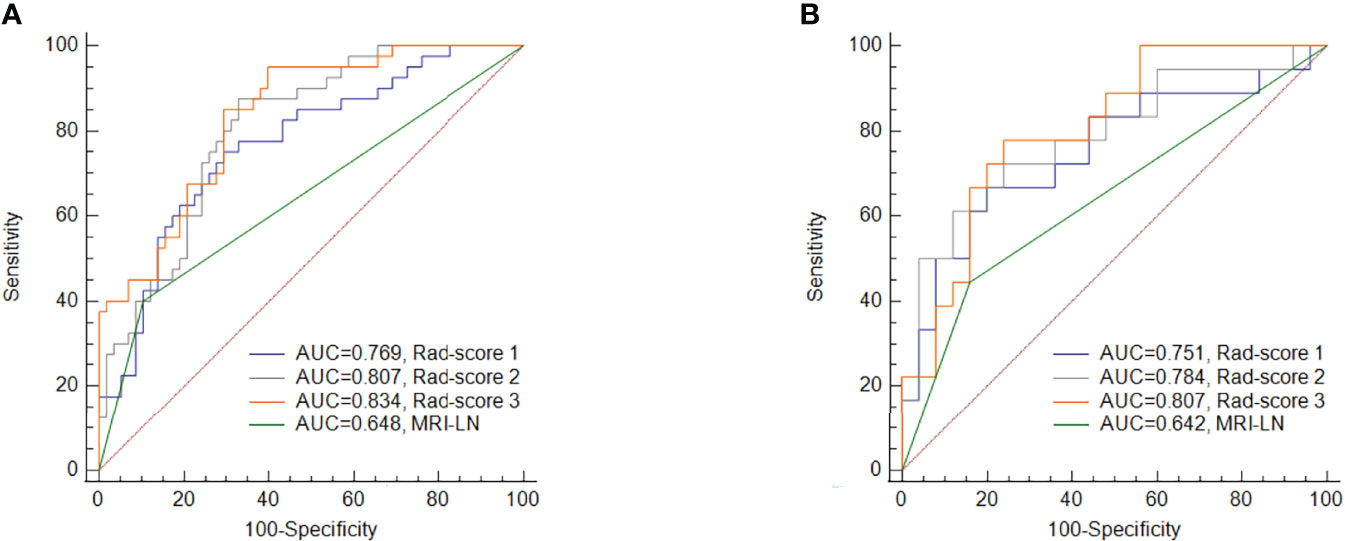
Figure 3 Comparisons of the ROC curves for MRI-reported LN status and the three rad-scores in the training cohort (A) and validation cohort (B). MRI-LN, MRI-reported LN status.
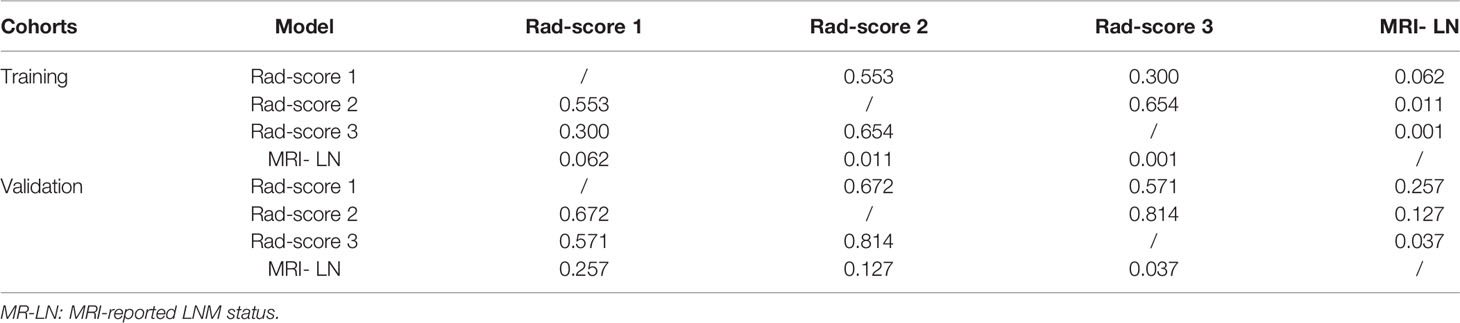
Table 3 Comparison of AUCs among models.
The results of the univariate and multivariate logistic regression analyses are presented in Table 4. Univariate analysis revealed significant differences in the MRI-reported lymph node status and rad-score 3 between LNM and nLNM patients in the training cohort, and they were identified as independent predictors of LNM by multivariate logistic regression analysis. The radiomics nomogram constructed by incorporating independent predictors is shown in Figure 4. The Hosmer–Lemeshow test showed good calibration of the nomogram in both the training and validation cohorts (P=0.938 and 0.924), and the calibration curves exhibited good calibration ability (Figure 5). The AUC values of the nomogram for predicting LNM of PDAC in the training and validation cohorts were 0.845 [95% confidence interval (CI), 0.777-0.907] and 0.816 (95% CI, 0.698-0.914), with AUCs of 0.828 and 0.680 for specificity and AUCs of 0.700 and 0.722 for sensitivity, respectively. ROC curves are shown in Figure 6. The DCA results for the validation cohort are shown in Figure 7. We found that the nomogram can obtain better net benefits than the “treat-all” or “treat-none” strategies under a wide probability threshold.
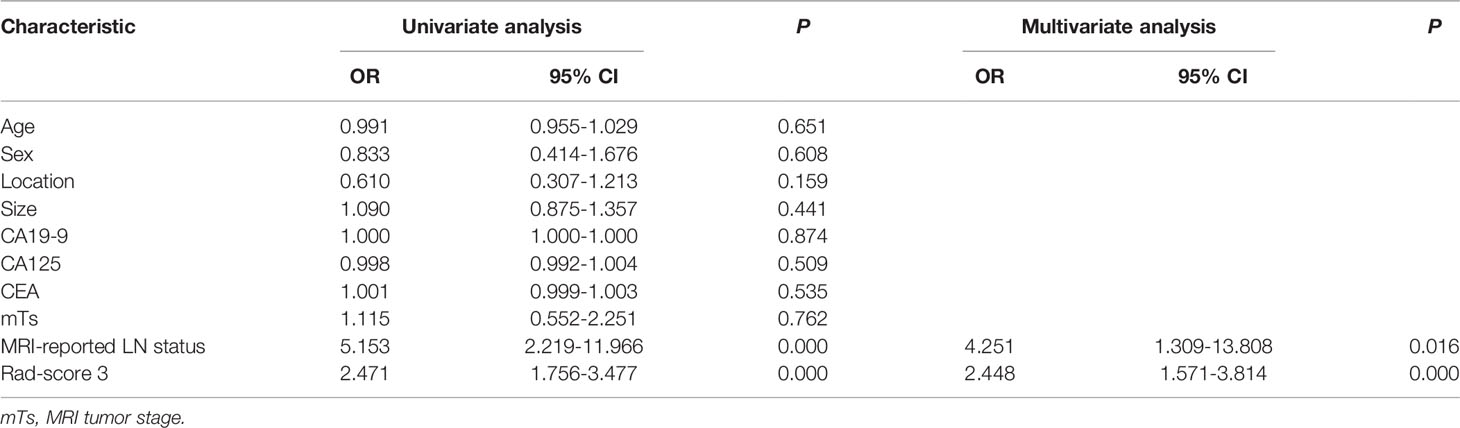
Table 4 Univariate and multivariate logistic regression analyses of the clinical parameters and rad-scores.
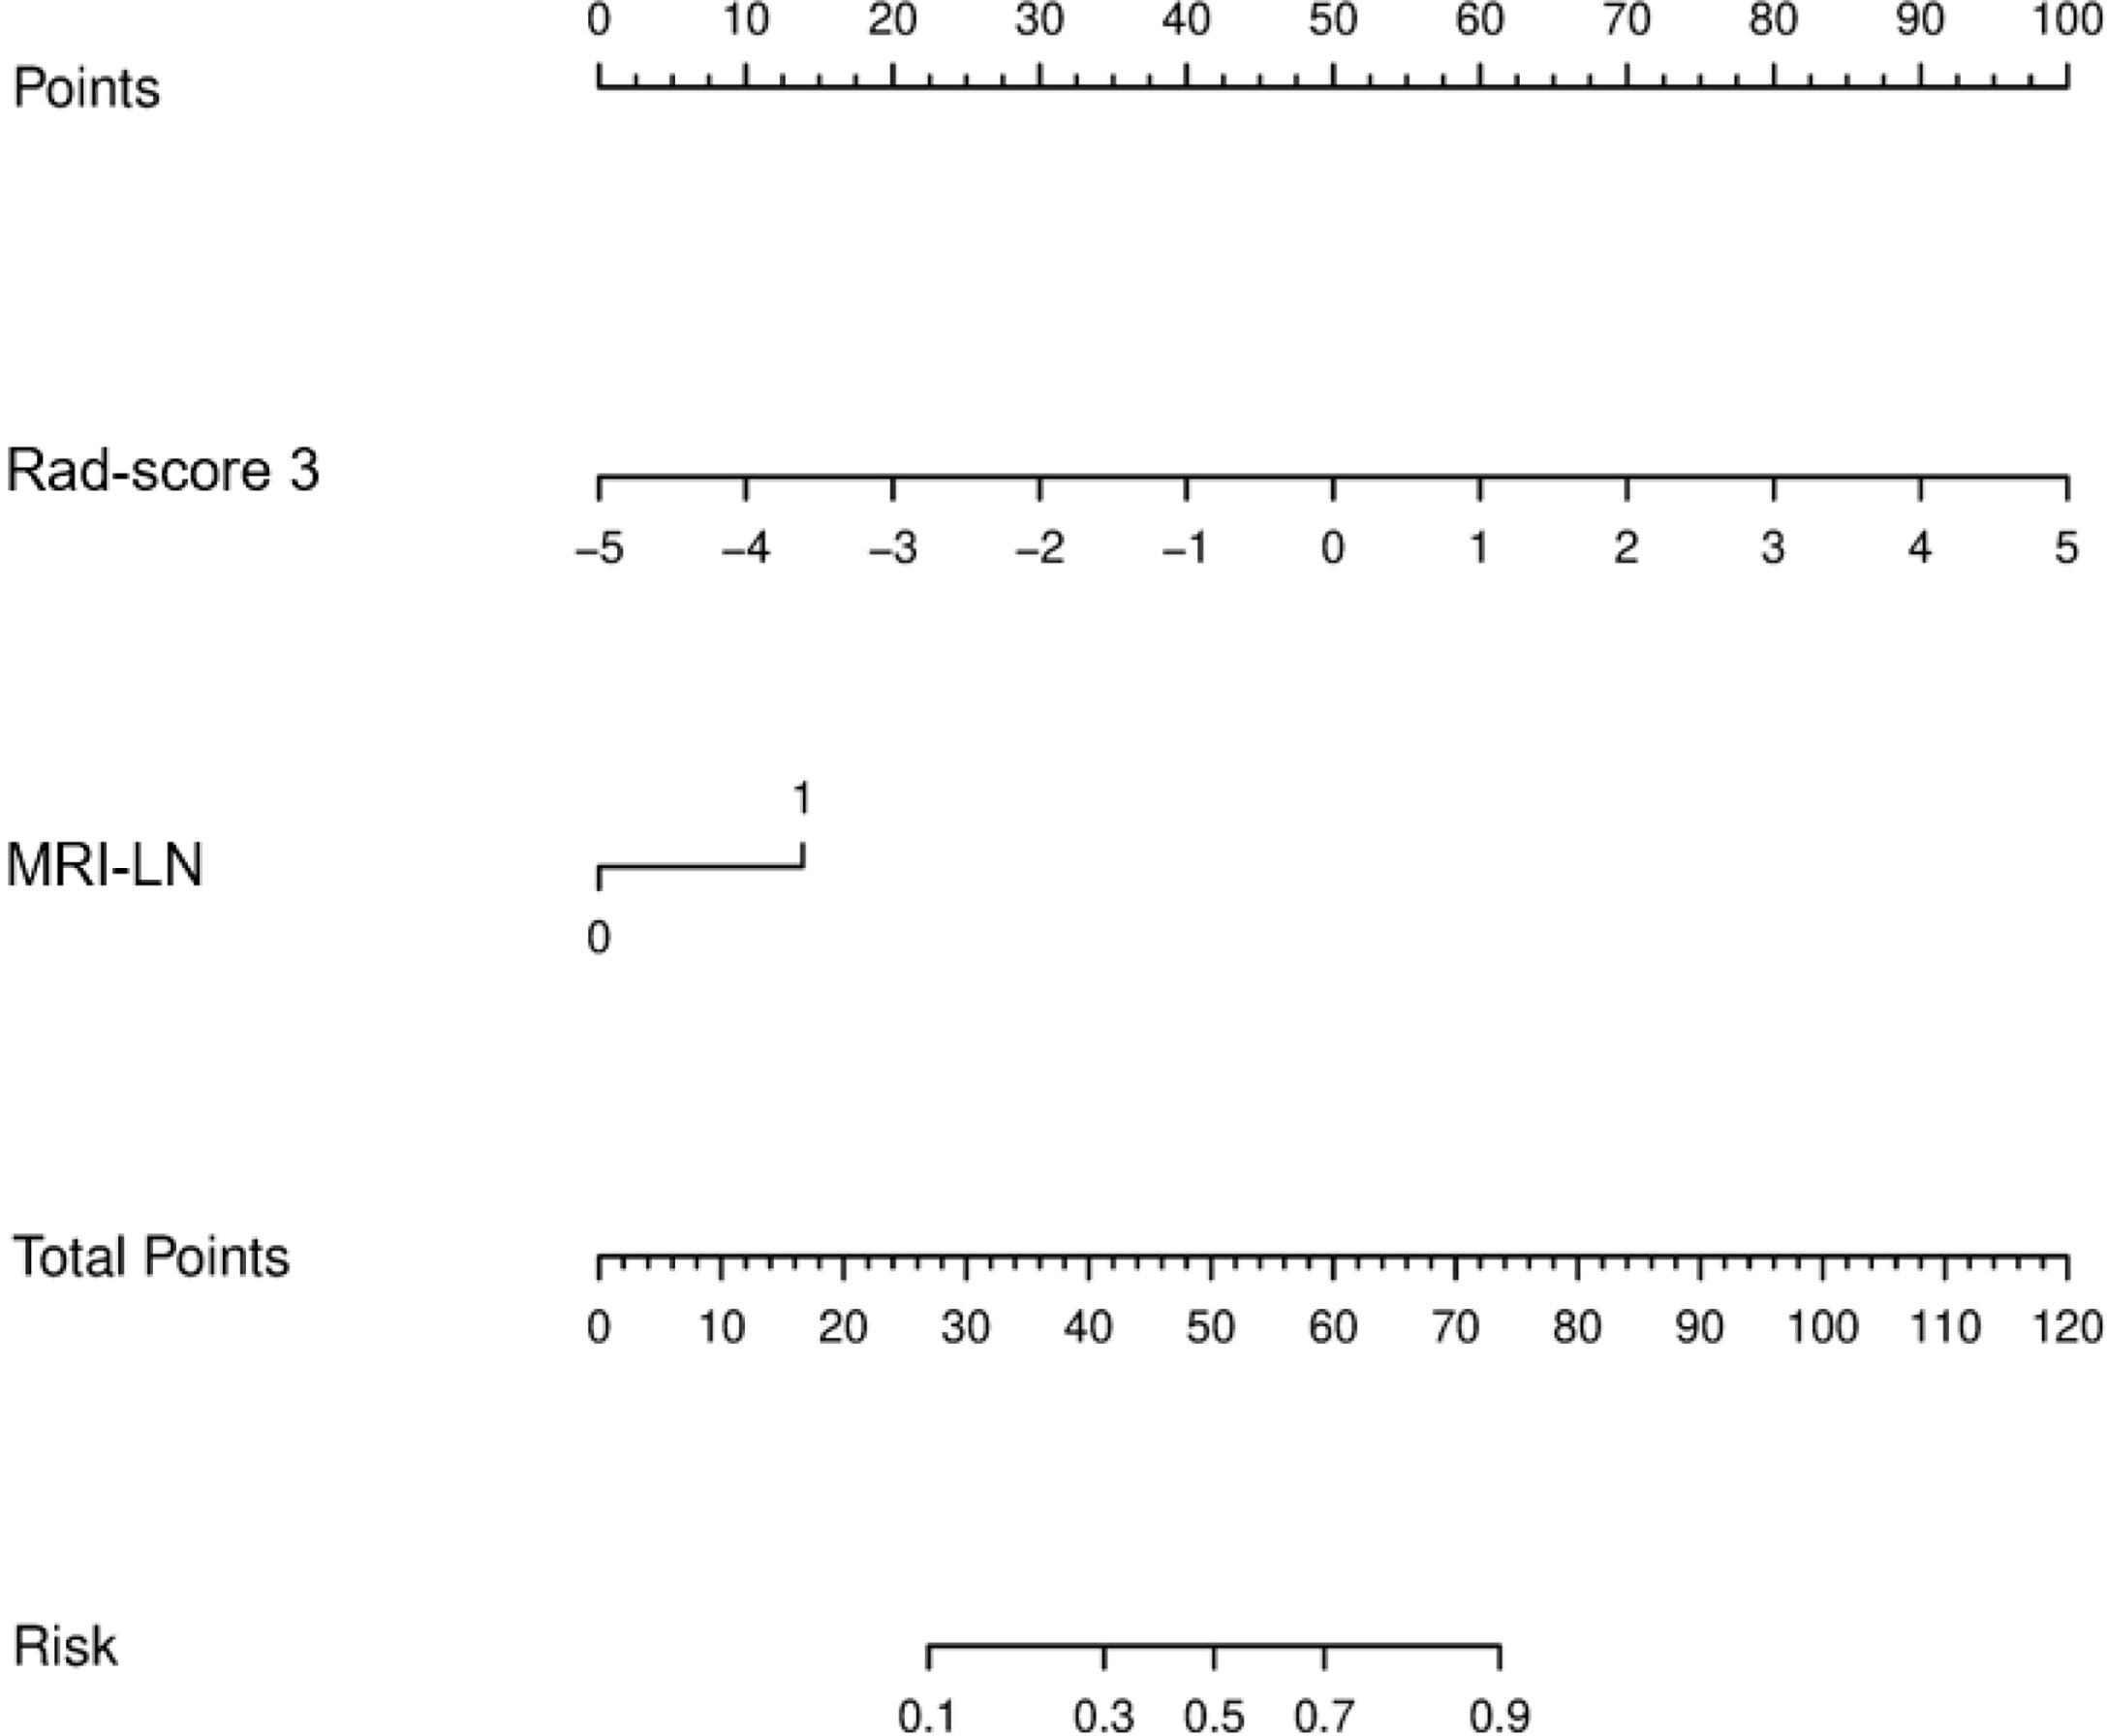
Figure 4 Radiomics nomogram incorporating the MRI-reported LN status and rad-score 3. MRI-LN, MRI-reported LN status.
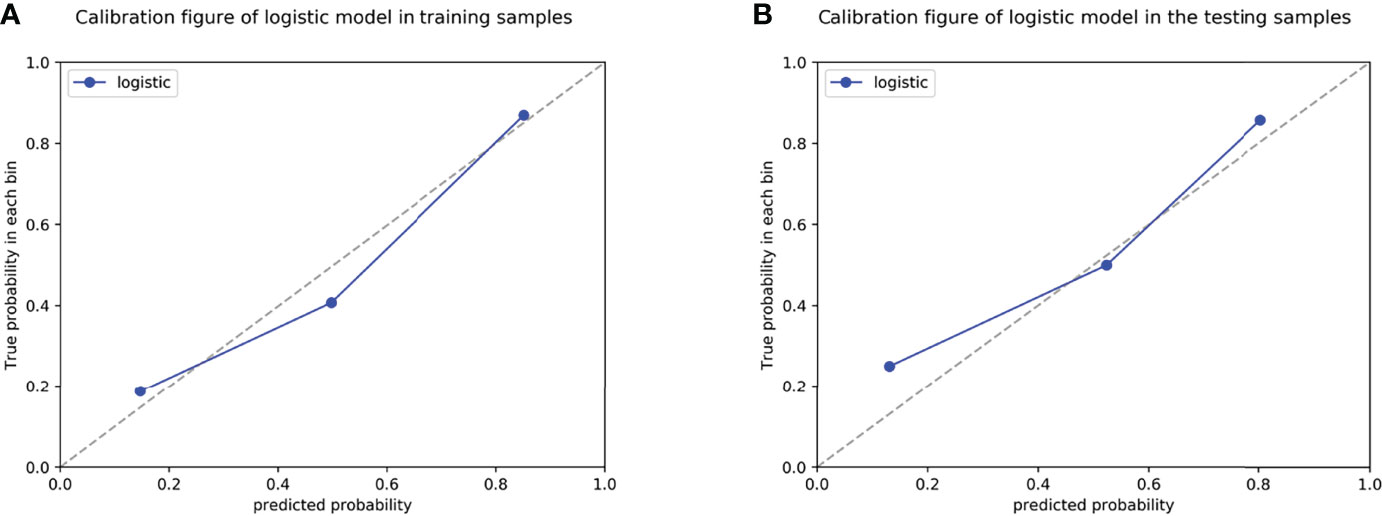
Figure 5 Calibration curves of the radiomics nomogram in the training cohort (A) and validation cohort (B).
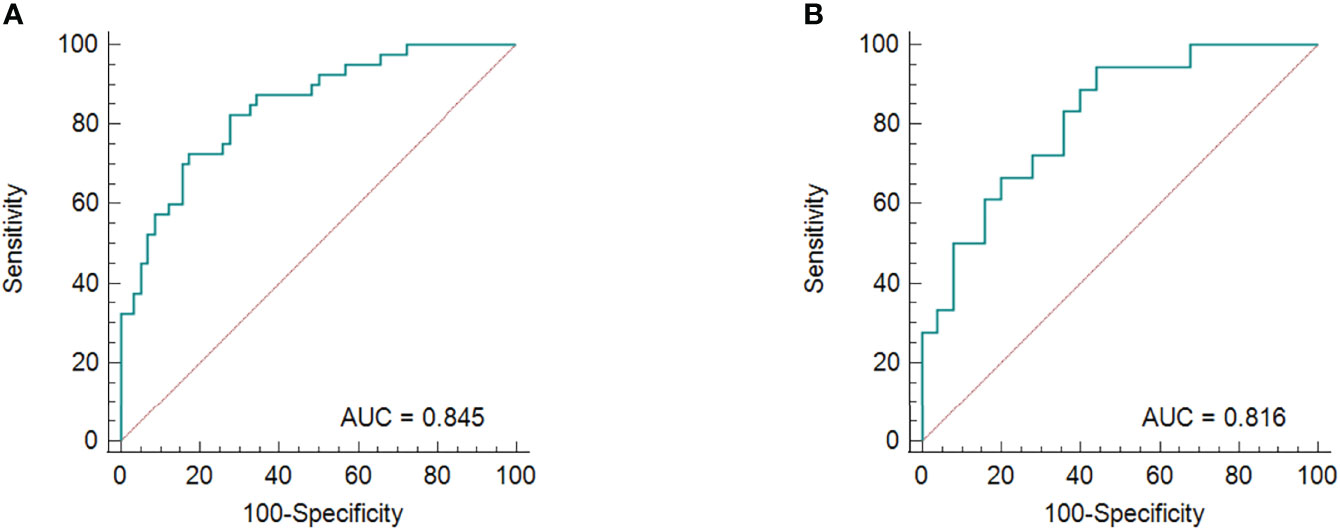
Figure 6 The ROC curves for the radiomics nomogram in the training group (A) and validation cohort (B).
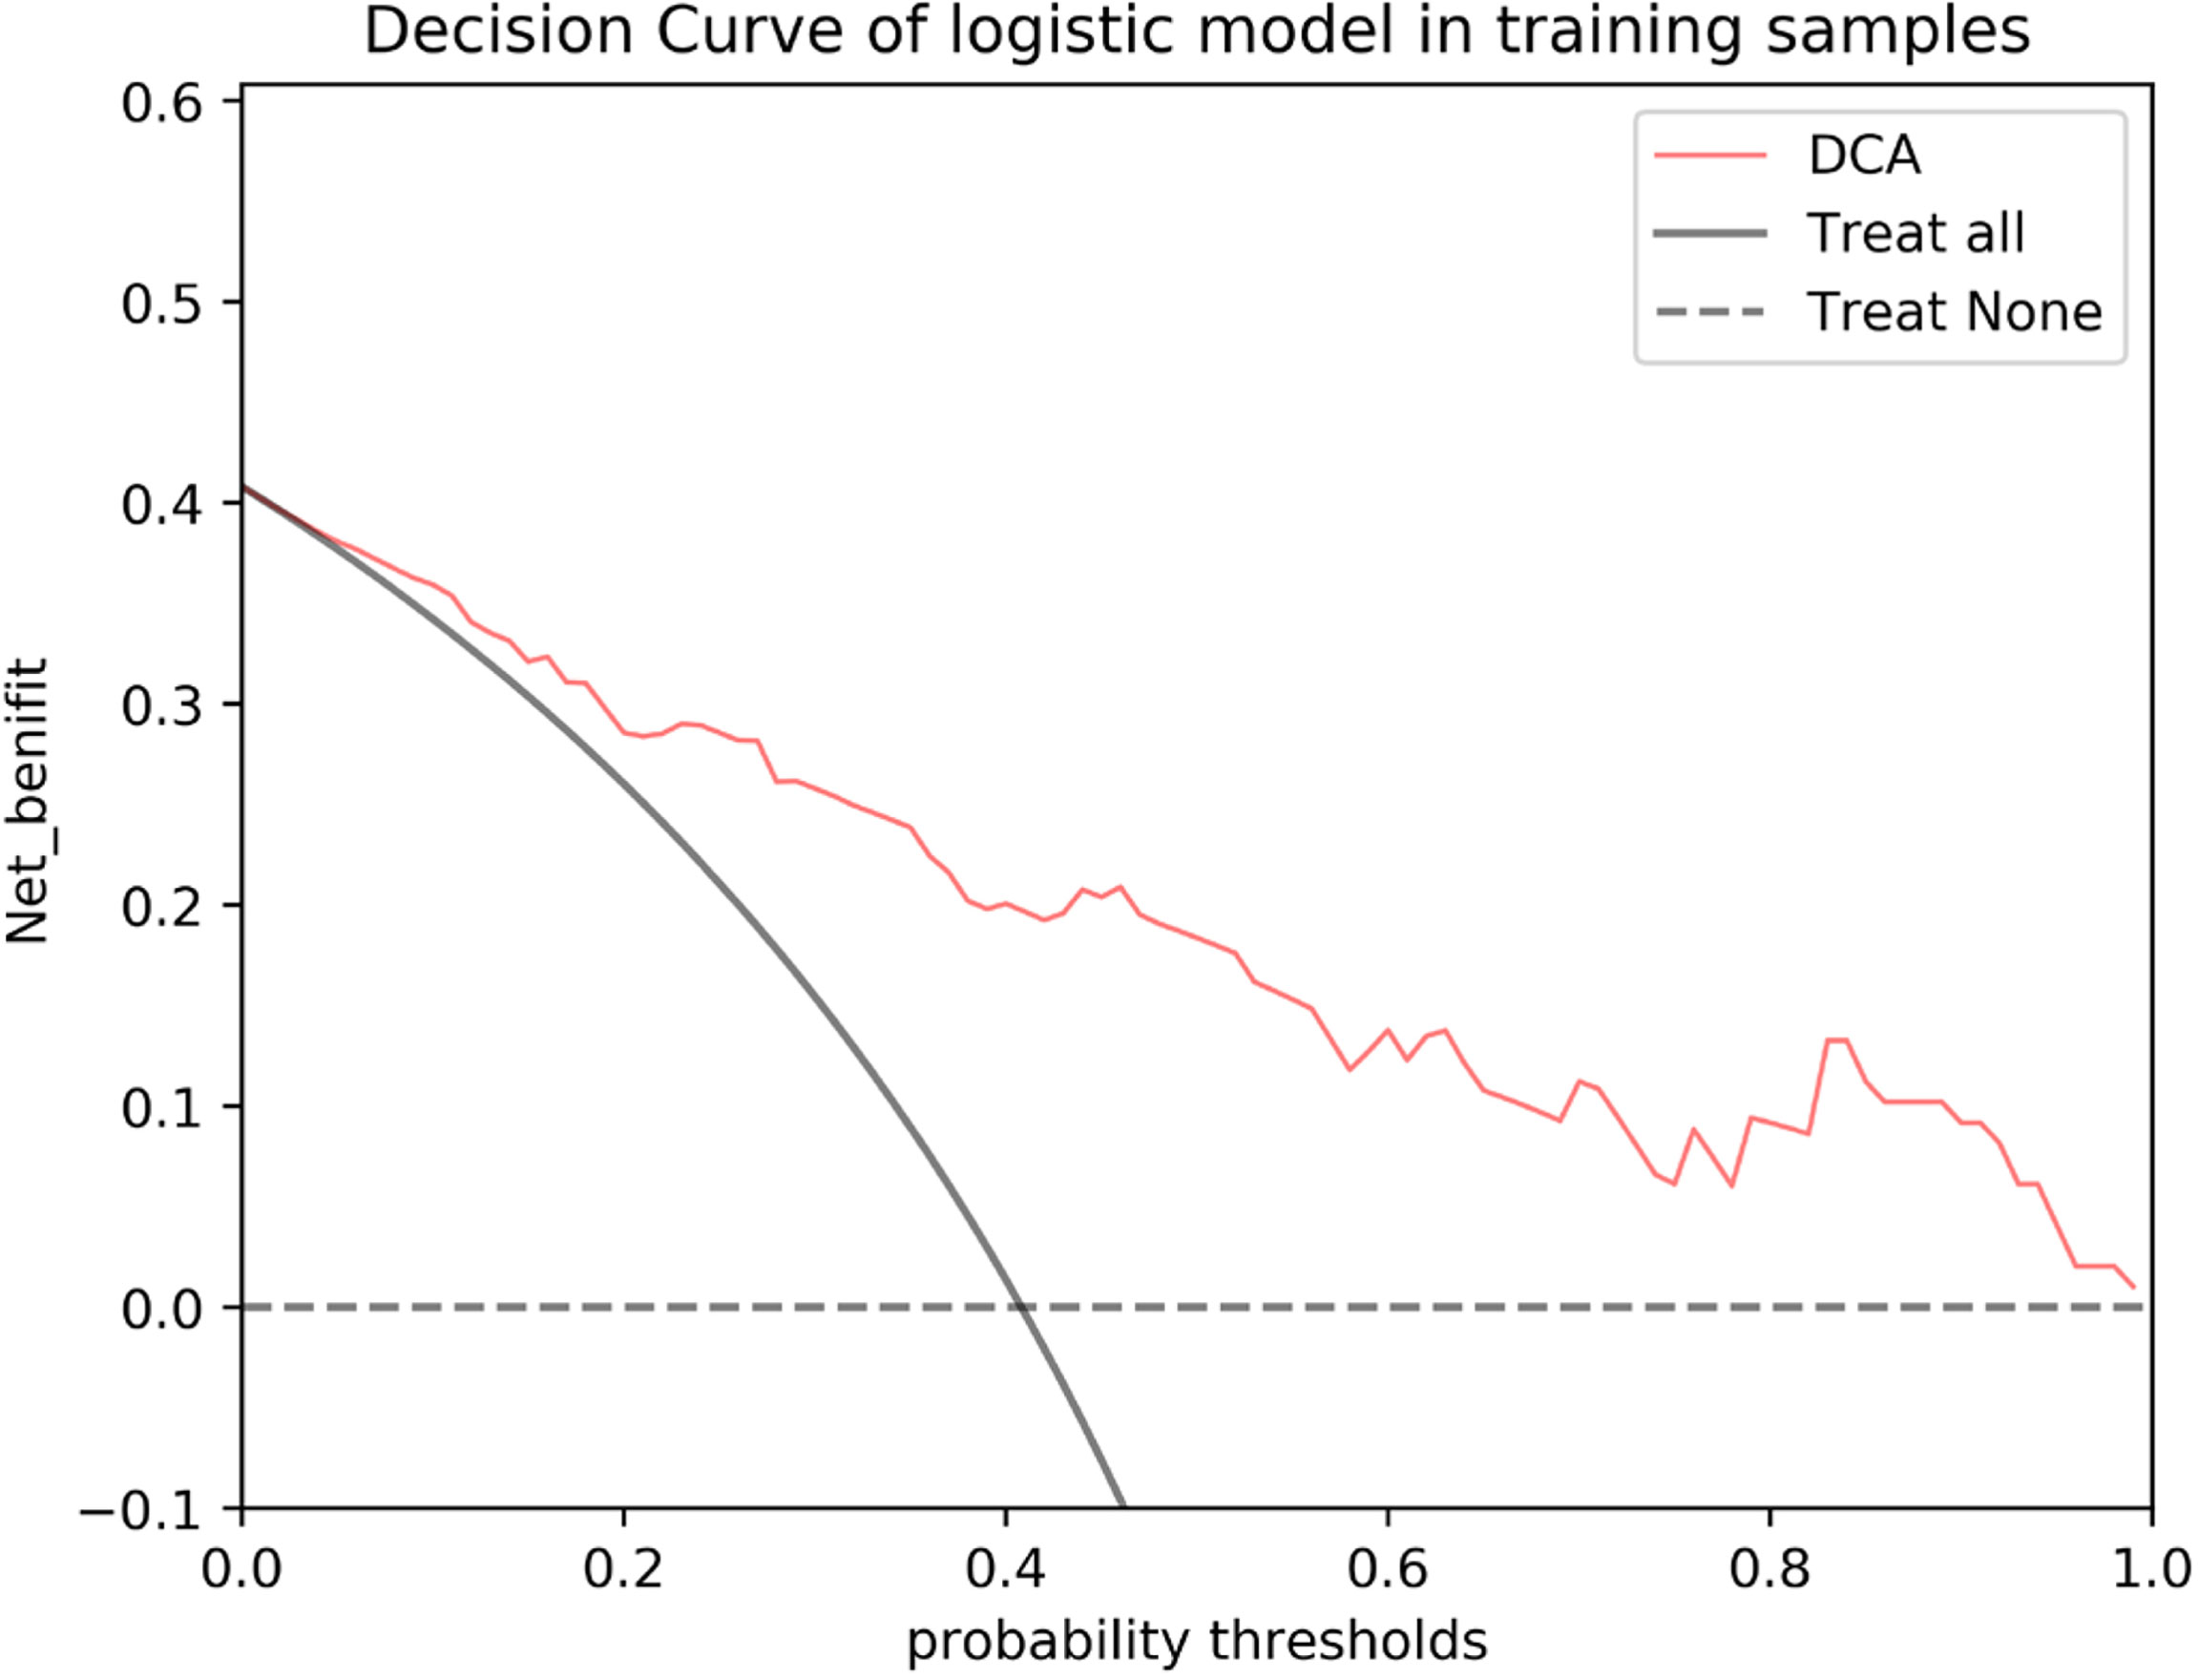
Figure 7 DCA of the nomogram based on MRI-reported LN status and rad-score 3 in the validation cohort. The red line, gray line, and horizontal dotted line represent the net benefit of the nomogram, treat-all strategy, and treat-none strategy, respectively.
PDAC is a gastrointestinal tumor with extremely high malignancy and poor prognosis, which is largely attributed to difficulties in early diagnosis and the limited number of treatment options available for this disease (1). Lymph node status is the key factor in developing appropriate treatment strategies and improving the prognosis of patients (30, 31). However, traditional MRI can only make a preoperative diagnosis of LNM according to the lymph node size, morphology and signal characteristics, which can be subjective, leading to low diagnostic sensitivity (11, 12, 32). In our study, we obtained a sensitivity of 40%, similar to the literature. Moreover, logistic regression analysis showed that MRI-reported lymph node status was the only independent risk factor among all the clinical characteristics analyzed. A previous study reported that CT-reported lymph node status was the only independent risk factor, but it had relatively low predictive efficacy (AUC=0.63) (33). Although the CA19-9 level may predict the prognosis of patients with pancreatic cancer (20, 34, 35), it could not be confirmed as a risk factor for preoperative LNM in our study, which warrants further investigation.
Radiomics is an advanced method for quantitative analysis that can reveal information from microscopic features that are not easily observable by the naked eye in medical imaging (17, 36). In recent years, various studies have attempted to predict LNM based on MRI radiomic analysis of primary lesions (22, 37–43). To the best of our knowledge, only one study has analyzed the predictive efficacy of radiomics based on MRI for LNM of PDAC (43), but only the arterial phase of the T1WI enhanced sequence was used. T2WI can reflect the signal intensity of the tumor tissue and its structure, and the enhanced sequence can better reflect tumor-related information such as internal heterogeneity and vascular regeneration (18–20, 24, 44). Based on the two sequences and by incorporating the independent predictor of MRI-reported lymph node status, we constructed a model with good predictive efficacy, with an AUC of 0.845 in the training cohort. This result is similar to findings reported in previous studies on multiparametric MRI-based radiomics nomograms for predicting LNM of lung adenocarcinoma, bladder cancer, and cervical cancer, with AUCs ranging from 0.820 to 0.856 in the training cohort (37–39).
We delineated a 3D ROI containing comprehensive information (45), and 1037 features were extracted, including high-order features. After dimensionality reduction, we found that rad-score 1 and rad-score 2 mainly consisted of wavelet features (7/8, 5/6), and rad-score 3 consisted only of wavelet features, indicating that wavelet features better reflect the biological characteristics and heterogeneity of tumors. Wavelet filters can help to sharpen the image and eliminate noise (46), and the features of wavelet filters can represent the signal intensity distribution or grayscale distribution in the tissue (47). For example, among the first-order features, “LLH_firstorder_Minimum” and “LLH_firstorder_Mean” describe the minimum and mean gray intensity of the tumor region, respectively, and the difference in the grayscale intensity distribution is shown by “LLL_firstorder_Kurtosis”. In addition, “LLH_glszm_SizeZoneNonUniformity” and “HHH_gldm_DependenceNonUniformityNormalized” represent the heterogeneity of the tumor tissue. “HHH_glszm_SmallAreaEmphasis” is expressed as a greater value with smaller size zones and more fine textures. This study confirmed that “MaximumProbability”, “MaximumProbability” and “MaximumProbability” were the most meaningful among all the GLCM features, showing differences in the regional signal intensity distribution, gray level skewness, uniformity and linear dependency within PDAC tissues with LNM or nLNM tendency (47). The value of some of the wavelet features we obtained has also been confirmed in recent studies on LNM of rectal cancer and cervical cancer, especially the features based on T2WI (21, 24, 48). We also found that only six features from T2WI were retained—fewer than those retained from PVP (eight features). However, the former had a larger AUC score, although the difference was not statistically significant. This may be related to the higher tissue resolution provided by T2WI and greater influence of upper abdominal respiratory artifacts in dynamic enhanced scanning, which requires further studies with histopathology.
There were several limitations to this study. First, the sample size was small, so selection bias may exist. Because this was a single-center study, the application of the radiomics nomogram was limited as well; more data from multicenter and multiple MRI scanners are needed to verify the accuracy and stability of our radiomics model. Second, volume effects and respiratory motion artifacts could not be completely avoided when delineating the tumor boundaries. Third, only the portal vein phase of the multiphase enhancement sequences was analyzed, analyses and comparisons of each phase could be performed to determine their predictive value in future work, DWI sequence could be studied as well.
In conclusion, the results of our study demonstrated that a radiomics nomogram based on dual-parametric MRI imaging could successfully predict LNM and nLNM of PDAC. This method shows higher specificity and sensitivity than traditional MRI can provide, allowing clinicians to be able to prepare more thoroughly before performing surgical procedures. In addition, the use of this nomogram can ultimately improve the prognosis of patients.
The original contributions presented in the study are included in the article/supplementary material. Further inquiries can be directed to the corresponding author.
The studies involving human participants were reviewed and approved by Zhejiang Provincial People’s Hospital, Affiliated People’s Hospital, Hangzhou Medical College. Written informed consent for participation was not required for this study in accordance with the national legislation and the institutional requirements.
JC designed the study and revised the final manuscript. LS and LW analyzed the data and wrote the first draft. GW auxiliary analyzed the data. CW and YZ performed the image acquisition and analyzed the data. All authors contributed to the article and approved the submitted version.
This research was supported by Zhejiang Provincial Natural Science Foundation of China (No. LGC22H180002) and Zhejiang Medical and Health Science and Technology Project (No. 2020KY406, 2021KY508).
Author YW was employed by General Electric Healthcare.
The remaining authors declare that the research was conducted in the absence of any commercial or financial relationships that could be construed as a potential conflict of interest.
All claims expressed in this article are solely those of the authors and do not necessarily represent those of their affiliated organizations, or those of the publisher, the editors and the reviewers. Any product that may be evaluated in this article, or claim that may be made by its manufacturer, is not guaranteed or endorsed by the publisher.
1. Rawla P, Sunkara T, Gaduputi V. Epidemiology of Pancreatic Cancer: Global Trends, Etiology and Risk Factors. World J Oncol (2019) 10(1):10–27. doi: 10.14740/wjon1166
2. Pereira SP, Oldfield L, Ney A, Hart PA, Keane MG, Pandol SJ, et al. Early Detection of Pancreatic Cancer. Lancet Gastroenterol Hepatol (2020) 5(7):698–710. doi: 10.1016/s2468-1253(19)30416-9
3. Saad AM, Turk T, Al-Husseini MJ, Abdel-Rahman O. Trends in Pancreatic Adenocarcinoma Incidence and Mortality in the United States in the Last Four Decades; a SEER-Based Study. BMC Cancer (2018) 18(1):688. doi: 10.1186/s12885-018-4610-4
4. Schwarz RE, Smith DD. Extent of Lymph Node Retrieval and Pancreatic Cancer Survival: Information From a Large US Population Database. Ann Surg Oncol (2006) 13(9):1189–200. doi: 10.1245/s10434-006-9016-x
5. Choi SB, Han HJ, Park P, Kim WB, Song TJ, Choi SY. Systematic Review of the Clinical Significance of Lymph Node Micrometastases of Pancreatic Adenocarcinoma Following Surgical Resection. Pancreatology (2017) 17(3):342–9. doi: 10.1016/j.pan.2017.03.008
6. Tseng DS, van Santvoort HC, Fegrachi S, Besselink MG, Zuithoff NP, Borel Rinkes IH, et al. Diagnostic Accuracy of CT in Assessing Extra-Regional Lymphadenopathy in Pancreatic and Peri-Ampullary Cancer: A Systematic Review and Meta-Analysis. Surg Oncol (2014) 23(4):229–35. doi: 10.1016/j.suronc.2014.10.005
7. Kauhanen SP, Komar G, Seppänen MP, Dean KI, Minn HR, Kajander SA, et al. A Prospective Diagnostic Accuracy Study of 18F-Fluorodeoxyglucose Positron Emission Tomography/Computed Tomography, Multidetector Row Computed Tomography, and Magnetic Resonance Imaging in Primary Diagnosis and Staging of Pancreatic Cancer. Ann Surg (2009) 250(6):957–63. doi: 10.1097/SLA.0b013e3181b2fafa
8. Joo I, Lee JM, Lee DH, Lee ES, Paeng JC, Lee SJ, et al. Preoperative Assessment of Pancreatic Cancer With FDG PET/MR Imaging Versus FDG PET/CT Plus Contrast-Enhanced Multidetector CT: A Prospective Preliminary Study. Radiology (2017) 282(1):149–59. doi: 10.1148/radiol.2016152798
9. Wang S, Shi H, Yang F, Teng X, Jiang B. The Value of (18)F-FDG PET/CT and Carbohydrate Antigen 19-9 in Predicting Lymph Node Micrometastases of Pancreatic Cancer. Abdom Radiol (NY) (2019) 44(12):4057–62. doi: 10.1007/s00261-019-02248-0
10. Masuda T, Dann AM, Elliott IA, Baba H, Kim S, Sedarat A, et al. A Comprehensive Assessment of Accurate Lymph Node Staging and Preoperative Detection in Resected Pancreatic Cancer. J Gastrointest Surg (2018) 22(2):295–302. doi: 10.1007/s11605-017-3607-7
11. Imai H, Doi R, Kanazawa H, Kamo N, Koizumi M, Masui T, et al. Preoperative Assessment of Para-Aortic Lymph Node Metastasis in Patients With Pancreatic Cancer. Int J Clin Oncol (2010) 15(3):294–300. doi: 10.1007/s10147-010-0066-5
12. Zhang Z, Procissi D, Li W, Kim DH, Li K, Han G, et al. High Resolution MRI for non-Invasive Mouse Lymph Node Mapping. J Immunol Methods (2013) 400-401:23–9. doi: 10.1016/j.jim.2013.06.013
13. Matsubayashi H, Matsui T, Yabuuchi Y, Imai K, Tanaka M, Kakushima N, et al. Endoscopic Ultrasonography Guided-Fine Needle Aspiration for the Diagnosis of Solid Pancreaticobiliary Lesions: Clinical Aspects to Improve the Diagnosis. World J Gastroenterol (2016) 22(2):628–40. doi: 10.3748/wjg.v22.i2.628
14. Lee YN, Moon JH, Kim HK, Choi HJ, Lee SH, Choi MH, et al. A Triple Approach for Diagnostic Assessment of Endoscopic Ultrasound-Guided Fine Needle Aspiration in Pancreatic Solid Masses and Lymph Nodes. Dig Dis Sci (2014) 59(9):2286–93. doi: 10.1007/s10620-014-3119-1
15. Wang SC, Parekh JR, Porembka MR, Nathan H, D’Angelica MI, DeMatteo RP, et al. A Pilot Study Evaluating Serum MMP7 as a Preoperative Prognostic Marker for Pancreatic Ductal Adenocarcinoma Patients. J Gastrointest Surg (2016) 20(5):899–904. doi: 10.1007/s11605-015-3057-z
16. Masui T, Sato A, Nakano K, Uchida Y, Yogo A, Anazawa T, et al. Predictive Value of the Ki67 Index for Lymph Node Metastasis of Small non-Functioning Pancreatic Neuroendocrine Neoplasms. Surg Today (2019) 49(7):593–600. doi: 10.1007/s00595-019-01779-9
17. Lambin P, Rios-Velazquez E, Leijenaar R, Carvalho S, van Stiphout RG, Granton P, et al. Radiomics: Extracting More Information From Medical Images Using Advanced Feature Analysis. Eur J Cancer (2012) 48(4):441–6. doi: 10.1016/j.ejca.2011.11.036
18. Jeon SK, Lee JM, Joo I, Lee ES, Park HJ, Jang JY, et al. Nonhypervascular Pancreatic Neuroendocrine Tumors: Differential Diagnosis From Pancreatic Ductal Adenocarcinomas at MR Imaging-Retrospective Cross-Sectional Study. Radiology (2017) 284(1):77–87. doi: 10.1148/radiol.2016160586
19. Eresen A, Yang J, Shangguan J, Li Y, Hu S, Sun C, et al. MRI Radiomics for Early Prediction of Response to Vaccine Therapy in a Transgenic Mouse Model of Pancreatic Ductal Adenocarcinoma. J Transl Med (2020) 18(1):61. doi: 10.1186/s12967-020-02246-7
20. Tang TY, Li X, Zhang Q, Guo CX, Zhang XZ, Lao MY, et al. Development of a Novel Multiparametric MRI Radiomic Nomogram for Preoperative Evaluation of Early Recurrence in Resectable Pancreatic Cancer. J Magn Reson Imaging (2020) 52(1):231–45. doi: 10.1002/jmri.27024
21. Li C, Yin J. Radiomics Based on T2-Weighted Imaging and Apparent Diffusion Coefficient Images for Preoperative Evaluation of Lymph Node Metastasis in Rectal Cancer Patients. Front Oncol (2021) 11:671354. doi: 10.3389/fonc.2021.671354
22. Zhang K, Zhang Y, Fang X, Fang M, Shi B, Dong J, et al. Nomograms of Combining Apparent Diffusion Coefficient Value and Radiomics for Preoperative Risk Evaluation in Endometrial Carcinoma. Front Oncol (2021) 11:705456. doi: 10.3389/fonc.2021.705456
23. Calabrese A, Santucci D, Landi R, Beomonte Zobel B, Faiella E, de Felice C. Radiomics MRI for Lymph Node Status Prediction in Breast Cancer Patients: The State of Art. J Cancer Res Clin Oncol (2021) 147(6):1587–97. doi: 10.1007/s00432-021-03606-6
24. Deng X, Liu M, Sun J, Li M, Liu D, Li L, et al. Feasibility of MRI-Based Radiomics Features for Predicting Lymph Node Metastases and VEGF Expression in Cervical Cancer. Eur J Radiol (2021) 134:109429. doi: 10.1016/j.ejrad.2020.109429
25. Lee JH, Han SS, Hong EK, Cho HJ, Joo J, Park EY, et al. Predicting Lymph Node Metastasis in Pancreatobiliary Cancer With Magnetic Resonance Imaging: A Prospective Analysis. Eur J Radiol (2019) 116:1–7. doi: 10.1016/j.ejrad.2019.04.007
26. Yushkevich PA, Piven J, Hazlett HC, Smith RG, Ho S, Gee JC, et al. User-Guided 3D Active Contour Segmentation of Anatomical Structures: Significantly Improved Efficiency and Reliability. Neuroimage (2006) 31(3):1116–28. doi: 10.1016/j.neuroimage.2006.01.015
27. Zwanenburg A, Vallières M, Abdalah MA, Aerts H, Andrearczyk V, Apte A, et al. The Image Biomarker Standardization Initiative: Standardized Quantitative Radiomics for High-Throughput Image-Based Phenotyping. Radiology (2020) 295(2):328–38. doi: 10.1148/radiol.2020191145
28. Yang L, Liu D, Fang X, Wang Z, Xing Y, Ma L, et al. Rectal Cancer: Can T2WI Histogram of the Primary Tumor Help Predict the Existence of Lymph Node Metastasis? Eur Radiol (2019) 29(12):6469–76. doi: 10.1007/s00330-019-06328-z
29. Vickers AJ, Cronin AM, Elkin EB, Gonen M. Extensions to Decision Curve Analysis, a Novel Method for Evaluating Diagnostic Tests, Prediction Models and Molecular Markers. BMC Med Inform Decis Mak (2008) 8:53. doi: 10.1186/1472-6947-8-53
30. Strobel O, Hinz U, Gluth A, Hank T, Hackert T, Bergmann F, et al. Pancreatic Adenocarcinoma: Number of Positive Nodes Allows to Distinguish Several N Categories. Ann Surg (2015) 261(5):961–9. doi: 10.1097/sla.0000000000000814
31. Hoshikawa M, Ogata S, Nishikawa M, Kimura A, Einama T, Noro T, et al. Pathomorphological Features of Metastatic Lymph Nodes as Predictors of Postoperative Prognosis in Pancreatic Cancer. Med (Baltimore) (2019) 98(5):e14369. doi: 10.1097/md.0000000000014369
32. Loch FN, Asbach P, Haas M, Seeliger H, Beyer K, Schineis C, et al. Accuracy of Various Criteria for Lymph Node Staging in Ductal Adenocarcinoma of the Pancreatic Head by Computed Tomography and Magnetic Resonance Imaging. World J Surg Oncol (2020) 18(1):213. doi: 10.1186/s12957-020-01951-3
33. Liang X, Cai W, Liu X, Jin M, Ruan L, Yan S. A Radiomics Model That Predicts Lymph Node Status in Pancreatic Cancer to Guide Clinical Decision Making: A Retrospective Study. J Cancer (2021) 12(20):6050–7. doi: 10.7150/jca.61101
34. Azizian A, Rühlmann F, Krause T, Bernhardt M, Jo P, König A, et al. CA19-9 for Detecting Recurrence of Pancreatic Cancer. Sci Rep (2020) 10(1):1332. doi: 10.1038/s41598-020-57930-x
35. Ye C, Sadula A, Ren S, Guo X, Yuan M, Yuan C, et al. The Prognostic Value of CA19-9 Response After Neoadjuvant Therapy in Patients With Pancreatic Cancer: A Systematic Review and Pooled Analysis. Cancer Chemother Pharmacol (2020) 86(6):731–40. doi: 10.1007/s00280-020-04165-2
36. Liu Z, Wang S, Dong D, Wei J, Fang C, Zhou X, et al. The Applications of Radiomics in Precision Diagnosis and Treatment of Oncology: Opportunities and Challenges. Theranostics (2019) 9(5):1303–22. doi: 10.7150/thno.30309
37. Ran J, Cao R, Cai J, Yu T, Zhao D, Wang Z. Development and Validation of a Nomogram for Preoperative Prediction of Lymph Node Metastasis in Lung Adenocarcinoma Based on Radiomics Signature and Deep Learning Signature. Front Oncol (2021) 11:585942. doi: 10.3389/fonc.2021.585942
38. Liu X, Liang X, Ruan L, Yan S. A Clinical-Radiomics Nomogram for Preoperative Prediction of Lymph Node Metastasis in Gallbladder Cancer. Front Oncol (2021) 11:633852. doi: 10.3389/fonc.2021.633852
39. Xiao M, Ma F, Li Y, Li Y, Li M, Zhang G, et al. Multiparametric MRI-Based Radiomics Nomogram for Predicting Lymph Node Metastasis in Early-Stage Cervical Cancer. J Magn Reson Imaging (2020) 52(3):885–96. doi: 10.1002/jmri.27101
40. Yu Y, He Z, Ouyang J, Tan Y, Chen Y, Gu Y, et al. Magnetic Resonance Imaging Radiomics Predicts Preoperative Axillary Lymph Node Metastasis to Support Surgical Decisions and is Associated With Tumor Microenvironment in Invasive Breast Cancer: A Machine Learning, Multicenter Study. EBioMedicine (2021) 69:103460. doi: 10.1016/j.ebiom.2021.103460
41. Yang YS, Feng F, Qiu YJ, Zheng GH, Ge YQ, Wang YT. High-Resolution MRI-Based Radiomics Analysis to Predict Lymph Node Metastasis and Tumor Deposits Respectively in Rectal Cancer. Abdom Radiol (NY) (2021) 46(3):873–84. doi: 10.1007/s00261-020-02733-x
42. Wang F, Tan R, Feng K, Hu J, Zhuang Z, Wang C, et al. Magnetic Resonance Imaging-Based Radiomics Features Associated With Depth of Invasion Predicted Lymph Node Metastasis and Prognosis in Tongue Cancer. J Magn Reson Imaging (2021) 56(1):196–209. doi: 10.1002/jmri.28019
43. Shi Z, Ma C, Huang X, Cao D. Magnetic Resonance Imaging Radiomics-Based Nomogram From Primary Tumor for Pretreatment Prediction of Peripancreatic Lymph Node Metastasis in Pancreatic Ductal Adenocarcinoma: A Multicenter Study. J Magn Reson Imaging (2022) 55(3):823–39. doi: 10.1002/jmri.28048
44. Nie K, Shi L, Chen Q, Hu X, Jabbour SK, Yue N, et al. Rectal Cancer: Assessment of Neoadjuvant Chemoradiation Outcome Based on Radiomics of Multiparametric MRI. Clin Cancer Res (2016) 22(21):5256–64. doi: 10.1158/1078-0432.Ccr-15-2997
45. Ng F, Kozarski R, Ganeshan B, Goh V. Assessment of Tumor Heterogeneity by CT Texture Analysis: Can the Largest Cross-Sectional Area be Used as an Alternative to Whole Tumor Analysis? Eur J Radiol (2013) 82(2):342–8. doi: 10.1016/j.ejrad.2012.10.023
46. Qian Z, Li Y, Wang Y, Li L, Li R, Wang K, et al. Differentiation of Glioblastoma From Solitary Brain Metastases Using Radiomic Machine-Learning Classifiers. Cancer Lett (2019) 451:128–35. doi: 10.1016/j.canlet.2019.02.054
47. Van Griethuysen JJM, Fedorov A, Parmar C, Hosny A, Aucoin N, Narayan V, et al. Computational Radiomics System to Decode the Radiographic Phenotype. Cancer Res (2017) 77(21):e104–e7. doi: 10.1158/0008-5472.Can-17-0339
Keywords: pancreatic ductal adenocarcinoma, magnetic resonance imaging, radiomics, lymph node metastasis, nomogram
Citation: Shi L, Wang L, Wu C, Wei Y, Zhang Y and Chen J (2022) Preoperative Prediction of Lymph Node Metastasis of Pancreatic Ductal Adenocarcinoma Based on a Radiomics Nomogram of Dual-Parametric MRI Imaging. Front. Oncol. 12:927077. doi: 10.3389/fonc.2022.927077
Received: 23 April 2022; Accepted: 06 June 2022;
Published: 06 July 2022.
Edited by:
Jiansong Ji, Lishui Central Hospital, ChinaReviewed by:
Gaofeng Shu, Wenzhou Medical University, ChinaCopyright © 2022 Shi, Wang, Wu, Wei, Zhang and Chen. This is an open-access article distributed under the terms of the Creative Commons Attribution License (CC BY). The use, distribution or reproduction in other forums is permitted, provided the original author(s) and the copyright owner(s) are credited and that the original publication in this journal is cited, in accordance with accepted academic practice. No use, distribution or reproduction is permitted which does not comply with these terms.
*Correspondence: Junfa Chen, Y2pmMjAwMkAxMjYuY29t
†These authors have contributed equally to this work
Disclaimer: All claims expressed in this article are solely those of the authors and do not necessarily represent those of their affiliated organizations, or those of the publisher, the editors and the reviewers. Any product that may be evaluated in this article or claim that may be made by its manufacturer is not guaranteed or endorsed by the publisher.
Research integrity at Frontiers
Learn more about the work of our research integrity team to safeguard the quality of each article we publish.