
94% of researchers rate our articles as excellent or good
Learn more about the work of our research integrity team to safeguard the quality of each article we publish.
Find out more
ORIGINAL RESEARCH article
Front. Oncol., 07 July 2022
Sec. Cancer Imaging and Image-directed Interventions
Volume 12 - 2022 | https://doi.org/10.3389/fonc.2022.915871
This article is part of the Research TopicDeep Learning Approaches in Image-guided Diagnosis for TumorsView all 14 articles
 Ming-li Ouyang1†Rui-xuan Zheng1†
 Yi-ran Wang2
 Zi-yi Zuo1Liu-dan Gu1
 Yu-qian Tian1Yu-guo Wei3
 Xiao-ying Huang1*
 Kun Tang4*
 Liang-xing Wang1*
Introduction: The aim of this work was to determine the feasibility of using a deep learning approach to predict occult lymph node metastasis (OLM) based on preoperative FDG-PET/CT images in patients with clinical node-negative (cN0) lung adenocarcinoma.
Materials and Methods: Dataset 1 (for training and internal validation) included 376 consecutive patients with cN0 lung adenocarcinoma from our hospital between May 2012 and May 2021. Dataset 2 (for prospective test) used 58 consecutive patients with cN0 lung adenocarcinoma from June 2021 to February 2022 at the same center. Three deep learning models: PET alone, CT alone, and combined model, were developed for the prediction of OLM. The performance of the models was evaluated on internal validation and prospective test in terms of accuracy, sensitivity, specificity, and areas under the receiver operating characteristic curve (AUCs).
Results: The combined model incorporating PET and CT showed the best performance, achieved an AUC of 0.81 [95% confidence interval (CI): 0.61, 1.00] in the prediction of OLM in internal validation set (n = 60) and an AUC of 0.87 (95% CI: 0.75, 0.99) in the prospective test set (n = 58). The model achieved 87.50% sensitivity, 80.00% specificity, and 81.00% accuracy in the internal validation set and achieved 75.00% sensitivity, 88.46% specificity, and 86.60% accuracy in the prospective test set.
Conclusion: This study presented a deep learning approach to enable the prediction of occult nodal involvement based on the PET/CT images before surgery in cN0 lung adenocarcinoma, which would help clinicians select patients who would be suitable for sublobar resection.
Lung cancer is one of the most common malignancies and the leading cause of death from cancer worldwide (1). Lung adenocarcinoma (LUAD) is the most common histologic subtype of lung cancer (2). Currently, lobectomy with systemic nodal dissection is the standard treatment for patients with early-stage non–small cell lung cancer (NSCLC) (3), and recently, limited surgery (wedge resection or segmentectomy) has also been performed to preserve healthy lung tissue (4–6). Accurate staging to confirm node-negative (N0) status is required for limited surgery. If N0 status is unreliable, then lobectomy with systemic nodal dissection rather than limited surgery is mandatory. 18F-fluorodeoxyglucose positron emission tomography/computed tomography (18F-FDG PET/CT) is a valuable imaging modality for evaluation of lymph node (LN) or distant metastasis of lung cancers. Although PET/CT is more sensitive to assess LN status than traditional examinations, occult LN metastasis (OLM) still occurs at a high rate (14%–21%) (7–9). The definition for OLM was that clinical N0 (cN0) staged by PET/CT was pathologically confirmed LN metastasis (LNM) after surgery. Thus, there is a strong need to develop reliable non-invasive methods to identify patients with OLM from cN0 patients staged by PET/CT.
In recent years, radiomics has received increasing attention, and it is a technique for high-throughput extraction of quantitative features from medical images (10, 11). Indeed, many studies have exhibited that quantitative radiomic image features of the primary tumor could be used as non-invasive biomarkers to predict LNM and were good predictive performance (12–14). For OLM of LUAD, Zhong et al. (15) reported that the radiomics signature of the primary tumor based on CT scans had a significant predictive value. Our previous research (16) found that a PET-based radiomics model had achieved success in the prediction of OLM in patients with LUAD. However, traditional radiomic methods are based on four time-consuming and complex steps (tumor segmentation, feature extraction, feature selection, and modeling). Moreover, observer-dependent differences may cause poor repeatability in case of manual segmentation.
Deep learning is a new and especially promising approach that automatically learns powerful feature representations from images, text, or sound and has been shown to sometimes surpass human-level performance in task-specific applications (17–19). Compared with the conventional radiomic methods, the deep learning method simplifies the analysis process and avoids subjective bias because it does not require VOI definition or segmentation. More recently, the deep learning method using convolutional neural network (CNN) has been widely applied to analyze medical images and has been effective in diseases detection and classification (20–22). For classifying LN, Zhao et al. (23) developed a cross-modal deep learning system based on CT images to accurately predict LN metastasis in stage T1 LUADs. Tau et al. (24) reported that using a CNN to analyze PET images can yield a reasonably good prediction of nodal metastasis in patients with NSCLC. In view of the fact that previous studies predicted LN metastasis using deep learning, we hypothesized that deep learning based on PET/CT images might play an important role in predicting OLM.
Hence, the purpose of this study was to evaluate the capability of deep learning analysis based on a two-dimensional (2D) CNN architecture for the prediction of OLM through the use of preoperative FDG-PET/CT images of cN0 LUAD.
A total of 434 patients (193 men and 241 women) with cN0 LUAD who had pretreatment FDG PET/CT and underwent surgical resection with the systematic LN dissection from May 2012 to February 2022 were enrolled in this study at The First Affiliated Hospital of Wenzhou Medical University. Among these patients, 343 (79.0%) were pN0 after surgery and pathological examination. In other words, the prevalence of OLM with PET/CT was 21.0% in LUAD, which is basically consistent with previous studies (7–9). The criteria for cN0 on PET/CT was all LNs’ short-axis diameter of less than 10 mm without FDG uptake higher than the surrounding background (25). The interval between PET/CT scan and surgery was shorter than 3 weeks in all patients. The exclusion criteria for patients were as follows: (I) history of other malignancy; (II) distant metastasis; (III) multiple lesions; (IV) neoadjuvant chemotherapy/radiotherapy; (V) images with poor quality due to the leakage of 18F-FDG at the injection site, low signal-to-noise ratio, respiratory artifacts, and other movement artifacts. Staging was performed according to the eighth edition of the Union for International Cancer Control TNM classification.
Dataset 1 included 376 consecutive patients from our Hospital between May 2012 and May 2021. Dataset 2 used 58 consecutive patients from June 2021 to February 2022 at the same center. Sixty patients from dataset 1 were randomly allocated to the internal validation dataset, and the remaining 316 patients were assigned to the training set. Dataset 2 was taken as an independent set for the prospective test. The prospective test is a more powerful method for evaluating the model performance than random splitting of a single set or cross-validation because it allows for non-random variation between sets (26). A flowchart of patient selection is shown in Figure 1.
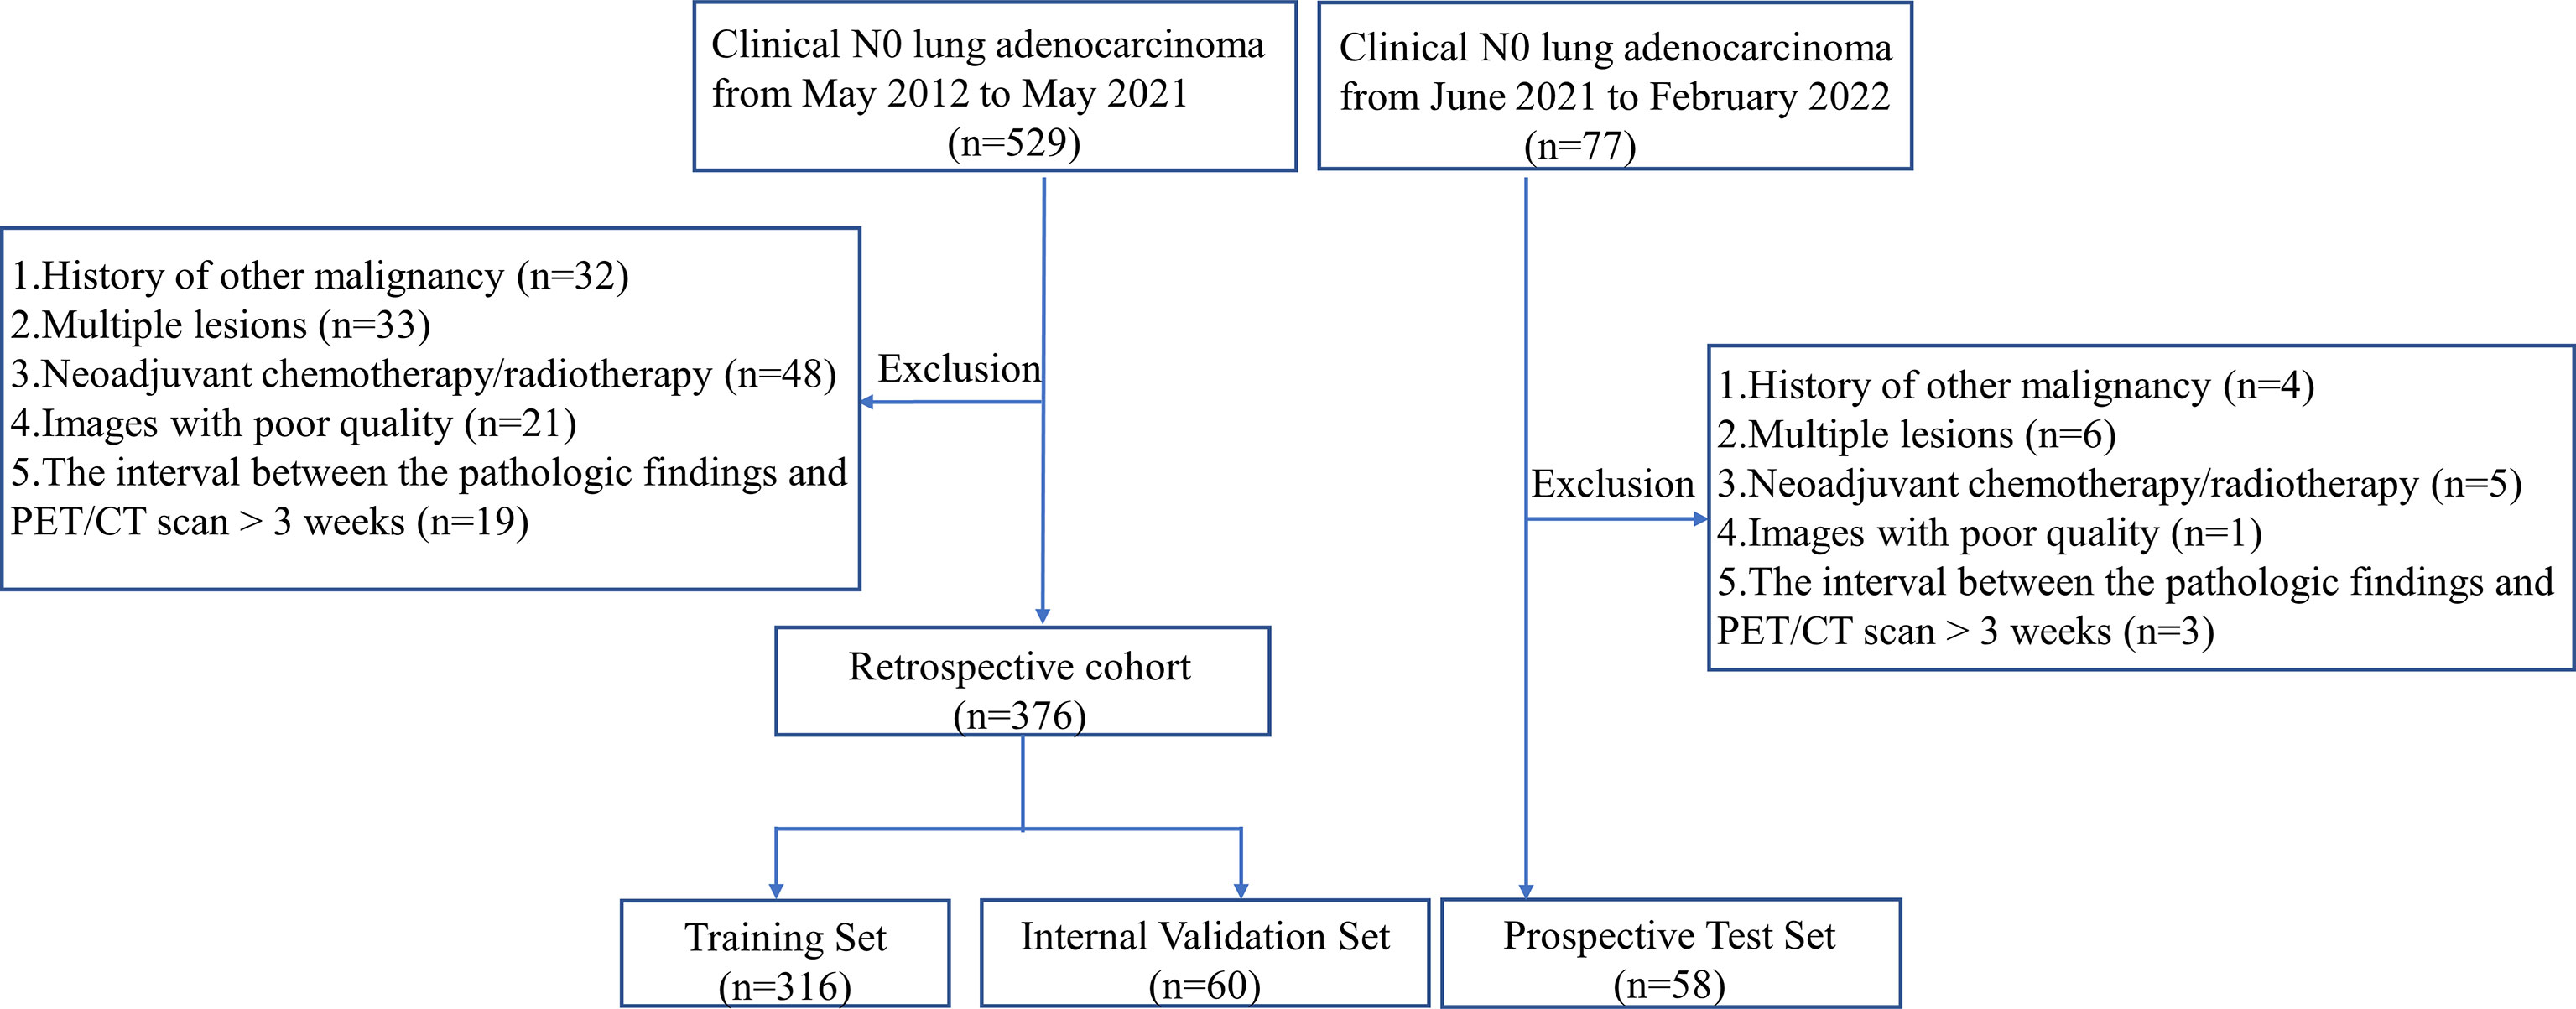
Figure 1 The flowchart of the patient selection.
This study was approved by the Institutional Review Board of our hospital. Informed consent from the retrospective patients was waived, and written informed consent was provided for patients in prospective test set.
An integrated PET/CT scanner (GEMINI TF 64; Philips, The Netherlands) was used for all patients. At least 6-h fasting and serum glucose levels below 110 ml/dl were required before being injected with 18F-FDG (3.7 MBq/kg). Sixty minutes after intravenous injection, the body was scanned in the supine position. A low-dose unenhanced CT scan from skull base to the middle thighs was obtained with the following parameters: 120 kV, 80 mA, pitch of 0.829, and reconstruction thickness and interval of 5.0 mm. After CT completion, PET images were acquired by using the 3D model with the following parameters: field of view of 576 mm, a matrix of 144 × 144, slice thickness and interval of 5.0 mm, and an emission scan time of each bed position of 1.5 min. PET images were iteratively reconstructed by the ordered subset expectation maximization algorithm, using CT image for attenuation correction.
FDG uptake at the primary tumor site was identified on PET images with reference to the CT part of PET-CT. Reconstruction in the sagittal and coronal planes was done from the axial images. Slices with the largest tumor area were selected in axial, coronal, and sagittal planes of PET and CT images. To reduce the computational expense and improve model’s accuracy, all selected images were cropped to contain only the entire chest as much as possible. Then, the images were converted from the Digital Imaging and Communications in Medicine to Joint Photographic Experts Group format pictures. Subsequently, we resized the images to 299 × 299 pixels and normalized the pixel values to a range of 0 to 1.
There was a higher frequency of OLM negative (OLMN). To overcome the imbalance problem between the two groups (positive or negative), we applied three times oversampling for positive samples and two times oversampling for negative samples to ensure the ratio of the two groups near 1:1. Furthermore, image augmentation, including image rotation and flipping for total of four times, was performed on the training dataset.
Respective model (PET or CT): The deep CNN model used was the Inception V3 architecture in this study (27). Transfer learning was applied using weights pretrained on the ImageNet dataset. We arranged three channels (299 × 299 × 3 pixels) in the input layer. Three 2D slices (axial, coronal, and sagittal) were used as input to the CNN network rather than 3D volume data because 2D-based analysis enabled us to reduce GPU memory usage and limit the overfitting. The generated features from the Inception V3 were flattened into a 1D feature vector after the average pooling layer. In the end, six fully connected layers and a sigmoid layer were connected to enable the classification of OLMN and OLM positive (OLMP). To avoid overfitting, dropouts were used. The architecture of the CNN is shown in Figure 2A.
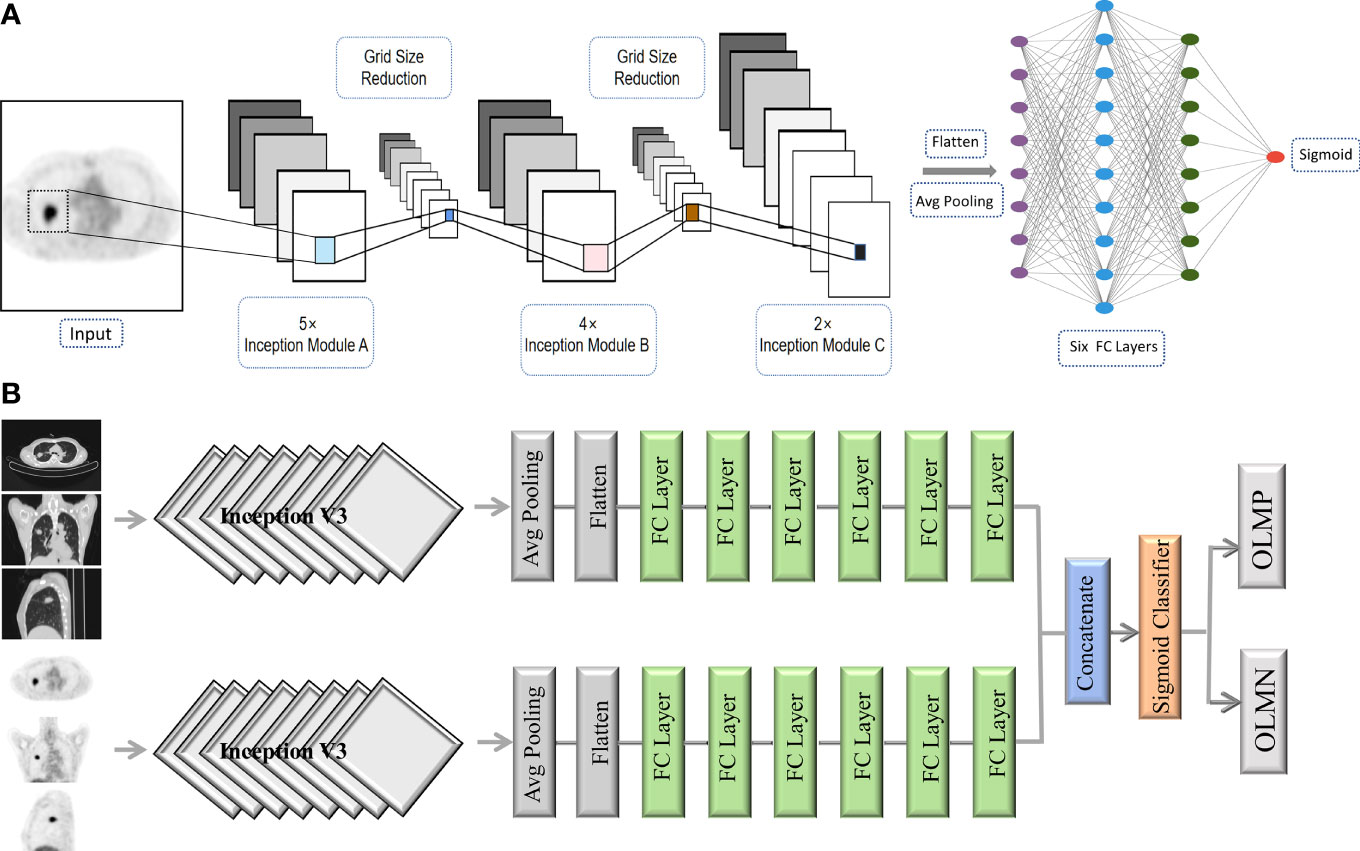
Figure 2 The architecture of the CNN (A). Schematic overview of the combined model (PET + CT) (B). Avg pooling, average pooling; FC layer, fully connected layer; OLMN, occult lymph node metastasis negative; OLMP, occult lymph node metastasis positive.
Combined model (PET + CT): For the construction of complex model, PET and CT were first respectively run to the last full connect layer, then combined them together, and finally connected a sigmoid layer (1 nodes) for classification. Schematic overview of the combined model is shown in Figure 2B.
All the above analyses were implemented in the Keras library in Python, using TensorFlow as backend (Python 2.7, Keras 2.6.0, TensorFlow 2.6.0). Adam with a learning rate of 0.000012 and a batch size of 32 was used for parameters optimization. The number of epochs of training was set to 100.
For assessing the performance of prediction models, the receiver operating characteristic (ROC) curves were displayed in the training, internal validation, and prospective test sets, respectively. The performance metrics such as accuracy, sensitivity, specificity, and the area under the curve (AUC) were calculated. Fivefold cross-validation was used to verify the generalization ability.
The statistical analyses were implemented by using IBM SPSS (version 25.0) and Python (version 2.7). Categorical data were analyzed with the chi-square test and the Fisher’s exact test. Numerical data were analyzed with the unpaired t-test, Mann–Whitney U-test, ANOVA, and Kruskal–Wallis test. For missing data, mode imputation was used for categorical variables, and mean imputation was used for continuous variables. P-values less than 0.05 indicated a statistically significant difference.
The baseline patient characteristics are shown in Table 1. The sample sizes of the training, internal validation, and prospective test sets were 316, 60, and 58, respectively. No statistical differences, including age (p = 0.663), gender (p =0.820), smoking history (p = 0.418), tumor location (p = 0.522), radiologic lesion type (p= 0.244), tumor SUVmax (p = 0.261), carcinoembryonic antigen (CEA) (p = 0.250), and predominant subtype (p = 0.088), among the three sets were observed except for pathologic tumor size (p = 0.011) in Table 1.
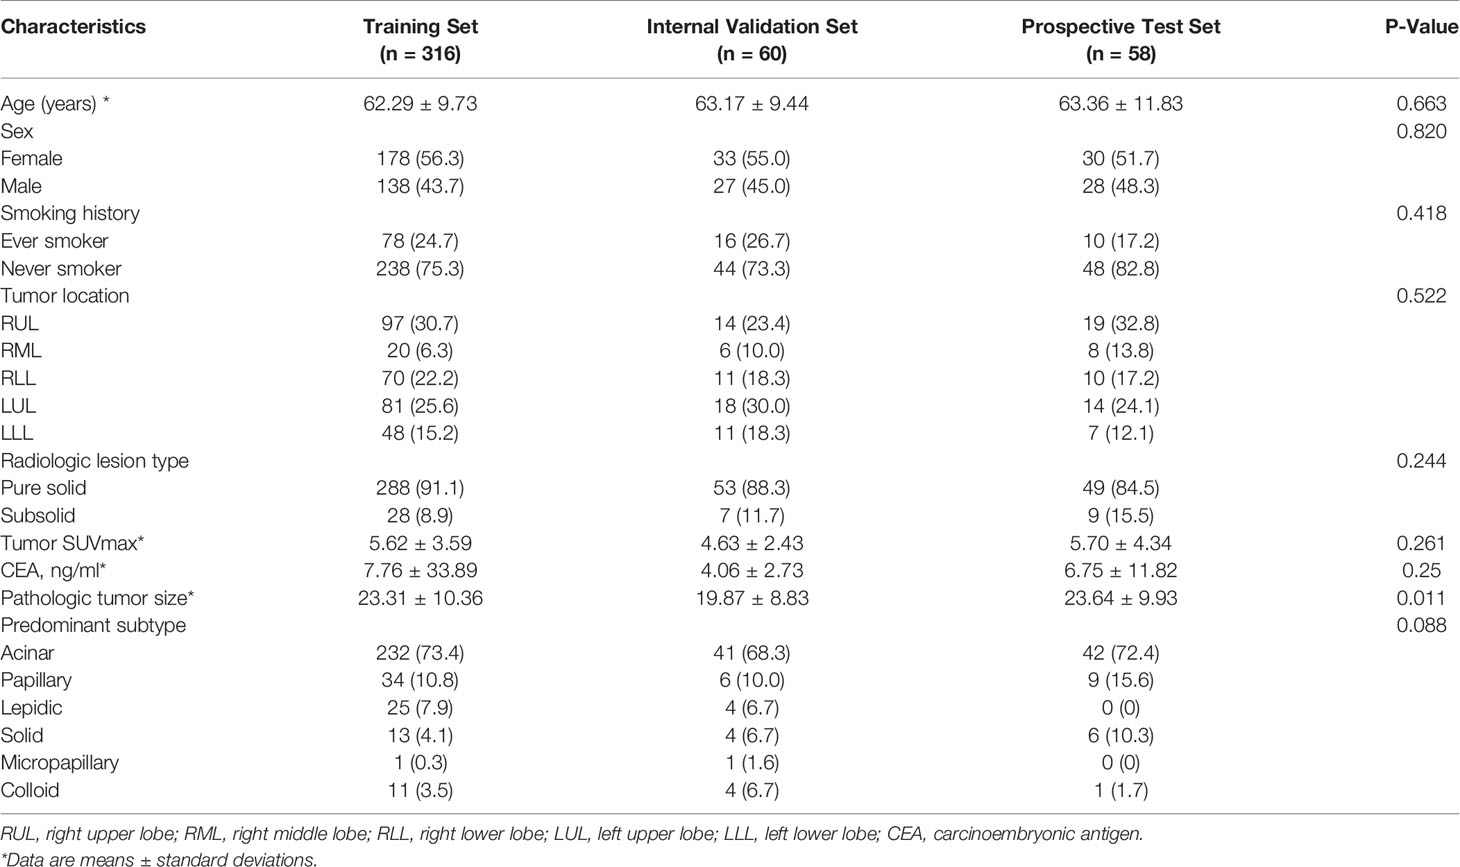
Table 1 Baseline characteristics of datasets.
A comparison of clinicopathologic data between OLMN and OLMP groups in the three sets is presented in Table 2. OLMP was identified in 91 of all 434 patients (20.9%). The training set of 316 patients included 75 OLMP (23.7%) and 241 OLMN (76.3%). The internal validation set of 60 patients included 8 OLMP (13.3%) and 52 OLMN (86.7%). The prospective test set of 58 patients included 8 OLMP (13.8%) and 50 OLMN (86.2%). Detailed information about the distribution of N stages for OLMP cases of three datasets is shown in Table 2. In addition, similar tendencies were observed for pathologic tumor size, CEA, and tumor SUVmax, respectively, in the three sets, although not always statistically significant.
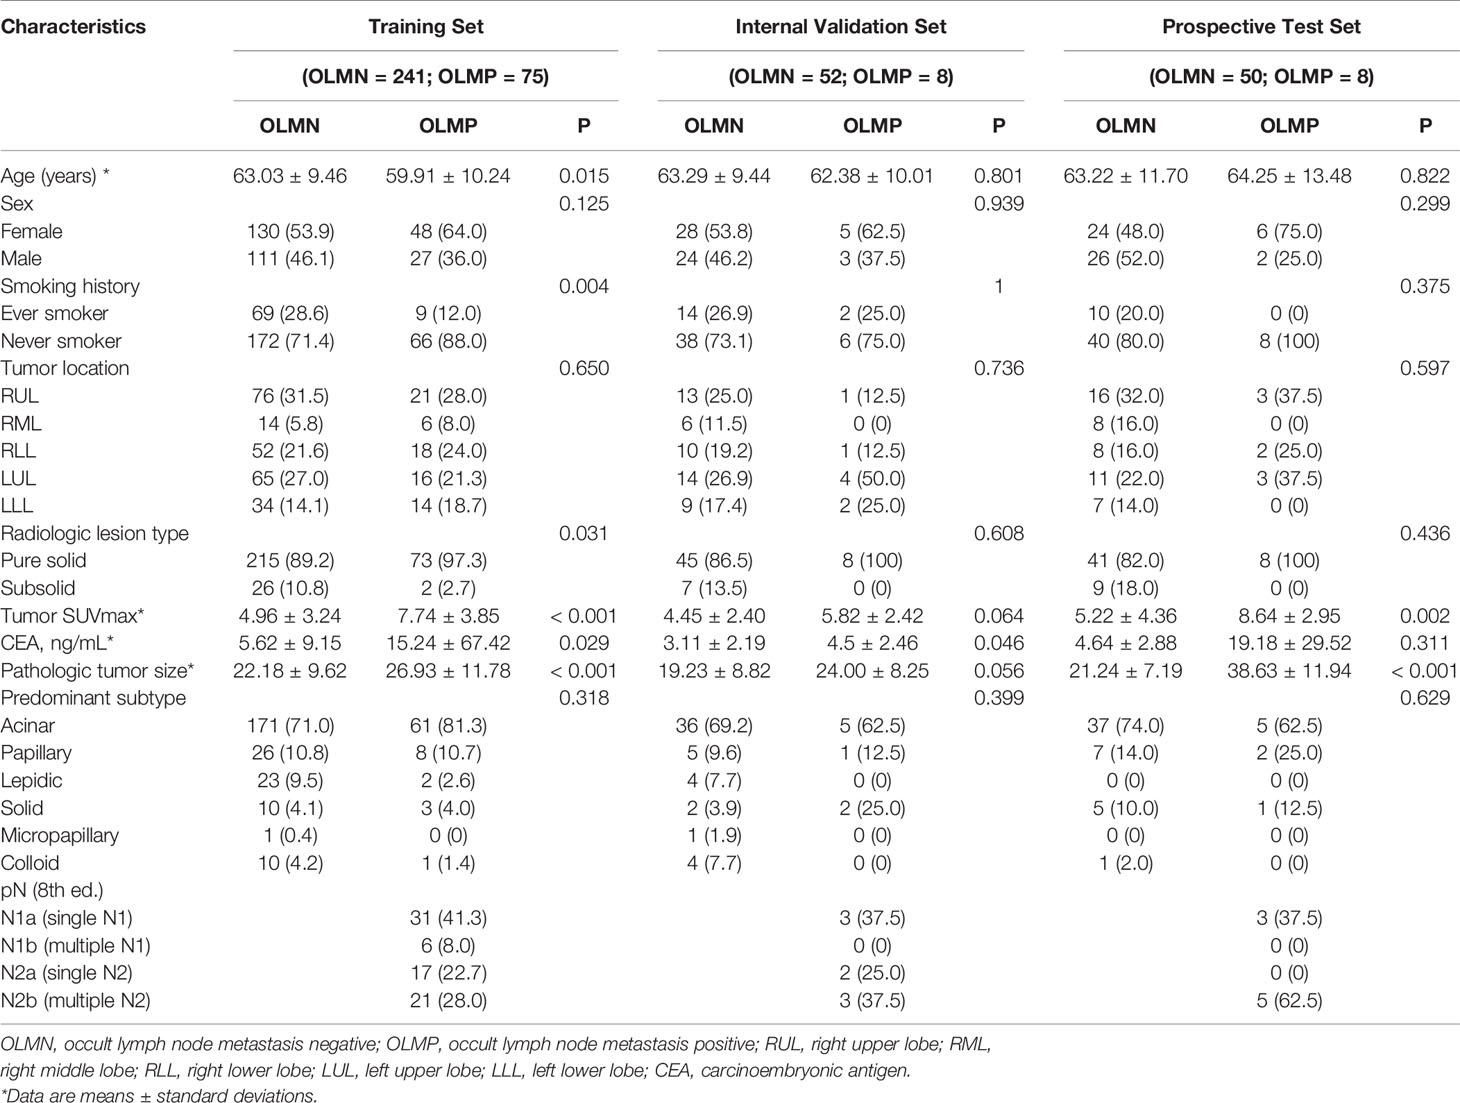
Table 2 Comparison of clinical features between OLMN and OLMP groups in the three sets.
The deep learning models demonstrated good predictive performance for OLM with the use of the primary lung cancer images of internal validation set, with AUCs of 0.74 [95% confidence interval (CI): 0.58, 0.90) for the PET model, 0.79 (95% CI: 0.58, 1.00) for the CT model, and 0.81 (95% CI: 0.61, 1.00) for the complex model. For prospective test set, the AUCs were 0.73 (95% CI: 0.51, 0.95) for the PET model, 0.79 (95% CI: 0.59, 0.98) for the CT model, and 0.87 (95% CI: 0.75, 0.99) for the complex model (Figure 3). The discriminatory ability of the complex model displayed the highest in the validation and test sets.
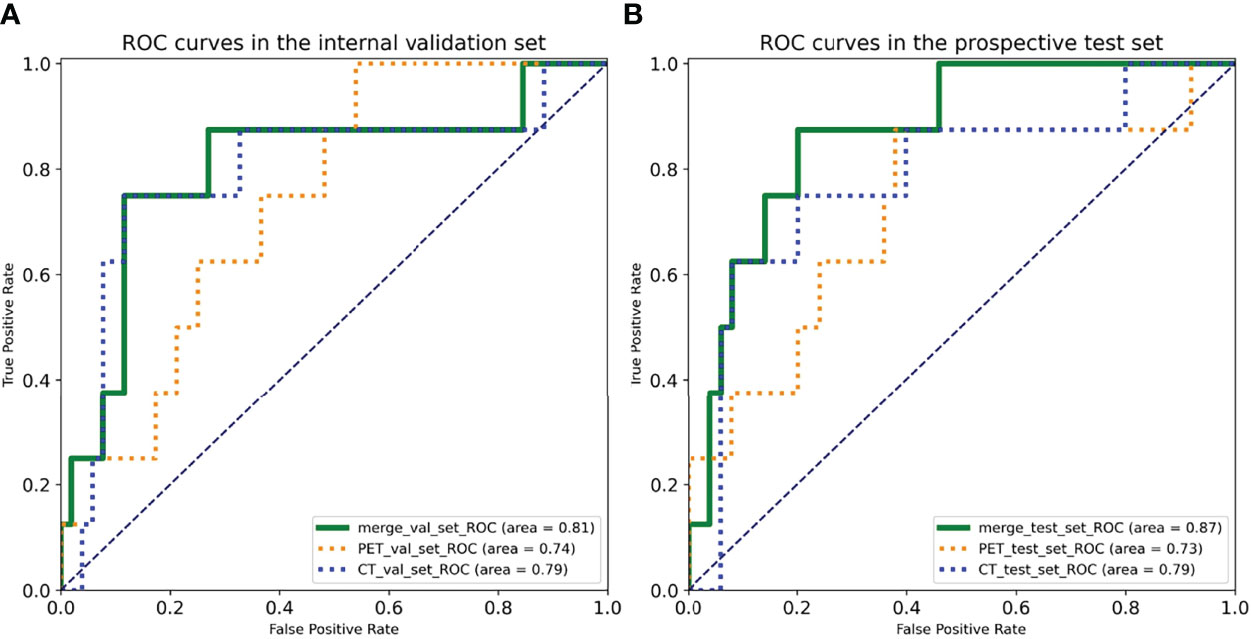
Figure 3 Receiver operating characteristic (ROC) curves of three deep learning models in the (A) internal validation set and the (B) prospective test set.
For internal validation set, the sensitivities of PET, CT, and combined models were 75.00%, 75.00%, and 87.50%, respectively; the specificities of PET, CT, and combined models were 63.46%, 88.46%, and 80.00%, respectively; and the accuracies of PET, CT, and combined models were 65.00%, 86.67%, and 81.00%, respectively (Table 3).
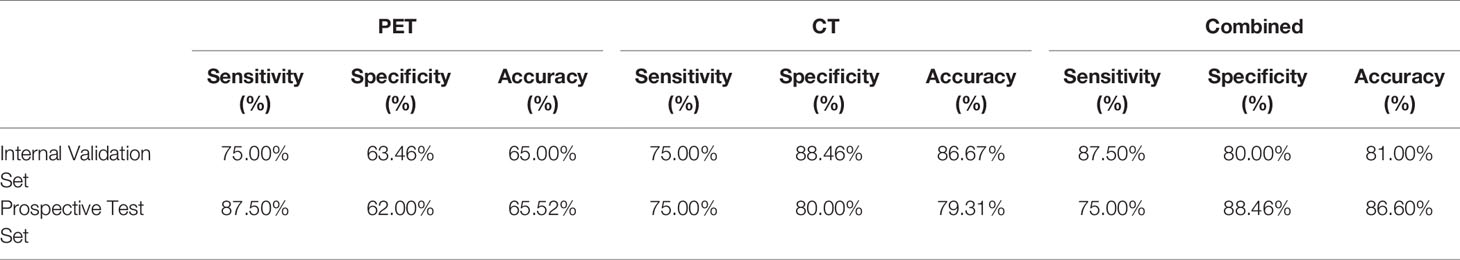
Table 3 Performance of the three deep learning models.
For prospective test set, the sensitivities of PET, CT, and combined models were 87.50%, 75.00%, and 75.00%, respectively; the specificities of PET, CT, and combined models were 62.00%, 80.00% and 88.46%, respectively; and the accuracies of PET, CT, and combined models were 65.52%,79.31% and 86.60%, respectively (Table 3).
The training curves of PET and CT are provided in Figure 4. The validation losses of PET and CT basically reached the minimum at 40~45 epochs, and then losses of training set and validation set estranged after 40 epochs. Therefore, we stopped training at the 40th epoch because no further improvement can be gained in the validation loss. The slowly decrease of validation losses suggests that the models have no overfitting before 45 epochs.
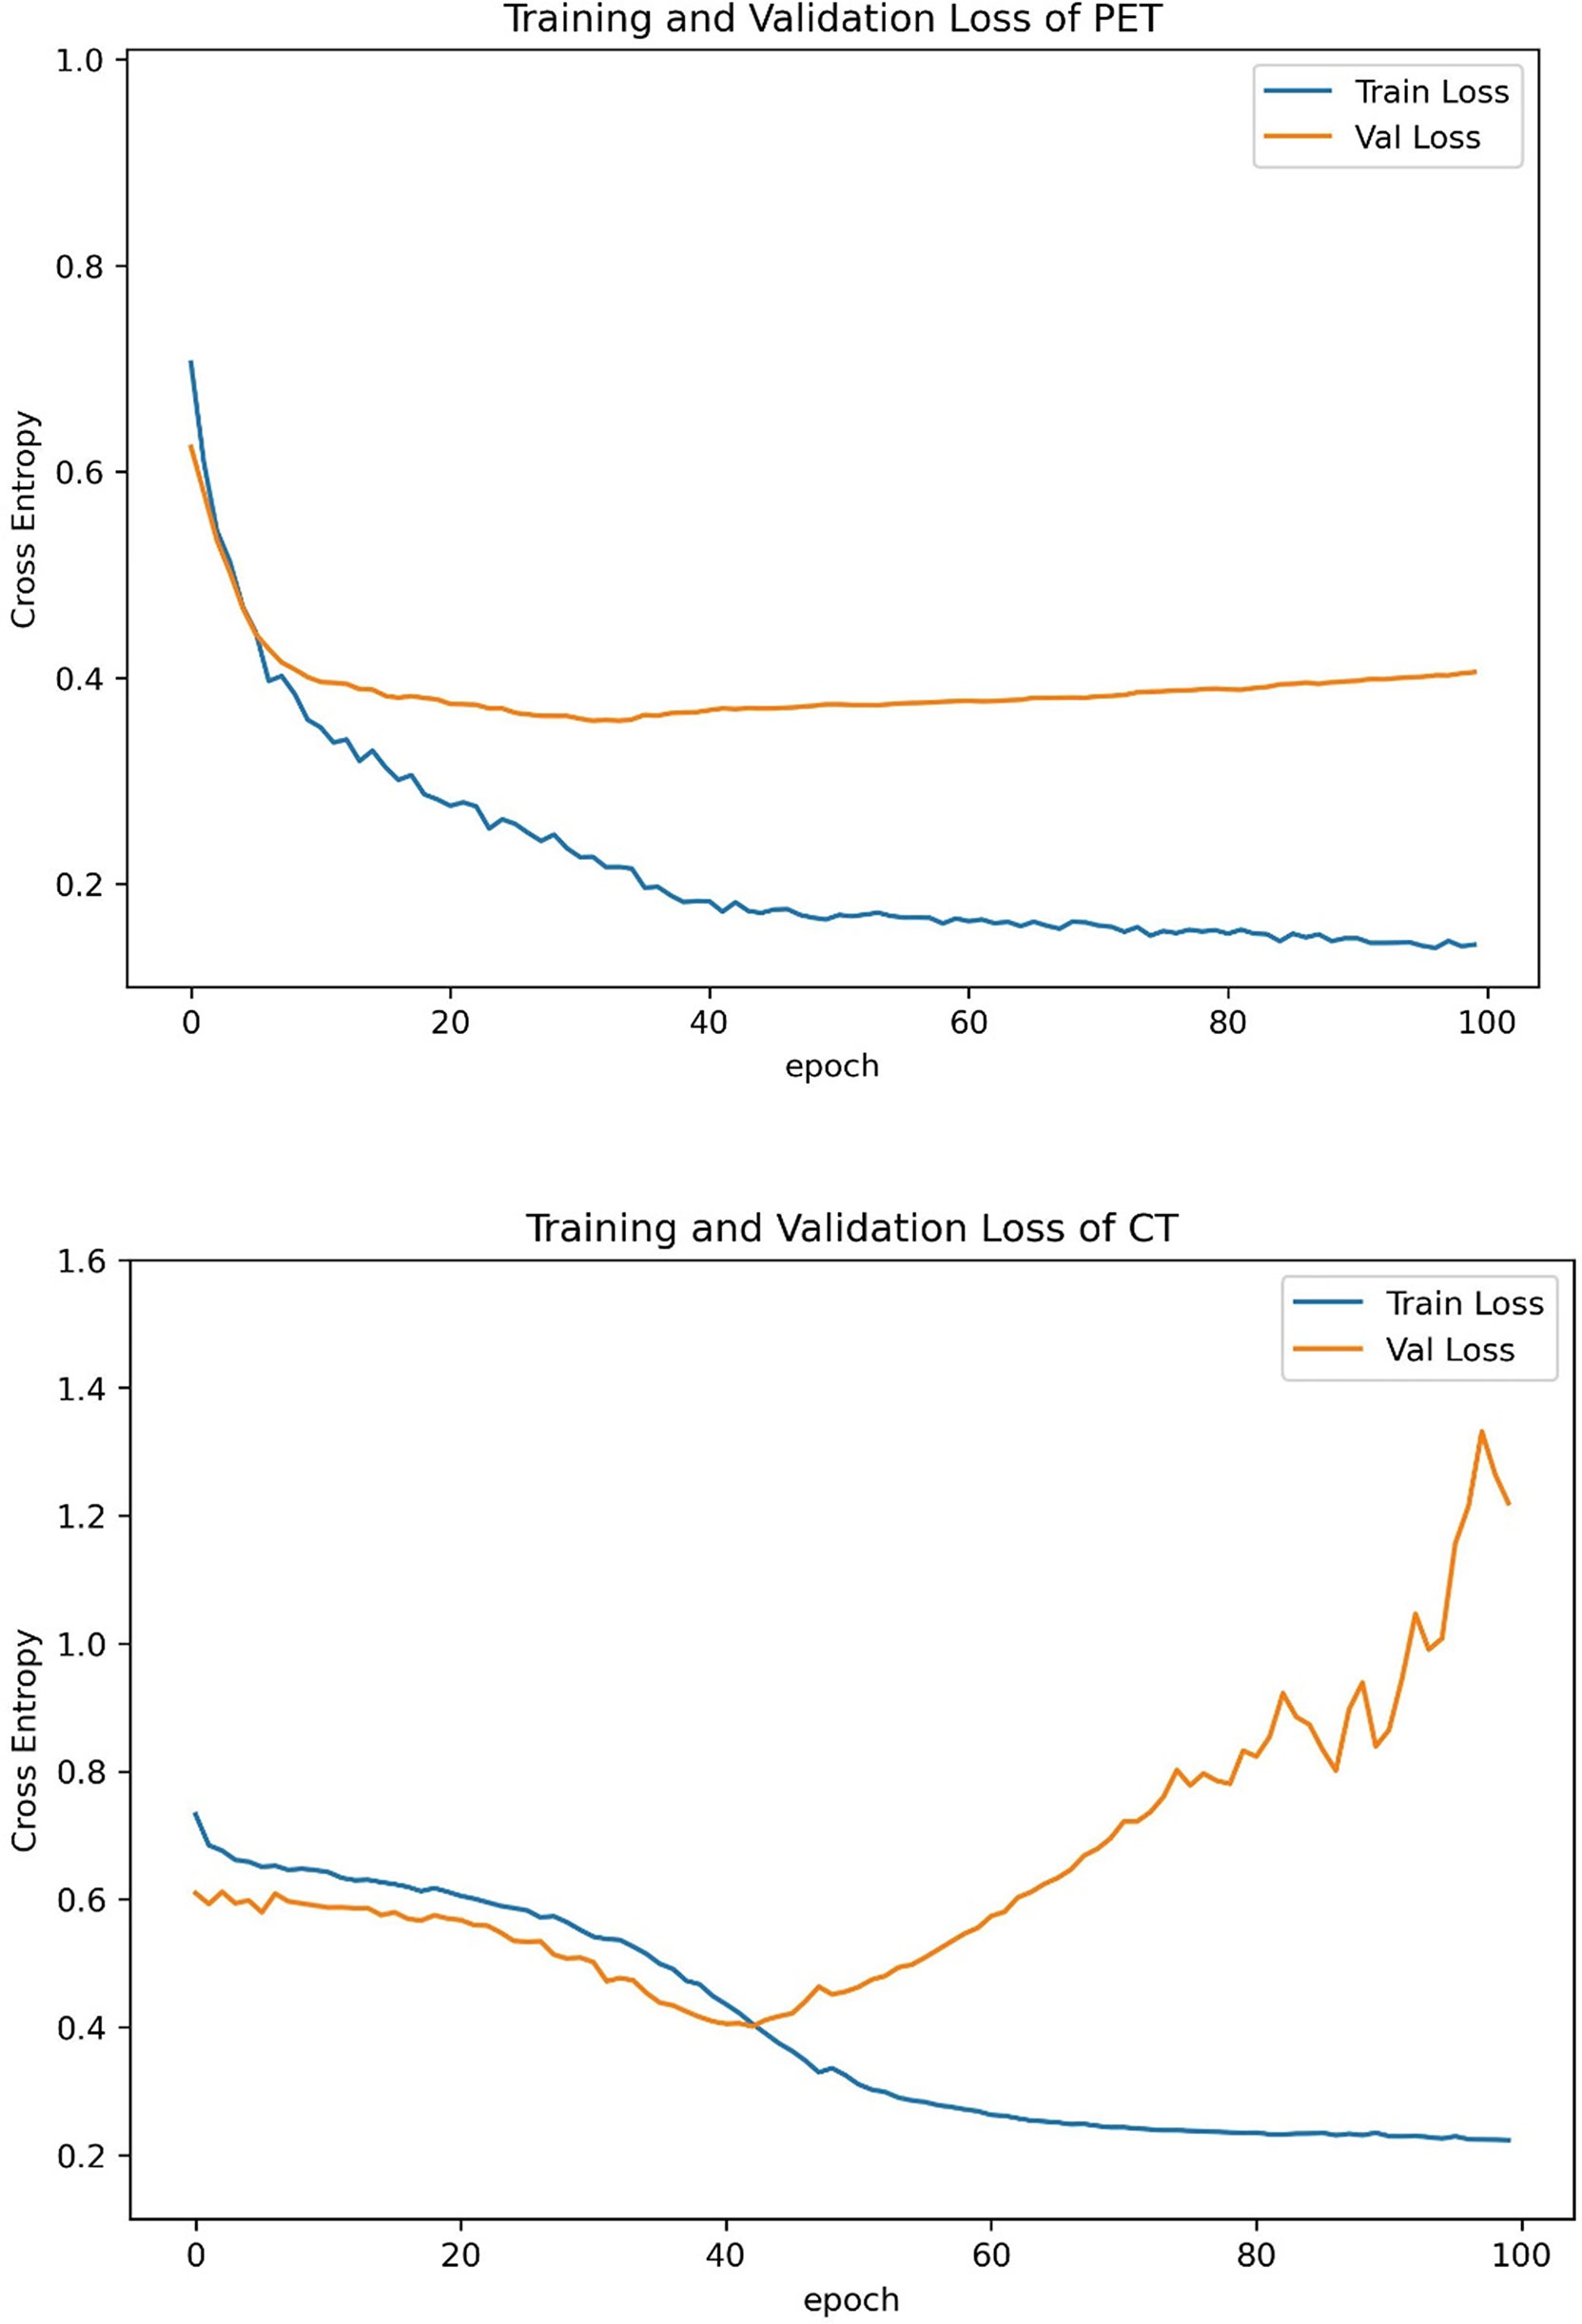
Figure 4 Training curves of PET and CT models. We stopped training at the 40th epoch because no further improvement can be gained in the validation loss.
Recently, the therapeutic effect of limited surgery in patients with early-stage NSCLC without LNM has been proved to be significant, and limited surgery has more available lung tissue and lower perioperative mortality than standard treatment (28–30). Hence, there is an increasing need for accurately predicting OLM of cN0 LUAD before surgery in a non-invasive way.
Deep learning, which takes raw image pixels and corresponding class labels from image data as inputs and automatically learns representative information, has recently attracted much attention due to its excellent performance in image recognition tasks (17). In this study, we developed three deep learning models based on FDG PET/CT images for preoperative prediction of OLM in patients with cN0 LUAD. Our results presented that the complex model combining 18F-FDG PET and low-dose CT showed better diagnostic performances in distinguishing patients with OLMN and OLMP than either PET or CT alone.
Some studies demonstrated that CNN-based image analysis has been effectively applied in predicting LN status of lung cancer. For example, Zhong et al. (31) showed that a deep learning signature based on CT images could accurately predict occult N2 disease in patients with clinical stage I NSCLC. However, it is already known that PET/CT is more accurate than CT for direct assessment of LN status. Thus, confirming N0 status by CT is not enough. Tau et al. (32) demonstrated that using a CNN to analyze segmented primary tumors with PET in patients with pretreatment NSCLC can yield moderately high accuracy for designation of N category, but the use of segmented tumors as input data for the CNN was time-consuming and might affect the results. Moreover, most recent studies using deep learning (including the two studies discussed above) only performed single-modality analyses because integrating multimodal data is vulnerable to overfitting and poor generalization (22, 33). Wang et al. (34) mixed image patches of both modalities (PET and CT) into the same network, and the result showed that the performance of CNN was not significantly different from the best classical methods and human doctors for the classification of mediastinal LNM in patients with NSCLC. Such mixed setting may affect the final result because two different patches contained different types of diagnostic information. In this study, we processed the PET and CT patches with respective subnetworks and combined the results of the two different subnetworks at the output layers. For the internal validation set, the AUCs of the CNN in predicting nodal metastasis were as follows: 18F-FDG PET alone, 0.74; CT alone, 0.79; and 18F-FDG PET/CT, 0.81. For the prospective test set, the AUCs were as follows: 18F-FDG PET alone, 0.73; CT alone, 0.79; and 18F-FDG PET/CT, 0.87. Our results showed that the combined method, which makes full use of PET functional information and CT anatomic information, showed significantly great diagnostic performances in predicting OLM of LUAD.
A 2D CNN to discriminate between OLMN and OLMP in cN0 LUAD was successfully trained, validated, and tested in this study. Previous studies proposed that 3D CNN–based CT image analysis was used for classification in patients with lung cancer (23, 35). However, the increased complexity comes at a high computational cost. Another factor to consider is whether adding these interslice features would improve classification performance. Lee et al. (36) reported that a 2D CNN slice-based approach had better performance than 3D-CNN case-based approach for detecting intrapelvic tumor recurrence and metastases. The study of Vries et al. (21) also showed that the sagittal 2D CNN already performed with very high accuracy for discriminating between Aß-negative and -positive PET scans in patients with subjective cognitive decline. Therefore, we hypothesized that patients without a very large number of cases may be more applicable to 2D CNN architectures.
For clinical features, statistical analysis showed a significant difference in pathologic tumor size, CEA, and tumor SUVmax in the training set, which is consistent with our previous findings (16, 37). However, these clinical features were not all statistically significant in our validation and test sets, which may imply that the clinical utility of these features is limited.
There are several limitations to our current study. First, this was a single-center study with a relatively small sample size. Further improvement with multicenter and large-sample studies must be achieved before clinical use. Second, patients with multiple lesions were excluded because it is difficult to determine which lesion would cause OLM and should be input in the model. Therefore, predicting OLM of multifocal lung cancer needs to be further verified. Third, although statistical analysis of clinical data was performed, we did not integrate these clinical features into the deep learning model. Therefore, clinical parameters as another modality combined DL model should be studied in the future. Fourth, we did not use PET/CT fusion images because PET scan is difficult to rigidly match with CT scan in spatial location due to cardiac and respiratory motion artifacts. Last, limitation also obviously includes the opaque black box nature of the deep learning technology.
We constructed a deep learning model that can successfully incorporate PET and CT images into a 2D CNN architecture to accurately predict OLM in patients with cN0 LUAD. Moreover, the deep learning model demonstrated a good predictive performance. This model may help to determine the patients who are eligible for limited resection.
The data analyzed in this study is subject to the following licenses/restrictions: The medical images are not publicly available due to the ethical considerations. The analysis code used in this study can be obtained by the corresponding author upon reasonable request. Requests to access these datasets should be directed to M-LO,MTQyNzczODkzN0BxcS5jb20=.
Informed consent from the retrospective patients was waived, and written informed consent was provided for patients in prospective test set.
R-XZ, Y-RW, L-DG, Y-QT, and M-LO collected the clinical information and the imaging data. R-XZ, Z-YZ, Y-GW, and M-LO were responsible for writing code and data analysis.
This study was supported by Zhejiang Public Welfare Technology Application Research Project, China (LGF21H010009) and Wenzhou Science and Technology Program (no. Y20210222).
Author Y-GW was employed by General Electric (GE) Healthcare.
The remaining authors declare that the research was conducted in the absence of any commercial or financial relationships that could be construed as a potential conflict of interest.
All claims expressed in this article are solely those of the authors and do not necessarily represent those of their affiliated organizations, or those of the publisher, the editors and the reviewers. Any product that may be evaluated in this article, or claim that may be made by its manufacturer, is not guaranteed or endorsed by the publisher.
1. Bray F, Ferlay J, Soerjomataram I, Siegel RL, Torre LA, Jemal A. Global Cancer Statistics 2018: GLOBOCAN Estimates of Incidence and Mortality Worldwide for 36 Cancers in 185 Countries. CA Cancer J Clin (2018) 68(6):394–424. doi: 10.3322/caac.21492
2. Chen Z, Fillmore CM, Hammerman PS, Kim CF, Wong KK. Non-Small-Cell Lung Cancers: A Heterogeneous Set of Diseases. Nat Rev Cancer (2014) 14(8):535–46. doi: 10.1038/nrc3775
3. Ettinger DS, Wood DE, Aggarwal C, Aisner DL, Akerley W, Bauman JR, et al. NCCN Guidelines Insights: Non-Small Cell Lung Cancer, Version 1.2020. J Natl Compr Canc Netw (2019) 17(12):1464–72. doi: 10.6004/jnccn.2019.0059
4. Yerokun BA, Yang CJ, Gulack BC, Li X, Mulvihill MS, Gu L, et al. A National Analysis of Wedge Resection Versus Stereotactic Body Radiation Therapy for Stage IA non-Small Cell Lung Cancer. J Thorac Cardiovasc Surg (2017) 154(2):675–86.e4. doi: 10.1016/j.jtcvs.2017.02.065
5. Zhang Z, Feng H, Zhao H, Hu J, Liu L, Liu Y, et al. Sublobar Resection is Associated With Better Perioperative Outcomes in Elderly Patients With Clinical Stage I non-Small Cell Lung Cancer: A Multicenter Retrospective Cohort Study. J Thorac Dis (2019) 11(5):1838–48. doi: 10.21037/jtd.2019.05.20
6. Grills IS, Mangona VS, Welsh R, Chmielewski G, McInerney E, Martin S, et al. Outcomes After Stereotactic Lung Radiotherapy or Wedge Resection for Stage I non-Small-Cell Lung Cancer. J Clin Oncol (2010) 28(6):928–35. doi: 10.1200/JCO.2009.25.0928
7. Gomez-Caro A, Garcia S, Reguart N, Arguis P, Sanchez M, Gimferrer JM, et al. Incidence of Occult Mediastinal Node Involvement in Cn0 non-Small-Cell Lung Cancer Patients After Negative Uptake of Positron Emission Tomography/Computer Tomography Scan. Eur J Cardiothorac Surg (2010) 37(5):1168–74. doi: 10.1016/j.ejcts.2009.12.013
8. Kirmani BH, Rintoul RC, Win T, Magee C, Magee L, Choong C, et al. Stage Migration: Results of Lymph Node Dissection in the Era of Modern Imaging and Invasive Staging for Lung Cancer. Eur J Cardiothorac Surg (2013) 43(1):104–9. doi: 10.1093/ejcts/ezs184
9. Veeramachaneni NK, Battafarano RJ, Meyers BF, Zoole JB, Patterson GA. Risk Factors for Occult Nodal Metastasis in Clinical T1N0 Lung Cancer: A Negative Impact on Survival. Eur J Cardiothorac Surg (2008) 33(3):466–9. doi: 10.1016/j.ejcts.2007.12.015
10. Gillies RJ, Kinahan PE, Hricak H. Radiomics: Images Are More Than Pictures, They Are Data. Radiology (2016) 278(2):563–77. doi: 10.1148/radiol.2015151169
11. Aerts HJ, Velazquez ER, Leijenaar RT, Parmar C, Grossmann P, Carvalho S, et al. Decoding Tumour Phenotype by Noninvasive Imaging Using a Quantitative Radiomics Approach. Nat Commun (2014) 5:4006. doi: 10.1038/ncomms5006
12. Huang YQ, Liang CH, He L, Tian J, Liang CS, Chen X, et al. Development and Validation of a Radiomics Nomogram for Preoperative Prediction of Lymph Node Metastasis in Colorectal Cancer. J Clin Oncol (2016) 34(18):2157–64. doi: 10.1200/JCO.2015.65.9128
13. Wu S, Zheng J, Li Y, Yu H, Shi S, Xie W, et al. A Radiomics Nomogram for the Preoperative Prediction of Lymph Node Metastasis in Bladder Cancer. Clin Cancer Res (2017) 23(22):6904–11. doi: 10.1158/1078-0432.CCR-17-1510
14. Li Q, He XQ, Fan X, Zhu CN, Lv JW, Luo TY. Development and Validation of a Combined Model for Preoperative Prediction of Lymph Node Metastasis in Peripheral Lung Adenocarcinoma. Front Oncol (2021) 11:675877. doi: 10.3389/fonc.2021.675877
15. Zhong Y, Yuan M, Zhang T, Zhang YD, Li H, Yu TF. Radiomics Approach to Prediction of Occult Mediastinal Lymph Node Metastasis of Lung Adenocarcinoma. AJR Am J Roentgenol (2018) 211(1):109–13. doi: 10.2214/AJR.17.19074
16. Wang L, Li T, Hong J, Zhang M, Ouyang M, Zheng X, et al. (18)F-FDG PET-Based Radiomics Model for Predicting Occult Lymph Node Metastasis in Clinical N0 Solid Lung Adenocarcinoma. Quant Imaging Med Surg (2021) 11(1):215–25. doi: 10.21037/qims-20-337
17. LeCun Y, Bengio Y, Hinton G. Deep Learning. Nature (2015) 521(7553):436–44. doi: 10.1038/nature14539
18. Fayek HM, Lech M, Cavedon L. Evaluating Deep Learning Architectures for Speech Emotion Recognition. Neural Netw (2017) 92:60–8. doi: 10.1016/j.neunet.2017.02.013
19. Hosny A, Parmar C, Quackenbush J, Schwartz LH, Aerts H. Artificial Intelligence in Radiology. Nat Rev Cancer (2018) 18(8):500–10. doi: 10.1038/s41568-018-0016-5
20. Sibille L, Seifert R, Avramovic N, Vehren T, Spottiswoode B, Zuehlsdorff S, et al. (18)F-FDG PET/CT Uptake Classification in Lymphoma and Lung Cancer by Using Deep Convolutional Neural Networks. Radiology (2020) 294(2):445–52. doi: 10.1148/radiol.2019191114
21. de Vries BM, Golla SSV, Ebenau J, Verfaillie SCJ, Timmers T, Heeman F, et al. Classification of Negative and Positive (18)F-Florbetapir Brain PET Studies in Subjective Cognitive Decline Patients Using a Convolutional Neural Network. Eur J Nucl Med Mol Imaging (2021) 48(3):721–8. doi: 10.1007/s00259-020-05006-3
22. Ding Y, Sohn JH, Kawczynski MG, Trivedi H, Harnish R, Jenkins NW, et al. A Deep Learning Model to Predict a Diagnosis of Alzheimer Disease by Using (18)F-FDG PET of the Brain. Radiology (2019) 290(2):456–64. doi: 10.1148/radiol.2018180958
23. Zhao X, Wang X, Xia W, Li Q, Zhou L, Li Q, et al. A Cross-Modal 3D Deep Learning for Accurate Lymph Node Metastasis Prediction in Clinical Stage T1 Lung Adenocarcinoma. Lung Cancer (2020) 145:10–7. doi: 10.1016/j.lungcan.2020.04.014
24. Tau N, Stundzia A, Yasufuku K, Hussey D, Metser U. Convolutional Neural Networks in Predicting Nodal and Distant Metastatic Potential of Newly Diagnosed Non-Small Cell Lung Cancer on FDG PET Images. AJR Am J Roentgenol (2020) 215(1):192–7. doi: 10.2214/AJR.19.22346
25. Schmidt-Hansen M, Baldwin DR, Hasler E, Zamora J, Abraira V, Roque IFM. PET-CT for Assessing Mediastinal Lymph Node Involvement in Patients With Suspected Resectable non-Small Cell Lung Cancer. Cochrane Database Syst Rev (2014) 11):CD009519. doi: 10.1002/14651858.CD009519.pub2
26. Moons KG, Altman DG, Reitsma JB, Ioannidis JP, Macaskill P, Steyerberg EW, et al. Transparent Reporting of a Multivariable Prediction Model for Individual Prognosis or Diagnosis (TRIPOD): Explanation and Elaboration. Ann Intern Med (2015) 162(1):W1–73. doi: 10.7326/M14-0698
27. Szegedy C, Vanhoucke V, Ioffe S, Shlens J, Wojna Z. Rethinking the Inception Architecture for Computer Vision. IEEE (2016) Conference on Computer Vision and Pattern Recognition p. 2818–26.
28. Okada M. Radical Sublobar Resection for Small-Diameter Lung Cancers. Thorac Surg Clin (2013) 23(3):301–11. doi: 10.1016/j.thorsurg.2013.04.003
29. Cao J, Yuan P, Wang Y, Xu J, Yuan X, Wang Z, et al. Survival Rates After Lobectomy, Segmentectomy, and Wedge Resection for Non-Small Cell Lung Cancer. Ann Thorac Surg (2018) 105(5):1483–91. doi: 10.1016/j.athoracsur.2018.01.032
30. Altorki NK, Yip R, Hanaoka T, Bauer T, Aye R, Kohman L, et al. Sublobar Resection is Equivalent to Lobectomy for Clinical Stage 1A Lung Cancer in Solid Nodules. J Thorac Cardiovasc Surg (2014) 147(2):754–62. doi: 10.1016/j.jtcvs.2013.09.065
31. Zhong Y, She Y, Deng J, Chen S, Wang T, Yang M, et al. Deep Learning for Prediction of N2 Metastasis and Survival for Clinical Stage I Non-Small Cell Lung Cancer. Radiology (2022) 302(1):200–11. doi: 10.1148/radiol.2021210902
32. Kocak B, Ates E, Durmaz ES, Ulusan MB, Kilickesmez O. Influence of Segmentation Margin on Machine Learning-Based High-Dimensional Quantitative CT Texture Analysis: A Reproducibility Study on Renal Clear Cell Carcinomas. Eur Radiol (2019) 29(9):4765–75. doi: 10.1007/s00330-019-6003-8
33. Zhang Q, Liao Y, Wang X, Zhang T, Feng J, Deng J, et al. A Deep Learning Framework for (18)F-FDG PET Imaging Diagnosis in Pediatric Patients With Temporal Lobe Epilepsy. Eur J Nucl Med Mol Imaging (2021) 48(8):2476–85. doi: 10.1007/s00259-020-05108-y
34. Wang H, Zhou Z, Li Y, Chen Z, Lu P, Wang W, et al. Comparison of Machine Learning Methods for Classifying Mediastinal Lymph Node Metastasis of non-Small Cell Lung Cancer From (18)F-FDG PET/CT Images. EJNMMI Res (2017) 7(1):11. doi: 10.1186/s13550-017-0260-9
35. Zhao W, Yang J, Sun Y, Li C, Wu W, Jin L, et al. 3d Deep Learning From CT Scans Predicts Tumor Invasiveness of Subcentimeter Pulmonary Adenocarcinomas. Cancer Res (2018) 78(24):6881–9. doi: 10.1158/0008-5472.CAN-18-0696
36. Lee JJ, Yang H, Franc BL, Iagaru A, Davidzon GA. Deep Learning Detection of Prostate Cancer Recurrence With (18)F-FACBC (Fluciclovine, Axumin(R)) Positron Emission Tomography. Eur J Nucl Med Mol Imaging (2020) 47(13):2992–7. doi: 10.1007/s00259-020-04912-w
Keywords: positron emission tomography/computed tomography (PET/CT), convolutional neural network, lung adenocarcinoma, sublobar resection, lymph node status
Citation: Ouyang M-l, Zheng R-x, Wang Y-r, Zuo Z-y, Gu L-d, Tian Y-q, Wei Y-g, Huang X-y, Tang K and Wang L-x (2022) Deep Learning Analysis Using 18F-FDG PET/CT to Predict Occult Lymph Node Metastasis in Patients With Clinical N0 Lung Adenocarcinoma. Front. Oncol. 12:915871. doi: 10.3389/fonc.2022.915871
Received: 08 April 2022; Accepted: 07 June 2022;
Published: 07 July 2022.
Edited by:
Wei Wei, Xi’an University of Technology, ChinaReviewed by:
Tsung-Ying Ho, Chang Gung Memorial Hospital, TaiwanCopyright © 2022 Ouyang, Zheng, Wang, Zuo, Gu, Tian, Wei, Huang, Tang and Wang. This is an open-access article distributed under the terms of the Creative Commons Attribution License (CC BY). The use, distribution or reproduction in other forums is permitted, provided the original author(s) and the copyright owner(s) are credited and that the original publication in this journal is cited, in accordance with accepted academic practice. No use, distribution or reproduction is permitted which does not comply with these terms.
*Correspondence: Liang-xing Wang, d2FuZ2xpYW5neGluZ0B3emhvc3BpdGFsLmNu; Kun Tang, a3VudGFuZzAwN0AxNjMuY29t; Xiao-ying Huang, aHVhbmd4aWFveWluZ0B3emhvc3BpdGFsLmNu
†These authors have contributed equally to this work
Disclaimer: All claims expressed in this article are solely those of the authors and do not necessarily represent those of their affiliated organizations, or those of the publisher, the editors and the reviewers. Any product that may be evaluated in this article or claim that may be made by its manufacturer is not guaranteed or endorsed by the publisher.
Research integrity at Frontiers
Learn more about the work of our research integrity team to safeguard the quality of each article we publish.