
94% of researchers rate our articles as excellent or good
Learn more about the work of our research integrity team to safeguard the quality of each article we publish.
Find out more
ORIGINAL RESEARCH article
Front. Oncol., 08 August 2022
Sec. Pediatric Oncology
Volume 12 - 2022 | https://doi.org/10.3389/fonc.2022.915833
This article is part of the Research TopicThe Future of Pediatric Precision Oncology: Novel Targets, Innovative Drug Combinations and Targeted Protein DegradationView all 5 articles
 Narun Su1†
 Zifeng Li1†
 Jiapeng Yang1†Yang Fu1
 Xiaohua Zhu1
 Hui Miao1
 Yi Yu1Wenjin Jiang1Jun Le1
 Xiaowen Qian1
 Hongsheng Wang1*
 Maoxiang Qian2*
 Xiaowen Zhai1*
Pediatric acute megakaryoblastic leukemia (AMKL) is a subtype of acute myeloid leukemia (AML) characterized by abnormal megakaryoblasts, and it is divided into the AMKL patients with Down syndrome (DS-AMKL) and AMKL patients without DS (non-DS-AMKL). Pediatric non-DS-AMKL is a heterogeneous disease with extremely poor outcome. We performed single-cell RNA sequencing (scRNA-seq) of the bone marrow from two CBFA2T3-GLIS2 fusion-positive and one RBM15-MKL1 fusion-positive non-DS-AMKL children. Meanwhile, we downloaded the scRNA-seq data of normal megakaryocyte (MK) cells of the fetal liver and bone marrow from healthy donors as normal controls. We conducted cell clustering, cell-type identification, inferCNV analysis, Gene Ontology (GO), Kyoto Encyclopedia of Genes and Genomes (KEGG) enrichment, and Monocle2 analysis to investigate the intratumoral heterogeneity of AMKL. Using canonical markers, we identified and characterized the abnormal blasts and other normal immune cells from three AMKL samples. We found intratumoral heterogeneity of AMKL in various cell-type proportions, malignant cells’ diverse copy number variations (CNVs), maturities, significant genes expressions, and enriched pathways. We also identified potential markers for pediatric AMKL, namely, RACK1, ELOB, TRIR, NOP53, SELENOH, and CD81. Our work offered insight into the heterogeneity of pediatric acute megakaryoblastic leukemia and established the single-cell transcriptomic landscape of AMKL for the first time.
Acute megakaryoblastic leukemia [AMKL or AML-M7 in the French–American–British (FAB) classification] (1) is a subtype of acute myeloid leukemia (AML) characterized by abnormal megakaryoblasts that express platelet-specific surface glycoprotein, including CD41, CD42, and CD61. AMKL is significantly more frequent in children than in adults. In contrast to AMKL in pediatric patients with Down syndrome (DS-AMKL), AMKL in pediatric patients without DS (non-DS-AMKL) is much rarer and more heterogeneous, a significant proportion of whom carry chimeric oncogenes including RBM15-MKL1, CBFA2T3-GLIS2, NUP98-KDM5A, and MLL gene rearrangements. CBFA2T3-GLIS2 is the most frequent chimeric oncogene identified in non-DS-AMKL patients, resulting from a cryptic inversion on chromosome 16 [inv (16) (p13.3q24.3)], which correlates with a poor prognosis (2). RBM15-MKL1 fusion was identified specifically among infants owing to t(1;22) translocation (3, 4).
Unfortunately, the outcome of non-DS-AMKL is extremely poor, with significantly lower event-free survival than DS-AMKL and pediatric AML, even after undergoing intensified treatment, and its pathological mechanisms had remained elusive till now. Most previous studies were transcriptional profiling of AMKL, which undermined the heterogeneity of tumors. Recently, single-cell RNA sequencing (scRNA-seq) was performed in numerous cancers to study the intratumoral heterogeneity, developing trajectory, and immune microenvironment (5, 6).
Therefore, we conducted scRNA-seq to illuminate molecular features of AMKL for the bone marrow from three AMKL pediatric patients with either CBFA2T3-GLIS2 fusion or RBM15-MKL1 fusion and downloaded the single-cell RNA-sequencing data of normal megakaryocyte (MK) cells of the fetal liver and bone marrow from Gene Expression Omnibus (GEO) as normal controls. Then, we analyzed the characteristics of malignant AMKL cells of AMKL that may help us better understand the pediatric non-DS AMKL.
Three patients diagnosed with AMKL were recruited from the Children’s Hospital of Fudan University in the Department of Hematology and Oncology, including 18-month-old male, 19-month-old female, and 49-month-old female patients. This study was approved by the Medical Ethics Committee of the Children’s Hospital of Fudan University institutional review board and conducted under the Declaration of Helsinki principles (approval reference no. 366). Informed written consent was obtained from the parents before bone marrow biopsy in the study.
Healthy donors’ data were downloaded from the GEO dataset (accession number GSE144024). Fetal liver (FL) samples were obtained from healthy donors with elective medical abortion after 4–10 weeks post-conception (WPC). The mononuclear cells of the fetal liver were isolated from human FL and transferred into Iscove’s modified Dulbecco’s medium (IMDM) (GIBCO, CA, United States) containing 10% fetal bovine serum (FBS) (Hyclone, UT, United States), from which the megakaryocytes were sorted by FACS according to CD41a+CD42b+ phenotype.
The scRNA-seq data of the bone marrow was downloaded from the National Omics Data Encyclopedia dataset (NODE; OEP000756, OEP001150, and OEP001128). First, the reporters built a model of megakaryopoiesis in vitro. Second, they harvested the cultured cells at the time points of D0, D4, 48, and D12. Lastly, they performed scRNA-seq on 10x genomics platform and filtered out low-quality cells.
Experimental procedures followed established techniques using the Chromium Single Cell 3′ Library V3 kit (10x Genomics). In brief, the mononuclear cells obtained from the bone marrow by density gradient centrifugation using lymphocyte separation medium were loaded into the chromium instrument (10x Genomics), and the resulting barcoded cDNAs were used to construct libraries. Raw sequence data were converted into FASTQs using the Illumina bcl2fastq software. FASTQ files were aligned to the human genome (GRCh38) using the CellRanger 4.0 (10x Genomics) pipeline according to the manufacturer’s instructions.
Initial data processing of scRNA-seq for the bone marrow from patients, including A330 (n = 8,092), M002 (n = 8,151), and M704 (n= 8,144) were performed using R4.0.4 with R package Seurat (v4.0.4). Healthy donors’ scRNA-seq data including FL and hiBM were processed following method used by the authors. Individual cells were filtered based on the total number of genes expressed and the percentage of mitochondrial reads. The cells were included with genes >200 but <6,000 and the percentage of mitochondrial reads <10%. Genes that were expressed in fewer than three cells were also removed. For each cell, the expression of each gene was normalized to the sequencing depth of the cell, scaled to a constant depth (10,000), and log-transformed. Variable genes were selected (selection.method= “vst,” nfeatures=2,000, default settings otherwise). Principal component analysis (PCA) was performed on the variable genes, and the optimal number of principal components (PCs) for each sample was chosen using elbow plots (A330, 15; M002, 20; and M704, 15). PCs were used for dimensionality reduction if they were statistically significant according to the elbow plots. Dimensionality reduction and visualization were performed with the Uniform Manifold Approximation and Projection (UMAP) algorithm (Seurat implementation) using the PCs selected above. Unsupervised graph-based clustering of cells was performed using the indicated PCs, and resolution was chosen concerning the cell numbers (A330 = 0.8, M002 = 0.6, and M704 = 0.6).
The FindAllMarkers function implemented in Seurat was used to identify differentially expressed genes (DEGs) between different clusters. The Wilcoxon test was performed on each gene, and the p-value and adjusted p-value standing for statistical significance were computed. Genes with adjusted p-values <0.05 were considered significant. Cell-type inference was performed in an unsupervised manner by the R package SingleR (v1.4.1). The identification of clusters was accomplished by the canonical marker genes combined. The blast cells were selected, and the inferCNV analysis was performed with parameters including default settings to ascertain these tumor cells by the R package infercnv (v1.6.0).
The data generated from the tumor cells of specimens A330, M002, and M704 were integrated, and batch effects were corrected by the R package harmony (v1.0). Then, trajectory analysis was performed using the R package Monocle2 (v2.18.0).
The data generated from the tumor cells of specimens A330, M002, and M704 and normal megakaryocytes from the bone marrow (BM) mentioned before was integrated, and batch effects were corrected by the R package harmony (v1.0). Furthermore, FindMarkers function was used to identify DEGs between tumor cells and normal megakaryocytes. The Wilcoxon test was performed on each gene. The novel markers utilized a default threshold of 4 for the average fold change, 0.01 for the adjusted p-value, and a filter for the minimum delta percent of cells ([X (percentage of cluster1) − X (percentage of cluster2)]/X (percentage of cluster1) × 100) >90%. Meanwhile, the novel markers must be expressed in every AMKL sample.
The DEGs obtained were subjected to GO and KEGG analyses using the R package clusterProfiler (v3.18.1).
The reverse transcription polymerase chain reaction (RT-PCR) was used to screen for CBFA2T3-GLIS2 and RBM15-MKL1 transcripts. The total RNA was extracted from the bone marrow using Qiagen whole-blood total RNA extraction kit. The purity and concentration of RNA were analyzed. One microgram of total RNA was taken to synthesize cDNA using Thermo’s M-MLV reverse transcriptase and Thermo’s Random 6 MERS (reverse transcriptionist primers) (37°C, 1 h). One microliter (100 ng/μl) of the synthesized cDNA was used to amplify the 75-bp target fusion gene using Thermo Platinum™ II hot-start PCR premix (2X) and CBFA2T3-GLIS2 or RBM15-MKL1 primers. The amplified product was taken for agarose gel electrophoresis, and the target fragment with the size of 135 bp was recovered. The amplified products were sequenced using an ABI 3500DX sequencer to analyze the fusion sites. The following primers were used: forward 5′-CGAAGGGCCTCAGCTAGACGT-3′ and reverse 5′-AGCCACTGCGCTATTTGGAT-3′ (CBFA2T3-GLIS2 fusion); forward 5′-AGCAGTTCCTGGATTCCCCT-3′ and reverse 5′-AAA TGCGGCTGGACTTTT-3′ (RBM15-MKL1 fusion).
These AMKL patients (Table 1) comprised one 18-month-old male, one 19-month-old female, and one 49-month-old female patients. The bone marrow samples were collected at the onset of the disease and went through scRNA-seq in the 10x genomics platform. We obtained 24,387 cells after quality control. The batch effect was removed by harmony package.
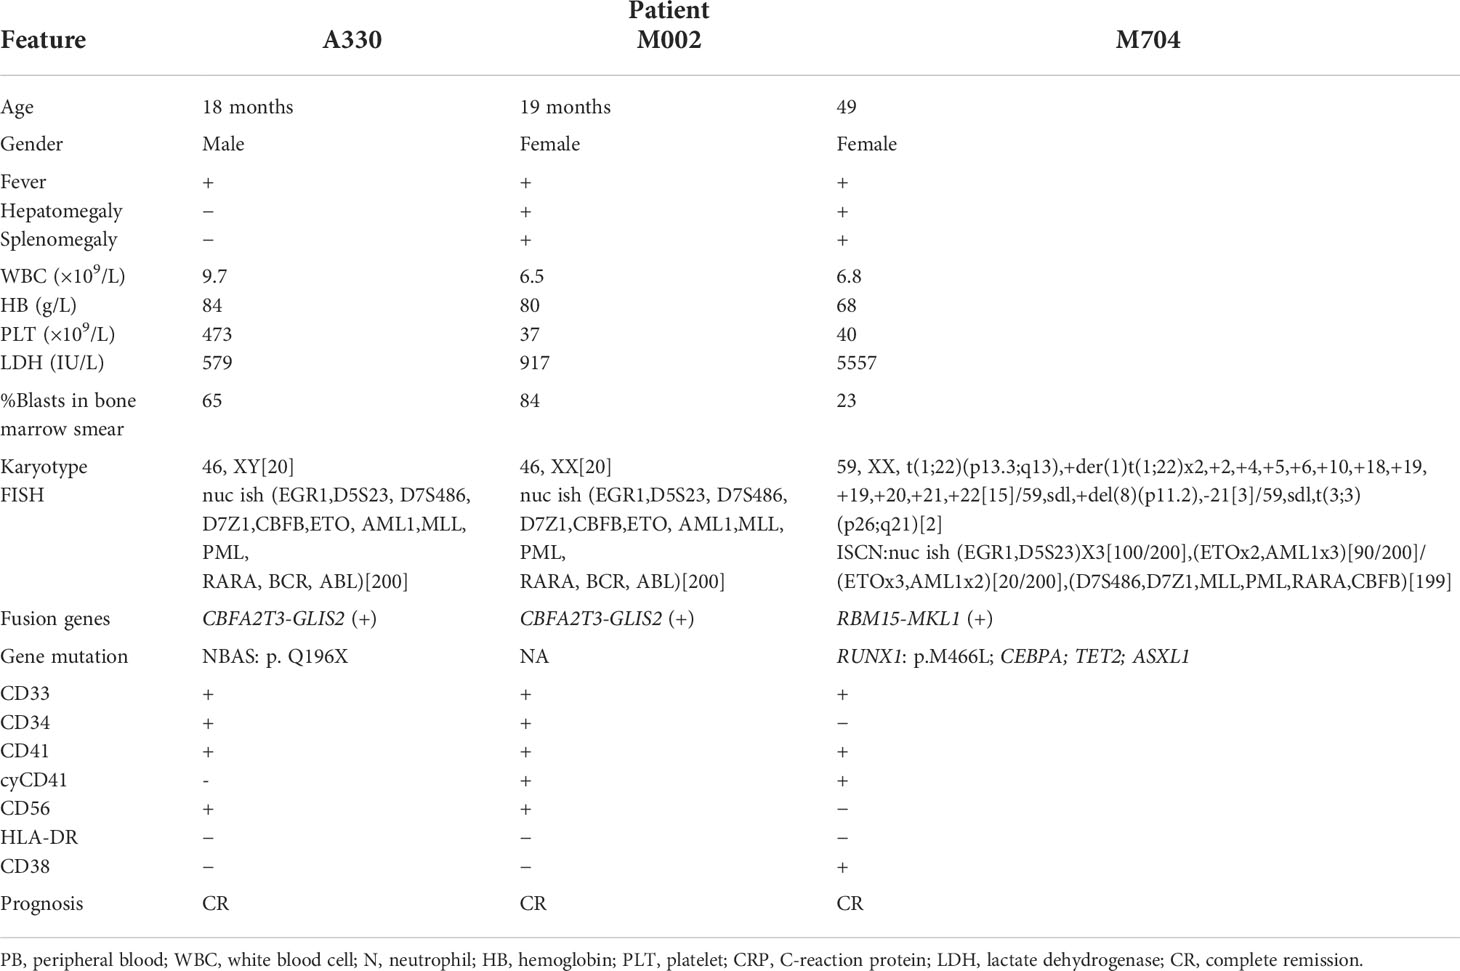
Table 1 The clinical characterizations of the three non-DS-AMKL children.
Five main cell types were identified by canonical marker genes (Figure 1A). For example, CD79A, CD79B, and MS4A1 for B cells; HBB, HBA1, and HBM for erythrocytes; CD3D, CD3E, and GZMA for T cells; ELANE, AZU1, and LYZ for myelocytes. Signature markers, namely, ITGA2B (CD41), FLI1, and RUNX1, were specifically and highly expressed in abnormal megakaryoblasts (Figure 1B).
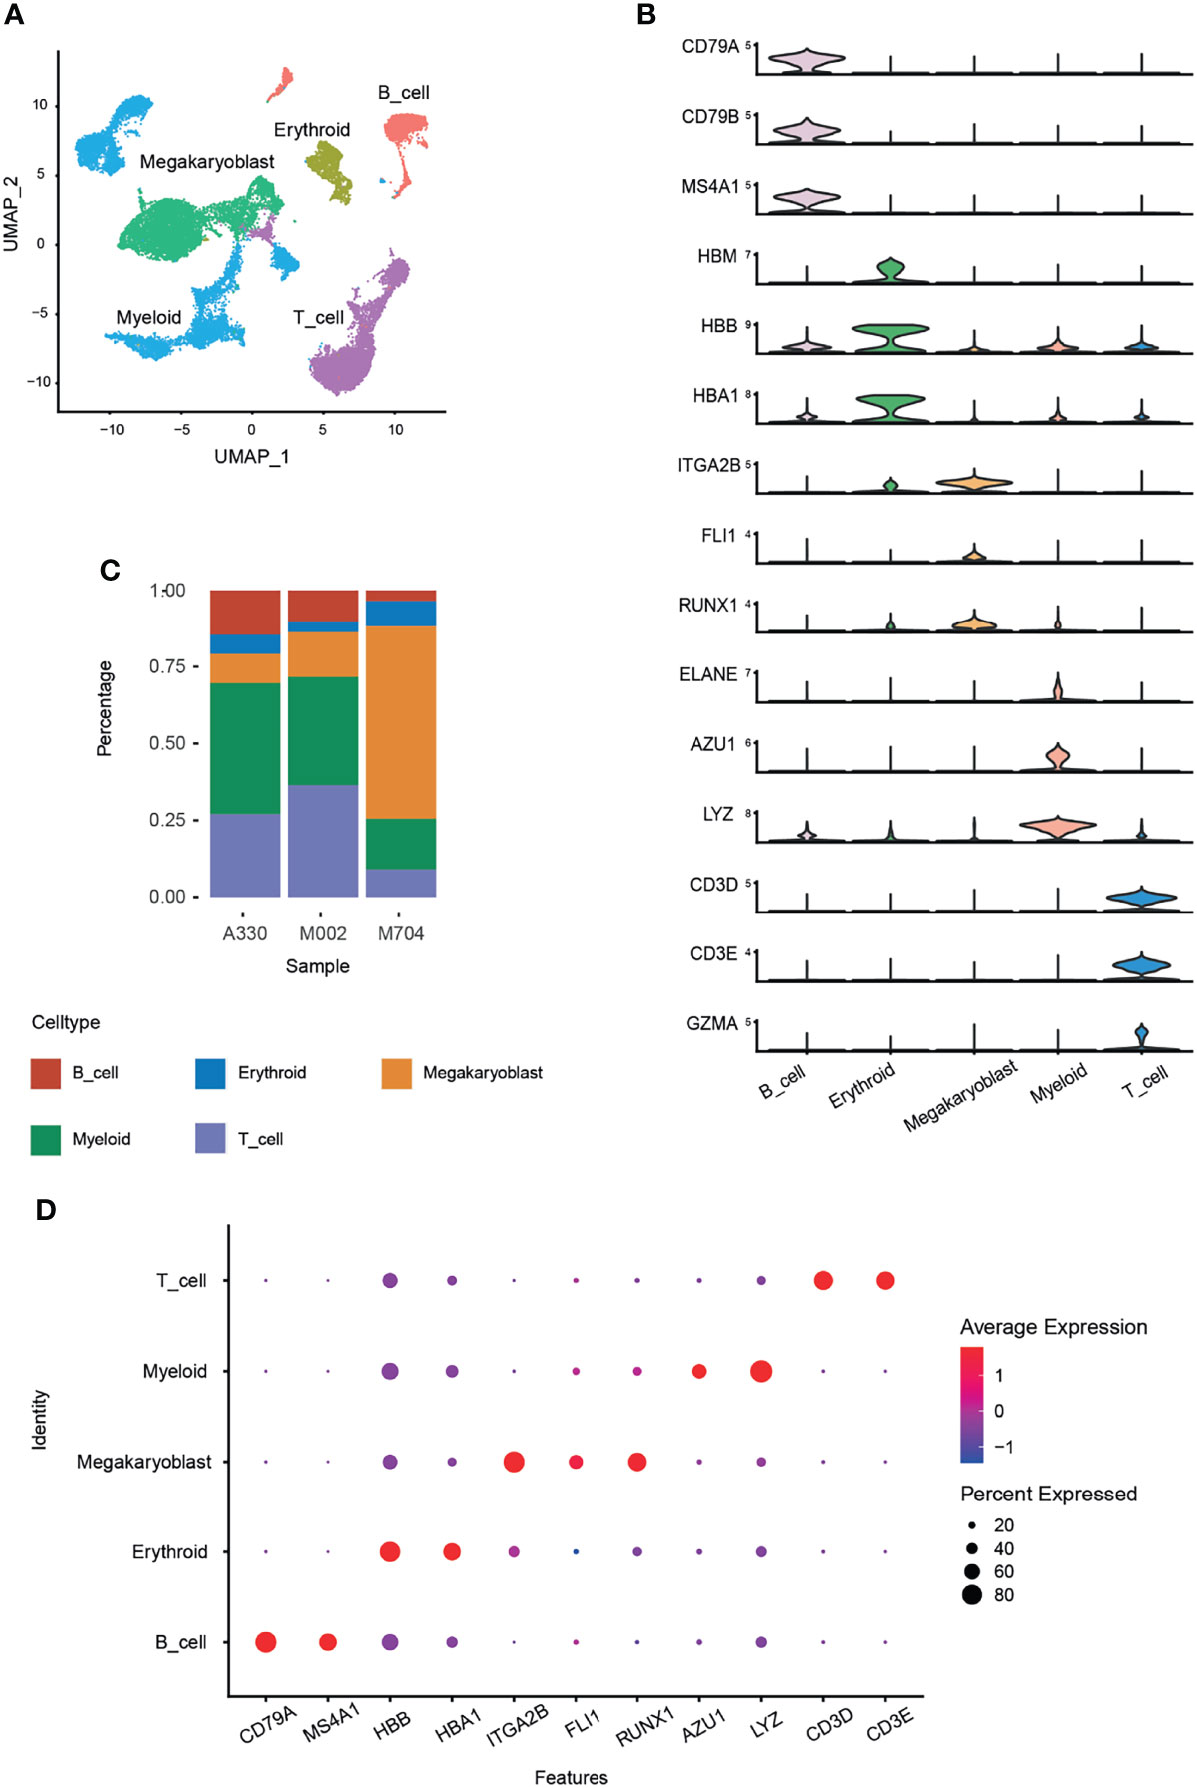
Figure 1 Identification of cell types using Seurat and Harmony packages. The bone marrow cells from three AMKL children were performed by scRNA-seq of the 10x genomics platform. A total of 24,387 cells were obtained after quality control. The batch effects were removed using the Harmony package. (A) The uniform manifold approximation and projection (UMAP) plot of the main cell types in AMKL samples. (B) The normal cell types were identified by classical marker genes, and the malignant cells, i.e., megakaryoblasts, were considered by canonical markers of megakaryoblastic lineage. (C) The proportion of the main cell types was calculated in each sample. (D) The dot plots show the average expression levels of signature genes in the main cell types.
To explore the intratumoral heterogeneity of AMKL, we compared the proportion of the cell types (Figure 1C) and found out that M704 had the highest proportion and number of megakaryoblasts, while A330 had the least. Interestingly, the T and B cells had an inverse outcome, with a significant higher composition in M002 and A330 than in M704. The intratumoral heterogeneity in the percentage of myeloid cells is in accordance with T and B cells. The myeloid cells incorporate granulocyte–monocyte progenitor cells (GMPs) and monocytes. The dot plot exhibited the typical high average expression and percent expressed in every cell identity explicitly (Figure 1D).
We obtained the subset of malignant AMKL cells. Generally, six clusters were identified based on the UMAP analysis (Figure 2A). Clusters 0, 2, and 4 were included in sample M704. Cursorily, cluster 1 was close to M002. Clusters 3 and 5 constituted sample A330. The clusters that belonged to different samples were far away from each other.
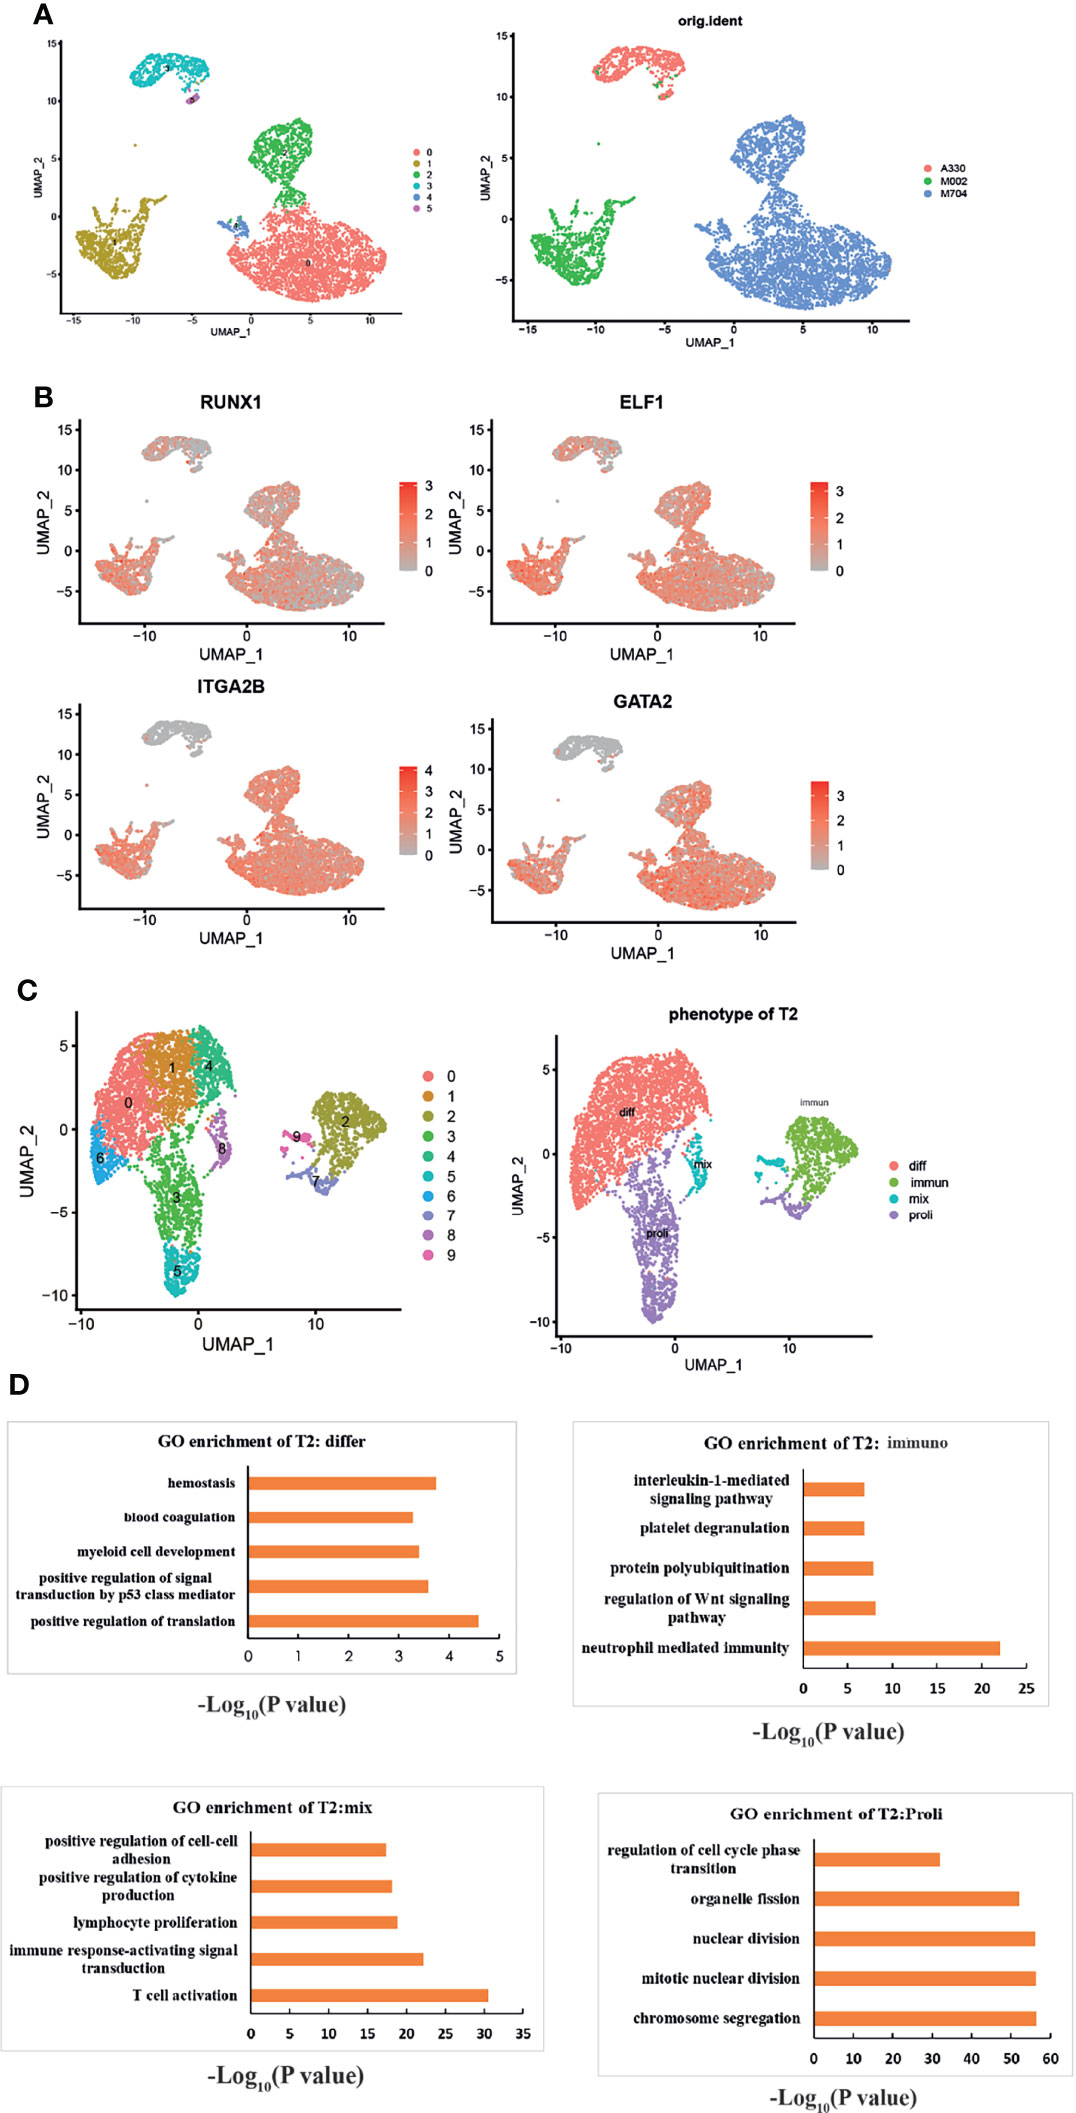
Figure 2 The intratumoral heterogeneity of abnormal megakaryoblasts. (A) The UMAP plots show six subclusters in the three samples. (B) UMAP plots showing the expression of the signature genes following the MK lineage. The distinct malignant cell types of immature-like T1 cells (highly expressed MK’s markers but not mature markers like ITGA2B) and mature-like T2 cells (highly expressed all MK’s markers especially mature markers like ITGA2B) were identified. The red color means the genes are highly expressed, and gray means low or not expressed. (C) UMAP visualization of four different phenotypes among T2. “Differ” refers to differentiation, “immune” refers to immunity, “mix” refers to mix lineages, and “proli” refers to proliferation. (D) The GO enrichment plots of each phenotype of T2. All enriched pathways and biological processes are under a p-value of 0.05 and correction of FDR.
Through the expressions of specific megakaryocytic lineage marker genes and some highly expressed genes in MKs, we explored the intratumoral heterogeneity of AMKL stepwise (Figure 2B). RUNX1 and GATA2 are essential for normal megakaryopoiesis (7). ELF1 (E74-like ETS transcription factor 1) is one the top 10 transcriptional factors (TFs) among MKs (5) in yolk sac (YS), which warrants further research. Experiments showed that platelet factor 4 (PF4), an inhibitor of megakaryopoiesis (8), is regulated by ELF1 (9). Interestingly, nearly all tumor clusters were highly expressing RUNX1 and ELF1, but the clusters that belonged to M002 and M704 had high expression of ITGA2B and GATA2. Therefore, we termed the tumor clusters 3 and 5 as T1 and clusters 0, 1, 2, and 4 as T2.
To have a deeper understanding of the heterogeneity in T2, we identified 10 subclusters through UMAP analysis (Figure 2C). Owing to signature genes in the top 10 DEGs of the clusters, we identified four major types of T2 (Figure 2C). For example, the expression of cell-cycle-associated genes of MCM5, TYMS, TOP2A, MKI67, UBE2C, and TUBB4B in clusters 3, 5, and 7 indicated the proliferating T2 cells. The clusters 3, 5, and 7 were termed as “Proli” then. In particular, the clusters 8 and 9 expressed many myeloid or lymphoid markers, such as LYZ, S100A9, IGLC2, and CD74. Clusters 8 and 9 were termed as “mix” population hereafter. In addition, clusters 0 and 6 expressed HBD, indicating for MK-erythroid progenitor (MEP)-like AMKL cells, and clusters 1 and 4 highly expressed the ribosomal genes, suggesting active protein synthesis progress. Then, we termed clusters 0, 1, 4, and 6 as “diff” cells (differentiated cells). The remaining cluster 2 was identified as “immun” (immunological cells) by the GO enrichment analysis (Figure 2D). Intriguingly, the enriched pathways in the immunological T2 cells were interleukin-1 (IL-1)-mediated signaling pathway, neutrophil-mediated immunity, regulation of Wnt signaling pathway, and protein polyubiquitination. In particular, the enrichment of the four subpopulations further consolidated our findings (Figure 2D). The “diff” subcluster was enriched in hemostasis, blood coagulation, and myeloid development. The proliferating subcluster exhibited regulation of cell cycle phase transition and nuclear division, while the “mix” malignant cells enriched in T-cell activation, positive regulation of cytokine production, and upregulation of cell–cell adhesion by the GO enrichment analysis.
We tried to identify the CBFA2T3-GLIS2 fusion-positive subpopulation by the immunotyping of bright CD56 (encoded by NCAM1) and negative HLA-DR according to a report (10) (Supplementary Figures S1A, B). Unfortunately, our results did not seem fully coordinated with the study, as M002 (mainly cluster 1) and A330 (including cluster 3,5) are both CBFA2T3-GLIS2 fusion positive, but had an opposite immunophenotype in terms of CD56 and HLA-DR.
We downloaded the single-cell transcriptional data for normal megakaryocytes (MKs) control from GEO (GSE144024) dataset. We analyzed the scRNA-seq data for FL following Zhou’s instructions (11). The results were in concert with Zhou’s figures. Then, we pooled the MKs, MK-erythroid-mast cell progenitors (MEMPs), and hematopoietic stem and progenitor cells (HSPCs) together with UMAP analysis. For further analysis, we collected MKs and MEMPs as the megakaryocytic cells and named them after MK instead. Then, we merged the malignant cells from A330, M002, and M704, with MK mentioned before (Figure 3A). Using UMAP analysis, 19 unbiased clusters were obtained (Figure 3B). Interestingly, the normal MK population from FL had overlaps with the abnormal megakaryoblastic cells, especially the ones from the M704 sample. Nevertheless, the normal megakaryocytic cells from the BM had little connection with malignant AMKL cells through UMAP analysis (Figure 4A). It can be postulated that the malignant AMKL cells had more similarities with immature MK cells from FL than BM.
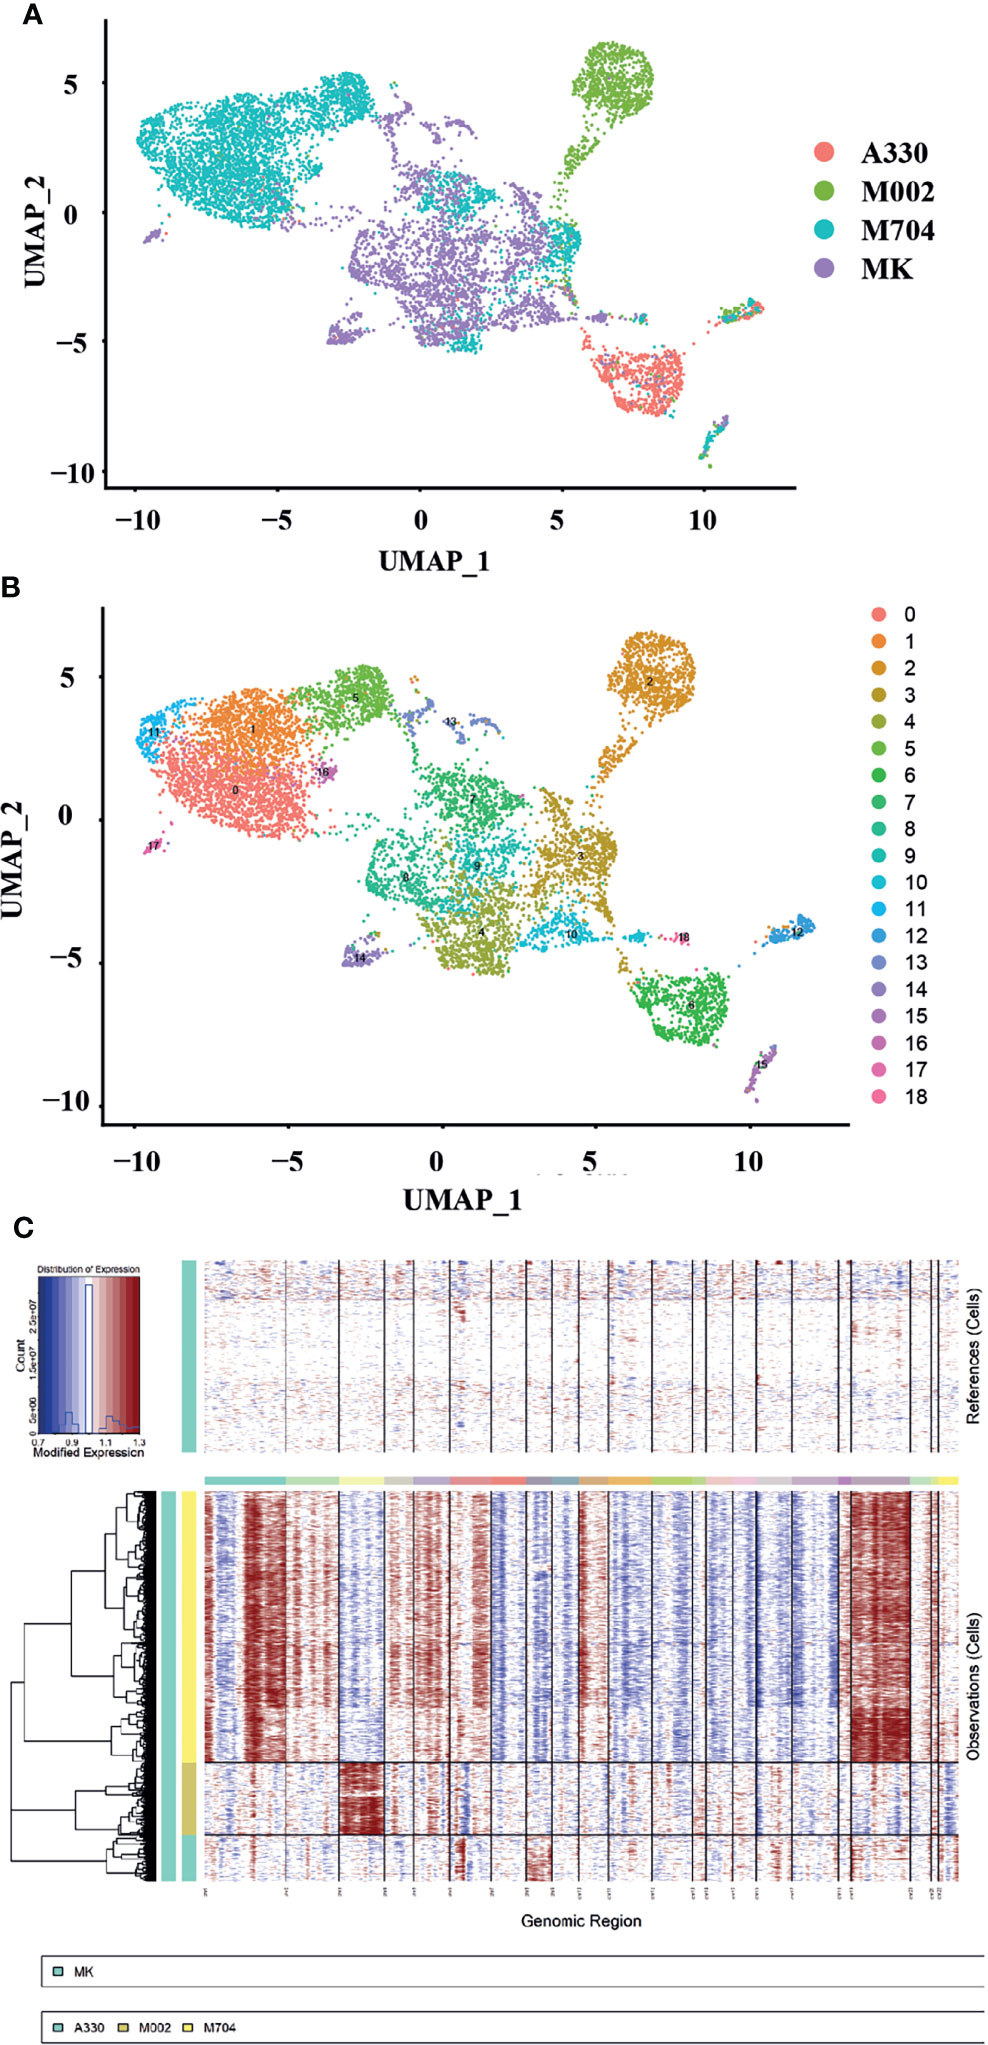
Figure 3 The single-cell landscape and copy number variance (CNV) speculation of the tumors and normal MK cells of the fetal liver (FL). (A, B) UMAP plots showing the single-cell landscape of tumor cells in AMKL and normal MK cells in FL (the control). (C) The plot shows the CNV levels of AMKL tumor and the normal control. The upper column represents the CNVs of normal FL MK cells. The x-axis exhibits chr1 to chr22. The y-axis exhibits the cell clusters. The red color represents the gain of copies, and blue represents loss of copies.
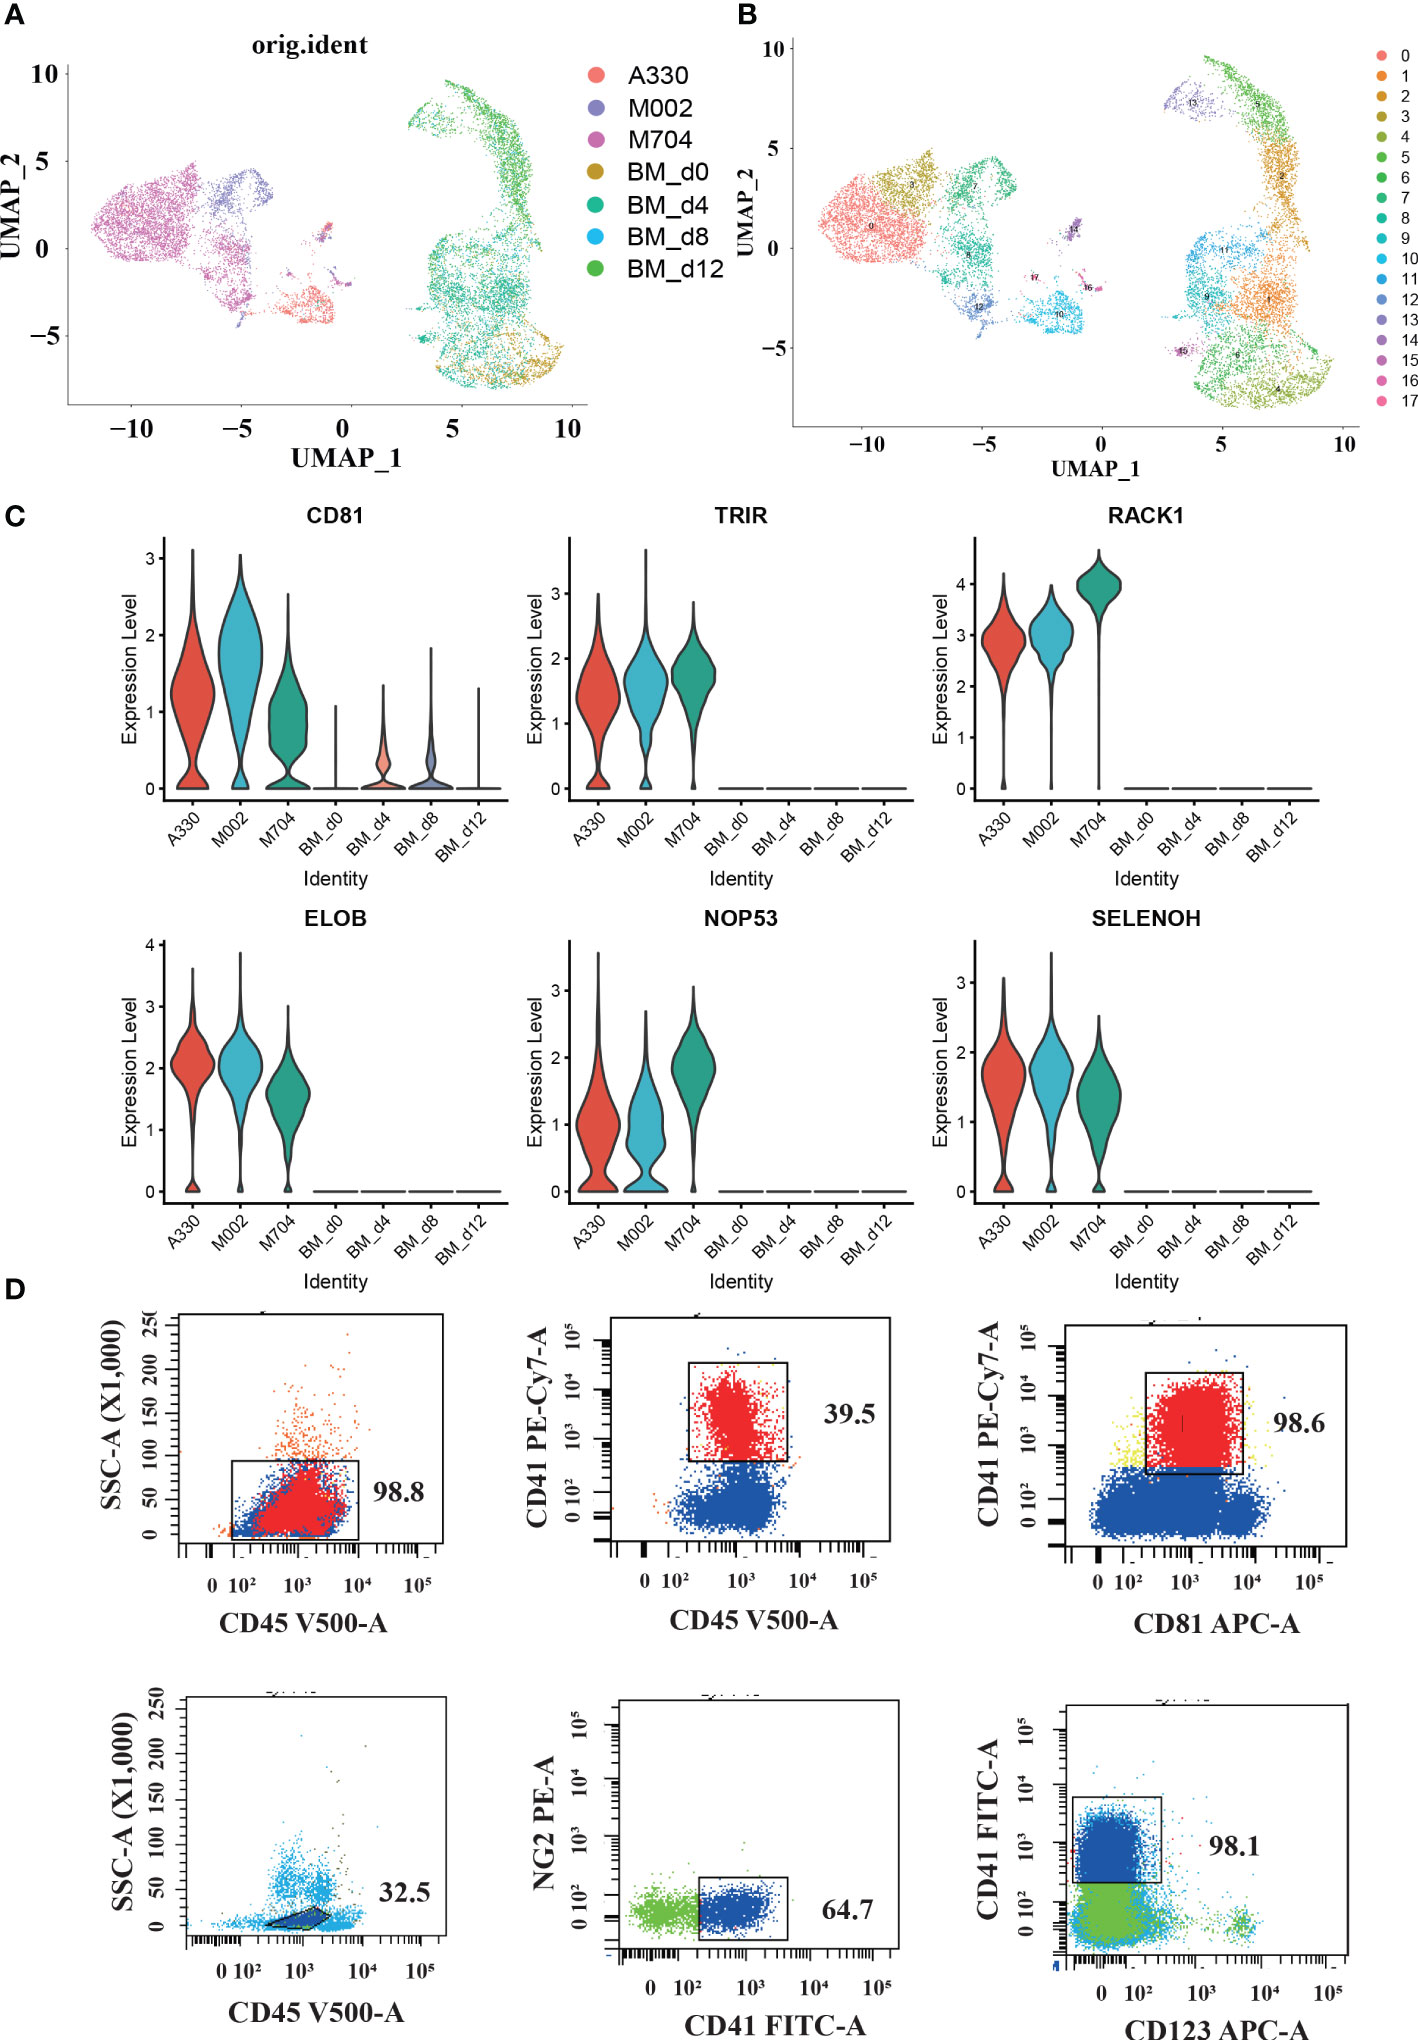
Figure 4 The single-cell profiling of tumor cells in AMKL and normal MK cells in the bone marrow (BM). (A, B) UMAP plots of the combination of malignant AMKL cells and normal MK cells in BMs. (C) Violin plots showing candidate marker genes in abnormal megakaryoblasts. (D) Surface immunophenotype of another AMKL patient.
To explore the copy number variations (CNVs) of abnormal AMKL cells, the inferCNV package was applied when using MK from FL as normal control (Figure 3C). The clonality analysis of abnormal megakaryoblastic cells placed the intratumoral heterogeneity into spotlight. Corresponding to the patients’ fluorescence in situ hybridization (FISH) analysis of chromosomes, the M704 had the most complexed CNVs (Supplementary Material, Png.S1, PPT.S1). The sample M704 gained a copy number of whole chromosomes 19 and 21 and large regions of chromosomes 1, 2, 4, 5, 6, 10, 18, and 20 while loss regions of chromosomes 7, 8, 9, 11, 12, 13, 14, 15, 16, and 17. For M002, an integrated copy number of chromosome 3 was acquired, and a nearly complete copy number of chromosome 8 was gained in A330. Some regions of chromosomes 1, 4, 5, 6, 12, 16, and 19 were gained in M002, and little parts of chromosomes 1, 2, 6, 14, 16, 17, 19, 20, and 22 were received within A330. Despite that the findings of aberrant chromosomes in A330 and M002 by FISH analysis seemed to be clear, which contradicts the clonality analysis, it might elucidate a higher accuracy of CNVs. In summary, M704 had much more complexing CNVs than A330 and M002 based on the FISH findings.
In order to explore the latent signature markers of AMKL, we combined our data with the downloaded scRNA-seq data of MK from BM (Figures 4A, B). First, we downloaded the data of hiBM (in vitro megakaryopoiesis model of BM) from National Omics Data Encyclopedia (NODE): OEP000756, OEP001150, and OEP001128. The time points of hiBM are D0, D4, D8, and D12. Then, we identified megakaryocytic cells through UMAP visualization and marker recognition. The megakaryocytic cells include MKs, MK progenitors (MKPs), MEPs, and immature MEPs (namely, MEP2s). As mentioned before, the abnormal AMKL cells are apart from the normal MKs. In particular, the A330 with least CNVs seems to be closer to the normal MKs.
Furthermore, we conducted comparisons between malignant AMKL cells and normal megakaryocytic cells to find some potential markers. The violin plots showed extraordinarily high expression of RACK1, ELOB, TRIR, NOP53, SELENOH, and CD81 in abnormal megakaryoblastic cells exclusively (Figure 4C). In addition, the normal megakaryocytic cells are confirmed with canonical genes by violin plots.
Studies have shown the diverse expression of CD81 in de novo AML and considered high expression of CD81 as a sign of poor prognosis (12). Meyling’s work enrolled FAB types M0, M1, M2, M4, M5, and M6, but not M7. Therefore, our study filled this up with the exclusively high expression of CD81 in the malignant cells of three AML-M7 (AMKL) BM samples through scRNA-seq analysis. Maybe, CD81 has relationships with the adverse prognosis in non-DS-AMKL. We also performed flow cytometry on another pediatric non-DS-AMKL; CD81 expression in the AMKL blasts were nearly 100% (98.6% for sample ZYL, Figure 4D).
The enrichment analysis of malignant cells showed G-protein-coupled receptor signaling pathway, regulation of DNA methylation-dependent heterochromatin assembly, alternative mRNA splicing via spliceosome, regulation of ubiquitin-dependent protein catabolic process, regulation of cytokine production, and positive regulation of cell communication (Figure 5A). According to KEGG analysis (Figure 5B), RNA degradation, ubiquitin-mediated proteolysis, proteasome, and spliceosome were enriched in abnormal AMKL cells. Undoubtedly, the normal megakaryocytic clusters are enriched in positive regulation of blood coagulation, platelet aggregation, and platelet activation.
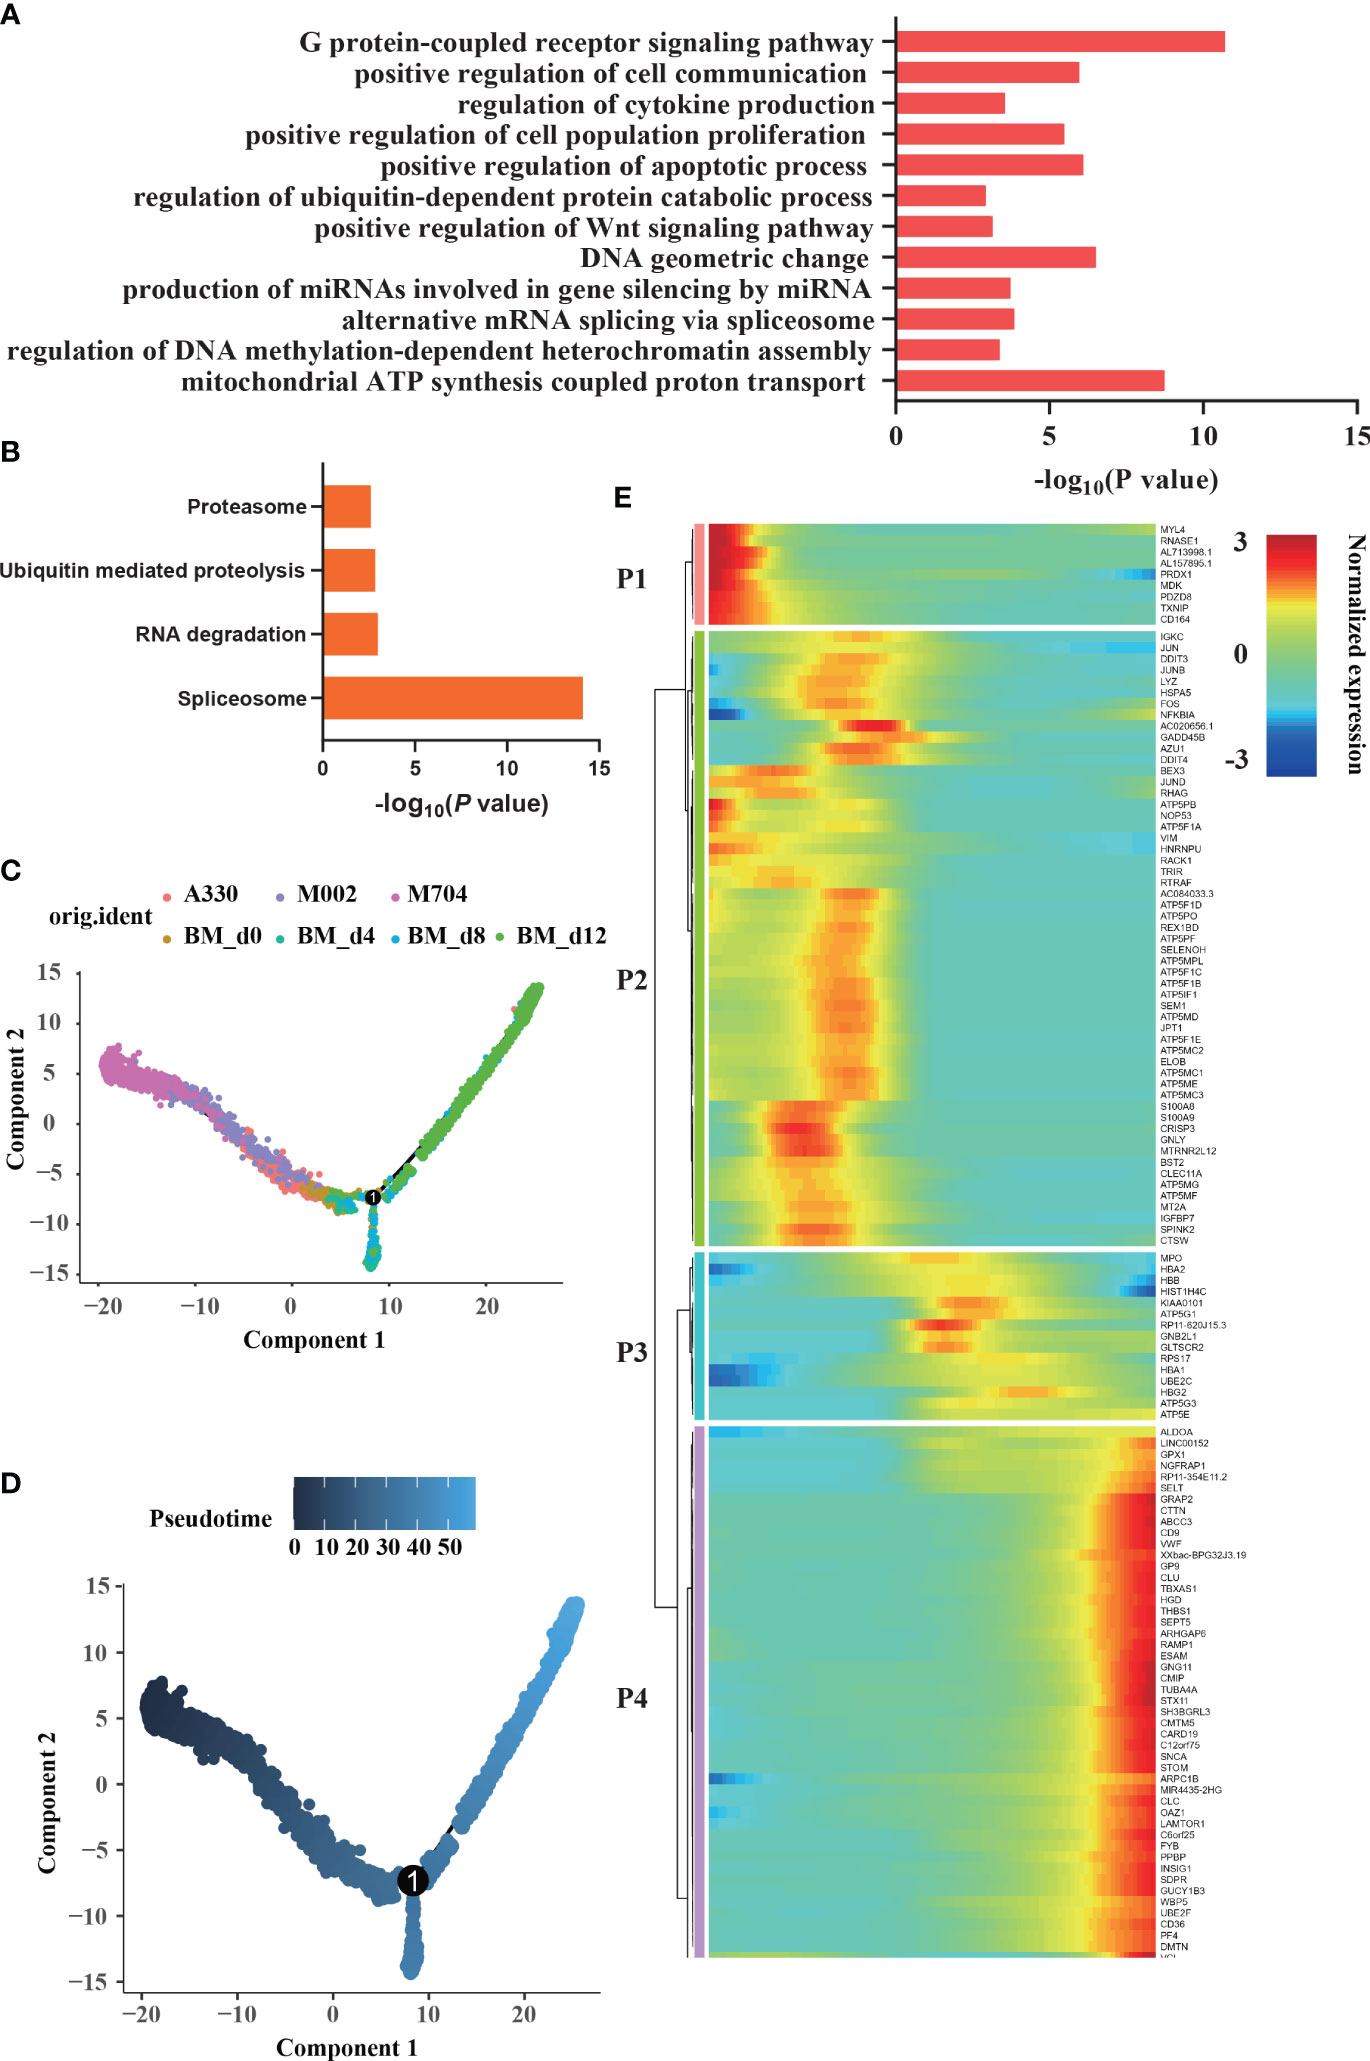
Figure 5 Enrichment and trajectory analyses of abnormal megakaryoblasts in AMKL and normal MK cells. (A, B) The enrichment of GO and KEGG of differentially expressed genes (DEGs) between megakaryoblasts in AMKL and normal MKs separately. (C, D) The trajectory analysis of megakaryoblasts in AMKL and normal MKs. The MKs (hiBM) were chosen from a human in vitro megakaryopoiesis model with time points of d0, d4, d8, and d12. (E) The heatmap showing the normalized expression of four gene sets naming P1, P2, P3, and P4. P1 stands for the DEGs highly expressed in tumors, while P4 stands for the ones highly expressed in normal mature MKs.
To further understand the difference of AMKL, trajectory analysis was performed (Figures 5C, D). Particularly, the abnormal AMKL cells were the root locus, which were even more primitive than the immature MEPs (Supplementary Figure S2B). Despite the MEPs bifurcated into megakaryocytic differentiation and erythroid-primed differentiation as time went by, M704 were the most primal cells at the beginning; meanwhile, A330 were the most differentiated cells shifted into the normal ones (Supplementary Figure S2A). Interestingly, M002 seemed to be the transition state of M704 and A330. As shown in the heatmap plot (Figure 5E), the gene set P1 enriched in malignant cells incorporate MDK, which is involved in the pathway of Nanog in mammalian ESC (embryonic stem cell) pluripotency. Indeed, NANOG plays a vital role in CSCs (cancer stem cells). MYL4 and PDZD8, the cytoskeleton-associated genes in P1, were inferred to the hyperproliferation of malignant cells. The immunology-related genes, namely, TXNIP and CD164, were also shown in P1. The findings of malignant cells highly confirmed our former discoveries.
The gene set P3 including genes HBB, HBA2, and HBA1 reinforced that the bifurcation was erythroid-primed differentiation. The genes like CD9, VWF, THBS1, PF4, and PPBP were enriched in the gene set P4, indicating MKs. The gene set P2 seemed to be in the middle of the root locus and normal MEPs. Strikingly, plenty of ATP-related genes and some proto-oncogenes (JUN, JUND, and FOS) were enriched in P2. The potential markers except CD81 were found in P2, which hinted that the potential markers had something to do with the immaturity of malignant cells. CD81 may be excluded from P2 because of the strict criterion set.
Aiming to have a deeper understanding of the crucial genes in the pseudotime trajectory, the curves were created in the plots (Figure 6; Supplementary Figures S3A, B). Surprisingly, the expression of FLI1 and GATA1 struck high in the start point of M704 and reached bottom in A330. However, the curve for GATA2 was descending smoothly. The expression of RUNX1 was likely to have the least variations. Overall, T1 (namely the blasts of A330) seemed to be more mature than T2 (malignant cells of M704 and M002).
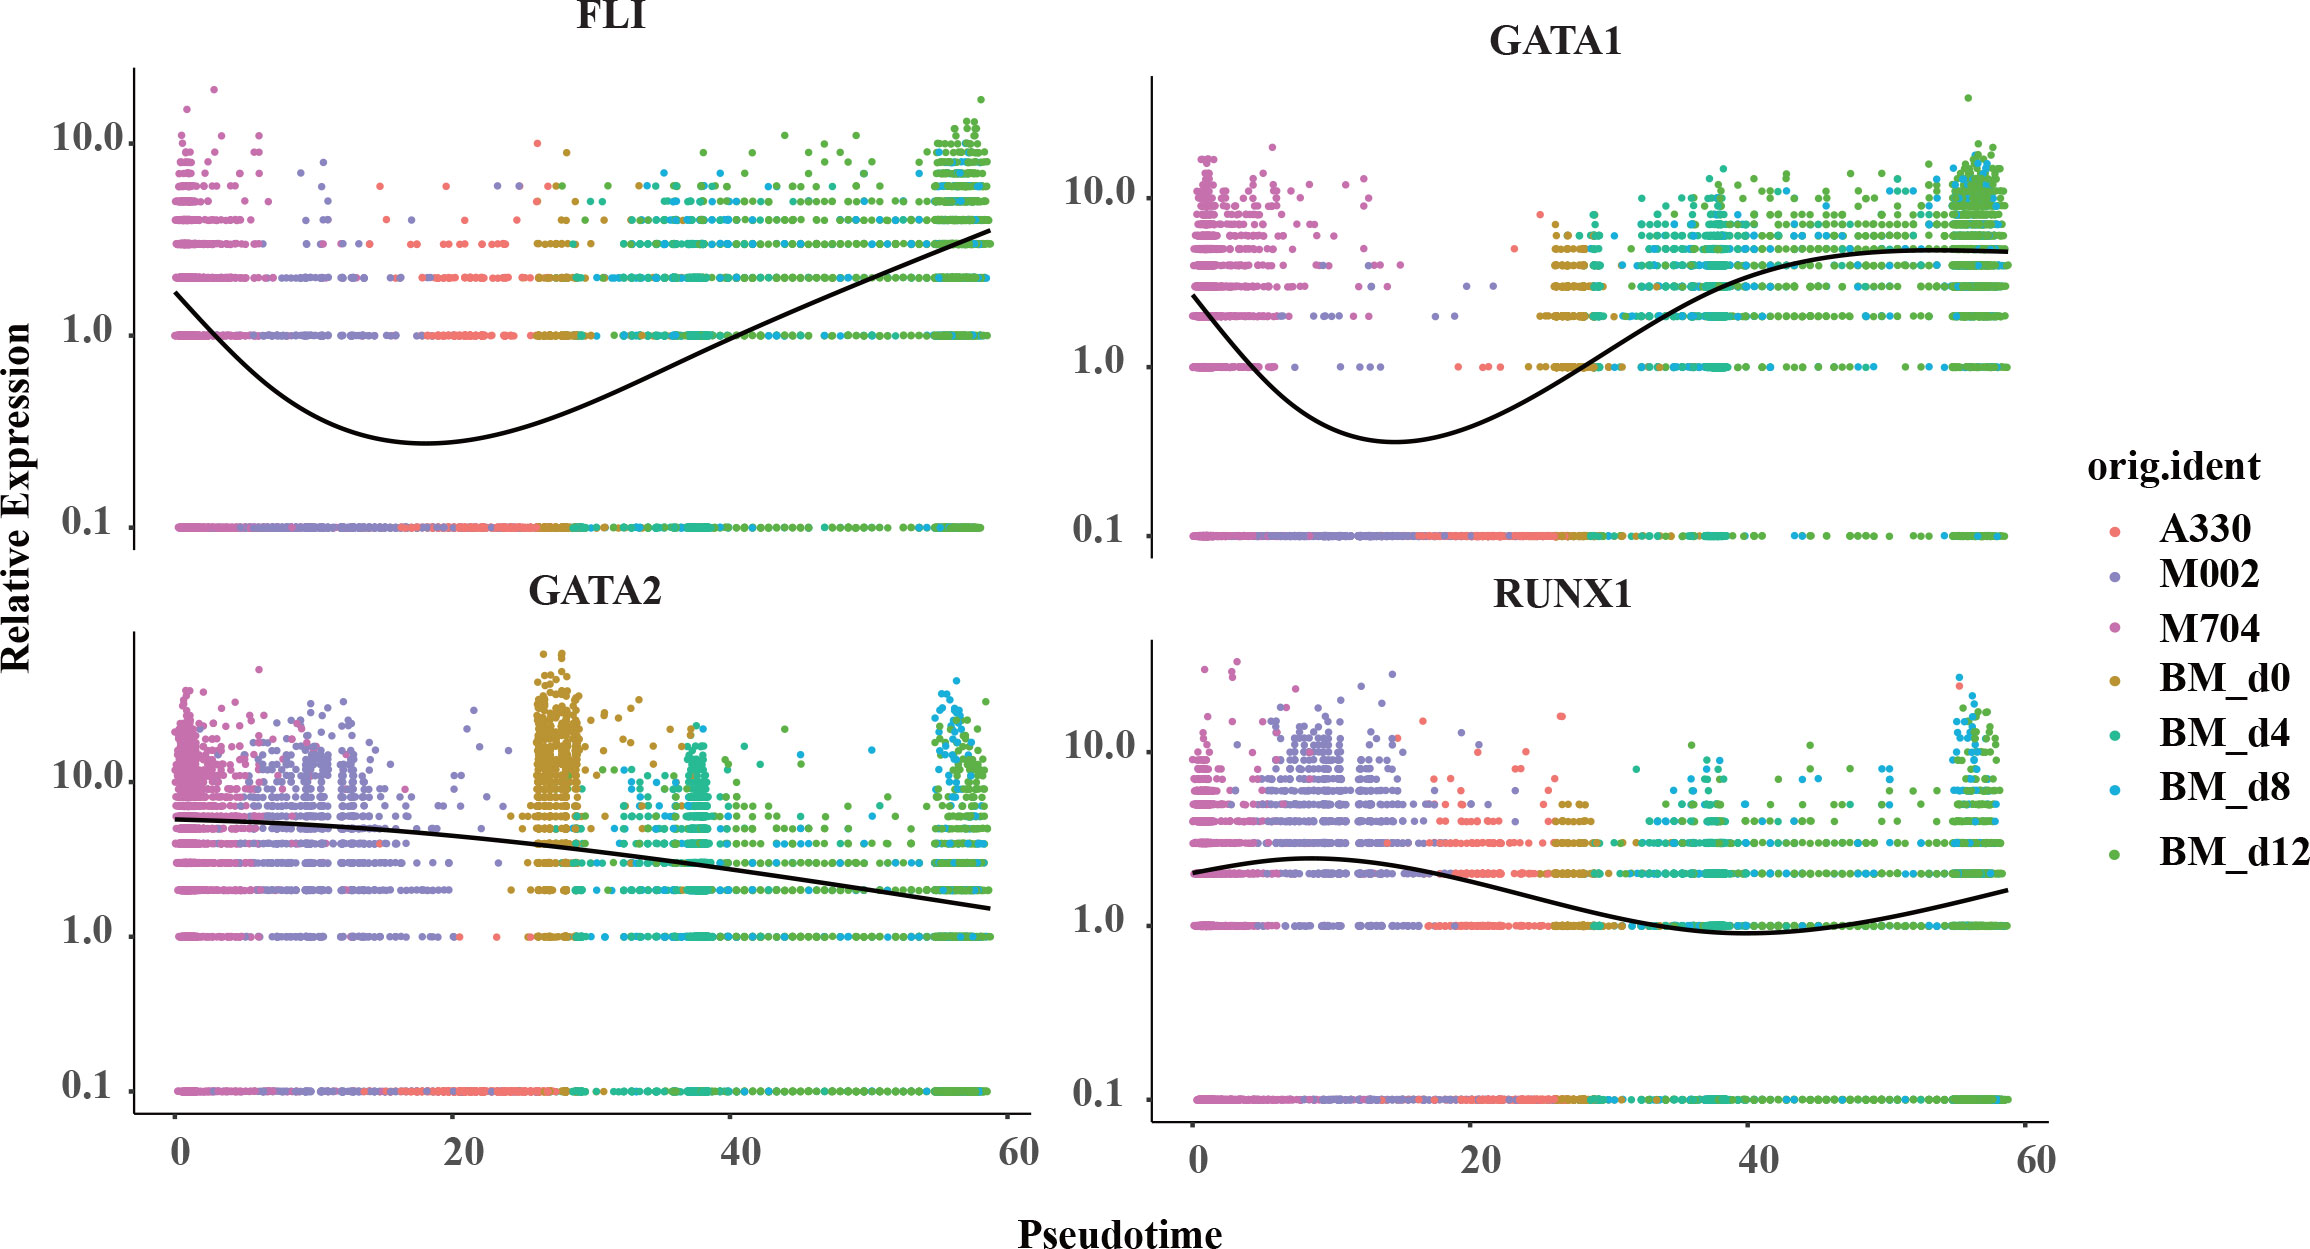
Figure 6 The pseudotime curve of the crucial signature genes in megakaryopoiesis. The pseudotime curve shows the transformation of marker genes FLI1, GATA1, GATA2, and RUNX1 in the combination of tumors in AMKL and normal MKs in hiBMs.
The acute megakaryoblastic leukemia without DS syndrome is highly heterogeneous with adverse prognosis (13). Although previous studies had found some chimeric oncogenes, such as CBFA2T3-GLIS2, RBM15-MKL1, and NUP98-KDM5A that played an important role in the tumorigenesis and oncogenesis (14–16), the pathological mechanism of non-DS-AMKL remains largely unknown. Herein, our study unveiled the heterogeneity of pediatric non-DS-AMKL and discovered that some markers might be drug targets by single-cell analysis. The intratumoral heterogeneity of AMKL was characterized with the diverse cell-type proportions, expressions of signature genes, enriched pathways, CNVs, trajectory, and immaturity of abnormal cells in different samples. The markers detected in the malignant AMKL cells including RACK1, ELOB, TRIR, NOP53, SELENOH, and CD81 might have relationships with the tumorigenesis or be therapeutic targets. Therefore, our study may provide insights for a deeper understanding of non-DS pediatric AMKL.
We dissected the single-cell atlas of AMKL and unveiled the cellular heterogeneity of different samples. M704 had the maximum scale of blasts and minimum scale of lymphocytes. As is shown in Supplementary Table S1, A330 and M002 were CBFA2T3-GLIS2 (i.e., ETO2-GLIS2) fusion positive, while M704 was RBM15-MKL1 (i.e., OTT-MAL) fusion positive. As reported, CBFA2T3-GLIS2 fusion (18.6%) is the most frequent fusion event in pediatric non-DS AMKL cohort alongside with inferior outcome (17). A Children’s Oncology Group (COG) pediatric AML study (16) showed that CBFA2T3-GLIS2 fusion was cooperated with little recurrent mutations and upregulation of CD56, which was coordinated with our findings. Both A330 and M002 were of normal karyotype. Although A330 had mutations of NBAS, it had been reported in recurrent acute liver failure (18) without connection with leukemia so far. A330 and M002 were both 100% positive in CD56, which seemed be to a feasible target of CBFA2T3-GLIS2 fusion-positive patients as predicted in the report (16). Intriguingly, the reported RBM15-MKL1 fusion was found only in infant AMKL (3), which is in disagreement with the non-AMKL case M704, whose age was 49 months old at the onset of disease.
To further understand the difference of the disease, we separated the malignant cells from the normal ones and discovered two subtypes termed as T1 and T2. T2 mainly includes M704 and M002, while T1 contains A330. T2 had a higher expression of GATA2, FLI1, GATA1, and ITGA2B than T1 but similar expression of RUNX1 and ELF1. Later, we found that T1 is more mature than T2 by Monocle2 algorithm. The findings were meaningful because the expression of GATA1 and ITGA2B was considered to rise while GATA2 and FLI1 to descend as the megakaryocyte differentiated (19). One guess of this paradox was the difference in fusion genes between T1 and T2. Maybe, CBFA2T3-GLIS2 fusions have stronger power to unbalance the relative expressions of GATA2 and GATA1 than RBM15-MKL1 fusions (4, 15). Thirant et al. (15) showed that CBFA2T3-GLIS2 oncogene can cause AMKL by upregulating ERG and downregulating GATA1 strikingly. On the other hand, RBM15-MKL1 activates RBPJ and MPL to induce AMKL as reported by Mercher et al. (20). However, it can hardly explain the expressions of RUNX1 and FLI1. Thus, a higher possibility might be the intratumoral heterogeneity due to abnormal megakaryopoiesis. As we know, GATA2 was downregulated while GATA1 was upregulated in normal megakaryopoiesis. However, it was discordant in the malignant AMKL cells and normal counterparts as shown in Figure 6. The changing expressions of RUNX1 and FLI1 showed a similar phenomenon, in which malignant cells do not mature as with the normal ones. This hinted that considering only one canonical marker such as GATA1 to be the measure of maturity in abnormal cells can lead to wrong answers.
The infercnv algorithm seemed to perform well in analyzing the CNVs of AMKL. The results kept up with the observation in FISH. It can be envisioned that M704 were in an aggressive state at the top of megakaryocytic differentiation with the most CNVs, M002 were the intermediate state, and A330 were the differentiated ones. Nevertheless, utilizing immunotyping of CBFA2T3-GLIS2 as in previous report (10) did not work out well. M002 with CBFA2T3-GLIS2 fusions is identical to the definition with positive CD56 and negative HLA-DR and CD45, but is reversed A330. Because our sample numbers are limited, the results may need further consolidation. One guess is that the heterogeneity of AMKL is far more complexed than that of other AMLs; thus, the report may not have taken into account enough non-DS AMKL.
Furthermore, we tried to find markers between malignant AMKL cells and normal MKs in the bone marrow. The markers, including RACK1, ELOB, TRIR, NOP53, SELENOH, and CD81, are exclusively expressed in abnormal counterparts, which might provide clues for the tumorigenesis and therapeutic targets. CD81 was found within blasts in comparison with that in fetal liver and other cell types. The flow cytometry results showing high expression of CD81 in AMKL blasts suggest a potential marker for AML-M7. Telomerase RNA component interacting RNase (TRIR) encoded by TRIR is also known as C19orf43 or fSAP18. TRIR is an exoribonuclease that may have functions in RNA cleavage, cancer suppression, and antiviral activities like other ribonucleases (21, 22), although it remains to be a novel target in tumors with largely unknown functions. The GO enrichment of upregulated genes in AMKL was associated with positive regulation of cell communication, cell proliferation, apoptosis, and Wnt signaling pathway, which were coordinated with Smith’s report (16).
In conclusion, our study provided the single-cell transcriptomic landscape of AMKL, which have not been established till now. We discovered the intratumoral heterogeneity of AMKL in single-cell resolution, which was shown in various cell-type proportions, disparate CNVs, gradual maturity of malignant cells, and varied momentous genes or pathways enrichment in different patients. We also find significant genes like RACK1, ELOB, TRIR, NOP53, SELENOH, and CD81, which might be potential markers and drug targets of AMKL. However, it was only explored in three samples, which were limited by the scarcity of AMKL cases. The potential targets shall be verified after more experiments, especially on CD81, which we highly recommend. After all, the non-DS-AMKL still needs further study to improve the clinical outcomes.
The original contributions presented in the study are publicly available. The datasets have been deposited in the National Genomics Data Center, accession code: PRJCA010386.
The studies involving human participants were reviewed and approved by the Medical Ethics Committee of the Children’s Hospital of Fudan University institutional review board. Written informed consent to participate in this study was provided by the participants’ legal guardian/next of kin. Written informed consent was obtained from the individual(s), and minor(s)’ legal guardian/next of kin, for the publication of any potentially identifiable images or data included in this article.
XWZ and MQ designed the research and are responsible for this study. NS and JY collected samples and clinical information and analyzed the single-cell RNA sequencing data. XWZ, MQ and NS drafted the manuscript. ZL, HW, YF, XQ, XHZ, HM, YY, WJ and JL provided valuable advice and contributed to sample collection and manuscript revision. All authors contributed to the article and approved the submitted version.
The work was supported by the National Natural Science Foundation of China (82141125), the Cyrus Tang Foundation (ZSBK0070), Shanghai Fudan University Education Development Foundation (ZSBK0046), Shanghai Municipal Committee of Science and Technology (19DZ1910602), and Shanghai Hospital Development Center (SHDC12019121).
Thanks for RD and JW's help in sample collection.
The authors declare that the research was conducted in the absence of any commercial or financial relationships that could be construed as a potential conflict of interest.
All claims expressed in this article are solely those of the authors and do not necessarily represent those of their affiliated organizations, or those of the publisher, the editors and the reviewers. Any product that may be evaluated in this article, or claim that may be made by its manufacturer, is not guaranteed or endorsed by the publisher.
The Supplementary Material for this article can be found online at: https://www.frontiersin.org/articles/10.3389/fonc.2022.915833/full#supplementary-material
1. Gassmann W, Loffler H. Acute megakaryoblastic leukemia. Leuk Lymphoma (1995) 18(Suppl 1):69–73. doi: 10.3109/10428199509075307
2. Qi H, Mao Y, Cao Q, Sun X, Kuai W, Song J, et al. Clinical characteristics and prognosis of 27 patients with childhood acute megakaryoblastic leukemia. Med Sci Monit (2020) 26:e922662. doi: 10.12659/MSM.922662
3. Gruber TA, Downing JR. The biology of pediatric acute megakaryoblastic leukemia. Blood (2015) 126(8):943–9. doi: 10.1182/blood-2015-05-567859
4. Masetti R, Guidi V, Ronchini L, Bertuccio NS, Locatelli F, Pession A. The changing scenario of non-down syndrome acute megakaryoblastic leukemia in children. Crit Rev Oncol Hematol (2019) 138:132–8. doi: 10.1016/j.critrevonc.2019.04.011
5. Li Z, Wang H, Dong R, Man J, Sun L, Qian X, et al. Single-cell RNA-seq reveals characteristics of malignant cells and immune microenvironment in subcutaneous panniculitis-like T-cell lymphoma. Front Oncol (2021) 11:611580. doi: 10.3389/fonc.2021.611580
6. Dong R, Yang R, Zhan Y, Lai HD, Ye CJ, Yao XY, et al. Single-cell characterization of malignant phenotypes and developmental trajectories of adrenal neuroblastoma. Cancer Cell (2020) 38(5):716–33 e6. doi: 10.1016/j.ccell.2020.08.014
7. Li YY, Jin C, Bai H, Gao YX, Sun S, Chen L, et al. Human NOTCH4 is a key target of RUNX1 in megakaryocytic differentiation. Blood (2018) 131(2):191–201. doi: 10.1182/blood-2017-04-780379
8. Lambert MP, Rauova L, Bailey M, Sola-Visner MC, Kowalska MA, Poncz M. Platelet factor 4 is a negative autocrine In vivo regulator of megakaryopoiesis: Clinical and therapeutic implications. Blood (2007) 110(4):1153–60. doi: 10.1182/blood-2007-01-067116
9. Okada Y, Nobori H, Shimizu M, Watanabe M, Yonekura M, Nakai T, et al. Multiple ETS family proteins regulate PF4 gene expression by binding to the same ETS binding site. PloS One (2011) 6(9):e24837. doi: 10.1371/journal.pone.0024837
10. Zangrando A, Cavagnero F, Scarparo P, Varotto E, Francescato S, Tregnago C, et al. CD56, HLA-DR, and CD45 recognize a subtype of childhood AML harboring CBFA2T3-GLIS2 fusion transcript. Cytometry A. (2021) 99(8):844–50. doi: 10.1002/cyto.a.24339
11. Wang H, He J, Xu C, Chen X, Yang H, Shi S, et al. Decoding human megakaryocyte development. Cell Stem Cell (2021) 28(3):535–49 e8. doi: 10.1016/j.stem.2020.11.006
12. Boyer T, Guihard S, Roumier C, Peyrouze P, Gonzales F, Berthon C, et al. Tetraspanin CD81 is an adverse prognostic marker in acute myeloid leukemia. Oncotarget (2016) 7(38):62377–85. doi: 10.18632/oncotarget.11481
13. Wang Y, Lu A, Jia Y, Zuo Y, Zhang L. Outcome and prognostic features in pediatric acute megakaryoblastic leukemia without down syndrome: A retrospective study in China. Clin Lymphoma Myeloma Leuk (2021) 21(4):e301–e8. doi: 10.1016/j.clml.2020.11.001
14. de Rooij JD, Masetti R, van den Heuvel-Eibrink MM, Cayuela JM, Trka J, Reinhardt D, et al. Recurrent abnormalities can be used for risk group stratification in pediatric AMKL: A retrospective intergroup study. Blood (2016) 127(26):3424–30. doi: 10.1182/blood-2016-01-695551
15. Thirant C, Ignacimouttou C, Lopez CK, Diop M, Le Mouel L, Thiollier C, et al. ETO2-GLIS2 hijacks transcriptional complexes to drive cellular identity and self-renewal in pediatric acute megakaryoblastic leukemia. Cancer Cell (2017) 31(3):452–65. doi: 10.1016/j.ccell.2017.02.006
16. Smith JL, Ries RE, Hylkema T, Alonzo TA, Gerbing RB, Santaguida MT, et al. Comprehensive transcriptome profiling of cryptic CBFA2T3-GLIS2 fusion-positive AML defines novel therapeutic options: A COG and TARGET pediatric AML study. Clin Cancer Res (2020) 26(3):726–37. doi: 10.1158/1078-0432.CCR-19-1800
17. de Rooij JD, Branstetter C, Ma J, Li Y, Walsh MP, Cheng J, et al. Pediatric non-down syndrome acute megakaryoblastic leukemia is characterized by distinct genomic subsets with varying outcomes. Nat Genet (2017) 49(3):451–6. doi: 10.1038/ng.3772
18. Ricci S, Lodi L, Serranti D, Moroni M, Belli G, Mancano G, et al. Immunological features of neuroblastoma amplified sequence deficiency: Report of the first case identified through newborn screening for primary immunodeficiency and review of the literature. Front Immunol (2019) 10:1955. doi: 10.3389/fimmu.2019.01955
19. Noetzli LJ, French SL, Machlus KR. New insights into the differentiation of megakaryocytes from hematopoietic progenitors. Arterioscler Thromb Vasc Biol (2019) 39(7):1288–300. doi: 10.1161/ATVBAHA.119.312129
20. Mercher T, Raffel GD, Moore SA, Cornejo MG, Baudry-Bluteau D, Cagnard N, et al. The OTT-MAL fusion oncogene activates RBPJ-mediated transcription and induces acute megakaryoblastic leukemia in a knockin mouse model. J Clin Invest (2009) 119(4):852–64. doi: 10.1172/JCI35901
21. Xie J, Chen Z, Zhang X, Chen H, Guan W. Identification of an RNase that preferentially cleaves a/G nucleotides. Sci Rep (2017) 7:45207. doi: 10.1038/srep45207
Keywords: acute megakaryoblastic leukemia, single cell RNA sequencing, intratumoral heterogeneity, non-DS-AMKL, RACK1, CD81
Citation: Su N, Li Z, Yang J, Fu Y, Zhu X, Miao H, Yu Y, Jiang W, Le J, Qian X, Wang H, Qian M and Zhai X (2022) Revealing the intratumoral heterogeneity of non-DS acute megakaryoblastic leukemia in single-cell resolution. Front. Oncol. 12:915833. doi: 10.3389/fonc.2022.915833
Received: 08 April 2022; Accepted: 22 June 2022;
Published: 08 August 2022.
Edited by:
Kaat Durinck, Ghent University, BelgiumReviewed by:
Elvin Wagenblast, Icahn School of Medicine at Mount Sinai, United StatesCopyright © 2022 Su, Li, Yang, Fu, Zhu, Miao, Yu, Jiang, Le, Qian, Wang, Qian and Zhai. This is an open-access article distributed under the terms of the Creative Commons Attribution License (CC BY). The use, distribution or reproduction in other forums is permitted, provided the original author(s) and the copyright owner(s) are credited and that the original publication in this journal is cited, in accordance with accepted academic practice. No use, distribution or reproduction is permitted which does not comply with these terms.
*Correspondence: Xiaowen Zhai, eHd6aGFpQGZ1ZGFuLmVkdS5jbg==; Maoxiang Qian, bXhxaWFuQGZ1ZGFuLmVkdS5jbg==; Hongsheng Wang, aG9uc3dhbmdAaG90bWFpbC5jb20=
†These authors have contibuted equally to this work
Disclaimer: All claims expressed in this article are solely those of the authors and do not necessarily represent those of their affiliated organizations, or those of the publisher, the editors and the reviewers. Any product that may be evaluated in this article or claim that may be made by its manufacturer is not guaranteed or endorsed by the publisher.
Research integrity at Frontiers
Learn more about the work of our research integrity team to safeguard the quality of each article we publish.