
95% of researchers rate our articles as excellent or good
Learn more about the work of our research integrity team to safeguard the quality of each article we publish.
Find out more
ORIGINAL RESEARCH article
Front. Oncol. , 30 June 2022
Sec. Cancer Imaging and Image-directed Interventions
Volume 12 - 2022 | https://doi.org/10.3389/fonc.2022.911790
This article is part of the Research Topic Advanced Imaging in Breast Cancer: New Hopes, New Horizons! View all 22 articles
This study aimed to evaluate the role of apparent diffusion coefficient (ADC) values obtained from diffusion-weighted imaging (DWI) in the differentiation of malignant from benign papillary breast lesions. The magnetic resonance imaging (MRI) data of 94 breast papillary lesions confirmed by pathology were retrospectively analyzed. The differences in ADC values of papillary lesions under different enhancements in MRI and different pathological types were investigated, and the ADC threshold was determined by the receiver operating characteristic curve for its potential diagnostic value. The mean ADC values in borderline and malignant lesions (1.01 ± 0.20 × 10⁻³ mm2/s) were significantly lower compared to benign lesions (1.21 ± 0.27 × 10⁻³ mm2/s) (P < 0.05). The optimal threshold of the ADC value could be 1.00 × 10⁻³ mm2/s. The ADC values were statistically significant in differentiating between benign and malignant papillary lesions whether in mass or non-mass enhancement (P < 0.05). However, there were no statistical differences in the ADC values among borderline or any other histological subtypes of malignant lesions (P > 0.05). Measuring ADC values from DWI can be used to identify benign and malignant breast papillary lesions. The diagnostic performance of the ADC value in identifying benign and malignant breast lesions is not affected by the way of lesion enhancement. However, it shows no use for differential diagnosis among malignant lesion subtypes for now. The ADC value of 1.00 × 10⁻³ mm2/s can be used as the most appropriate threshold for distinguishing between benign and malignant breast papillary lesions.
Papillary breast lesions indicate a heterogeneous group of diseases including benign intraductal papilloma (IDP), borderline intraductal papilloma with atypical hyperplasia [intraductal papilloma with atypical ductal hyperplasia (ADH)], and malignant papillary lesions. Intraductal papilloma with ductal carcinoma in situ (intraductal papilloma with DCIS), papillary ductal carcinoma in situ (papillary DCIS), encapsulated papillary carcinoma (EPC), solid papillary carcinoma (SPC), and invasive papillary carcinoma (IPC) fall into the third category (1). Papillary protrusions with a dendritic fibrovascular stroma represent the general histopathological feature of papillary breast lesions (2).
Magnetic resonance imaging (MRI) is widely applied in detecting papillary breast lesions as a prominently viable imaging modality. Due to the diversity of pathological subtypes, the variability among observational factors in MRI, such as morphology feature, enhancement mode, and time–signal intensity curve, and coupled with the absence of evidence from large samples or prospective studies (3–6), the imaging diagnostic criteria for papillary lesions have not been unified. Diffusion-weighted imaging (DWI) is emerging as a favorable alternative for deriving perfusion information to complement dynamic contrast-enhanced magnetic resonance imaging of the breast. By calculating the apparent diffusion coefficient (ADC), DWI, which is sensitive to water diffusion, can provide a quantitative analysis of both the cellularity and perfusion of tumors and has the potential to provide an evaluation of lesion characterization. Hyunseok Seo reports that a high-resolution ADC map and a DWI can be accurately obtained by using isotropic diffusion-weighted imaging while reducing the artifacts caused by the diffusion anisotropy, compared to diffusion-weighted echo-planar-imaging (7). More other studies have already proved DWI and ADC values as promising tools in breast lesion detection, prognostic assessment, and therapeutic response prediction (8–10).
However, fewer studies were capable of proving DWI’s positive association with a diagnosis of breast papillary lesions, which contributed to the limited use of breast DWI in clinical practice. This retrospective study analyzes the mean ADC values observed from 94 different papillary breast lesions and aims to evaluate the role of ADC values in distinguishing malignant from benign lesions, especially in differentiating the histological subtypes of malignant lesions as well as in assessing the potential diagnostic contribution to papillary lesions in different enhancements.
Clinical data were collected retrospectively on 69 female patients with papillary lesions who were admitted to our hospital from January 2021 to February 2022, with a total of 94 lesions. Among them, 51 cases were benign breast papillary lesions, all of which were IDP; 16 cases were borderline lesions, all of which were intraductal papilloma with ADH; and 27 cases were malignant lesions, including 13 cases of intraductal papilloma with DCIS, 3 cases of papillary DCIS, 1 case of EPC, 9 cases of SPC and 1 case of IPC. The inclusion criteria for this study were as follows: breast papillary lesions confirmed by postoperative pathology (one patient may have multiple lesions) and preoperative MRI examination was available from which the ADC values of the lesions corresponding to the postoperative pathology could be obtained on DWI. The exclusion criteria were as follows: lesions with non-high signal on DWI—namely, ADC values could not be obtained—and lesions with the coexistence of multiple pathological types, of which it was impossible to determine what kind of pathological type the ADC value belongs to.
Imaging was performed on the same 3T MR unit (Philips Ingenia). All patients were in the prone position. The Philips MRI scanning sequence included the following: (1) cross-sectional T2WI, using two-dimensional fast spin-echo sequence, SPAIR fat suppression, and the following scanning parameters: TR/TE, 5,000/65 ms; slice thickness/slice interval, 4/1 mm; FOV, 37.2 cm; matrix, 465 × 381; (2) cross-sectional diffusion-weighted imaging DWI, using single-shot SE-EPI sequence, NEX = 1, SPIR + SSGR fat suppression, b = 0, 800 s/mm2, and the following scanning parameters: TR/TE, 5,100/72 ms; layer thickness/layer spacing, 4/1 mm; FOV, 35 cm; matrix, 136 × 140; and (3) cross-sectional dynamic enhancement, three-dimensional gradient-echo sequence, and SPIR fat suppression. First, the plain scanned images were acquired and then collected by 4 to 5 consecutive phases without intervals after injecting the contrast agent (gadopentetate meglumine), followed by injection in the amount of 0.1 mmol/kg with a high-pressure syringe through the dorsal vein of the hand at a flow rate of 2.0 ml/s and then 15 ml of normal saline at the same flow rate. The scanning parameters were as follows: TR/TE, 4.2/2.1 ms; layer thickness/layer spacing, 1/0 mm; flip angle, 12°; FOV, 34 cm; and matrix, 407 × 404. Each scan lasted for 65 s. Imaging of all lesions was analyzed in consensus by two experienced breast radiologists. The solid area was selected at the layer with the largest diameter of the lesion to delineate the region of interest (ROI) on DWI corresponding to T2WI, dynamic enhancement, and subtraction images. The necrotic, cystic hemorrhagic parts of the lesion and where ROI was smaller than the range of the high signal area should be avoided as much as possible. The ADC value of the solid component of the lesion was measured on ADC maps.
Statistical analysis was performed using IBM SPSS 26.0 (the mean ADC value was made for lesions whose ADC values were presented as a range). The statistical diagram was performed by GraphPad Prism 8.4. T-test or one-way analysis of variance was used to compare the quantitative variables between two groups and the Bonferroni method for multiple comparisons. The receiver operating characteristic (ROC) curves were constructed to obtain the area under the curve (AUC) and the optimal threshold of the ADC value with its sensitivity and specificity for potential diagnosis contribution to papillary lesions. P-value <0.05 was considered statistically significant.
This study included a total of 94 papillary lesions of 69 patients ranging from 31 to 73 years old. The lesions were categorized as mass and non-mass enhancement according to the BI-RADS fifth edition (11). Among them, 54 cases were mass lesions, while 40 cases were non-mass lesions; 35 cases were lesions with diameters <1 cm, while the others were with diameters ≥1 cm. The general features of benign, borderline, and malignant lesions are summarized in Table 1.
The mean ADC values of benign, borderline, and malignant papillary lesions are shown in Table 2. The ADC values of benign papillary lesions (1.21 ± 0.27 × 10⁻³ mm2/s) were significantly higher than those of borderline and malignant papillary lesions (1.03 ± 0.19 × 10⁻³ mm2/s and 1.00 ± 0.21 × 10⁻³ mm2/s) (P < 0.05), while the ADC values proved no significant difference between borderline lesions and malignant lesions (P > 0.05) (Figure 1).
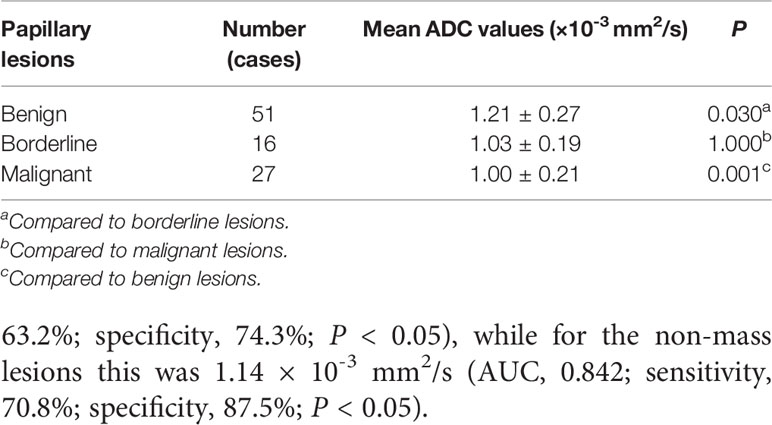
Table 2 Comparison of the mean apparent diffusion coefficient (ADC) values among benign, borderline, and malignant papillary breast lesions.
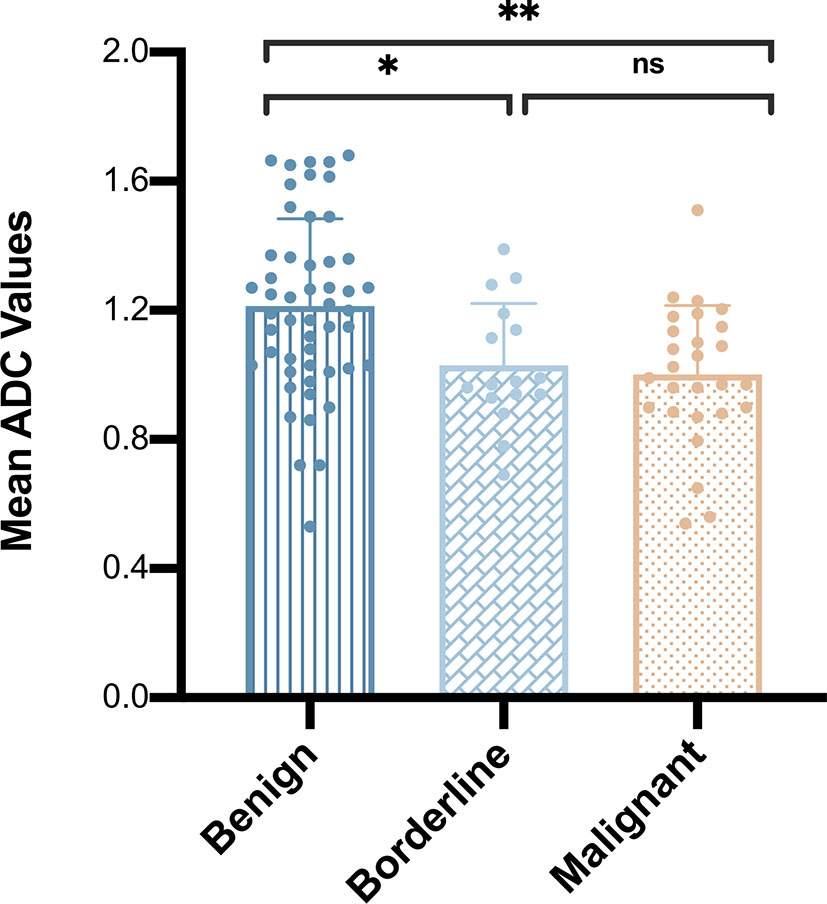
Figure 1 Comparison of mean apparent diffusion coefficient values among benign, borderline, and malignant papillary breast lesions. *P < 0.05; **P < 0.01; ns, P > 0.05.
In total, 13 cases of borderline papillary lesions were all intraductal papilloma with ADH, of which the mean ADC value was 1.03 ± 0.19 × 10⁻³ mm2/s. Among malignant papillary lesions, the mean ADC value of 13 cases of intraductal papilloma with DCIS was 1.05 ± 0.12 × 10⁻³ mm2/s, the mean ADC value of 3 cases of papillary DCIS was 1.08 ± 0.49 × 10⁻³ mm2/s, there was only 1 case of EPC and IPC each, and the ADC values were 1.15 × 10⁻³ mm2/s and 0.99 × 10⁻³ mm2/s respectively. SPC had the lowest mean ADC value which was 0.89 ± 0.21 × 10⁻³ mm2/s. However, there was no significant difference in the mean ADC values of borderline or any other malignant lesion subtypes (P > 0.05) (Figure 2). The MRI features of 3 different lesion subtypes are shown in Figures 3–5.
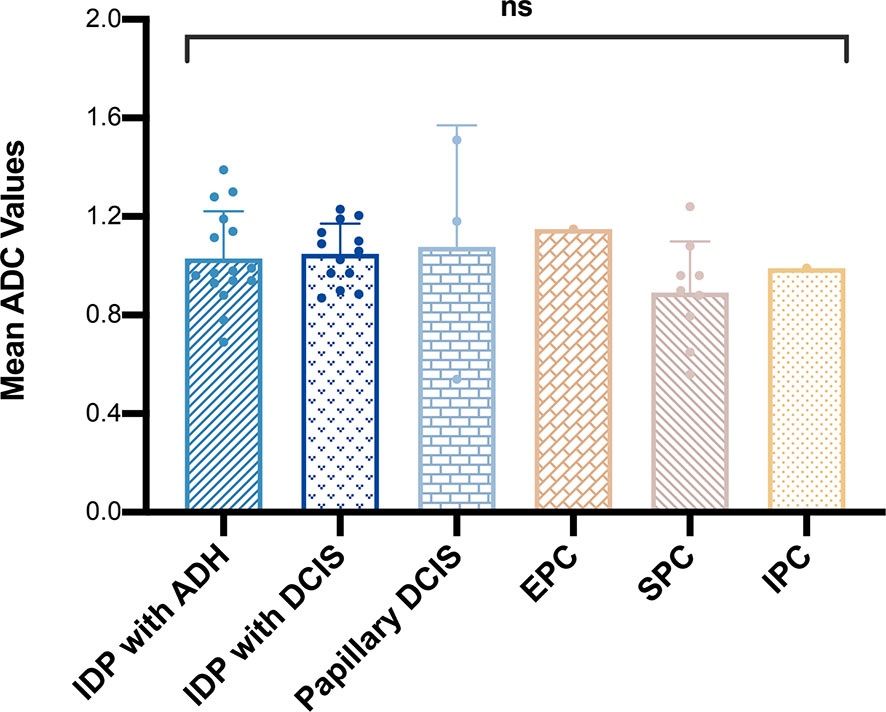
Figure 2 Comparison of mean apparent diffusion coefficient values among different malignant papillary breast lesion subtypes. ns, P > 0.05.
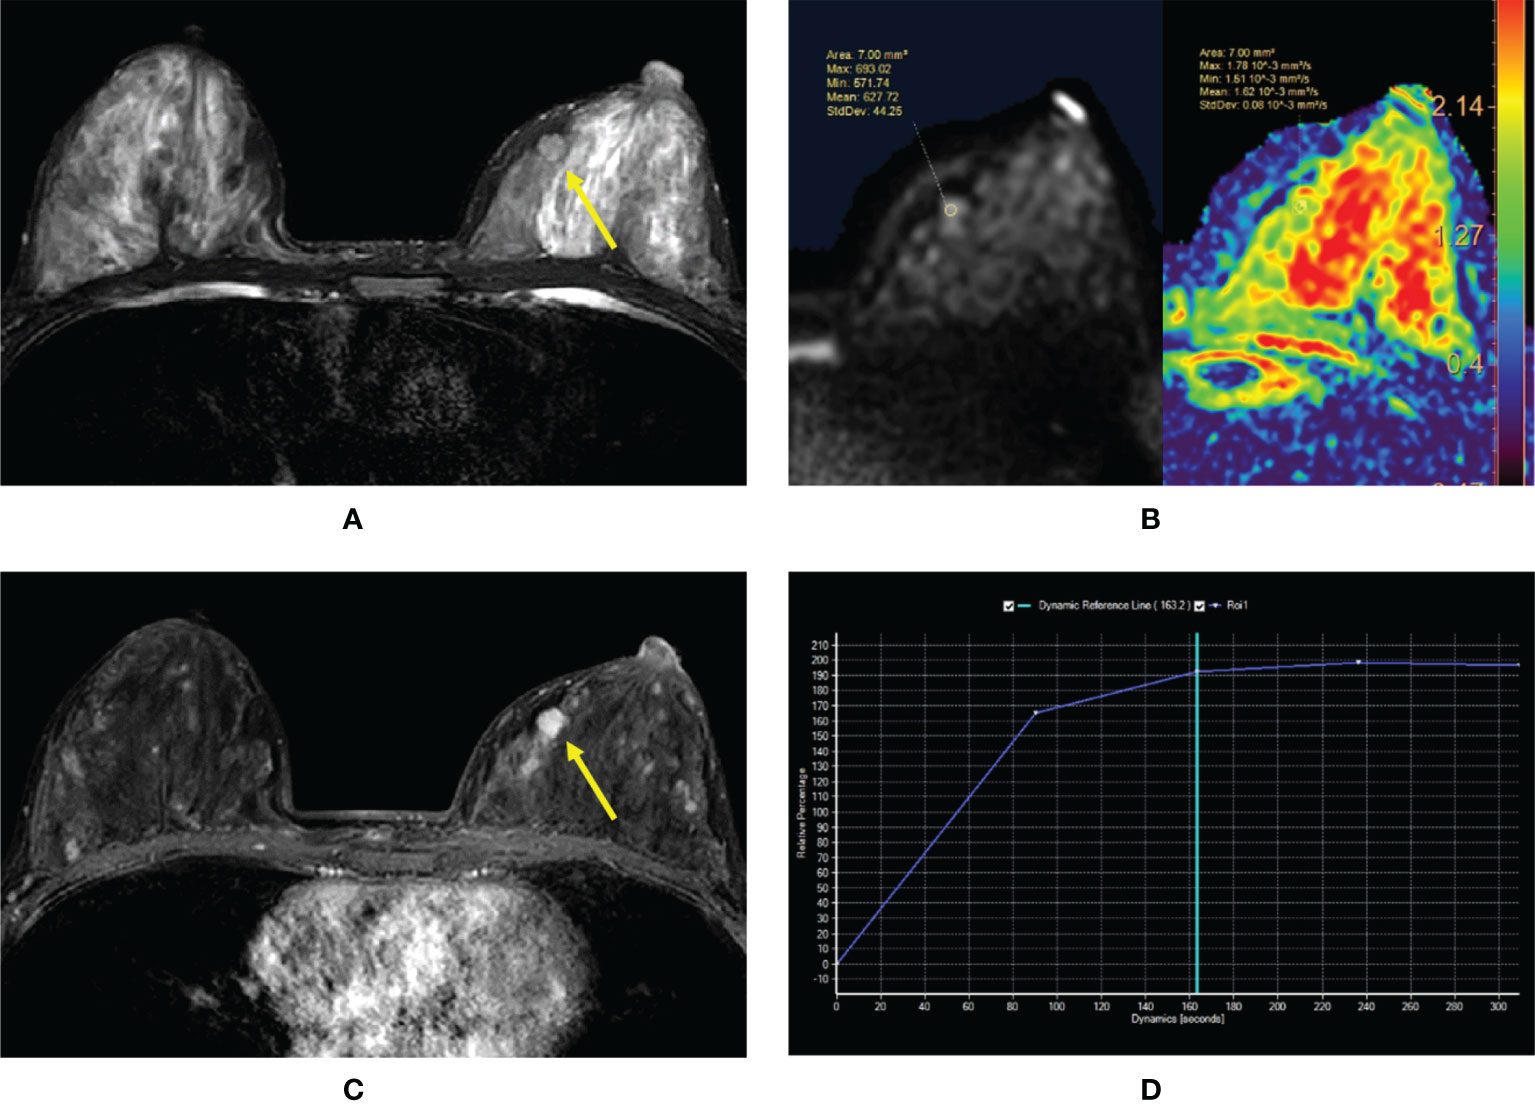
Figure 3 (A–D) Intraductal papilloma in a 38-year-old woman. (A) T2-weighted image showing an isointensity signal mass lesion (yellow arrow) in the left breast. (B) Diffusion-weighted imaging showing a hyperintensity signal and apparent diffusion coefficient (ADC) map showing mean ADC = 1.62 × 10⁻³ mm2/s. (C) Enhanced T1-weighted image showing a strong nodular enhancement (yellow arrow) with clear margins. (D) Time–signal intensity curve manifests as a rapid increase (initial phases) and a plateau type (delayed phases).
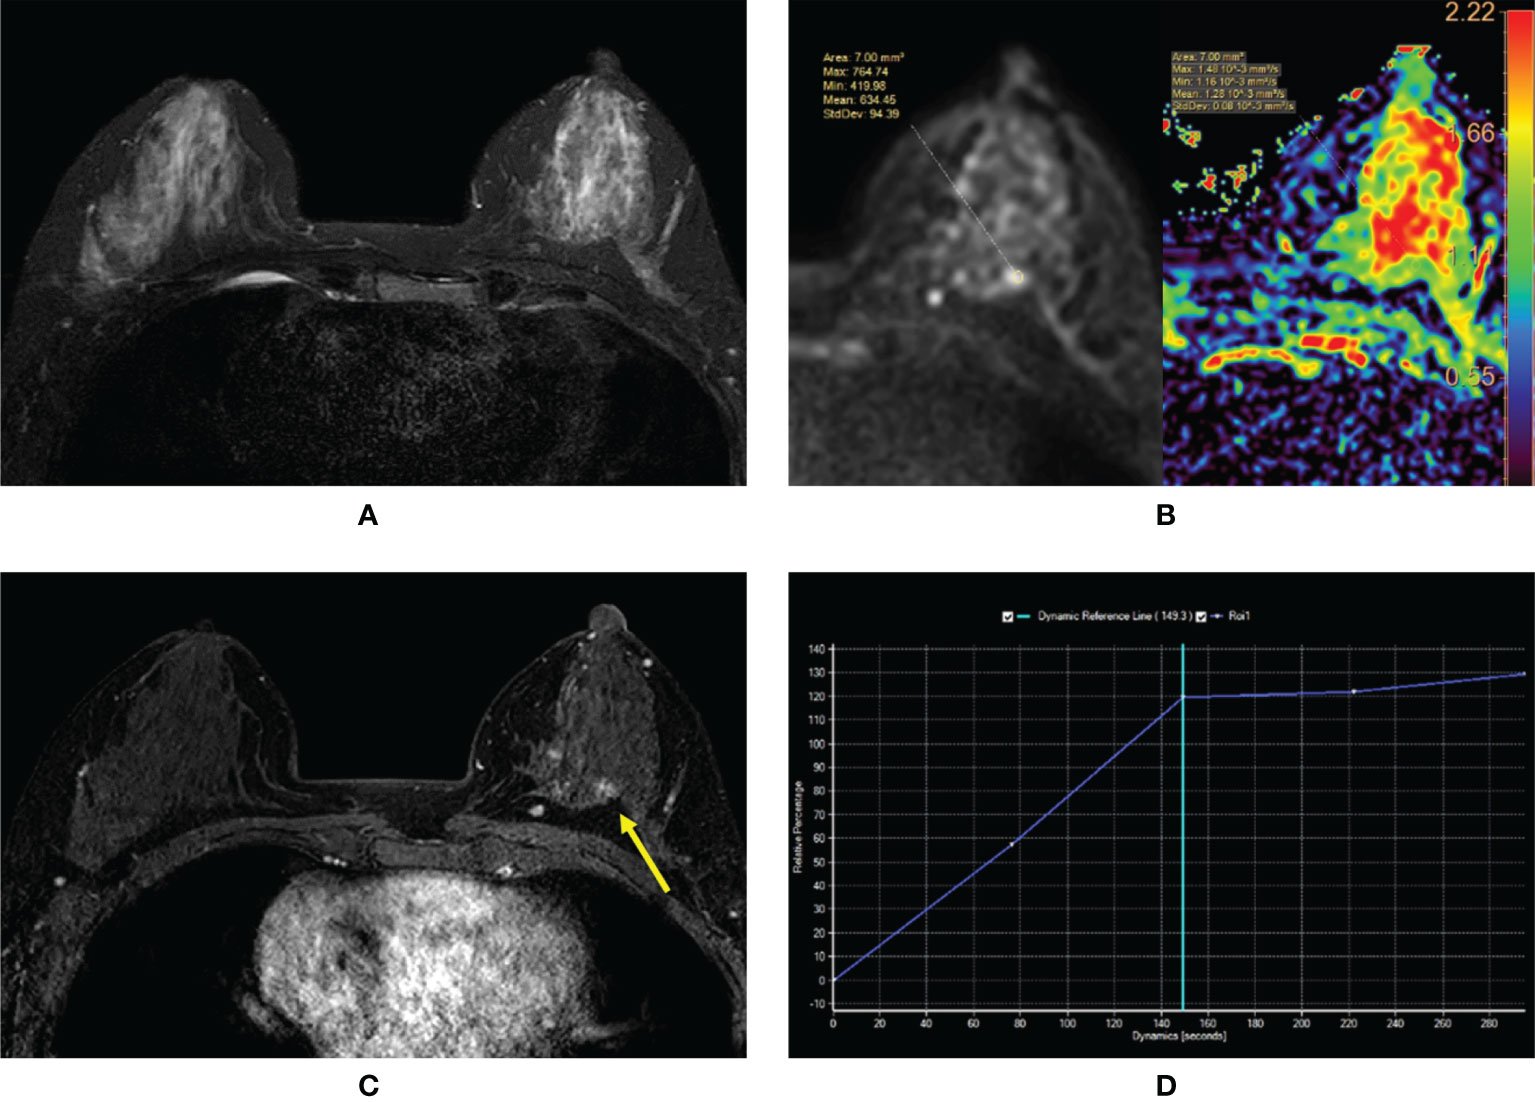
Figure 4 (A–D) Intraductal papilloma with atypical ductal hyperplasia in a 43-year-old woman. (A) T2-weighted image showing an isointensity signal and unclear lesion in the left breast. (B) Diffusion-weighted imaging showing a hyperintensity signal and apparent diffusion coefficient (ADC) map showing mean ADC = 1.28 × 10⁻³ mm2/s. (C) Enhanced T1-weighted image showing the nonhomogeneous enhancement of an irregular-shaped lesion with ill-defined margins (yellow arrow). (D) Time–signal intensity curve manifests as a rapid increase (initial phases) and a plateau type (delayed phases).
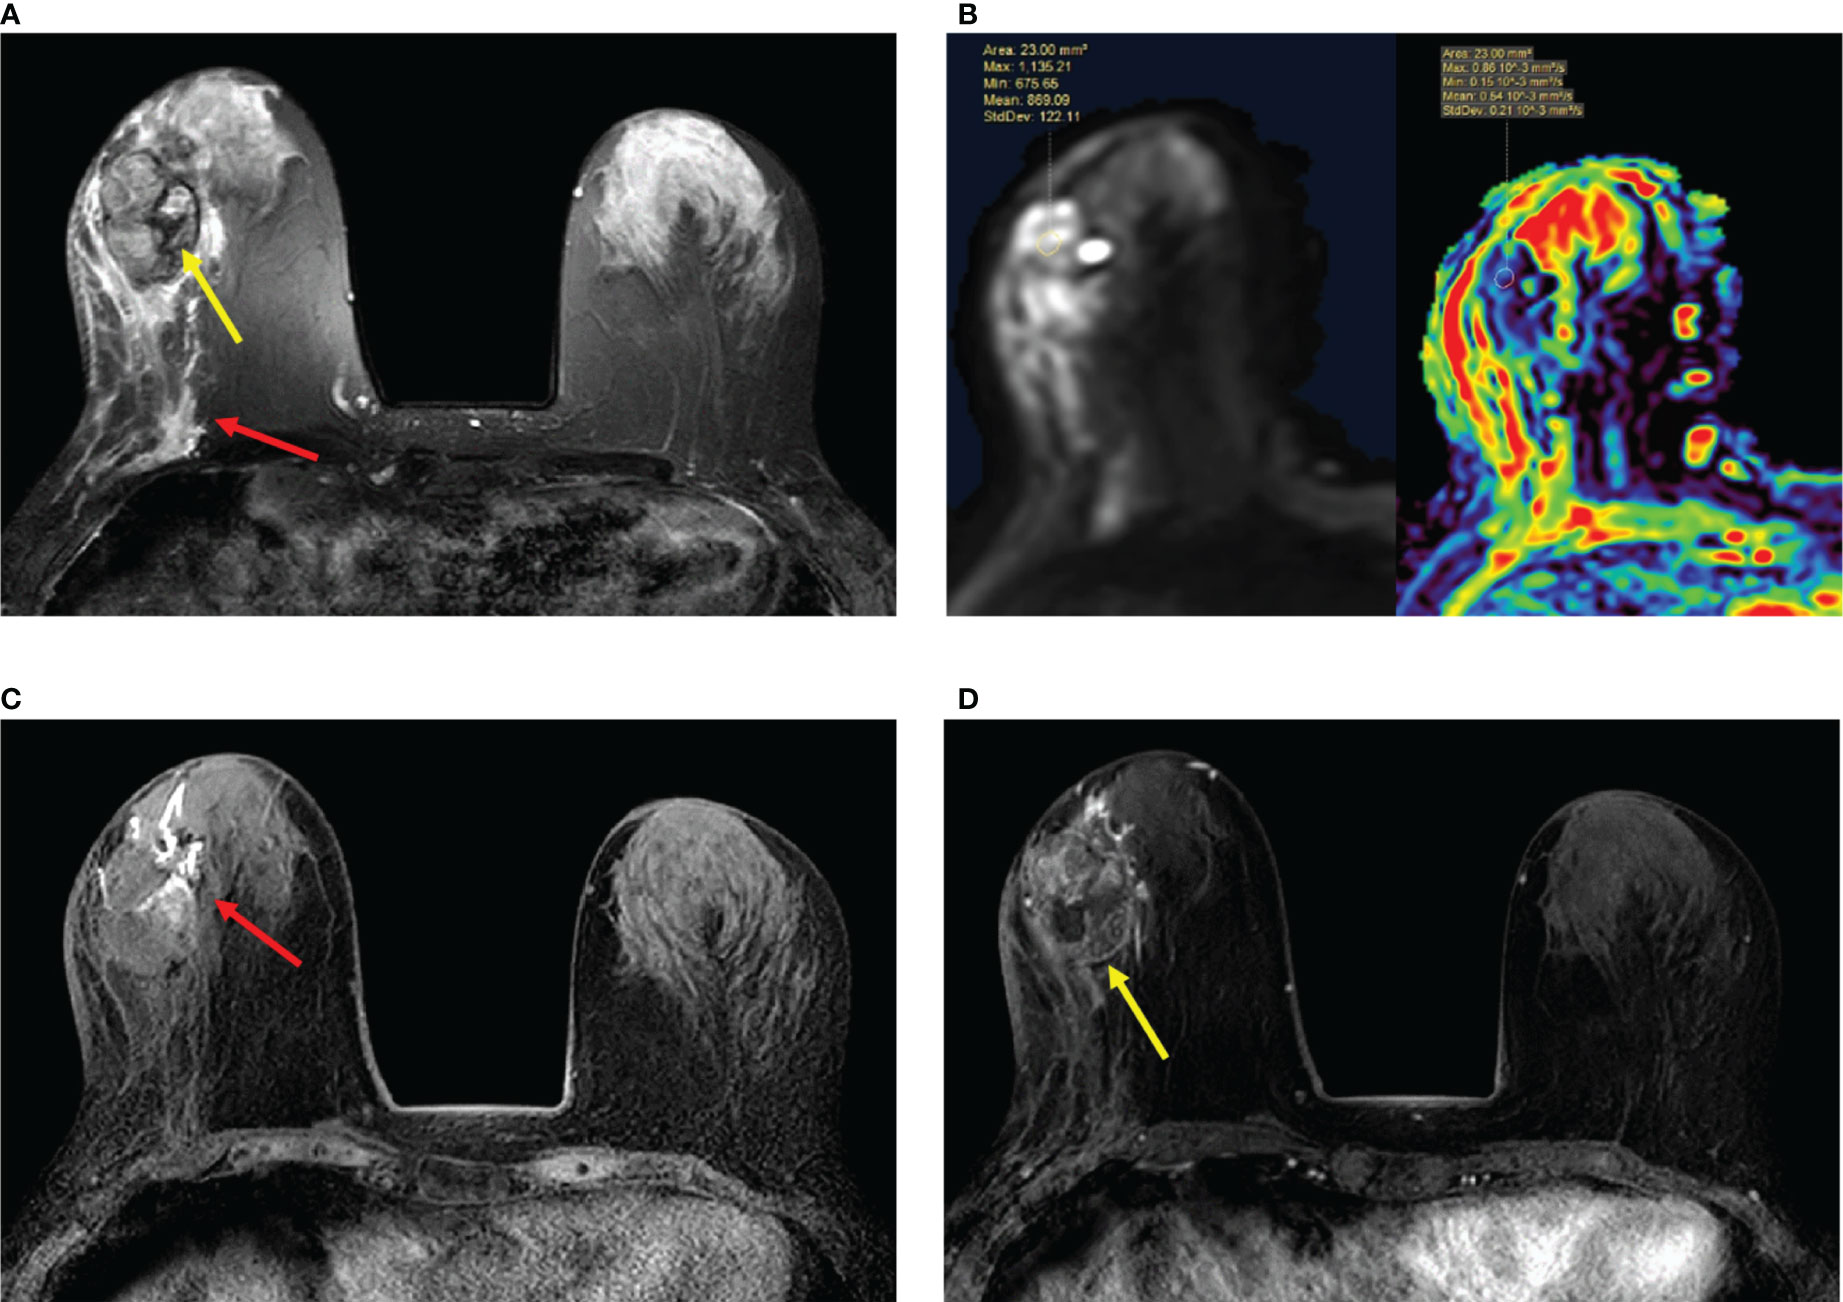
Figure 5 (A–D) Papillary ductal carcinoma in situ in a 72-year-old woman. (A) T2-weighted image showing a hypointensity signal mass lesion (yellow arrow) and a large edema signal behind the mass (red arrow) in the left breast. (B) Diffusion-weighted imaging showing a hyperintensity signal mass lesion and apparent diffusion coefficient map showing mean ADC = 0.54 × 10⁻³ mm2/s. (C) Plain T1-weighted image showing duct dilatation (red arrow) in front of the mass. (D) Enhanced T1-weighted image showing the nonhomogeneous enhancement of an irregular-shaped mass with ill-defined margins (yellow arrow). Time–signal intensity curve manifests as a slow increase (initial phases) and a persistent type (delayed phases).
Therefore, our study categorized borderline lesions and malignant lesions as one group. The mean ADC value in borderline and malignant lesions was significantly lower than that in benign lesions (1.21 ± 0.27 × 10⁻³ vs. 1.01 ± 0.20 × 10⁻³ mm2/s, P < 0.05), and the differences between the mean ADC values of the two categories were statistically significant whether in mass or non-mass enhancement (P < 0.05) (Table 3).

Table 3 Comparison of mean apparent diffusion coefficient (ADC) values in different papillary breast lesion groups.
The ROC curves and AUC for papillary breast lesions with different subtypes are presented on Figure 6. The threshold of ADC value to differentiate benign papillary breast lesions from malignant was 1.00 × 10⁻³ mm2/s (AUC, 0.728; sensitivity, 55.8%; specificity, 82.4%; P < 0.05). The threshold of the ADC value for mass lesions was 1.00 × 10⁻³ mm2/s (AUC, 0.706; sensitivity, 63.2%; specificity, 74.3%; P < 0.05), while for the non-mass lesions this was 1.14 × 10⁻³ mm2/s (AUC, 0.842; sensitivity, 70.8%; specificity, 87.5%; P < 0.05).
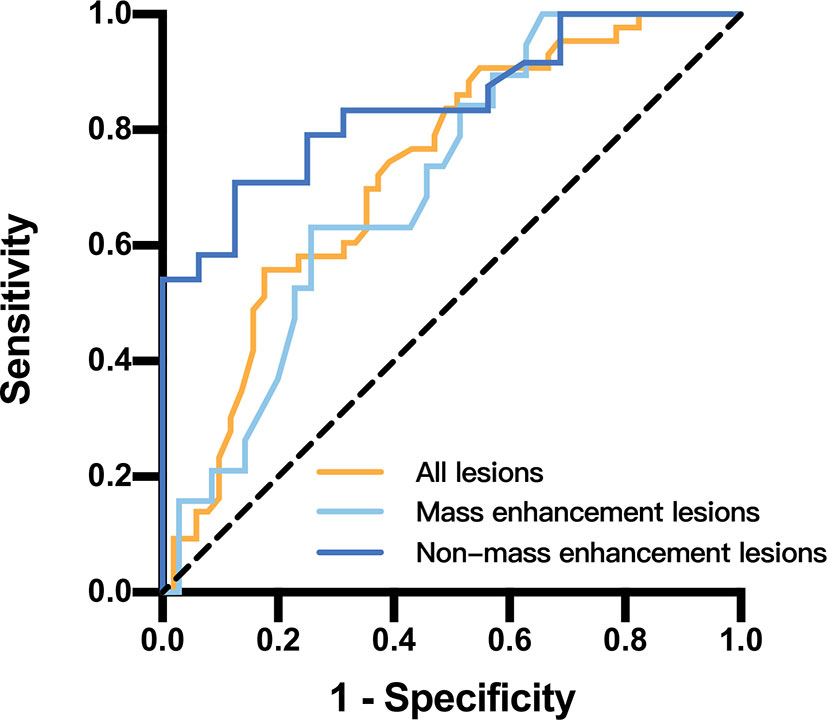
Figure 6 Receiver operating characteristic curves and area under the curve for papillary breast lesions in different papillary breast lesion groups.
Papillary breast lesions had drawn increasing attention in clinical practice recently. Benign intraductal papillomas are currently recognized as premalignant lesions. The World Health Organization (WHO) classification of papillary breast lesions suggests that the risk of subsequent invasive breast cancer development in central papillomas without epithelial atypia is believed to increase to two times that of the general population while to three times that of peripheral papillomas (1, 12). It is strongly recommended to closely follow up through imaging examination for such benign lesions in the long term.
DWI is an advanced MRI technique that can measure the mobility of water molecules diffusing in tissue, which is impacted by biophysical characteristics such as cell density, membrane integrity, and microstructure of the breast. DWI is now widely used as an important addition to standard breast MRI protocol to screen early breast cancer and potentially predict the response to and monitor the effect of neoadjuvant treatment over time (8, 13). The ADC derived from DWI that provides a quantitative measure of observed diffusion restriction can be used to distinguish between benign and malignant breast lesions. Numerous studies have demonstrated significantly lower ADC values in malignant versus benign lesions (14). The ADC values of benign and malignant papillary breast lesions in this research were consistent with previous studies. The mean ADC value of benign papillary lesions (1.21 ± 0.27 × 10⁻³ mm2/s) was significantly higher than borderline lesions (1.03 ± 0.19 × 10⁻³ mm2/s) and malignant lesions (1.00 ± 0.21 × 10⁻³ mm2/s) (P < 0.05, respectively). We suggest that ADC values can also be used to differentiate between benign and malignant papillary lesions.
In our study, we achieved the optimal threshold of ADC value as 1.00 × 10⁻³ mm2/s through the ROC curve. The ADC value was the same as that what a meta-analysis based on 13,847 breast lesions concluded (15). Furthermore, this result from the meta-analysis was independent of Tesla strength, measure methods, and the choice of b values. In the study of Yildiz S et al. (16), the mean ADC values of benign and malignant papillary lesions were 1.339 × 10⁻³ and 0.744 × 10⁻³ mm2/s, respectively, with a threshold of around 0.859 × 10⁻³ mm2/s. The reason for the differences in results between the abovementioned research and our study lay in the fact that Yildiz S enrolled fewer papillary lesions (only 29 lesions), among which benign lesions took a big proportion (80%). Compared to his study, the ratio of benign and malignant lesions exhibited more reasonably in our research. We suggest that the optimal threshold of ADC value should be 1.00 × 10⁻³ mm2/s for discrimination of benign and malignant papillary lesions.
Papillary lesions of the breast represent diverse histological subtypes. Malignant lesion subtypes were difficult to distinguish through ADC values in our study (P > 0.05). Maric J et al. (17) also reported that there were no significant correlations between malignant lesion subtypes and ADC values. The highest ADC value of malignant pathology in our study attributed to EPC was 1.15 × 10⁻³ mm2/s, which did not correspond to the study of Tang WJ et al. (18). The mean ADC value in his study was 0.876 × 10⁻³ mm2/s based on 11 EPC lesions. SPC exhibited the lowest malignant pathology ADC values, which varied from 0.56 to 1.24 × 10⁻³ mm2/s, and the mean ADC value was 0.89 ± 0.21 × 10⁻³ mm2/s. The previous study (19) reported that the ADC values of SPC varied from 1.3 to 1.9 × 10⁻³ mm2/s. Several potential factors might explain the disparities between the results. Malignant papillary lesions represented heterogeneous histological subtypes that show various cellularity and vascularization causing different degrees of diffusion. ROI placement in two studies also significantly influenced the ADC values measured in breast tumors (20). We suggest that the performance of ADC to distinguish among these subtypes might be variable, and presumably more studies with larger cohorts from multiple institutions might be needed or it might be helpful to apply ADC dataset to machine learning techniques for lesion classification.
ADH occurring within an intraductal papilloma considered as a borderline lesion deserves increasing attention clinically of late for the risk of subsequent invasive breast cancer development in such lesion is believed to be increased to 7.5× that of the general population. The WHO Working Group’s classification of breast tumors defines atypical epithelial proliferation to be limited to <3 mm of extent as intraductal papilloma with ADH, whereas in intraductal papilloma with DCIS, it spanned ≥3 mm (21). There was no statistical significance of ADC value in differentiating between intraductal papilloma with ADH (1.03 ± 0.19 × 10⁻³ mm2/s) and with DCIS (1.05 ± 0.12 × 10⁻³ mm2/s) (P > 0.05) in our study. We presume that image examination such as MRI even with DWI is incapable of discriminating lesions of millimetric pathologic difference, especially between ADH and DCIS to date. We strongly recommend taking an active surgical procedure if any suspicious signs of ADH lesions are visible in MRI.
Correlations of ADC with discrimination of non-mass-like breast lesions had been inconsistent to date in conventional studies (22, 23). Wang LJ et al. (24) found that papilloma manifesting as non-mass enhancement (NME) could be due to the concomitant benign, atypical, and malignant proliferative lesions, and the ADC value showed no significant difference between benign and malignant NME papillary lesions. Our study demonstrated the diagnostic value of ADC to differentiate benign from malignant papillary lesions whether in mass enhancement or in non-mass enhancement. For the mass-enhanced lesions, the mean ADC values of benign and malignant lesions are 1.16 ± 0.28 × 10⁻³ and 0.97 ± 0.20 × 10⁻³ mm2/s, respectively, with a threshold of 1.00 × 10⁻³ mm2/s and diagnostic accuracy of 70.6%. For the non-mass-enhanced lesions, the mean ADC values of benign and malignant lesions are 1.34 ± 0.21 × 10⁻³ and 1.05 ± 0.21 × 10⁻³ mm2/s, respectively, with a threshold of 1.14 × 10⁻³ mm2/s and diagnostic accuracy of 84.2%. We confirm the positive association of ADC value with discrimination between benign and malignant lesions in both enhancements. The high performance of ADC will not be affected by the way lesions are enhanced.
In conclusion, the ADC value derived by DWI is capable of differentiating between malignant and benign papillary lesions. The optimal threshold of the ADC value can be 1.00 × 10⁻³ mm2/s. The ADC value is statistically significant in differentiating between benign and malignant papillary lesions whether in mass or non-mass enhancement. There is no statistical difference in the ADC value among histological subtypes of malignant lesions, and studies with larger patient groups are needed to assess the potential diagnostic performance. A surgical procedure should be performed at the first opportunity if any papillary lesion is diagnosed as a borderline lesion by MRI.
The raw data supporting the conclusions of this article will be made available by the authors without undue reservation.
Written informed consent was obtained from the individual(s) for the publication of any potentially identifiable images or data included in this article.
WL, DZ, and PW designed the study. WL and DZ collected the data and performed the statistical analysis. WL and DZ reviewed the MR images. WG reviewed the pathology findings. DZ drafted the manuscript. WL revised the manuscript. All authors contributed to the article and approved the submitted version.
The authors declare that the research was conducted in the absence of any commercial or financial relationships that could be construed as a potential conflict of interest.
The reviewer L-MW declared a shared parent affiliation with the authors to the handling editor at the time of review.
All claims expressed in this article are solely those of the authors and do not necessarily represent those of their affiliated organizations, or those of the publisher, the editors and the reviewers. Any product that may be evaluated in this article, or claim that may be made by its manufacturer, is not guaranteed or endorsed by the publisher.
1. Tay TKY, Tan PH. Papillary Neoplasms of the Breast-Reviewing the Spectrum. Mod Pathol (2021) 34(6):1044–61. doi: 10.1038/s41379-020-00732-3
2. Kulka J, Madaras L, Floris G, Lax SF. Papillary Lesions of the Breast. Virchows Arch (2021) 480(1):65–84. doi: 10.1007/s00428-021-03182-7
3. Sarica O, Uluc F, Tasmali D. Magnetic Resonance Imaging Features of Papillary Breast Lesions. Eur J Radiol (2014) 83(3):524–30. doi: 10.1016/j.ejrad.2013.12.007
4. Eiada R, Chong J, Kulkarni S, Goldberg F, Muradali D. Papillary Lesions of the Breast: MRI, Ultrasound, and Mammographic Appearances. AJR Am J Roentgenol (2012) 198(2):264–71. doi: 10.2214/AJR.11.7922
5. Manganaro L, D'Ambrosio I, Gigli S, Di Pastena F, Giraldi G, Tardioli S, et al. Breast MRI in Patients With Unilateral Bloody and Serous-Bloody Nipple Discharge: A Comparison With Galactography. BioMed Res Int (2015) 806368. doi: 10.1155/2015/806368
6. Zhu Y, Zhang S, Liu P, Lu H, Xu Y, Yang WT. Solitary Intraductal Papillomas of the Breast: MRI Features and Differentiation From Small Invasive Ductal Carcinomas. AJR Am J Roentgenol (2012) 199(4):936–42. doi: 10.2214/AJR.12.8507
7. Seo H, Choi J, Oh C, Han Y, Park H. Isotropic Diffusion Weighting for Measurement of a High-Resolution Apparent Diffusion Coefficient Map Using a Single Radial Scan in MRI. Phys Med Biol (2014) 59(20):6289–303. doi: 10.1088/0031-9155/59/20/6289
8. Baltzer P, Mann RM, Iima M, Sigmund EE, Clauser P, Gilbert FJ, et al. Diffusion-Weighted Imaging of the Breast-a Consensus and Mission Statement From the EUSOBI International Breast Diffusion-Weighted Imaging Working Group. Eur Radiol (2020) 30(3):1436–50. doi: 10.1007/s00330-019-06510-3
9. Iima M, Honda M, Sigmund EE, Ohno Kishimoto A, Kataoka M, Togashi K. Diffusion MRI of the Breast: Current Status and Future Directions. J Magn Reson Imag (2020) 52(1):70–90. doi: 10.1002/jmri.26908
10. Mann RM, Cho N, Moy L. Breast MRI: State of the Art. Radiology (2019) 292(3):520–36. doi: 10.1148/radiol.2019182947
11. Spak DA, Plaxco JS, Santiago L, Dryden MJ, Dogan BE. BI-RADS((R)) Fifth Edition: A Summary of Changes. Diagn Interv Imag (2017) 98(3):179–90. doi: 10.1016/j.diii.2017.01.001
12. Tan PH, Ellis I, Allison K, Brogi E, Fox SB, Lakhani S, et al. The 2019 World Health Organization Classification of Tumours of the Breast. Histopathology (2020) 77(2):181–5. doi: 10.1111/his.14091
13. Newitt DC, Zhang Z, Gibbs JE, Partridge SC, Chenevert TL, Rosen MA, et al. Test-Retest Repeatability and Reproducibility of ADC Measures by Breast DWI: Results From the ACRIN 6698 Trial. J Magn Reson Imag (2019) 49(6):1617–28. doi: 10.1002/jmri.26539
14. Partridge SC, Nissan N, Rahbar H, Kitsch AE, Sigmund EE. Diffusion-Weighted Breast MRI: Clinical Applications and Emerging Techniques. J Magn Reson Imag (2017) 45(2):337–55. doi: 10.1002/jmri.25479
15. Surov AA-O, Meyer HJ, Wienke A. Can Apparent Diffusion Coefficient (ADC) Distinguish Breast Cancer From Benign Breast Findings? A Meta-Analysis Based on 13 847 Lesions. BMC Cancer (2019) 19(1):955. doi: 10.1186/s12885-019-6201-4
16. Yildiz S, Toprak H, Ersoy YE, Malya FU, Bakan AA, Aralasmak A, et al. Contribution of Diffusion-Weighted Imaging to Dynamic Contrast-Enhanced MRI in the Characterization of Papillary Breast Lesions. Breast J (2018) 24(2):176–9. doi: 10.1111/tbj.12861
17. Maric J, Boban J, Ivkovic-Kapicl T, Djilas D, Vucaj-Cirilovic V, Bogdanovic-Stojanovic D. Differentiation of Breast Lesions and Distinguishing Their Histological Subtypes Using Diffusion-Weighted Imaging and ADC Values. Front Oncol (2020) 10:332. doi: 10.3389/fonc.2020.00332
18. Tang WJ, Liang YS, Yan J, Hu Y, Sun ML, Liu GS, et al. Magnetic Resonance Imaging (MRI) Phenotypes May Provide Additional Information for Risk Stratification for Encapsulated Papillary Carcinoma of the Breast. Cancer Manag Res (2020) 12:11751–60. doi: 10.2147/CMAR.S277980
19. Zhang L, Zhuang L, Shi C, Miao Y, Zhang W, Song Q, et al. A Pilot Evaluation of Magnetic Resonance Imaging Characteristics Seen With Solid Papillary Carcinomas of the Breast in 4 Patients. BMC Cancer (2017) 17(1):525. doi: 10.1186/s12885-017-3518-8
20. Bickel H, Pinker K, Polanec S, Magometschnigg H, Wengert G, Spick C, et al. Diffusion-Weighted Imaging of Breast Lesions: Region-Of-Interest Placement and Different ADC Parameters Influence Apparent Diffusion Coefficient Values. Eur Radiol (2017) 27(5):1883–92. doi: 10.1007/s00330-016-4564-3
21. Tan PH, Schnitt SJ, van de Vijver MJ, Ellis IO, Lakhani SR. Papillary and Neuroendocrine Breast Lesions: The WHO Stance. Histopathology (2015) 66(6):761–70. doi: 10.1111/his.12463
22. Imamura T, Isomoto I, Sueyoshi E, Yano H, Uga T, Abe K, et al. Diagnostic Performance of ADC for Non-Mass-Like Breast Lesions on MR Imaging. Magn Reson Med Sci (2010) 9(4):217–25. doi: 10.2463/mrms.9.217
23. Cheng L, Bai Y, Zhang J, Liu M, Li X, Zhang A, et al. Optimization of Apparent Diffusion Coefficient Measured by Diffusion-Weighted MRI for Diagnosis of Breast Lesions Presenting as Mass and non-Mass-Like Enhancement. Tumour Biol (2013) 34(3):1537–45. doi: 10.1007/s13277-013-0682-6
Keywords: diffusion-weighted imaging, apparent diffusion coefficient values, papillary breast lesions, magnetic resonance imaging, mass enhancement, non-mass enhancement, receiver operating characteristic curve
Citation: Lv W, Zheng D, Guan W and Wu P (2022) Contribution of Diffusion-Weighted Imaging and ADC Values to Papillary Breast Lesions. Front. Oncol. 12:911790. doi: 10.3389/fonc.2022.911790
Received: 03 April 2022; Accepted: 31 May 2022;
Published: 30 June 2022.
Edited by:
Abhishek Mahajan, Clatterbridge Cancer Centre NHS Foundation Trust, United KingdomReviewed by:
Lian-Ming Wu, Shanghai Jiao Tong University, ChinaCopyright © 2022 Lv, Zheng, Guan and Wu. This is an open-access article distributed under the terms of the Creative Commons Attribution License (CC BY). The use, distribution or reproduction in other forums is permitted, provided the original author(s) and the copyright owner(s) are credited and that the original publication in this journal is cited, in accordance with accepted academic practice. No use, distribution or reproduction is permitted which does not comply with these terms.
*Correspondence: Ping Wu, YnJlYXN0XzIwMjJAMTYzLmNvbQ==
†These authors have contributed equally to this work and share first authorship
Disclaimer: All claims expressed in this article are solely those of the authors and do not necessarily represent those of their affiliated organizations, or those of the publisher, the editors and the reviewers. Any product that may be evaluated in this article or claim that may be made by its manufacturer is not guaranteed or endorsed by the publisher.
Research integrity at Frontiers

Learn more about the work of our research integrity team to safeguard the quality of each article we publish.