 Peng-Chao Zhan1,2†
 Pei-jie Lyu1*
 Zhen Li3†Xing Liu1†Hui-Xia Wang1Na-Na Liu1,2
 Yuyuan Zhang3
 Wenpeng Huang1,2
 Yan Chen1
 Jian-bo Gao1,2*
- 1Department of Radiology, The First Affiliated Hospital of Zhengzhou University, Zhengzhou, China
- 2Henan Key Laboratory of Imaging Diagnosis and Treatment for Digestive System Tumor, Zhengzhou, China
- 3Department of Interventional Radiology, The First Affiliated Hospital of Zhengzhou University, Zhengzhou, China
Purpose: The study aimed to construct and evaluate a CT-Based radiomics model for noninvasive detecting perineural invasion (PNI) of perihilar cholangiocarcinoma (pCCA) preoperatively.
Materials and Methods: From February 2012 to October 2021, a total of 161 patients with pCCA who underwent resection were retrospectively enrolled in this study. Patients were allocated into the training cohort and the validation cohort according to the diagnostic time. Venous phase images of contrast-enhanced CT were used for radiomics analysis. The intraclass correlation efficient (ICC), the correlation analysis, and the least absolute shrinkage and selection operator (LASSO) regression were applied to select radiomics features and built radiomics signature. Logistic regression analyses were performed to establish a clinical model, a radiomics model, and a combined model. The performance of the predictive models was measured by area under the receiver operating characteristic curve (AUC), and pairwise ROC comparisons between models were tested using the Delong method. Finally, the model with the best performance was presented as a nomogram, and its calibration and clinical usefulness were assessed.
Results: Finally, 15 radiomics features were selected to build a radiomics signature, and three models were developed through logistic regression. In the training cohort, the combined model showed a higher predictive capability (AUC = 0.950) than the radiomics model and the clinical model (AUC: radiomics = 0.914, clinical = 0.756). However, in the validation cohort, the AUC of the radiomics model (AUC = 0.885) was significantly higher than the other two models (AUC: combined = 0.791, clinical = 0.567). After comprehensive consideration, the radiomics model was chosen to develop the nomogram. The calibration curve and decision curve analysis (DCA) suggested that the nomogram had a good consistency and clinical utility.
Conclusion: We developed a CT-based radiomics model with good performance to noninvasively predict PNI of pCCA preoperatively.
Introduction
Cholangiocarcinoma (CCA) is a highly lethal malignancy originating from the biliary epithelium, accounting for about 3% of all gastrointestinal system malignancies (1, 2). According to the anatomical location, CCA is divided into three subtypes, and perihilar cholangiocarcinoma (pCCA) represents the most common type of CCA (3). PCCA carries a poor prognosis with a median overall survival (OS) of 5-10 months (4). Surgery resection with an R0 margin can significantly prolong OS and provide a chance to cure pCCA. However, only 13% to 32% of pCCA patients undergo surgical resection and the recurrence rate within one year was greater than 50% (4, 5).
PNI is considered one of the histological features of biliary tract tumors, and it has a high prevalence in biliary tract tumors ranging from 56% to 88% (6). Previous studies reported that PNI was an important risk factor associated with poor prognosis and low overall survival time of malignant tumors (7–9). In pCCA, the 5-year overall survival of patients without PNI is 63.7%, whereas that of patients with PNI is 34.9% (10). In addition, PNI was regarded as an independent risk factor for R0 resection and presented a high recurrence rate (11, 12). At present, several studies have made a progress in the molecular mechanism of PNI, which may block the occurrence of PNI and lead to specific tumor treatments (6, 13, 14). Therefore, the diagnosis of PNI is essential for determining the treatment approach and predicting the prognosis of patients with pCCA.
Multidetector computed tomography (MDCT) and magnetic resonance imaging (MRI) are the most commonly used imaging modalities for the diagnosis and evaluation of pCCA (15). However, they are of limited value for the detection of PNI. Currently, PNI can only be confirmed by pathological examination of surgical specimens, and it is invasive and can only be performed after resection. Developing an appropriate and convenient method for the noninvasive prediction of PNI is urgently required.
Radiomics is a new rapidly developing technology that can extract numerous quantitative features from medical images, and these imaging features may be informative for disease diagnosis, prognosis, and treatment response (16–18). Some studies have indicated the potential value of radiomics for the preoperative prediction of PNI in specific tumors (19–25). Nevertheless, we have not yet found any study that focuses on CT-based radiomics analysis for the noninvasive prediction of PNI of pCCA. Therefore, the goal of our study was to construct and evaluate a CT-Based radiomics model for noninvasive detecting PNI of pCCA.
Materials and Methods
Patient Characteristics
This retrospective, single-center study was approved by the Ethical Committee of the First Affiliated Hospital of Zhengzhou University (2021-KY-0778-001), and the requirement for informed consent was waived.
From February 2012 to October 2021, we reviewed clinicopathological characteristics and CT images of 256 consecutive patients with pCCA. Finally, a total of 161 patients were included in the present study based on the inclusion criteria and exclusion criteria. The flowchart of patient selection was presented in Figure 1. PNI is defined as the appearance of tumor cells along the nerves and/or within the epineural, perineural, and endoneurial places of the neuronal sheath, with cancer cells surrounding at least 33% of the nerves (26). The inclusion criteria were (1) pathologically diagnosed with pCCA and PNI status evaluation available, (2) curative or palliative resection, and (3) contrast-enhanced CT performed within 2 weeks prior to resection. The exclusion criteria were (1) absence of evaluation for PNI in the pathological report, (2) history of any anti-tumor therapy or biliary drainage before resection, and (3) the thickness of CT images >3mm. According to the order of diagnosis time, we divided the patients into the training cohort (n = 106) and the validation cohort (n = 55). The training cohort was used to select robust radiomics features and construct models, and the internal validation was performed in the validation cohort.
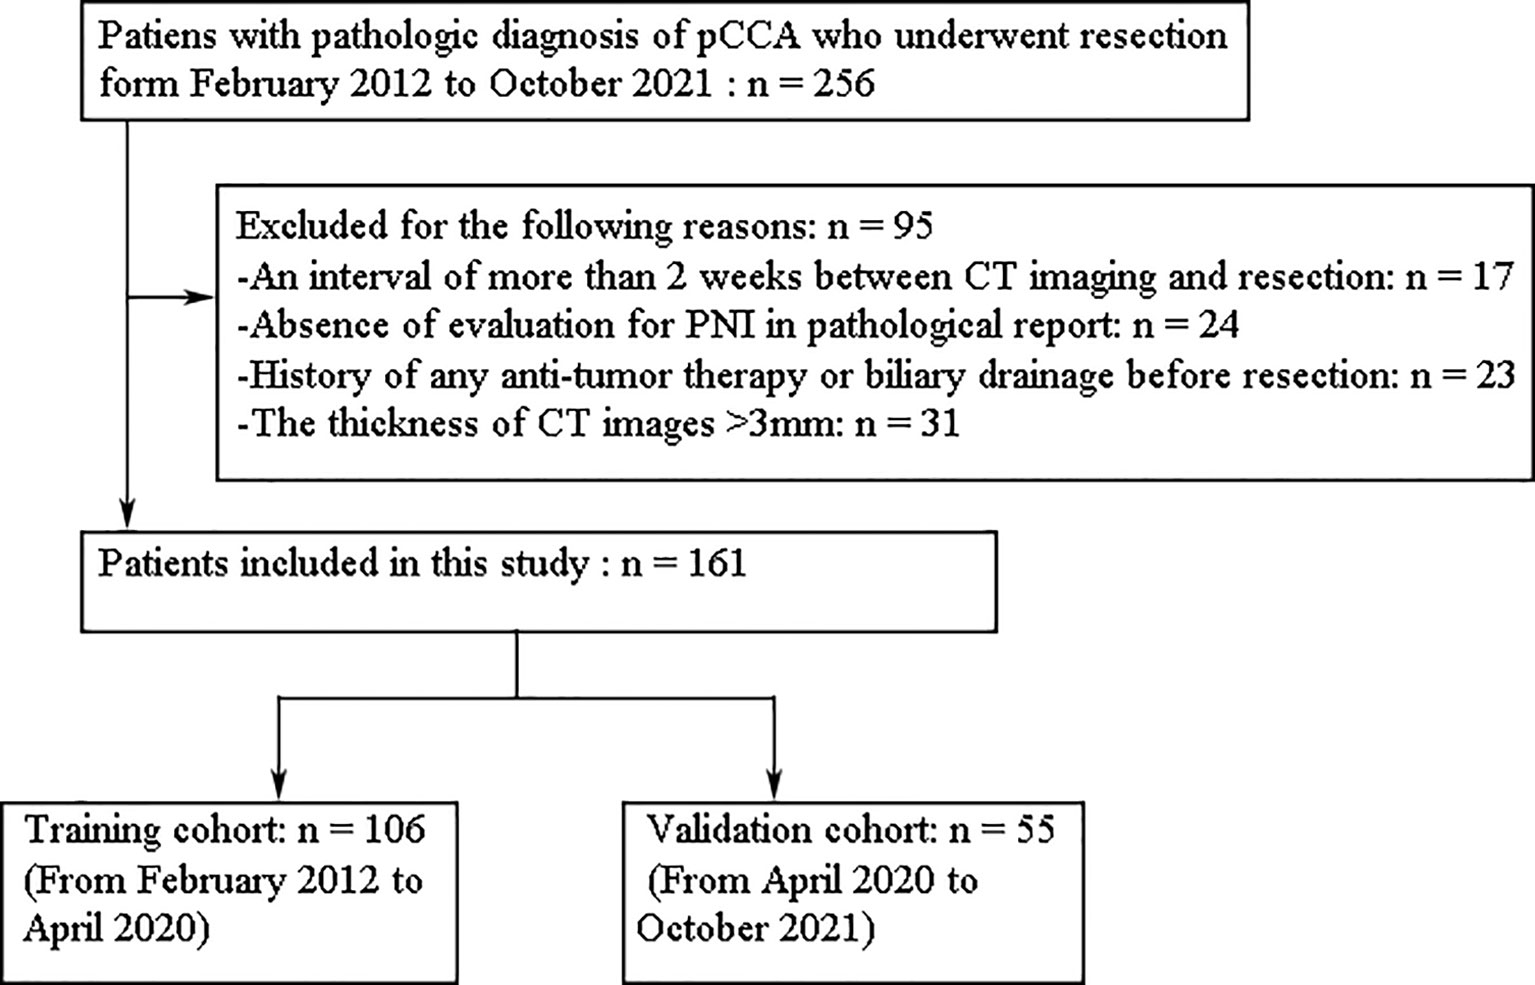
Figure 1 The flowchart of patient selection in this study.
Baseline clinical features were obtained by reviewing the electronic medical charts, including age, sex, symptom, total bilirubin (TBIL), direct bilirubin (DBIL), aspartate aminotransferase (AST), alanine aminotransferase (ALT), glutamyl transpeptidase (GGT), albumin (ALB), prothrombin time (PT), Child-Pugh grade, CA19-9, CEA, CA125, Bismuth classification, clinical T stage (cT), and clinical N stage (cN).
CT Image Acquisition and Analysis
Contrast-enhanced CT examination of the abdomen was performed in all patients by using a 256-slice CT scanner (Revolution CT, GE Healthcare, United States) or a 320-MDCT scanner (Aquilion ONE, Otawara, Japan). The CT scan sequence included plain scan sequence, arterial phase sequence (AP), and portal venous phase sequence (VP). The intravenous contrast agent (Ultravist 370, Bayer Schering Pharma, Germany) was infused through the antecubital vein at a rate of 3.0–4.0 mL/s (1.5 ml/kg) using a pump injector. AP and VP contrast-enhanced CT images were achieved after a post-injection delay of 20-30 s and 55-70 s, respectively. The parameters of image acquisition are as follows (1) Revolution CT: tube voltage: 120 kv; tube current range: 50-500 mA, pitch: 0.992:1, rotation time: 0.5 s, detector width: 80 mm; reconstruction algorithm: STAND; scan slice thickness: 5 mm; reconstructed section thickness: 0.625 mm. (2) Aquilion ONE: tube voltage: 120 kv; tube current: 350 mA, rotation time: 0.5 s, scan slice thickness: 5 mm, reconstructed section thickness: 2 mm.
Two radiologists with more than 5 years of experience in abdominal imaging who were blinded to pathologic details reviewed CT images and evaluated the following features: Bismuth classification, cT stage, and cN stage. Any discrepancies between the readers were resolved by consultation.
ROI Segmentation and Feature Extraction
The 3D region of interest (ROI) segmentation was performed using the open-source image analysis software 3D Slicer 4.13.0 (https://www.slicer.org/). Venous phase (VP) images were previously reported as the best phase for pCCA visualization and therefore were used for the segmentation of ROI (27, 28). To evaluate interobserver reliability by calculating the intraclass correlation coefficient (ICC), we randomly chose 50 patients, and segmentation of ROI was performed by one abdominal radiologist (reader 1) with 7 years of experience and another abdominal radiologist (reader 2) with 10 years of experience, who were all blinded to pathologic data. The remaining ROI segmentation was finished by reader 1 and was examined by reader 2. If the ROI was questioned, it would be re-segmented after the two agree.
Before radiomics features extraction, the images were preprocessed to reduce the effect of different scanning schemes or devices on the quantitative radiomics features. First, all images were resampled into 3 × 3 × 3 mm3 voxels. In addition, the gray values were discretized using 25 bin width. The radiomic features were then extracted from ROI drawn by reader 1 using the 3D slicer software with an extended plug-in called “PyRadiomics package” (https://www.radiomics.io/pyradiomics.html) (18, 29).
Feature Selection
To identify robust and reliable radiomics features, feature selection was performed in the following three steps. First, features with ICC greater than 0.75 were included in further feature selection. Furthermore, the correlation analysis was performed to exclude redundant features (30); for each highly correlated feature pair (Pearson correlation coefficient > 0.9), the feature with a higher average absolute correlation was removed. Finally, to prevent overfitting or selection bias, the least absolute shrinkage and selection operator (LASSO) regression with tenfold cross-validation was applied to select the most significant features for PNI. After feature selection, the remaining radiomics features were standardized with the z-score for further analysis (31).
Models Construction and Evaluation
The radiomics signature was built based on the selected features, and the corresponding radiomics score was calculated for each patient. Based on the selected features, the radiomics model was established by a multivariate logistic regression algorithm.
Laboratory variables were categorized based on normal reference ranges, including those for TBIL (≤25 or >25 umol/L), DBIL (≤10 or >10 umol/L), AST (≤40 or >40 U/mL), ALT (≤50 or >50 U/mL), ALB (≤36 or >36 g/L), CA19-9 (≤40 or >40 U/mL), CEA (≤5 or >5 ng/ml), and CA125 (≤35 or >35 U/mL). The baseline clinical features were subsequently compared by univariate logistic analysis. Statistically significant variables (p < 0.05) were included in the multivariable logistic regression analysis, and the clinical model was established. In addition, a clinical-radiomics model was developed integrating the radiomics signature and the independent clinical risk factors.
The performance of different models was measured by AUC, and pairwise ROC comparisons between models were tested using the Delong method. Finally, the model with the best performance was visualized as a nomogram, and its calibration and clinical usefulness were assessed.
Statistical Analysis
Continuous variables (age) were expressed as mean ± standard deviation (SD). Continuous variables were compared by using the Student t-test or Mann-Whitney U test. Categorical variables were compared by using the χ2 test or Fisher exact test. Feature selection, model construction, and performance evaluation were performed on the R software package (version 4.0.3). A two-tailed p value < 0.05 was considered statistically significant.
Results
Patient Characteristics
A total of 161 patients were enrolled in this study based on the inclusion criteria and exclusion criteria. According to the order of diagnosis time, the patients were divided into the training cohort (n = 106) and the validation cohort (n = 55). The histologic type of all patients is adenocarcinoma, and the baseline clinical characteristics of two cohorts are summarized in Table 1. An example of cases with or without PNI is listed in Figure 2,
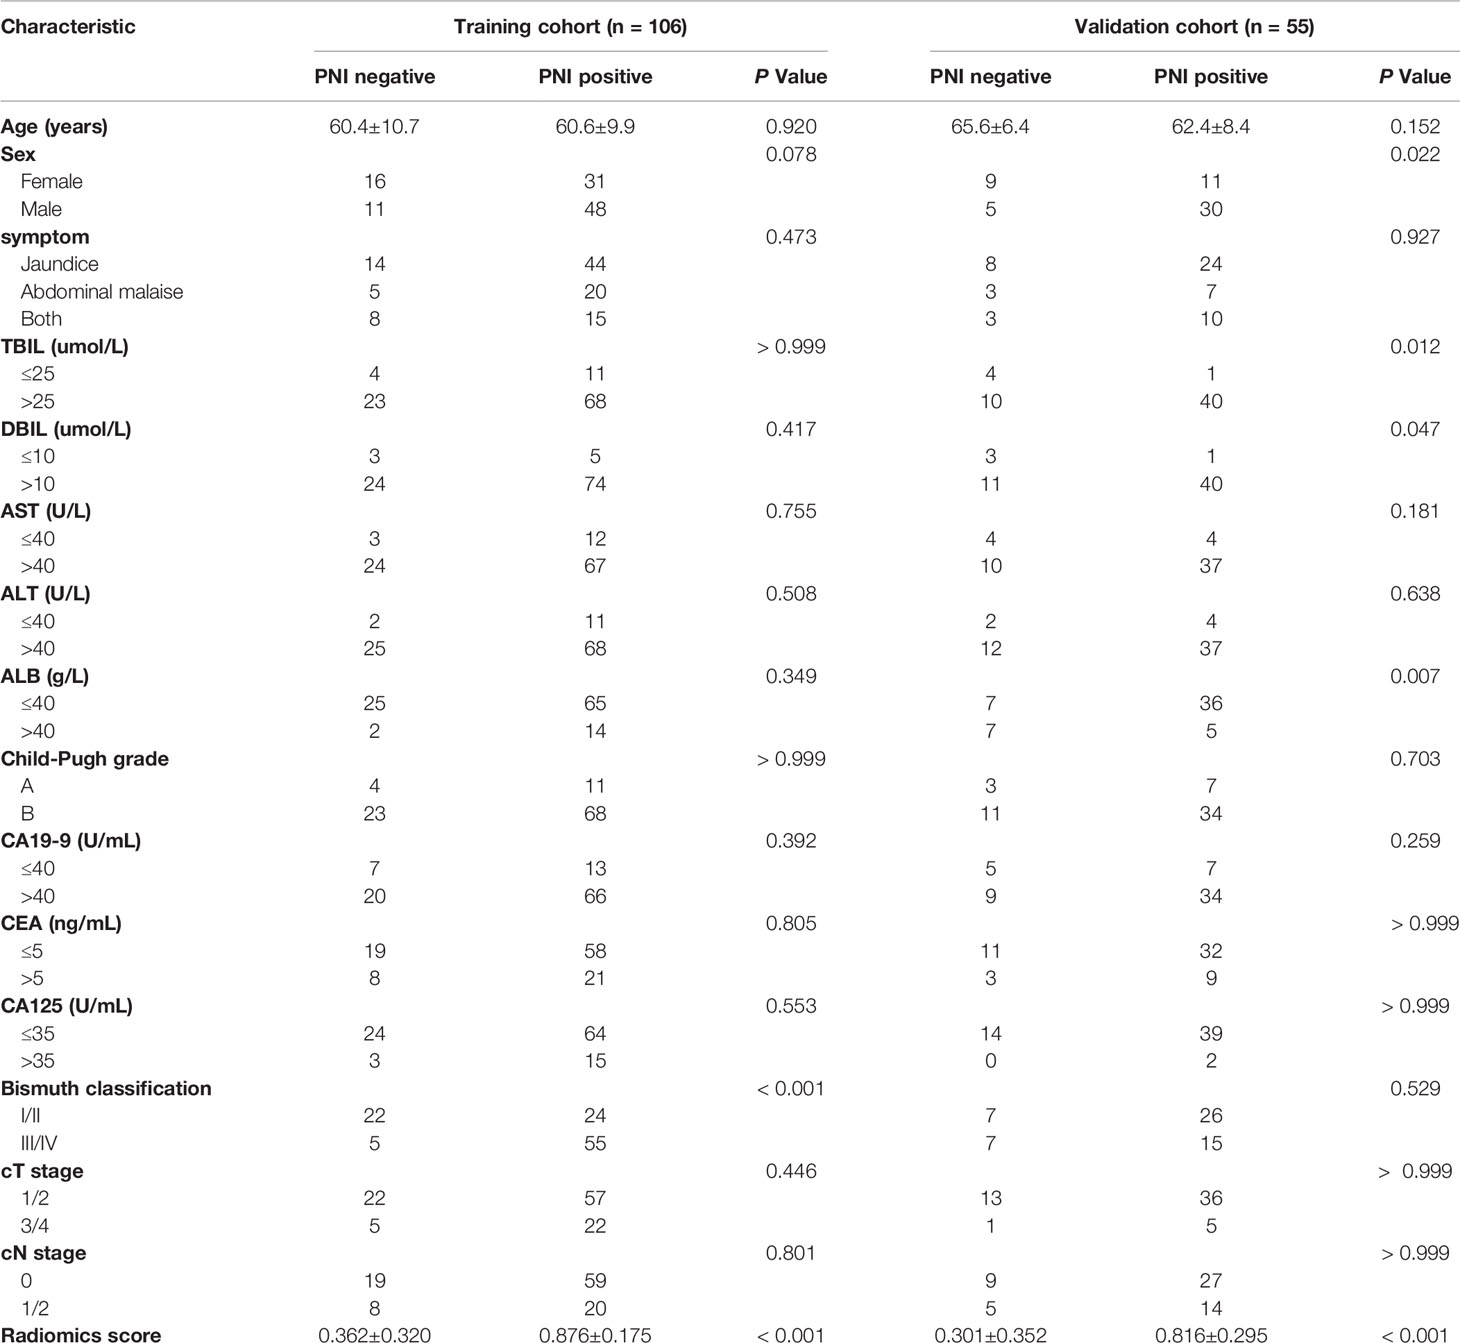
Table 1 Characteristics of patients in the training and validation cohort.
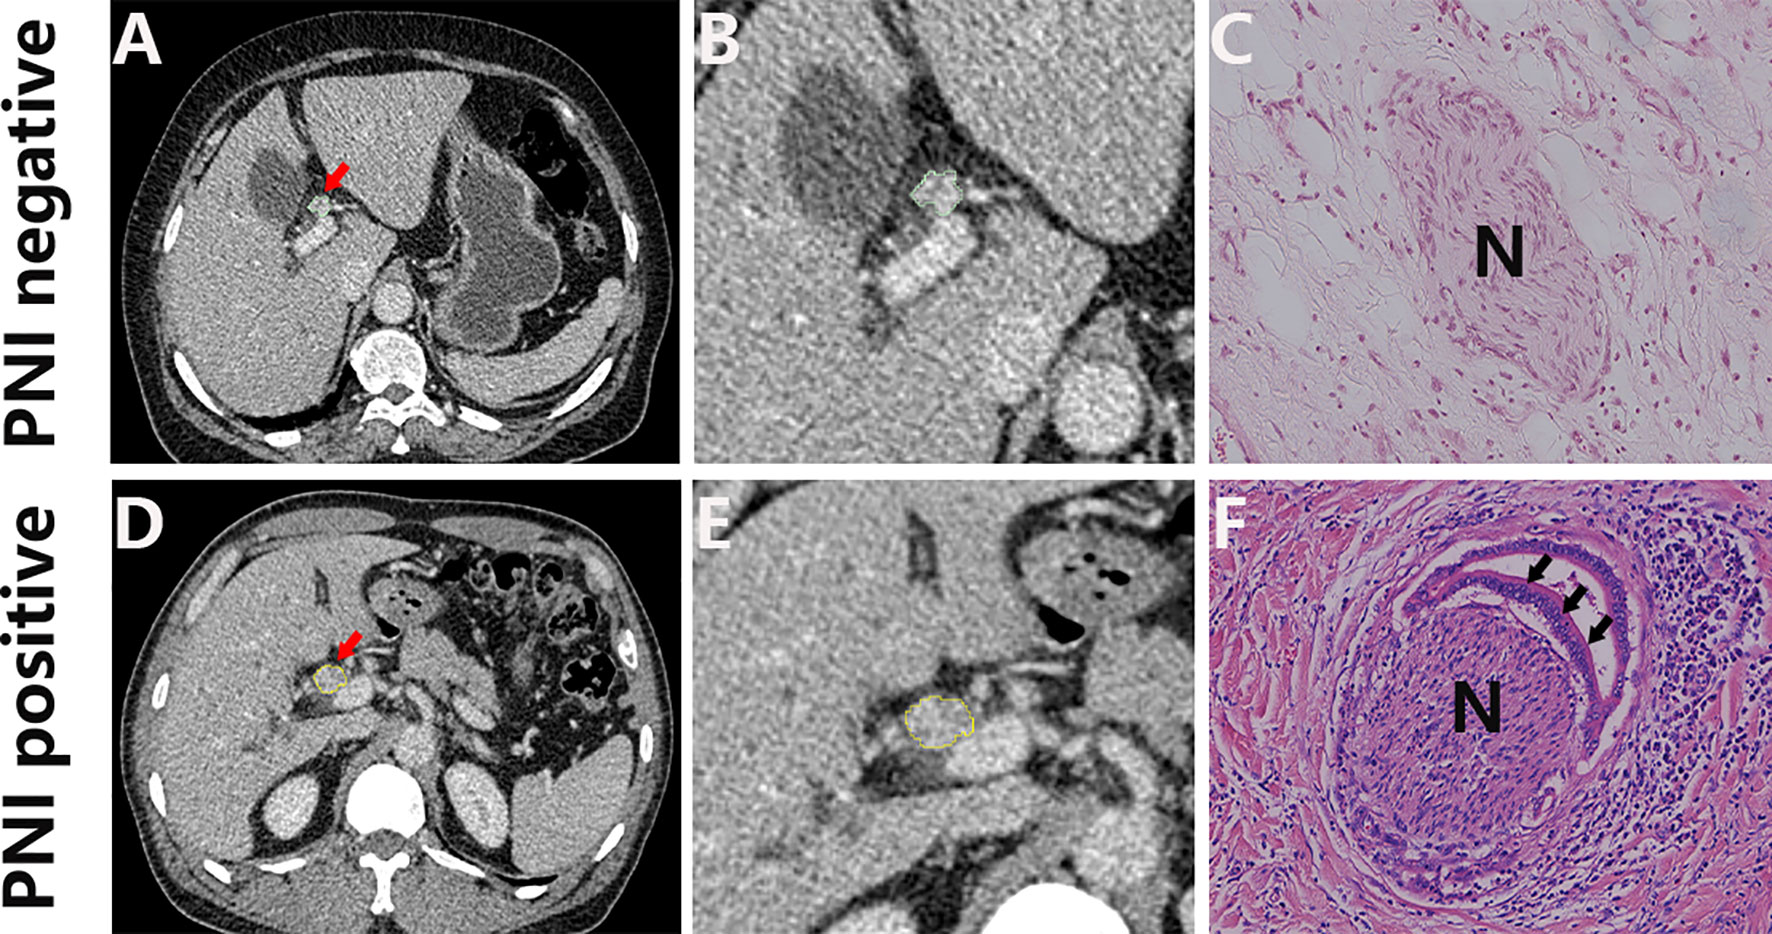
Figure 2 Representative CT images (A, D; arrow) and the corresponding cropped images (B, E), and the corresponding histology of PNI negative (C) and PNI positive tumors (F). H&E, hematoxylin and eosin, ×150.
Feature Extraction and Selection
The plug-in called the “PyRadiomics package” of 3D slicer software was applied to extract radiomics features from each ROI. The extracted features were reproducible and matched the benchmarks of the image biomarker standardization initiative (IBSI) (32). For each patient, 851 radiomics features were extracted, including 14 shape features, 18 first-order features, 75 texture features, and 744 wavelet features. The details of extracted radiomics features were presented in Supplemental Appendix 1; Table S1.
Through ICC analysis and the correlation analysis, 487 radiomics features were excluded, and the remaining 364 stable features were considered for subsequent analysis. Finally, based on LASSO regression, 15 PNI status related features with nonzero coefficients were selected, and the radiomics signature was constructed. The feature selection process of LASSO is illustrated in Figure 3. The corresponding radiomics score was calculated for each patient and was shown in Figure 4A. The formula of the radiomics score and the details of the selected radiomics features were presented in Supplemental Appendix 2; Table S2.
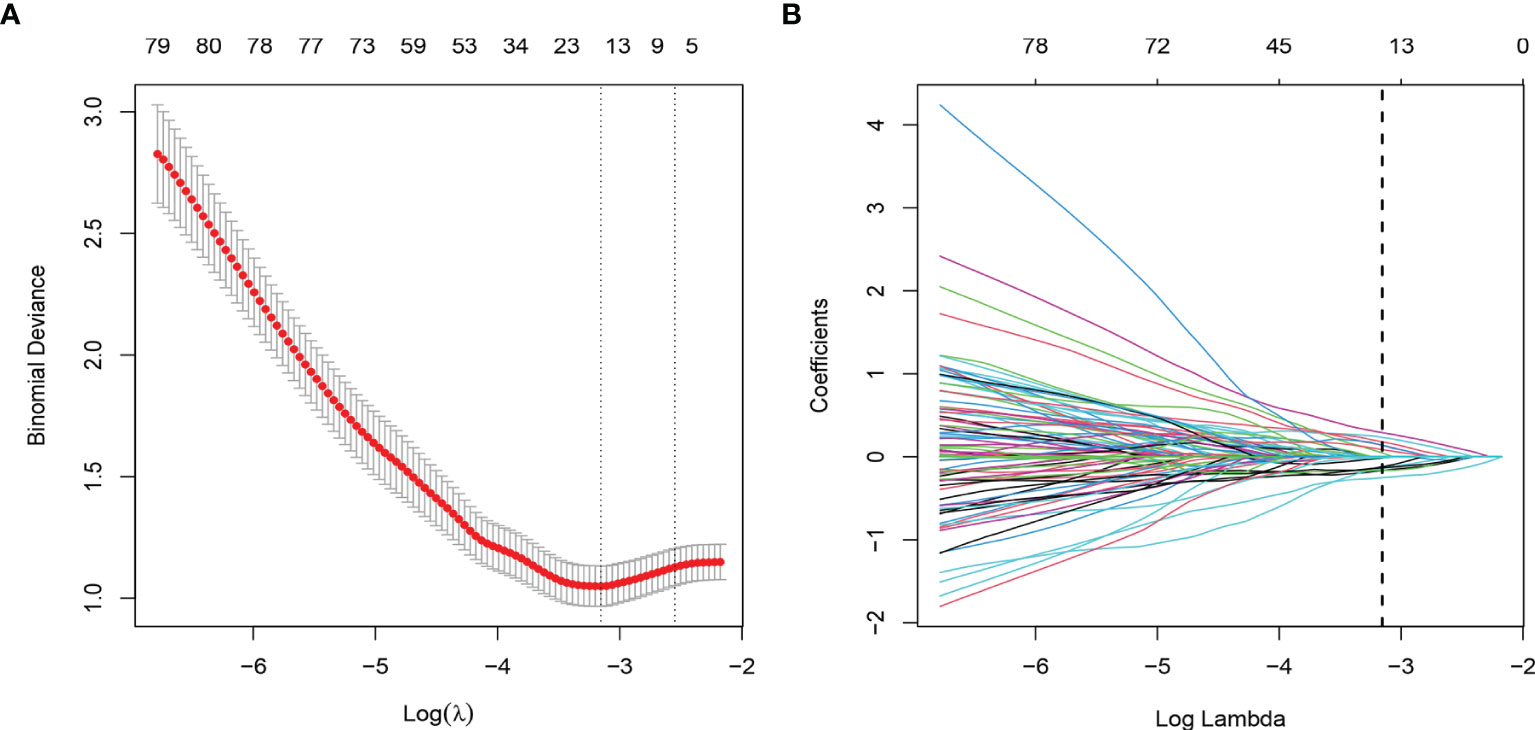
Figure 3 Radiomic feature selection by using the least absolute shrinkage and selection operator (LASSO) logistic regression. (A) The selection of tuning parameter (λ) in the LASSO model used 10-fold cross-validation via minimum criteria. The AUC curve was plotted versus log (λ). (B) LASSO coefficient profiles of the radiomics features. A vertical line was plotted at the optimal λ value, which resulted in 15 features with nonzero coefficients.
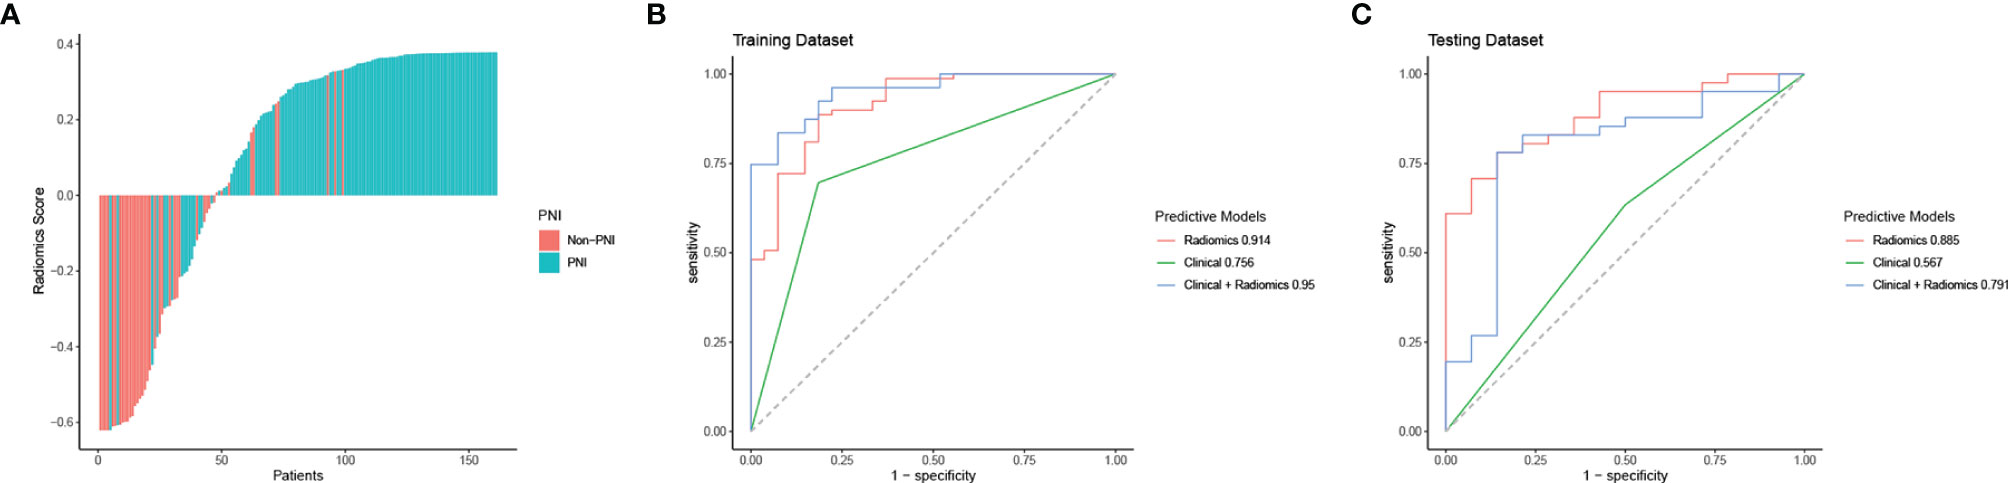
Figure 4 Radiomics score, ROC curve analysis of all models in the training dataset and the testing dataset. (A) Waterfall plot for distribution of radiomics scores for each patient. (B) ROC curves of all models for predicting PNI in the training dataset. (C) ROC curves of all models for predicting PNI in the testing dataset.
Models Construction and Evaluation
Among all baseline clinical features, only Bismuth classification was identified as a significant predictor for PNI by univariate analysis. So the clinical model was built based on the Bismuth classification. Detailed univariate analysis results were shown in Table 2. In addition, by using a multivariate logistic regression algorithm, the radiomics model was established based on the radiomics signature and the combined model was developed by integrating the radiomics signature and Bismuth classification.
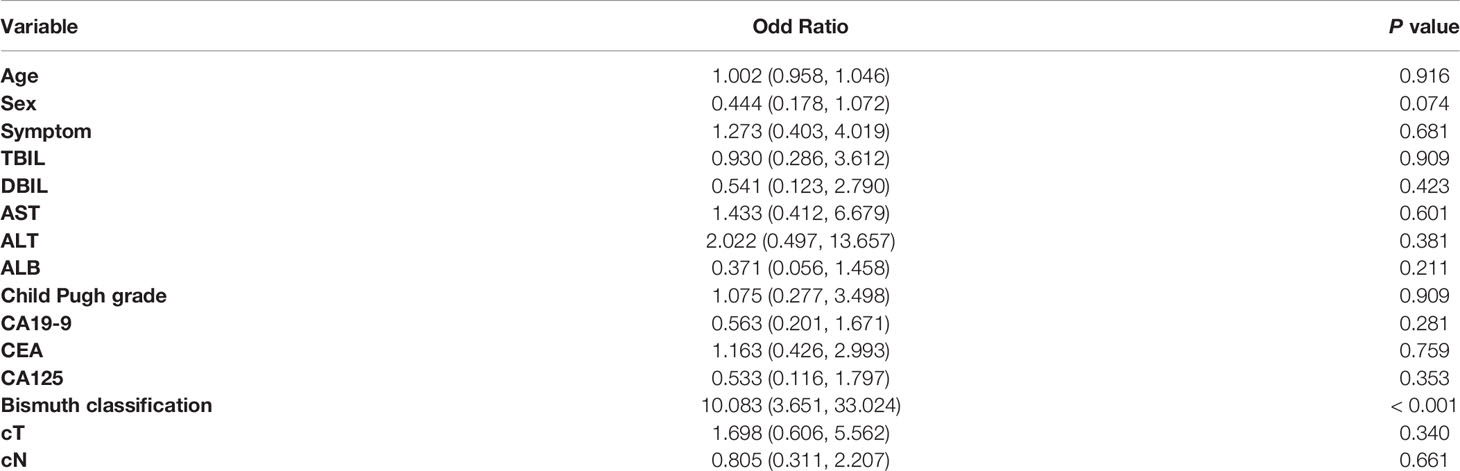
Table 2 Univariate logistic regression in the training cohort.
In the training cohort, the AUC values of the clinical model, the radiomics model, and the combined model were 0.756 (95% CI 0.665-0.846), 0.914 (95% CI 0.853-0.976), and 0.950 (95% CI 0.912-0.988), respectively. In the validation cohort, the AUC values of three corresponding models were 0.567 (95% CI 0.412-0.722), 0.885 (95% CI 0.797-0.974), and 0.791 (95% CI 0.642-0.940), respectively. Though the combined model showed a higher predictive capability in the training cohort, the AUC values of the combined model and the clinical model were significantly less than the radiomics model. Therefore, the radiomics model was chosen as the final model and presented as a nomogram. The specific performances of models are shown in Table 3. ROC curves of the three models are illustrated in Figure 4, and the nomogram is presented in Figure 5A.
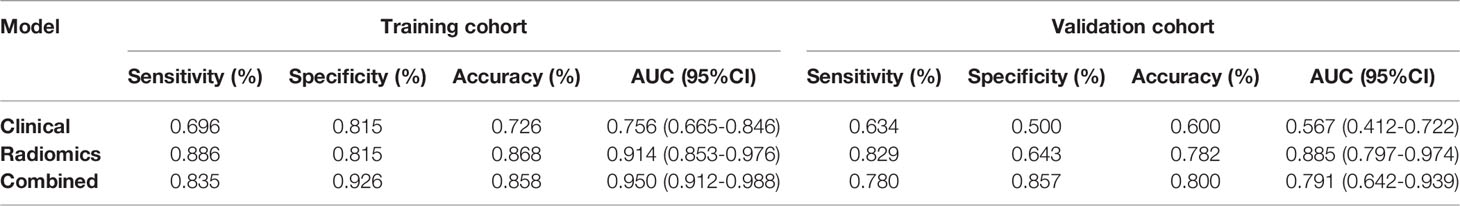
Table 3 Performances of models for PNI prediction.
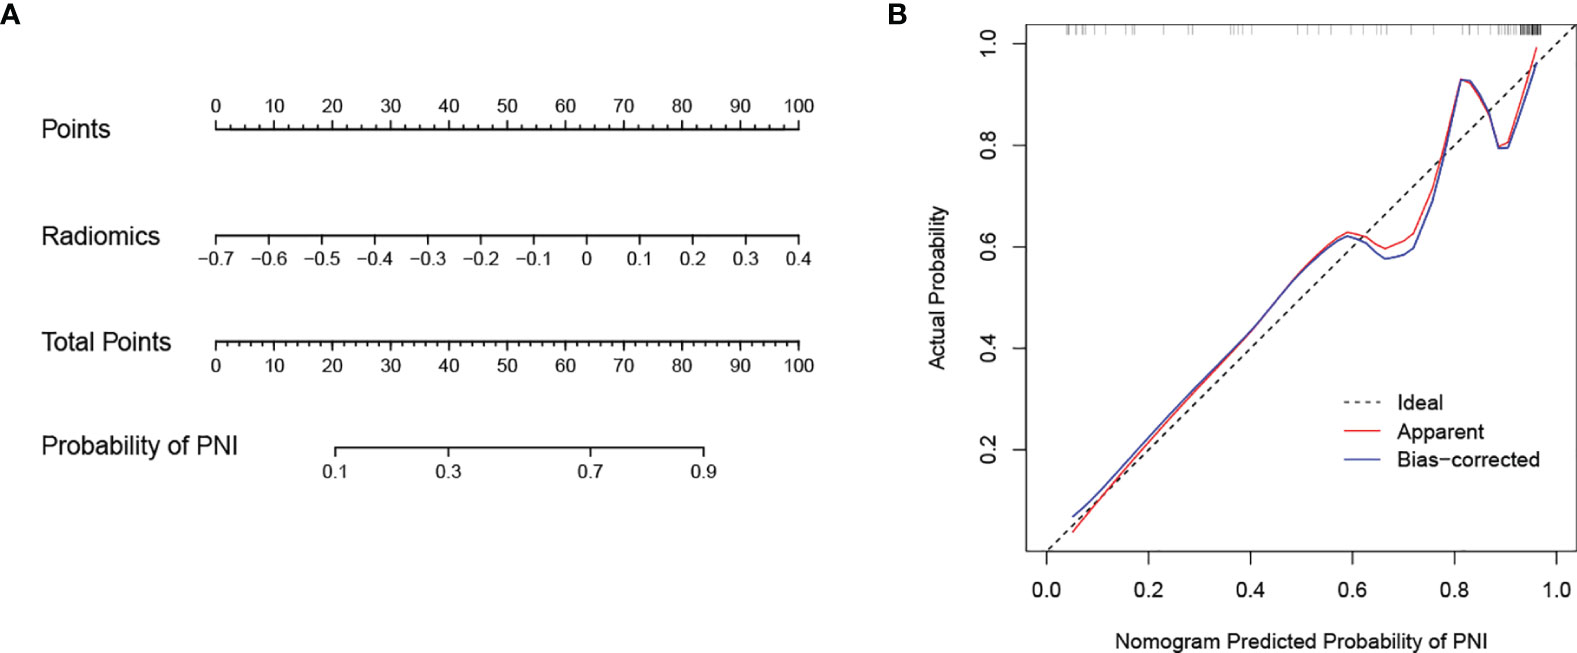
Figure 5 Nomogram developed with the radiomics model and calibration curves of the nomogram. (A) The developed radiomics nomogram to predict PNI in patients with pCCA. (B) Calibration curves of the nomogram. The x-axis and the y-axis show the nomogram predicted probabilities of PNI and the actual probabilities, respectively. The diagonal gray line presents a perfect prediction, and the red solid line presents the predictive performance of the nomogram. Better prediction is indicated by a closer fit of the red solid line to the diagonal gray line.
The calibration curve of the nomogram is presented in Figure 5B and indicated good agreement between predictive probability and actual PNI status. The decision curve analysis (DCA) for the radiomics model, the clinical model, and the combined model are presented in Figure 6. The DCA demonstrated good performance of the radiomics model in terms of clinical decision-making. In addition, the radiomics model and the combined model had a similar clinical application value, and they can provide a better net benefit than the clinical model.
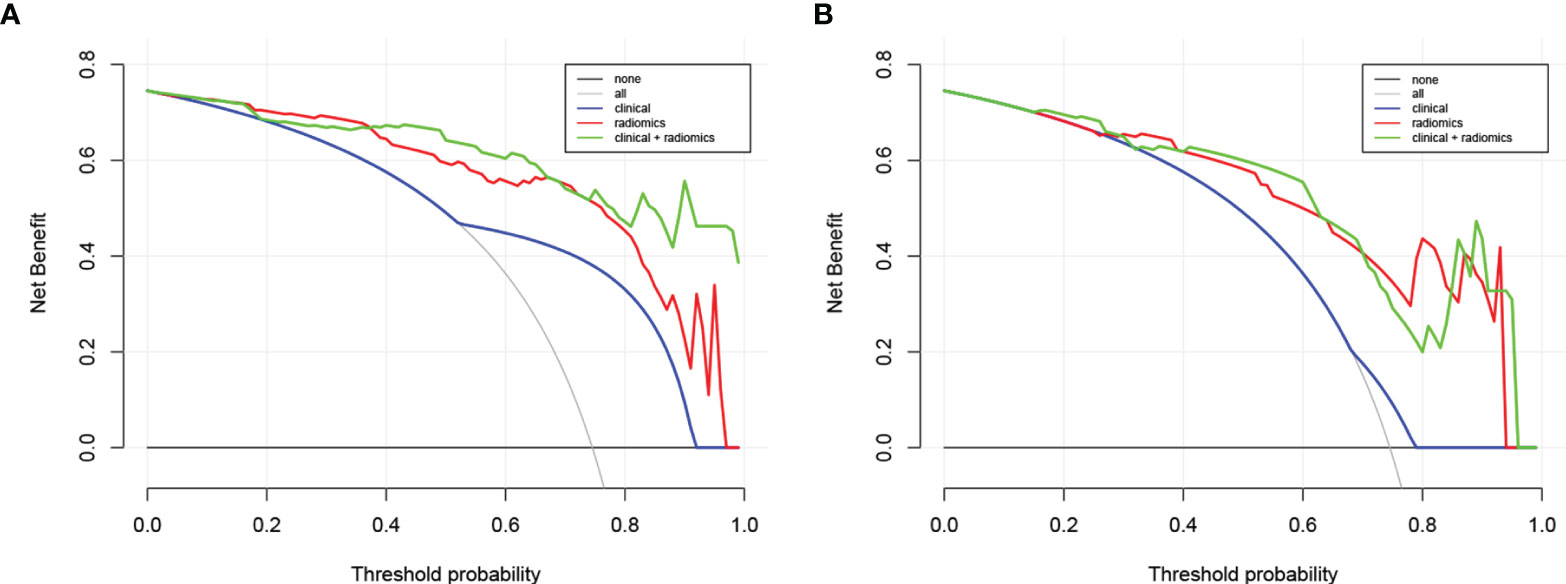
Figure 6 Decision curve analysis for the combined model, radiomics model, and clinical model in the training dataset (A) and in the testing dataset (B). The y-axis represents the net benefit. The gray line represents the assumption that all patients were confirmed with PNI; however, the black line is the opposite. The blue line represents the clinical model. The red line represents the radiomics model. The green line represents the combined model.
Discussion
The present study was conducted to probe the value of CT radiomics in determining PNI of pCCA. Our results revealed that the CT-radiomics nomogram based on the radiomics signature had a good performance in detecting PNI. The calibration curve and the DCA demonstrated that the nomogram was well calibrated and had significantly more clinical net benefits. This is the first CT-based radiomics model to noninvasively predict PNI of pCCA.
Several conventional imaging methods have been reported to diagnose PNI. Asayama et al. found that enhancement of greater than two-thirds of the primary lesion on delayed phase images was correlated with PNI in 32 patients with intrahepatic cholangiocarcinoma (ICC) (33). But this conclusion was not confirmed in another study, in which soft-tissue infiltration along the celiac plexus on MDCT was regarded as an indicator of PNI in 20 ICC patients (34). In addition, several studies have shown the value of 3D volume-rendered MDCT imaging in diagnosing PNI of pancreatic adenocarcinoma (35, 36). These studies all have the important limitation of a small sample size. On the other hand, it is difficult to confirm PNI through visual evaluation and simple quantitative methods (22).
As an emerging field, radiomics has achieved satisfactory abilities in the clinical diagnosis and treatment of malignant tumors. Previous studies have reported radiomics models with good performance in predicting the lymph node metastasis, preoperative staging, and postoperative recurrence of pCCA (27, 37, 38). In addition, many studies have indicated the diagnostic value of radiomics in detecting PNI of specific tumors including colorectal cancer, head and neck squamous cell carcinoma, and ICC (21, 24, 25, 39). Huang et al. reported an MRI-based radiomics model with the AUC value of 1 to predict PNI in patients with extrahepatic cholangiocarcinoma (22). But their study included two subtypes of CCA, and the sample size was only 101 patients. In the present study, we enrolled 161 patients with pCCA, and establish a CT-based radiomics model. The radiomics model achieved satisfactory performance in both two cohorts, with the AUCs of 0.914 and 0.885, respectively. Of note, the selected radiomics features in our study were all wavelet-based features with image conversion using a wavelet filter, which demonstrated wavelet-based features were more sensitive to PNI of the patients. Previous studies reported that wavelet-based features furnished more directional information than conventional features, which played an important role in building radiomics signatures (40). Furthermore, we developed a CT-radiomics nomogram for noninvasive prediction of PNI in pCCA. The CT-radiomics nomogram provides a simple and convenient tool for noninvasive prediction of PNI in pCCA, which may be helpful to improve patient prognostic stratification and facilitate optimized and individualized treatment strategies.
Among all baseline clinical features, we did not find the independent predictor for PNI of pCCA. That may be because we didn’t include enough clinical features or data bias. A study by Li et al. demonstrated that the depth of tumor invasion was correlated significantly with PNI of pCCA (41). Besides, some studies reported several clinicopathological factors related to PNI of other specific tumors including tumor markers, tumor stage, and tumor differentiation grade (19–21, 42). Of note, our study aimed to develop a noninvasive prediction model before surgery resection, hence pathological factors were not considered in our study. Moreover, clinical factors are indispensable for the prediction of tumors, and more efforts should be made to explore the clinical factors associated with PNI of pCCA.
Our study has several limitations. First, there may exist data bias due to the retrospective design of this study. Second, this study was conducted as a single-center study, and a future multicenter study is necessary to validate and improve the performance of our model. In addition, further study should be performed to reveal the relationship between the selected radiomics features and clinical features or genomic features, and our radiomics model should be further refined by incorporating other multi-omics features.
Conclusion
We constructed a radiomics model with good performance based on selected radiomics features to noninvasively predict PNI of pCCA. The prediction model has potential prognostic value to stratify patients and may provide a reference for individualized treatment of pCCA patients.
Data Availability Statement
The raw data supporting the conclusions of this article will be made available by the authors, without undue reservation.
Ethics Statement
The studies involving human participants were reviewed and approved by the Ethical Committee of the First Affiliated Hospital of Zhengzhou University (2021-KY-0778-001). Written informed consent for participation was not required for this study in accordance with the national legislation and the institutional requirements.
Author Contributions
PZ and PL designed this work. PZ, XL, HW, NL, YZ, WH and YC integrated and analyzed the data. PZ, ZL and XL wrote this manuscript. PZ, PL, ZL and JG edited and revised the manuscript. All authors approved this manuscript.All authors contributed to the article and approved the submitted version. All authors approved this manuscript. All authors contributed to the article and approved the submitted version.
Funding
This study was supported by the Key Scientific Research Project of Higher Education in Henan Province (No.22A320057).
Conflict of Interest
The authors declare that the research was conducted in the absence of any commercial or financial relationships that could be construed as a potential conflict of interest.
Publisher’s Note
All claims expressed in this article are solely those of the authors and do not necessarily represent those of their affiliated organizations, or those of the publisher, the editors and the reviewers. Any product that may be evaluated in this article, or claim that may be made by its manufacturer, is not guaranteed or endorsed by the publisher.
Supplementary Material
The Supplementary Material for this article can be found online at: https://www.frontiersin.org/articles/10.3389/fonc.2022.900478/full#supplementary-material
References
1. Brindley PJ, Bachini M, Ilyas SI, Khan SA, Loukas A, Sirica AE, et al. Cholangiocarcinoma. Nat Rev Dis Primers (2021) 7:65. doi: 10.1038/s41572-021-00300-2
2. Rizvi S, Gores GJ. Pathogenesis, Diagnosis, and Management of Cholangiocarcinoma. Gastroenterology (2013) 145:1215–29. doi: 10.1053/j.gastro.2013.10.013
3. Serrablo A, Serrablo L, Alikhanov R, Tejedor L. Vascular Resection in Perihilar Cholangiocarcinoma. Cancers (Basel) (2021) 13:5278. doi: 10.3390/cancers13215278
4. van Keulen AM, Franssen S, van der Geest LG, de Boer MT, Coenraad M, van Driel L, et al. Nationwide Treatment and Outcomes of Perihilar Cholangiocarcinoma. Liver Int (2021) 41:1945–53. doi: 10.1111/liv.14856
5. Gaspersz MP, Buettner S, van Vugt J, Roos E, Coelen R, Vugts J, et al. Conditional Survival in Patients With Unresectable Perihilar Cholangiocarcinoma. HPB (Oxford) (2017) 19:966–71. doi: 10.1016/j.hpb.2017.07.004
6. Chen SH, Zhang BY, Zhou B, Zhu CZ, Sun LQ, Feng YJ. Perineural Invasion of Cancer: A Complex Crosstalk Between Cells and Molecules in the Perineural Niche. Am J Cancer Res (2019) 9:1–21.
7. Huang T, Wang Y, Wang Z, Cui Y, Sun X, Wang Y. Weighted Gene Co-Expression Network Analysis Identified Cancer Cell Proliferation as a Common Phenomenon During Perineural Invasion. Onco Targets Ther (2019) 12:10361–74. doi: 10.2147/OTT.S229852
8. Yin L, Li J, Wang J, Pu T, Wei J, Li Q, et al. MAOA Promotes Prostate Cancer Cell Perineural Invasion Through SEMA3C/PlexinA2/NRP1-cMET Signaling. Oncogene (2021) 40:1362–74. doi: 10.1038/s41388-020-01615-2
9. Wang H, Zheng Q, Lu Z, Wang L, Ding L, Xia L, et al. Role of the Nervous System in Cancers: A Review. Cell Death Discovery (2021) 7:76. doi: 10.1038/s41420-021-00450-y
10. Nagino M, Ebata T, Yokoyama Y, Igami T, Sugawara G, Takahashi Y, et al. Evolution of Surgical Treatment for Perihilar Cholangiocarcinoma: A Single-Center 34-Year Review of 574 Consecutive Resections. Ann Surg (2013) 258:129–40. doi: 10.1097/SLA.0b013e3182708b57
11. Cho MS, Kim SH, Park SW, Lim JH, Choi GH, Park JS, et al. Surgical Outcomes and Predicting Factors of Curative Resection in Patients With Hilar Cholangiocarcinoma: 10-Year Single-Institution Experience. J Gastrointest Surg (2012) 16:1672–9. doi: 10.1007/s11605-012-1960-0
12. Zhang Z, Zhou Y, Hu K, Wang D, Wang Z, Huang Y. Perineural Invasion as a Prognostic Factor for Intrahepatic Cholangiocarcinoma After Curative Resection and a Potential Indication for Postoperative Chemotherapy: A Retrospective Cohort Study. BMC Cancer (2020) 20:270. doi: 10.1186/s12885-020-06781-w
13. Gasparini G, Pellegatta M, Crippa S, Lena MS, Belfiori G, Doglioni C, et al. Nerves and Pancreatic Cancer: New Insights Into a Dangerous Relationship. Cancers (Basel) (2019) 11:893. doi: 10.3390/cancers11070893
14. Saloman JL, Albers KM, Rhim AD, Davis BM. Can Stopping Nerves, Stop Cancer. Trends Neurosci (2016) 39:880–9. doi: 10.1016/j.tins.2016.10.002
15. Joo I, Lee JM, Yoon JH. Imaging Diagnosis of Intrahepatic and Perihilar Cholangiocarcinoma: Recent Advances and Challenges. Radiology (2018) 288:7–13. doi: 10.1148/radiol.2018171187
16. Huang YQ, Liang CH, He L, Tian J, Liang CS, Chen X, et al. Development and Validation of a Radiomics Nomogram for Preoperative Prediction of Lymph Node Metastasis in Colorectal Cancer. J Clin Oncol (2016) 34:2157–64. doi: 10.1200/JCO.2015.65.9128
17. Tomaszewski MR, Gillies RJ. The Biological Meaning of Radiomic Features. Radiology (2021) 298:505–16. doi: 10.1148/radiol.2021202553
18. Chu H, Liu Z, Liang W, Zhou Q, Zhang Y, Lei K, et al. Radiomics Using CT Images for Preoperative Prediction of Futile Resection in Intrahepatic Cholangiocarcinoma. Eur Radiol (2021) 31:2368–76. doi: 10.1007/s00330-020-07250-5
19. Li M, Jin YM, Zhang YC, Zhao YL, Huang CC, Liu SM, et al. Radiomics for Predicting Perineural Invasion Status in Rectal Cancer. World J Gastroenterol (2021) 27:5610–21. doi: 10.3748/wjg.v27.i33.5610
20. Zhang K, Ren Y, Xu S, Lu W, Xie S, Qu J, et al. A Clinical-Radiomics Model Incorporating T2-Weighted and Diffusion-Weighted Magnetic Resonance Images Predicts the Existence of Lymphovascular Invasion / Perineural Invasion in Patients With Colorectal Cancer. Med Phys (2021) 48:4872–82. doi: 10.1002/mp.15001
21. Guo Y, Wang Q, Guo Y, Zhang Y, Fu Y, Zhang H. Preoperative Prediction of Perineural Invasion With Multi-Modality Radiomics in Rectal Cancer. Sci Rep (2021) 11:9429. doi: 10.1038/s41598-021-88831-2
22. Huang X, Shu J, Yan Y, Chen X, Yang C, Zhou T, et al. Feasibility of Magnetic Resonance Imaging-Based Radiomics Features for Preoperative Prediction of Extrahepatic Cholangiocarcinoma Stage. Eur J Cancer (2021) 155:227–35. doi: 10.1016/j.ejca.2021.06.053
23. Yardımcı AH, Koçak B, Turan Bektaş C, Sel İ, Yarıkkaya E, Dursun N, et al. Tubular Gastric Adenocarcinoma: Machine Learning-Based CT Texture Analysis for Predicting Lymphovascular and Perineural Invasion. Diagn Interv Radiol (2020) 26:515–22. doi: 10.5152/dir.2020.19507
24. Mukherjee P, Cintra M, Huang C, Zhou M, Zhu S, Colevas AD, et al. CT-Based Radiomic Signatures for Predicting Histopathologic Features in Head and Neck Squamous Cell Carcinoma. Radiol Imaging Cancer (2020) 2:e190039. doi: 10.1148/rycan.2020190039
25. Peng YT, Zhou CY, Lin P, Wen DY, Wang XD, Zhong XZ, et al. Preoperative Ultrasound Radiomics Signatures for Noninvasive Evaluation of Biological Characteristics of Intrahepatic Cholangiocarcinoma. Acad Radiol (2020) 27:785–97. doi: 10.1016/j.acra.2019.07.029
26. Li J, Kang R, Tang D. Cellular and Molecular Mechanisms of Perineural Invasion of Pancreatic Ductal Adenocarcinoma. Cancer Commun (Lond) (2021) 41:642–60. doi: 10.1002/cac2.12188
27. Qin H, Hu X, Zhang J, Dai H, He Y, Zhao Z, et al. Machine-Learning Radiomics to Predict Early Recurrence in Perihilar Cholangiocarcinoma After Curative Resection. Liver Int (2021) 41:837–50. doi: 10.1111/liv.14763
28. Ji GW, Zhang YD, Zhang H, Zhu FP, Wang K, Xia YX, et al. Biliary Tract Cancer at CT: A Radiomics-Based Model to Predict Lymph Node Metastasis and Survival Outcomes. Radiology (2019) 290:90–8. doi: 10.1148/radiol.2018181408
29. Bernatz S, Zhdanovich Y, Ackermann J, Koch I, Wild PJ, Dos Santos DP, et al. Impact of Rescanning and Repositioning on Radiomic Features Employing a Multi-Object Phantom in Magnetic Resonance Imaging. Sci Rep (2021) 11:14248. doi: 10.1038/s41598-021-93756-x
30. Park HJ, Park B, Park SY, Choi SH, Rhee H, Park JH, et al. Preoperative Prediction of Postsurgical Outcomes in Mass-Forming Intrahepatic Cholangiocarcinoma Based on Clinical, Radiologic, and Radiomics Features. Eur Radiol (2021) 31:8638–48. doi: 10.1007/s00330-021-07926-6
31. Zhang QW, Gao YJ, Zhang RY, Zhou XX, Chen SL, Zhang Y, et al. Personalized CT-Based Radiomics Nomogram Preoperative Predicting Ki-67 Expression in Gastrointestinal Stromal Tumors: A Multicenter Development and Validation Cohort. Clin Transl Med (2020) 9:12. doi: 10.1186/s40169-020-0263-4
32. Zwanenburg A, Vallières M, Abdalah MA, Aerts H, Andrearczyk V, Apte A, et al. The Image Biomarker Standardization Initiative: Standardized Quantitative Radiomics for High-Throughput Image-Based Phenotyping. Radiology (2020) 295:328–38. doi: 10.1148/radiol.2020191145
33. Asayama Y, Yoshimitsu K, Irie H, Tajima T, Nishie A, Hirakawa M, et al. Delayed-Phase Dynamic CT Enhancement as a Prognostic Factor for Mass-Forming Intrahepatic Cholangiocarcinoma. Radiology (2006) 238:150–5. doi: 10.1148/radiol.2381041765
34. Raghavan K, Jeffrey RB, Patel BN, DiMaio MA, Willmann JK, Olcott EW. MDCT Diagnosis of Perineural Invasion Involving the Celiac Plexus in Intrahepatic Cholangiocarcinoma: Preliminary Observations and Clinical Implications. AJR Am J Roentgenol (2015) 205:W578–84. doi: 10.2214/AJR.15.14607
35. Deshmukh SD, Willmann JK, Jeffrey RB. Pathways of Extrapancreatic Perineural Invasion by Pancreatic Adenocarcinoma: Evaluation With 3D Volume-Rendered MDCT Imaging. AJR Am J Roentgenol (2010) 194:668–74. doi: 10.2214/AJR.09.3285
36. Patel BN, Giacomini C, Jeffrey RB, Willmann JK, Olcott E. Three-Dimensional Volume-Rendered Multidetector CT Imaging of the Posterior Inferior Pancreaticoduodenal Artery: Its Anatomy and Role in Diagnosing Extrapancreatic Perineural Invasion. Cancer Imaging (2013) 13:580–90. doi: 10.1102/1470-7330.2013.0051
37. Yang C, Huang M, Li S, Chen J, Yang Y, Qin N, et al. Radiomics Model of Magnetic Resonance Imaging for Predicting Pathological Grading and Lymph Node Metastases of Extrahepatic Cholangiocarcinoma. Cancer Lett (2020) 470:1–7. doi: 10.1016/j.canlet.2019.11.036
38. Wang Y, Shao J, Wang P, Chen L, Ying M, Chai S, et al. Deep Learning Radiomics to Predict Regional Lymph Node Staging for Hilar Cholangiocarcinoma. Front Oncol (2021) 11:721460. doi: 10.3389/fonc.2021.721460
39. Huang Y, He L, Dong D, Yang C, Liang C, Chen X, et al. Individualized Prediction of Perineural Invasion in Colorectal Cancer: Development and Validation of a Radiomics Prediction Model. Chin J Cancer Res (2018) 30:40–50. doi: 10.21147/j.issn.1000-9604.2018.01.05
40. Zhao H, Li W, Lyu P, Zhang X, Liu H, Liang P, et al. TCGA-TCIA-Based CT Radiomics Study for Noninvasively Predicting Epstein-Barr Virus Status in Gastric Cancer. AJR Am J Roentgenol (2021) 217:124–34. doi: 10.2214/AJR.20.23534
41. Li CG, Zhou ZP, Tan XL, Zhao ZM. Perineural Invasion of Hilar Cholangiocarcinoma in Chinese Population: One Center's Experience. World J Gastrointest Oncol (2020) 12:457–66. doi: 10.4251/wjgo.v12.i4.457
Keywords: perihilar cholangiocarcinoma, perineural invasion, radiomics, CT, nomogram
Citation: Zhan P-C, Lyu P-j, Li Z, Liu X, Wang H-X, Liu N-N, Zhang Y, Huang W, Chen Y and Gao J-b (2022) CT-Based Radiomics Analysis for Noninvasive Prediction of Perineural Invasion of Perihilar Cholangiocarcinoma. Front. Oncol. 12:900478. doi: 10.3389/fonc.2022.900478
Received: 20 March 2022; Accepted: 20 May 2022;
Published: 20 June 2022.
Edited by:
Alessio G. Morganti, University of Bologna, ItalyReviewed by:
Xiao Chen, Affiliated Hospital of Nanjing University of Chinese Medicine, ChinaSilvia Bisello, University of Bologna, Italy
Copyright © 2022 Zhan, Lyu, Li, Liu, Wang, Liu, Zhang, Huang, Chen and Gao. This is an open-access article distributed under the terms of the Creative Commons Attribution License (CC BY). The use, distribution or reproduction in other forums is permitted, provided the original author(s) and the copyright owner(s) are credited and that the original publication in this journal is cited, in accordance with accepted academic practice. No use, distribution or reproduction is permitted which does not comply with these terms.
*Correspondence: Jian-bo Gao, SmlhbmJvZ2FvMDMwN0AxNjMuY29t; Pei-jie Lyu, THZwZWlqaWUyQDE2My5jb20=
†These authors have contributed equally to this work