
94% of researchers rate our articles as excellent or good
Learn more about the work of our research integrity team to safeguard the quality of each article we publish.
Find out more
ORIGINAL RESEARCH article
Front. Oncol. , 12 May 2022
Sec. Pharmacology of Anti-Cancer Drugs
Volume 12 - 2022 | https://doi.org/10.3389/fonc.2022.896433
This article is part of the Research Topic Targeting Cancer Cell Intracellular Metabolism as a Strategy against Therapy Resistance View all 7 articles
 Xuyang Guo1,2
 Shaolong Zhou1,2
 Zhuo Yang1,2Zi-An Li1,2Weihua Hu2
 Lirui Dai1,2Wulong Liang2
 Xinjun Wang1,2*
Metabolic reprogramming is a hallmark of glioma, and sterol O-acyltransferase 1 (SOAT1) is an essential target for metabolic therapy. However, the prognostic value of SOAT1 and its association with immune infiltration has not been fully elucidated. Using RNA-seq and clinical data of glioma patients from The Cancer Genome Atlas (TCGA), SOAT1 was found to be correlated with poor prognosis in glioma and the advanced malignancy of clinicopathological characteristics. Next, the correlation between SOAT1 expression and tumor-infiltrating immune cells was performed using the single-sample GSEA algorithm, gene expression profiling interactive analysis (GEPIA), and tumor immune estimation resource version 2 (TIMER2.0); it was found that SOAT1 expression was positively correlated with multiple tumor-infiltrating immune cells. To further verify these results, immunofluorescence was conducted on paraffin-embedded glioma specimens, and a positive trend of the correlation between SOAT1 expression and Treg infiltration was observed in this cohort. Finally, differentially expressed gene analysis, and Gene Ontology and Kyoto Encyclopedia of Genes and Genomes analyses were performed to explore the biological processes and signaling pathways that SOAT1 may be involved in during glioma pathogenesis. A protein-protein interaction network was established, and co-expression analysis was conducted to investigate the regulatory mechanism of SOAT1 in glioma. To the best of our knowledge, this is the first comprehensive study reporting that SOAT1 may serve as a novel prognostic biomarker associated with immune infiltrates, providing a novel perspective for glioma metabolic therapy.
Glioma is the most common type of primary tumor in the adult central nervous system, and glioblastoma (GBM) is the most commonly occurring malignant brain tumor. Despite receiving standard therapeutic regimens, including surgical resection, targeted radiation therapy, and chemotherapy, the prognosis of glioma remains unsatisfactory (1). Immunotherapy has emerged as a novel strategy for cancer treatment and has been used successfully for various cancer types, creating new opportunities for glioma treatment (2). However, clinical trials on immunotherapy have thus far failed to report encouraging results (3–6). The unique immune environment in the brain and tumor microenvironment (TME) comprise the main barrier of immunotherapy (7). Furthermore, metabolic reprogramming is a hallmark of glioma. Metabolic remodeling has been found to markedly impact the TME (8), which promotes tumor progression and immunosuppression (9). Therefore, metabolic therapy is a promising approach for ameliorating the TME and improving the efficacy of immunotherapy.
The sterol O-acyltransferase 1 (SOAT1) gene was mapped to the human chromosome 1q25. SOAT1 protein contains nine transmembrane domains (TMD) and the catalytic His460 residue is involved in free cholesterol binding in TMD7, with a portion of the N-terminal domain and TMD8 being important for subunit interactions (10). SOAT1 is a key enzyme that acts to esterify the 3-hydroxyl position of cellular free cholesterol with a fatty acid-CoA creating cholesteryl ester (CE) (11). CE is stored as lipid droplets (LDs) in cells. Tumor cells exhibit metabolic abnormalities to meet the elevated energy and biosynthetic demands associated with rapid tumor growth (12), and thus SOAT1 has become an essential target of metabolic therapy for tumor treatment. Thus far, SOAT1 has exhibited a prognostic value in several types of cancers, and its blockade can inhibit the proliferation of neoplasm cells in various cancer types, including pancreatic cancer, glioma, prostate cancer, lung cancer, and adrenocortical carcinoma (13–17).
Lipid metabolism reprogramming promotes immune suppression by facilitating immune infiltration (9). LD accumulation and increased SOAT1 expression have been discovered in glioma (14), whereas the relationship between SOAT1 expression and immune infiltration in glioma remains unclear. The aim of the present study was to explore the association between SOAT1 expression and immune infiltration using bioinformatics analysis. In addition, since T regulatory cells (Treg) are important cells that exert an anti-immune effect in TME (8), the correlation between SOAT1 expression and Treg infiltration were further explored using immunofluorescence. The prognostic value of SOAT1 in glioma has not been fully elucidated, so it was explored herein. In addition, the correlation between SOAT1 expression and the clinicopathological characteristics of gliomas was investigated using clinical and transcriptome (RNA-seq) data from TCGA. In addition, correlation analysis was performed between SOAT1 expression and immune checkpoint genes or chemokines/chemokine receptor genes. Moreover, functional pathways regulated by SOAT1 were characterized using Gene Ontology (GO) and Kyoto Encyclopedia of Genes and Genomes (KEGG) analysis. To better understand the regulatory mechanism of SOAT1 in glioma, protein-protein interaction (PPI) network and co-expression analyses of SOAT1 in glioma were conducted.
Standardized RNA-seq and clinical data of patients with glioma, including 174 patients with GBM and 529 with lower grade glioma [World Health Organization (WHO) grade 2–3; lower grade glioma LGG] were obtained from The Cancer Genome Atlas (TCGA; https://portal.gdc.cancer.gov/). The gene expression level of SOAT1 in 33 cancer and 31 normal tissues was obtained from the Genotype-Tissue Expression (GTEx) database (https://www.gtexportal.org/home/-index.html). The RNA-seq data was downloaded from UCSC XENA (https://xenabrowser.net/datapages/). The correlation between the SOAT1 gene expression level and the clinicopathological characteristics of glioma patients in TCGA datasets were investigated. Furthermore, the gene expression levels of SOAT1 between cancer and normal tissues were analyzed in the integrated datasets (combined TCGA with GTEx databases).
The patients were divided into high- and low-expression groups based on the median value of SOAT1 expression. Kaplan-Meier curves (K-M curves) and prognostic risk score were used to visualize the significant difference in overall survival (OS) between the high- and low-expression groups. Receiver operating characteristic (ROC) curves were used to show the prognostic value of SOAT1 in glioma. P-values and hazard ratio (HR) with 95% confidence interval (CI) were generated using log-rank tests and univariate or multivariate Cox regression analyses.
The single-sample GSEA (ssGSEA) algorithm was used to perform Spearman’s correlation analysis between SOAT1 expression and immune cell infiltration (18) using the R package “GSVA” (19). Cell type-level proportion analysis was also performed using gene expression profiling interactive analysis (GEPIA) 2021 (http://gepia2021.cancer-pku.cn/). Spearman’s correlation analysis was performed to assess the correlation between SOAT1 expression and immune infiltration through tumor immune estimation resource version 2 (TIMER2.0; http://timer.comp-genomics.org/).
To further elucidate the correlation between immune cell infiltration and SOAT1 expression in glioma, the TISIDB (an integrated repository portal for tumor-immune system interactions. http://cis.hku.hk/TISIDB/index.php) tool was used to analyze the correlation between SOAT1 expression and immune cell infiltration. The landscape of correlation between SOAT1 expression and 28 tumor-infiltrating lymphocytes across multiple cancer types was demonstrated using the “lymphocyte” module. The ESTIMATE algorithm was also used to analyze the immune and stromal scores, to evaluate the tumor immune microenvironment of SOAT1 expression in glioma. In addition, Pearson’s correlation coefficient was performed to explore the correlation between immune checkpoint gene expression and SOAT1 expression. To further investigate the association between SOAT1 expression and immune cell migration, Pearson’s correlation coefficient was performed between SOAT1 expression and chemokines/chemokine receptor genes based on TCGA cohort.
The clinicopathological characteristics of 55 patients with gliomas and 6 patients with refractory epilepsy treated by surgery in the Fifth Affiliated Hospital of Zhengzhou University (Zhengzhou Henan China) between January 2016 and December 2020 were retrospectively analyzed, and corresponding paraffin-embedded specimens were collected for immunofluorescence. Among the 55 cases of glioma, 14 cases were WHO grade 2, 21 cases were grade 3, and 20 cases were GBM. The 6 cases of refractory epilepsy were all pathologically diagnosed as gliosis.
Paraffin-embedded specimens were cut into 3-μm sections.
HE staining: Paraffin tissue sections were deparaffinized in xylene and rehydrated in degraded ethanol, respectively. After washing with dH2O, slides were stained with hematoxylin and eosin solution in sequence followed by being washed with dH2O. Then slides were dehydrated in degraded ethanol and immersed in xylene.
Immunofluorescence assay: Following deparaffinization with xylene and rehydration, antigen retrieval was performed by microwave treatment in ethylenediaminetetraacetic acid (pH 8.0) antigen retrieval buffer for 23 min. The endogenous peroxidase was blocked with 3% H2O2. Non-specific binding was blocked for 30 min using bovine serum albumin. The sections were washed in phosphate-buffered saline (PBS; pH 7.4). Diluted primary antibodies against SOAT1 (sc-69836; Santa Cruz Biotechnology, Inc.) and FoxP3 (2A11G9l; Santa Cruz Biotechnology, Inc.) were added to the tissue and incubated overnight at 4°C in a humidified chamber. Samples were then incubated with horseradish peroxidase-labelled secondary antibody for 50 min at room temperature in the dark. Sulfo-cyanine 3 tyramide signal amplification (CY3-TSA; G1223, Wuhan Servicebio Technology Co., Ltd.) and fluorescein isothiocyanate (FITC-TSA; G1222, Wuhan Servicebio Technology Co., Ltd.) were used for fluorescence signal amplification and autofluorescence quenchers (G1221; Wuhan Servicebio Technology Co., Ltd.) were used to remove autofluorescence. DAPI (G1012; Wuhan Servicebio Technology Co., Ltd.) was used for nuclear staining. Results were visualized and photographed under a fluorescence microscope (Nikon ECLIPSE C1; Nikon Corporation). Quantitative evaluation was performed by examining each section using at least three different high-power fields to calculate the percentage of positive cells in each section. Positive rate = number of positive cells/total number of cells. The median value of SOAT1 expression was 4.9%, and the percentage of positive cells in the high-expression group was ≥4.9%, while that in the low-expression group was <4.9%. The statistical summary is presented in Supplementary Table S3B. The present study was reviewed and approved by the Ethics Committee of the Fifth Affiliated Hospital of Zhengzhou University. Written informed consent for participation was not required for this study in accordance with the national legislation and the institutional requirements.
Patients were divided into the SOAT1 high- and low-expression groups based on the median SOAT1 mRNA expression value, and DEG analysis was conducted between these two groups, with adjusted P<0.05 and |log2 (FoldChange)|>2 set as the screening thresholds. To further explore the biological processes (BPs) and signaling pathways involved in SOAT1, R package “clusterProfiler” (20) was employed to perform GO and KEGG analyses based on DEG analysis. Adjusted P<0.05 was considered to indicate significant enrichment.
A PPI network was constructed using the Search Tool for the Retrieval of Interacting Genes/Proteins (STRING) database (https://string-db.org/) with the following qualifications: “evidence”, “experiments”, “low confidence (0.150)”, “no more than 50 interactors”. Co-expression analysis was also performed using “R” software with the screening thresholds: |Pearson’s correlation coefficient|>0.6, P-value<0.05. A Venn diagram was used to perform an intersection analysis of the PPI network and co-expression analysis. To further investigate the correlation between SOAT1 and intersection genes, Pearson’s correlation coefficient was adopted.
All statistical analysis was performed using R software (version 3.6.3). According to whether the data was normally distributed and whether the variance was uniform, Wilcoxon rank sum test, Welch t-test, or t-test were used to compare the difference in SOAT1 expression between two different groups, respectively. One-way ANOVA, Welch one-way ANOVA or Kruskal-Wallis test were performed for multi-group comparisons. Kaplan-Meier curves and log-rank tests were performed to compare the difference in survival between the high- and low-expression groups. ROC curves, prognostic risk score, and univariate or multivariate Cox proportional hazards regression analysis were performed to evaluate the prognostic value of SOAT1 in glioma. P<0.05 was considered to indicate a statistically significant difference.
A pan-cancer analysis was performed to compare the mRNA level of SOAT1 between tumor and corresponding normal tissues in the integrated datasets (combined TCGA with GTEx databases), which revealed that SOAT1 was upregulated in 22/33 tumor types and downregulated in 3 tumor types (Figure 1A). In addition, the mRNA level of SOAT1 was significantly upregulated in both LGG and GBM compared to normal brain tissues (Figures 1B, C). Furthermore, SOAT1 expression was elevated as the tumor grade increased (Figure 1D). The SOAT1 expression of isocitrate dehydrogenase (IDH) wild type was higher than that of IDH mutant type in WHO grade 3 and overall gliomas (Figure 1F; Supplementary Table S1). SOAT1 expression in 1p19q non-co-deleted gliomas was higher than that of 1p19q-co-deleted gliomas (Figures 1E, H; Supplementary Table S1). Since IDH wild type and 1p19q non-co-deletion are malignant biomarkers of glioma (21), the high SOAT1 expression may predict the advanced malignancy of glioma. Nevertheless, no difference in SOAT1 expression was identified between different histological types and IDH types in grade 2 gliomas (Figures 1G, I, J). In combination, SOAT1 was widely overexpressed in a variety of tumors, and the high SOAT1 expression was found to be correlated with malignant clinicopathological characteristics in glioma.
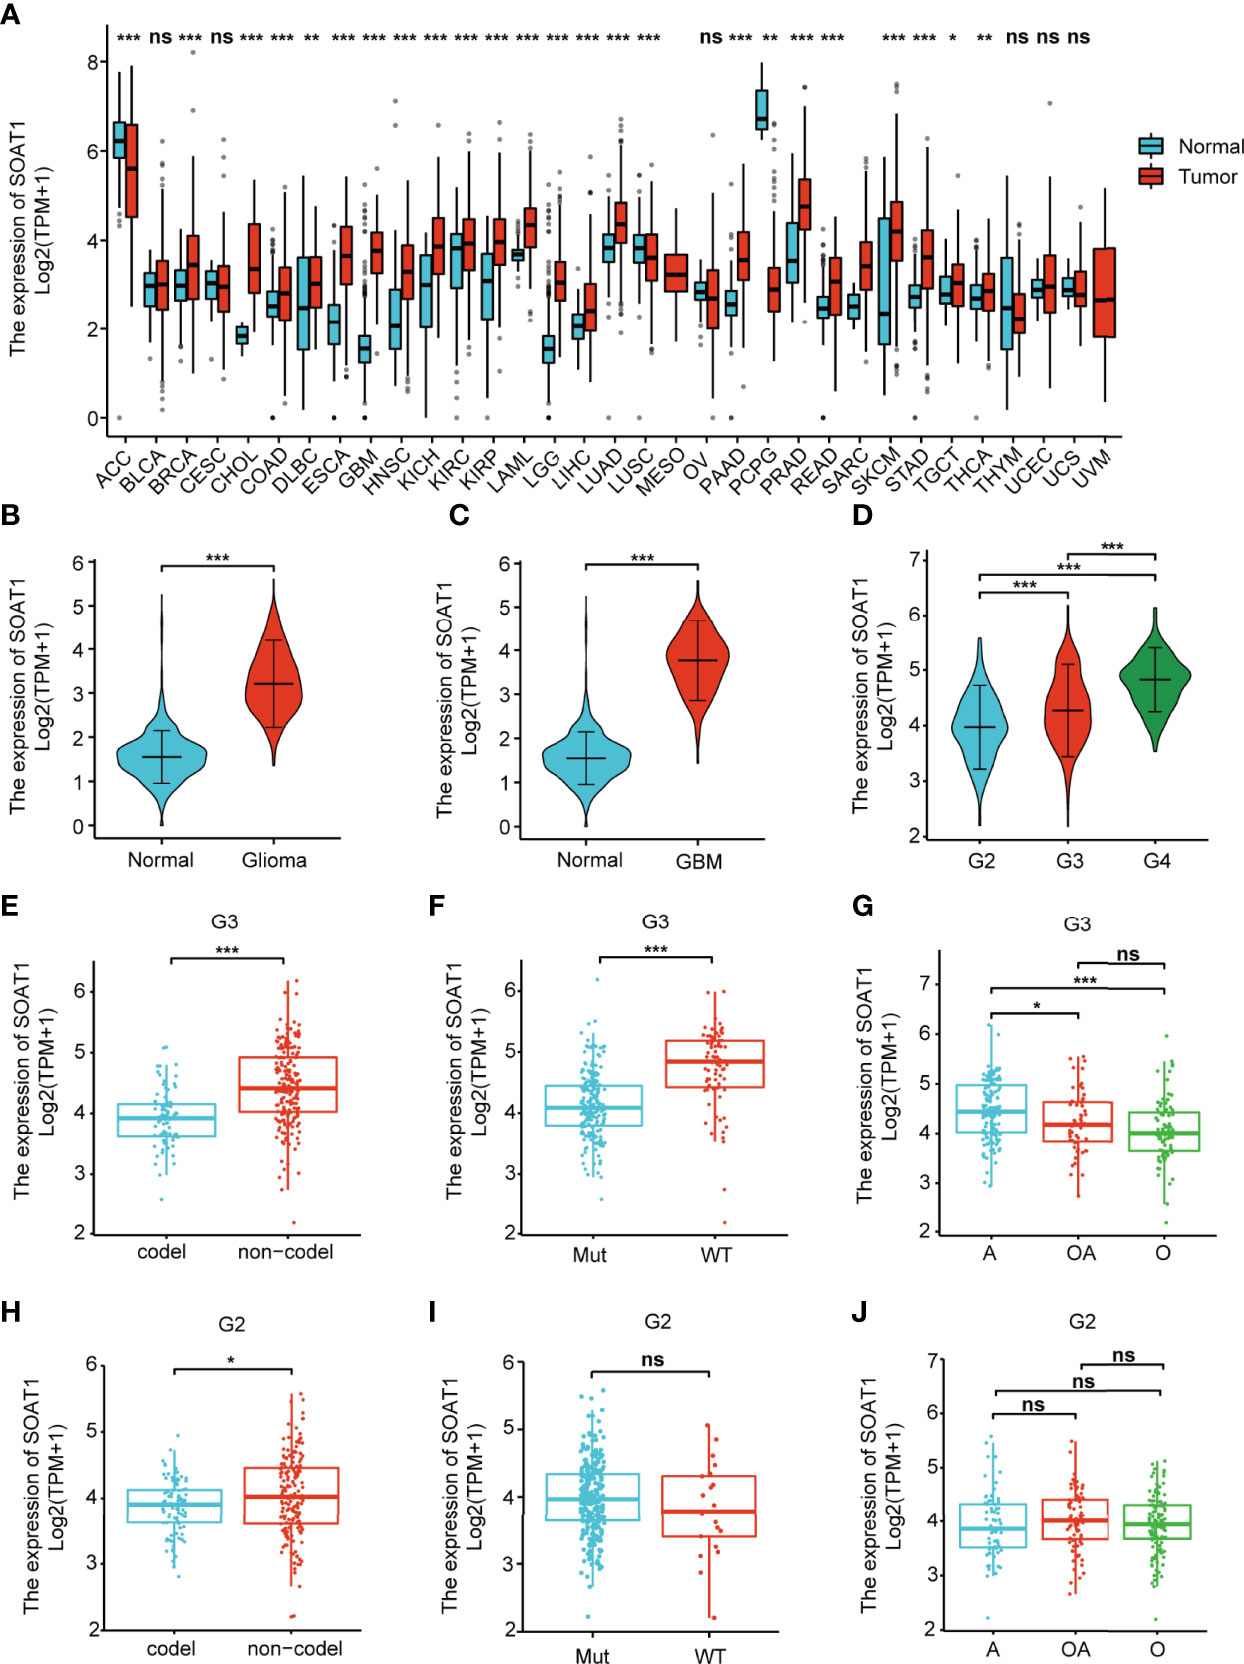
Figure 1 SOAT1 mRNA was overexpressed in various tumors, including glioma, and the high SOAT1 expression predicted an advanced malignancy of glioma. (A) Pan-cancer analysis was performed to compare the mRNA level of SOAT1 between tumors and corresponding normal tissues in the integrated datasets (combined TCGA with GTEx databases). (B) Expression levels of SOAT1 in overall glioma and normal tissues from the TCGA and GTEx databases. (C) Expression levels of SOAT1 in GBM and normal tissues from the TCGA and GTEx databases. (D) Expression levels of SOAT1 in different tumor grades from the TCGA dataset. (E–J) Expression levels of SOAT1 in 1p19q non-co-deleted and 1p19q-co-deleted types, IDH wild and IDH mutant types, astrocytoma, and oligodendroglioma and oligoastrocytoma in grade 2/3 gliomas from TCGA dataset. G2, WHO grade 2; G3, WHO grade 3; G4, WHO grade 4; codel, 1p19q-co-deleted type; non-codel, 1p19q non-co-deleted type; Mut, IDH mutant type; WT, IDH wild type. A, astrocytoma; OA, oligoastrocytoma; O, oligodendroglioma; SOAT1, sterol O-acyltransferase 1; GTEx, genotype-tissue expression; TCGA, The Cancer Genome Atlas; IDH, isocitrate dehydrogenase. ns, P ≥ 0.05; *P < 0.05; **P < 0.01; ***P < 0.001.
Using K-M curves and log-rank tests, the high SOAT1 expression was found to be associated with poor prognosis in overall and grade 3 gliomas, but not in grade 2 gliomas and GBM (Figures 2A–D). The prognostic risk score demonstrated that the fatality rate in the SOAT1 high-expression group was significantly higher than that in the low-expression group. The risk score was positively correlated with the SOAT1 expression level (Figure 2E). To further observe the predictive effect of SOAT1 expression on the OS of glioma patients, ROC curves were employed. It was found that SOAT1 had a marked predictive ability for the 1-, 3-, and 5-year OS of overall and grade 3 gliomas. The survival area under the curve (AUC) of SOAT1 expression was 0.766, 0.744, and 0.708 for the 1-, 3-, and 5-year OS, respectively, in overall glioma. The AUC of SOAT1 expression was 0.755, 0.645, and 0.603 for the 1-, 3-, and 5-year OS, respectively, in WHO grade 3 gliomas (Figures 2F, G).
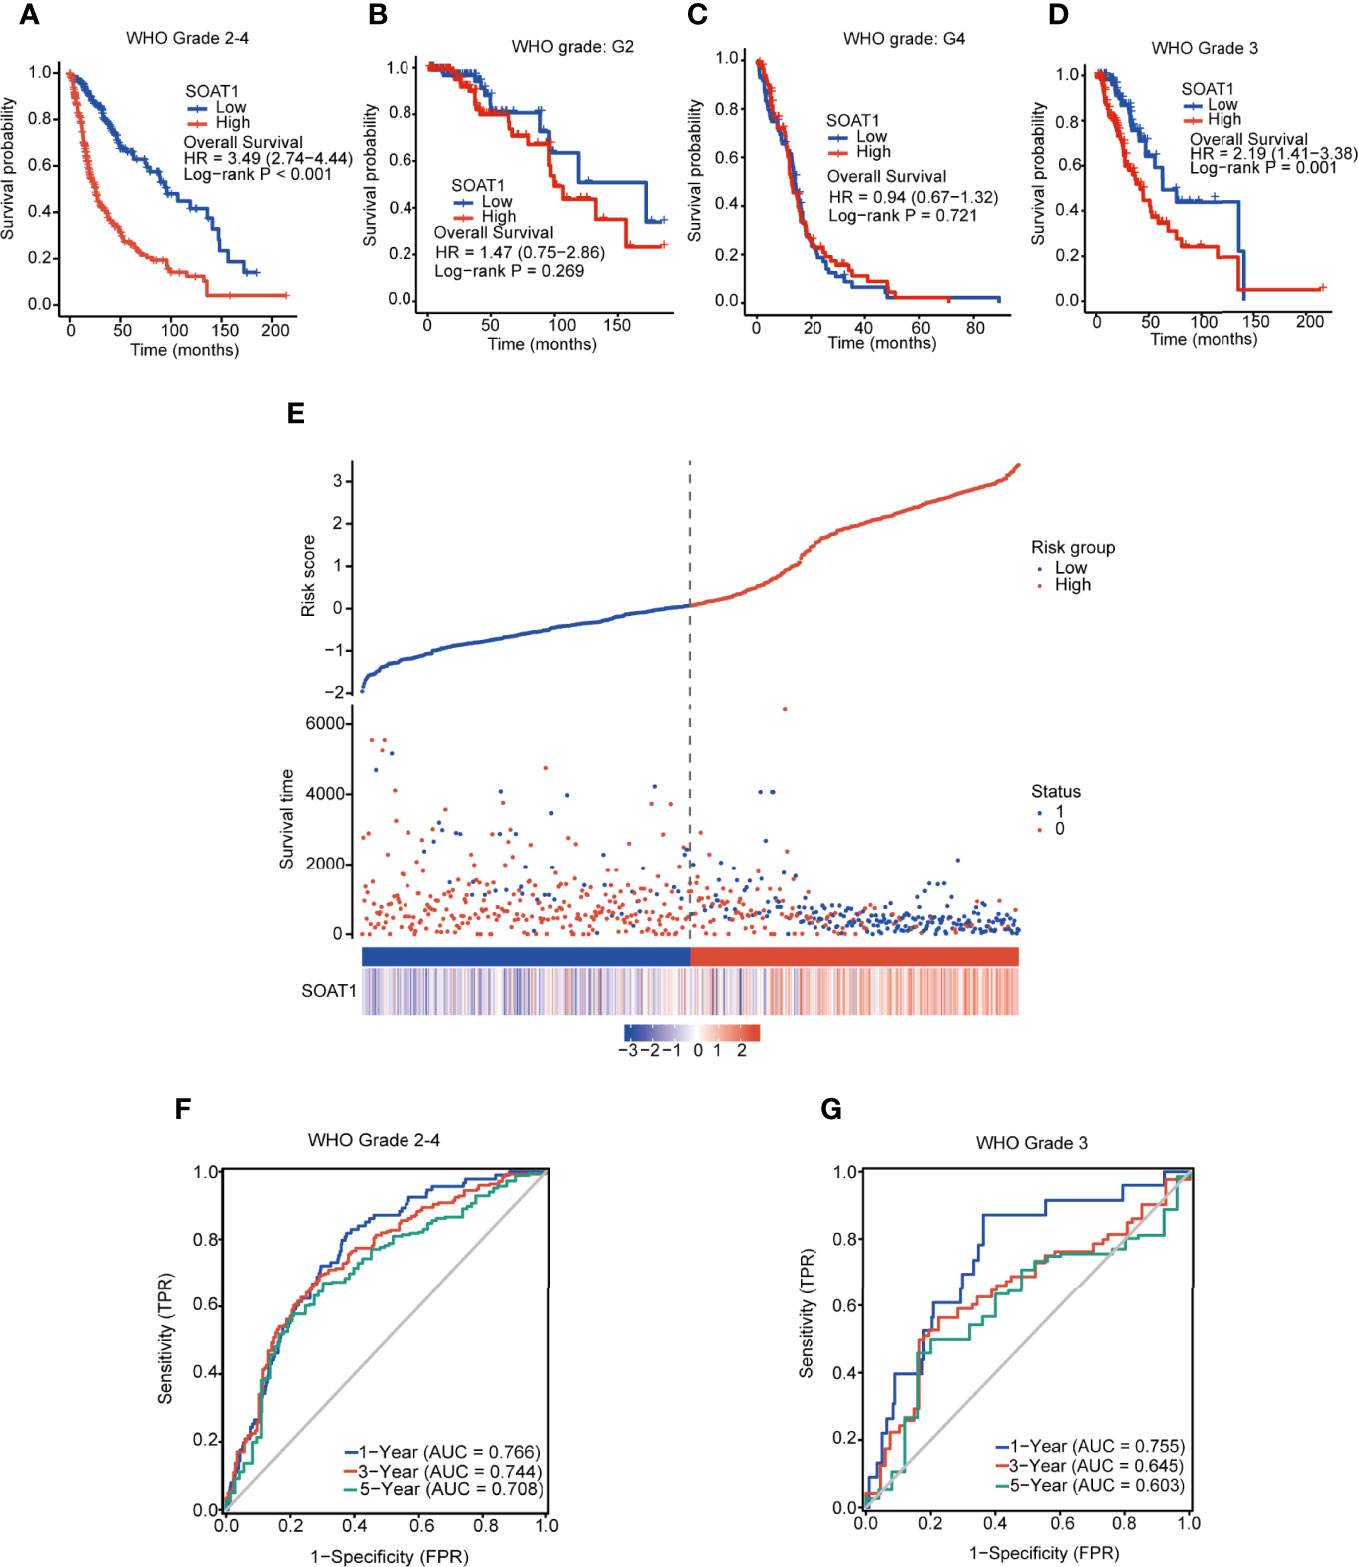
Figure 2 SOAT1 expression was associated with poor prognosis in all diffuse gliomas of all grades taken together. (A–D) KM curves and log-rank tests of OS for SOAT1 in overall glioma, grade 2 glioma, GBM (grade 4), and grade 3 glioma, based on the TCGA cohort. (E) Prognostic risk score of OS for SOAT1 in overall glioma based on the TCGA cohort. (F, G) ROC curve of OS for SOAT1 in overall and grade 3 glioma, based on the TCGA cohort. SOAT1, sterol O-acyltransferase 1; KM, Kaplan Meier; OS, overall survival; GBM, glioblastoma; TCGA, The Cancer Genome Atlas; ROC, receiver operating characteristic.
In addition, univariate Cox regression analysis indicated that SOAT1 was a poor prognostic factor for glioma patients; the HR (95% CI) was 2.863 (2.358-3.477). However, multivariate Cox regression analysis lost statistical significance (Supplementary Table S2). Furthermore, according to WHO 2021 classification of brain tumors, we classified gliomas into astrocytoma IDH-mutant grade 2, astrocytoma IDH-mutant grade 3, oligodendroglioma grade 2, oligodendroglioma grade 3, astrocytoma IDH wild type, and GBM in TCGA cohort. We divided patients into high/low groups by the median value of SOAT1 expression and performed the survival analysis in each type of glioma. Unfortunately, no statistical significance of survival analysis was identified between SOAT1 -high and -low groups in all types of gliomas (Supplementary Figure S5). Only the astrocytoma IDH mutant grade 3 showed a little tendency toward poor prognosis in the high-expression group (HR=1.69, 0.82-3.51, P=0.16. Supplementary Figure 5A). Therefore, high expression of SOAT1 was correlated with poor prognosis in glioma, but SOAT1 was not an independent prognostic factor in glioma.
Immunotherapy, including therapeutic vaccines and engineered T-cells based on tumor-immune cell interactions and blockers, has become an important strategy in the field of cancer research, including glioma (22–26). The relationship between SOAT1 expression and immune cell infiltration in the TME was determined using the ssGSEA algorithm based on the TCGA cohort. The expression of SOAT1 was found to be positively correlated with macrophages, neutrophils, T effector memory (Tem), T helper 17 cells (Th17), and activated dendritic cells (aDC), and negatively correlated with plasmacytoid DC (pDC), natural killer (NK), and CD56 bright cells in the GBM (Figure 3A). SOAT1 expression was positively correlated with T helper cells, macrophages, aDC, eosinophils, and T helper 2 cells (Th2), and negatively correlated with NK CD56 bright and pDC cells in the LGG (Figure 3A). Next, the relationship between the proportion of immune cell infiltration and the expression level of SOAT1 was demonstrated by searching the GEPIA2021 database (Figure 3B).
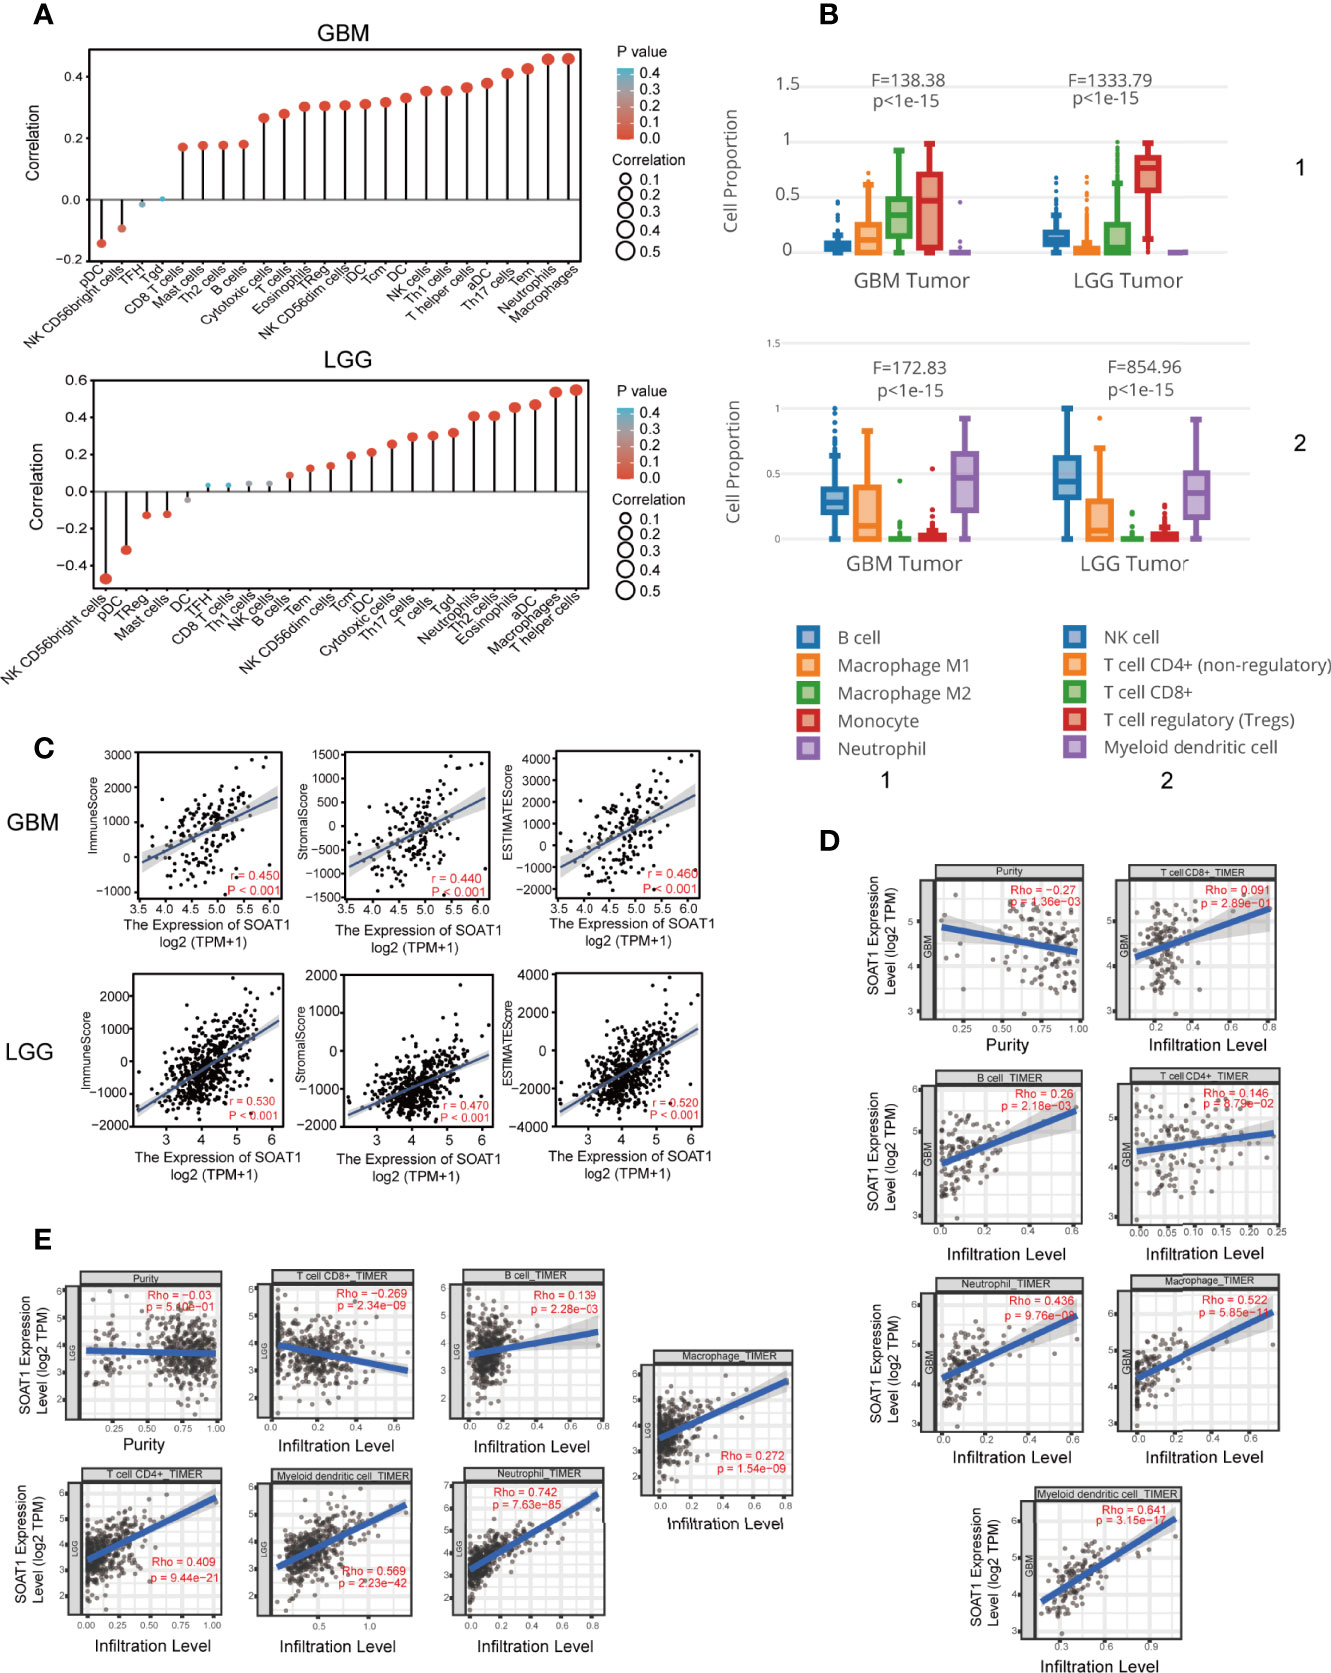
Figure 3 SOAT1 expression was associated with immune infiltration in the tumor microenvironment. (A) Correlation analysis of SOAT1 expression with immune infiltrating cells in GBM and LGG by ssGSEA algorithm based on the TCGA cohort. (B) Relationship between the proportion of immune cell infiltration and the expression level of SOAT1 from GEPIA2021. (C) Correlation analysis of SOAT1 expression with immune, stromal, and ESTIMATE scores in GBM and LGG. (D) Correlation analysis of SOAT1 expression with purity of tumor, macrophage, neutrophil, myeloid dendritic cell, CD8+ T cell, CD4+ T cell, and B cell in GBM from TIMER2.0. (E) Correlation analysis of SOAT1 expression with purity of tumor, macrophage, neutrophil, myeloid dendritic cell, CD8+ T cell, CD4+ T cell, and B cell in LGG from TIMER2.0. aDC, activated DC; DC, dendritic cells; iDC, immature DC; NK, natural killer; pDC, plasmacytoid DC; Th cells, T helper cells; Tcm, T central memory; Tem, T effector memory; TFH, T follicular helper; Tgd, T gamma delta; Th cells, T helper cells; Treg, T regulatory cells. SOAT1, sterol O-acyltransferase 1; GBM, glioblastoma; LGG, lower grade glioma; ssGSEA, single-sample GSEA; TCGA, The Cancer Genome Atlas; GEPIA, gene expression profiling interactive analysis.
To further identify and quantify the immune and matrix components in GBM and LGG, immune, stromal, and ESTIMATE scores were employed, and the results indicated that SOAT1 expression was positively correlated with all three scores in GBM and LGG (Figure 3C). In addition, correlation analysis results for SOAT1 expression and several tumor infiltrating lymphocytes (TILs) from the TIMER2.0 database are displayed in Figures 3D, E. The expression level of SOAT1 was negatively correlated with purity of tumor in GBM and LGG (r=-0.27, P=1.36e-03, r=-0.03, P=-5.10e-01) (Figures 3D, E). Of note, SOAT1 expression was positively correlated with multiple TILs in GBM, including macrophages (r=0.522, P=5.85e-11), neutrophils (r=0.436, P=9.76e-08), and myeloid dendritic cells (r=0.641, P=3.15e-17). In addition, SOAT1 expression was positively correlated with multiple TILs in LGG, including CD4+ T cells (r=0.409, P=9.44e-21), myeloid dendritic cells (r=0.569, P=2.23e-42), and neutrophils (r=0.742, P=7.63e-85).
To further validate the correlation between SOAT1 expression and immune infiltration, the correlation between SOAT1 expression and 28 TILs from the TISIDB database was examined. The pan-cancer analysis of the correlation between SOAT1 expression and 28 TILs is displayed via a heatmap (Figure 4A). Specifically, SOAT1 expression was positively correlated with multiple TILs in GBM and LGG (Figures 4B–T; Supplementary Figures S1 and S2). The above results indicated that the expression level of SOAT1 was positively correlated with various tumor infiltrating immune cells in the TME.
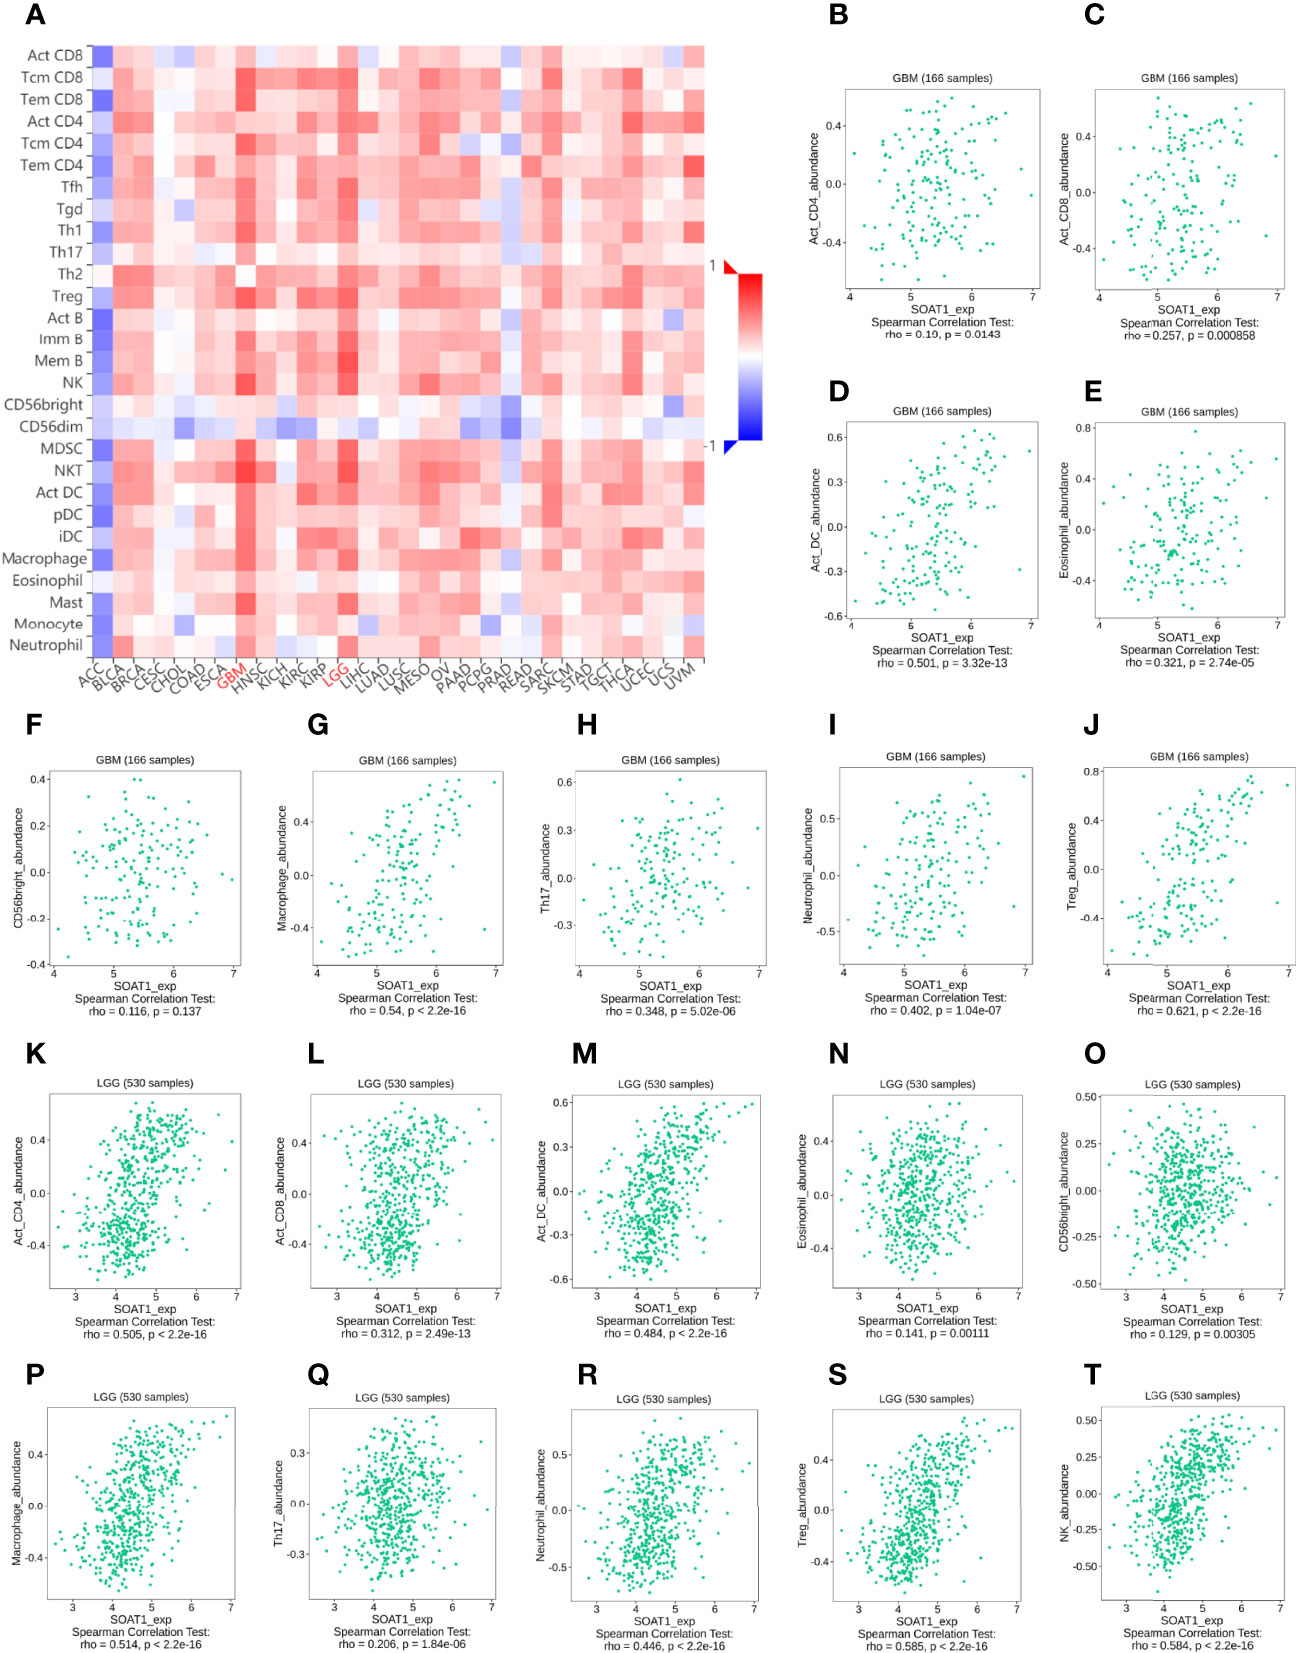
Figure 4 SOAT1 expression was associated with immune infiltration in the tumor microenvironment. (A) Pan-cancer analysis of the correlation between SOAT1 expression and immune infiltrating cells based on TISIDB dataset. (B–T) Correlation between SOAT1 expression and immune infiltrating cells in GBM and LGG based on TISIDB dataset. aDC, activated DC; DC, dendritic cells; iDC, immature DC; NK, natural killer; pDC, plasmacytoid DC; Th cells, T helper cells; Tcm, T central memory; Tem, T effector memory; TFH, T follicular helper; Tgd, T gamma delta; Th cells, T helper cells; Treg, T regulatory cells; Imm B, immature cell B; Mem B, memory cell B; MDSC, myeloid-derived suppressor cells; SOAT1, sterol O-acyltransferase 1; LGG, lower grade glioma; TISIDB, an integrated repository portal for tumor-immune system interactions.
Treg is a subgroup of CD4+ cells. In previous bioinformatics analysis, SOAT1 expression was positively correlated with multiple CD4+ T cells and Tregs based on different dataset (Figures 3A, E, Figures 4B, J, K, S; Supplementary Figures S1Q, S, and Supplementary Figures S2J, R). Forkhead Box P3 (FoxP3) is a protein-coding gene that is crucial for the development and inhibitory function of Treg (27). FoxP3 appears to be distinctive for Tregs as it is expressed in CD4+ CD25+ T cells and CD4+ CD25+ CD8- thymocytes whereas it is not found in other thymic cells, T cells, B cells, natural killer cells, or natural killer T cells (28, 29). Foxp3 also was found to control the expression of gene programs, which define and maintain Treg cell identity and function (30, 31). Therefore, FoxP3 is reliable and a constant marker that has served to isolate and characterize Tregs. Furthermore, Foxp3+ Tregs are impacted by different environmental conditions and metabolic differences associated with diverse transcriptional patterns (32). Foxp3+ Tregs have been extensively studied in gliomas and frequently infiltrate high-grade malignant gliomas (33). Since FoxP3+ Tregs play a crucial role in glioma-mediated immunosuppression (34), we wonder whether the SOAT1 expression was associated with immunosuppression in glioma.
To further validate this correlation, immunofluorescence was performed by double-labeling SOAT1 and FoxP3 on paraffin-embedded specimens from 55 cases of glioma and 6 of gliosis. Pathologists have made diagnosis based on histology and molecular characteristics. Histologically, among the 55 gliomas, 20 were GBM, 21 were grade 3 gliomas, and 14 were grade 2 gliomas. Of the 21 grade 3 gliomas, 13 were oligodendroglioma grade 3 and 8 were astrocytoma grade 3; among the 14 grade 2 gliomas, 5 were oligodendrogliomas grade 2, and 9 were astrocytoma grade 2. Consistent with our previous study, SOAT1 expression was increased as the tumor grade increased (Figure 5A; Supplementary Table S3A), while there was no difference in clinicopathologic features such as age, gender, epilepsy, histological type, preoperative Karnofsky performance status, and tumor diameter between the high- and low-expression groups. The difference of SOAT1 expression between the astrocytoma grade 2–3 and the oligodendroglioma grade 2–3 did not reach statistical significance (P=0.489) probably due to the small sample size. FoxP3+ Treg infiltration was observed in 17 cases of glioma, mostly in high-grade gliomas (9 GBM, 7 WHO grade 3, and 1 WHO grade 2). Although the difference in FoxP3+ Treg infiltration between SOAT1 high- and low-expression groups did not reach statistical significance (χ2 = 0.24, P=0.622), the positive rate of FoxP3 in the SOAT1 high-expression group (35.7%) was higher than that in the SOAT1 low-expression group (25.9%) (Supplementary Table S3A). In addition, it was found that some fields of SOAT1 high-expression group co-localized with FoxP3+ Treg infiltration (Figure 5B). The above results suggest that a positive trend of the correlation between SOAT1 expression and Treg infiltration was observed in this cohort and some of the Treg cells or tumor cells in their immediate vicinity may be expressing SOAT1.
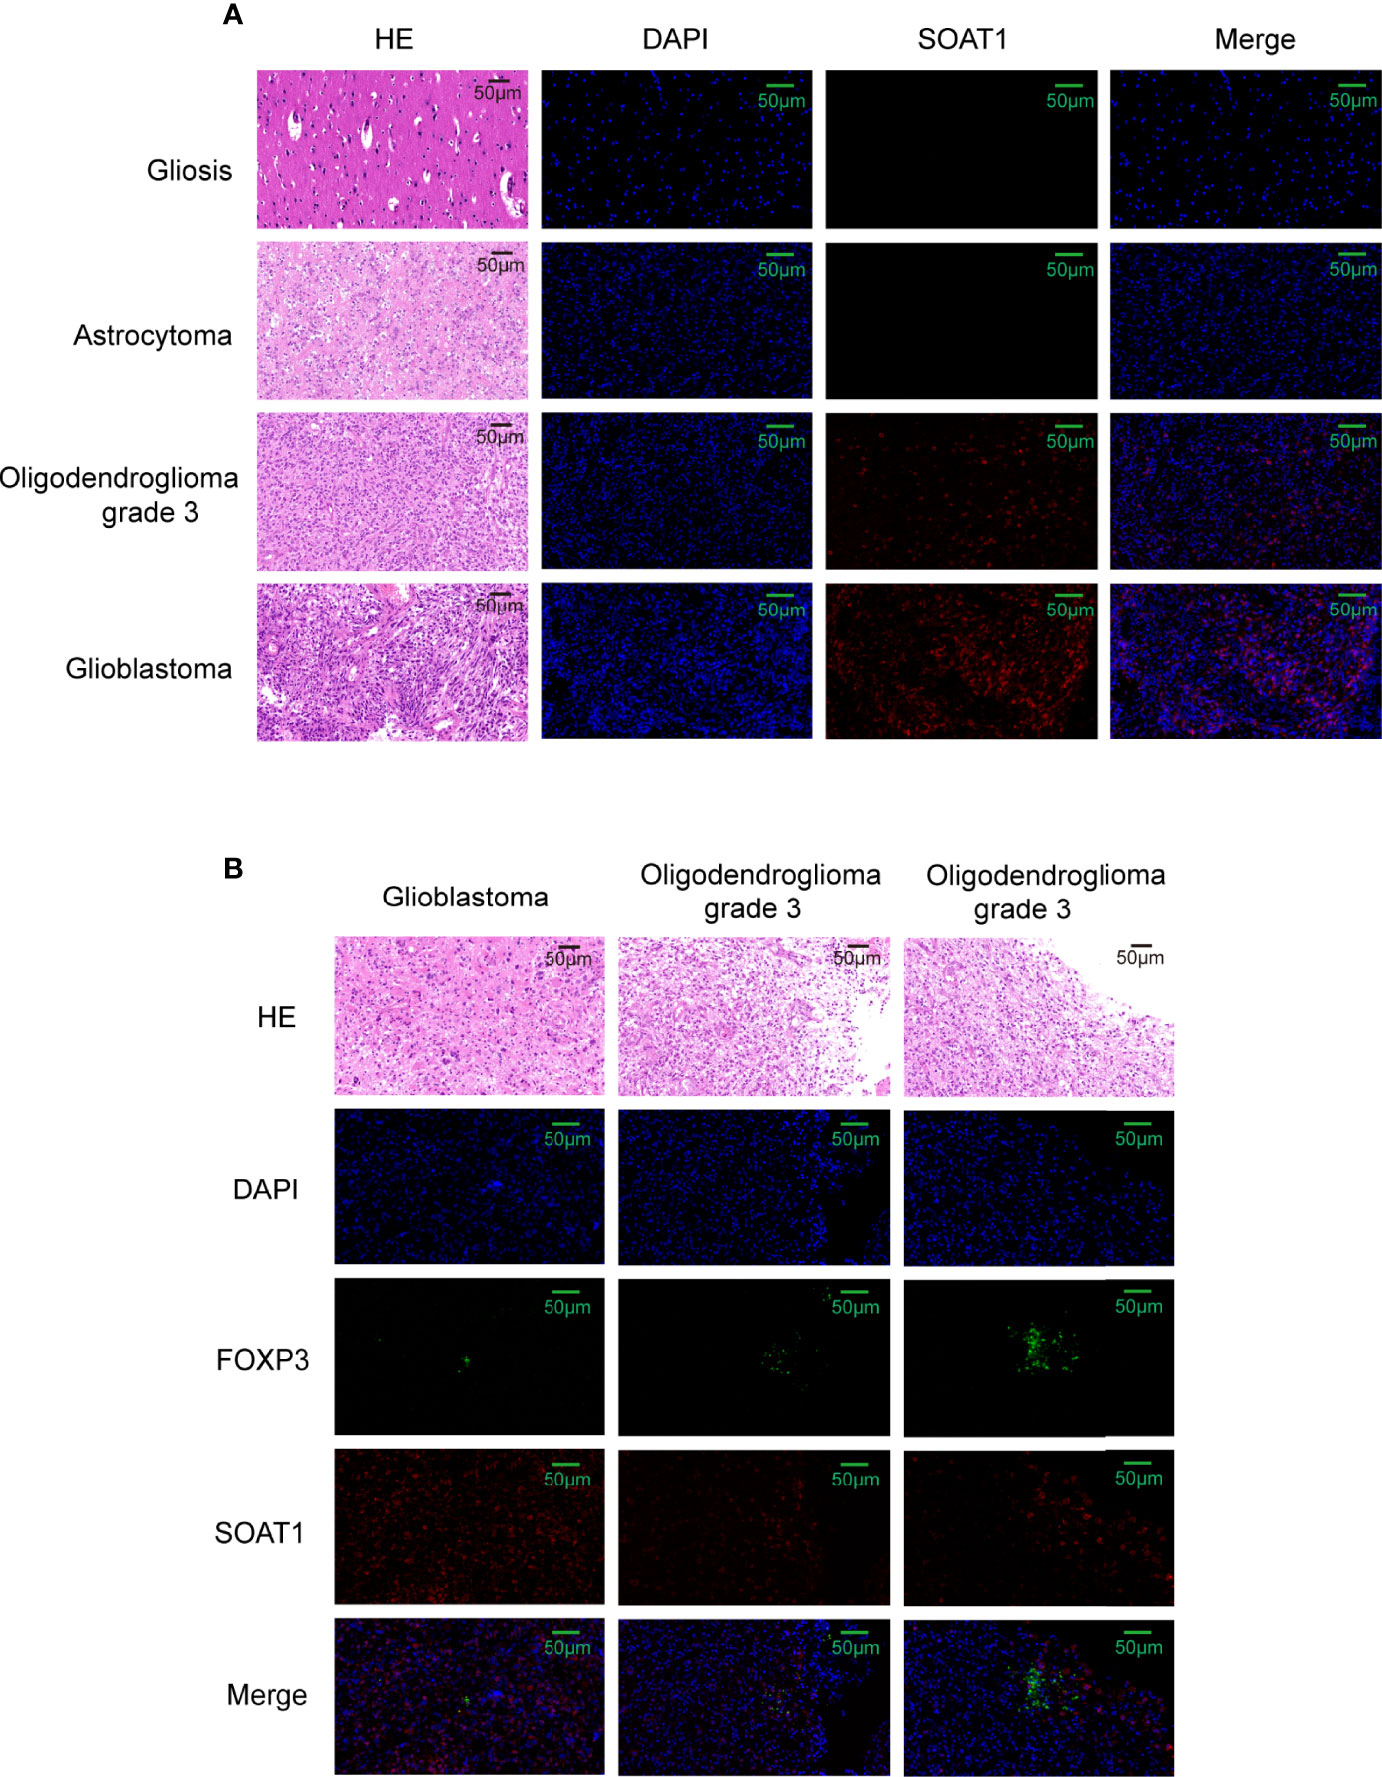
Figure 5 Correlation between SOAT1 expression and Treg infiltration was not strong. (A) Representative HE images and immunofluorescence images of SOAT1 expression in glioma, astrocytoma grade 2, oligodendroglioma grade 3, glioblastoma. (B) The co-localization of high expression of SOAT1 with FoxP3+ Treg infiltration in glioma. SOAT1, sterol O-acyltransferase 1; Treg, T regulatory cell.
Immune checkpoints have been proven to be involved in tumor immunosurveillance escape (35). Immunotherapy based on immune checkpoint blockade is increasingly considered as the most promising therapy for GBM in addition to operative treatment (36). Pearson’s correlation coefficient was performed between the SOAT1 expression and 35 immune checkpoint genes in LGG and GBM based on the TCGA dataset. The results demonstrated that SOAT1 expression was positively correlated with various checkpoint genes in GBM and LGG (Figures 6A, B). In particular, SOAT1 expression had a significant positive correlation with PD-L1 (CD274, Aliases for PD-L1 gene) (r=0.52 P=4.01e-38 in LGG, r=0.39 P=2.06e-07 in GBM), monoclonal antibodies against which have been used in clinical trials of GBM (37). These results indicated that SOAT1 may be involved in tumor immune escape.
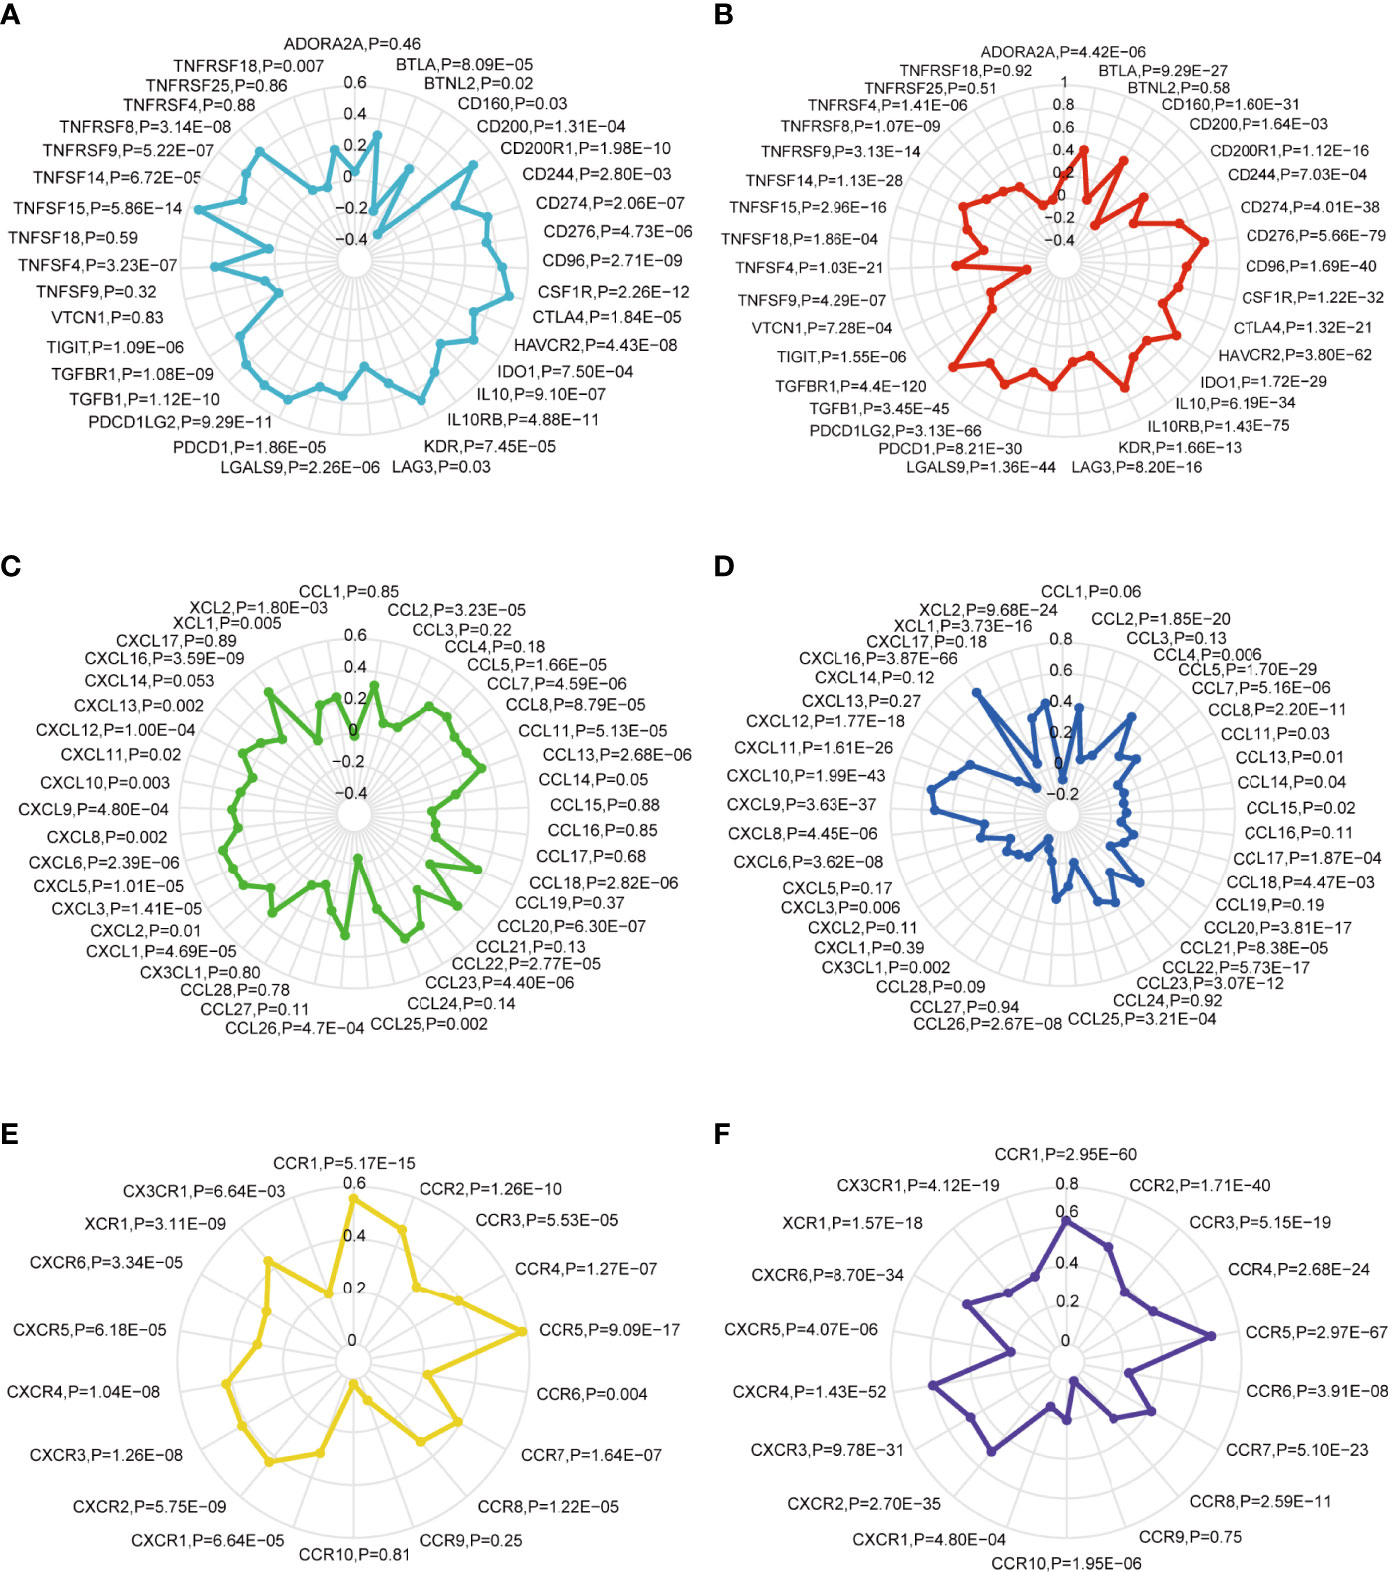
Figure 6 SOAT1 expression was positively correlated with multiple immune checkpoint genes and chemokine/chemokine receptor genes. (A) The Pearson correlation between SOAT1 expression and immune checkpoint gene levels in GBM based on TCGA cohort. (B) Pearson’s correlation coefficient between SOAT1 expression and immune checkpoint gene levels in LGG based on TCGA cohort. (C) Pearson’s correlation coefficient between SOAT1 expression and chemokine gene levels in GBM based on the TCGA cohort. (D) Pearson’s correlation coefficient between SOAT1 expression and chemokine gene levels in LGG based on the TCGA cohort. (E) Pearson’s correlation coefficient between SOAT1 expression and chemokine receptor gene levels in GBM based on the TCGA cohort. (F) Pearson’s correlation coefficient between SOAT1 expression and chemokine receptor gene levels in LGG based on the TCGA cohort. SOAT1, sterol O-acyltransferase 1; GBM, glioblastoma; TCGA, The Cancer Genome Atlas; LGG, lower grade glioma.
Next, the relationship between SOAT1 expression and multiple chemokine/chemokine receptor gene levels in GBM and LGG was comprehensively analyzed. As shown in Figures 6C–F, SOAT1 expression was positively correlated with multiple chemokine gene levels such as CCL13 (r=0.35, P=2.68e-06), CCL20 (r=0.37, P=6.30e-07), and CCL18 (r=0.35, P=2.82e-06) in GBM, and CCL5 (r=0.46, P=1.70e-29), CCL2 (r=0.39, P=1.85e-20), and CCL20 (r=0.35, P=3.81e-17) in LGG. SOAT1 expression was also positively correlated with multiple chemokine receptor gene levels, including those of CCR5 (r=0.58, P=9.09e-17), CCR1 (r=0.55, P=5.17e-15), and CCR2 (r=0.47, P=1.26e-10) in GBM, and CCR5 (r=0.665, P=2.97e-67), CCR1 (r=0.63P=2.95e-60), and CCR2 (r=0.53, P=1.71e-40) in LGG. These results indicated that SOAT1 overexpression may increase the secretion of chemokines to attract immune infiltration into the TME.
To further understand the role of SOAT1 in glioma pathogenesis, DEG analysis was performed based on the TCGA dataset, and the |logFC| and adjusted P-value were visualized using volcano plots (Figure 7A). The results showed that 662 genes were upregulated, and 289 genes were downregulated under the screening threshold (adjusted P<0.05 and |log2 (FoldChange)| >2). GO and KEGG analyses based on DEGs analysis demonstrated that a variety of pathways and BPs were significantly enriched, including antigen binding, immunoglobulin complex, humoral immune response (GO analysis; Supplementary Figure S3A), neuroactive ligand-receptor interaction, PI3K/AKT signaling pathway, viral protein interaction with cytokine and cytokine receptor, chemokine signaling pathway, and cAMP signaling pathway (KEGG analysis; Figure 7B). To further visualize the genes involved in the significantly enriched pathway, a chordal graph was used (Figure 7C; Supplementary Figures S3B and S4A). These results demonstrated that SOAT1 was involved in a variety of BPs and signaling pathways in the pathogenesis of glioma.
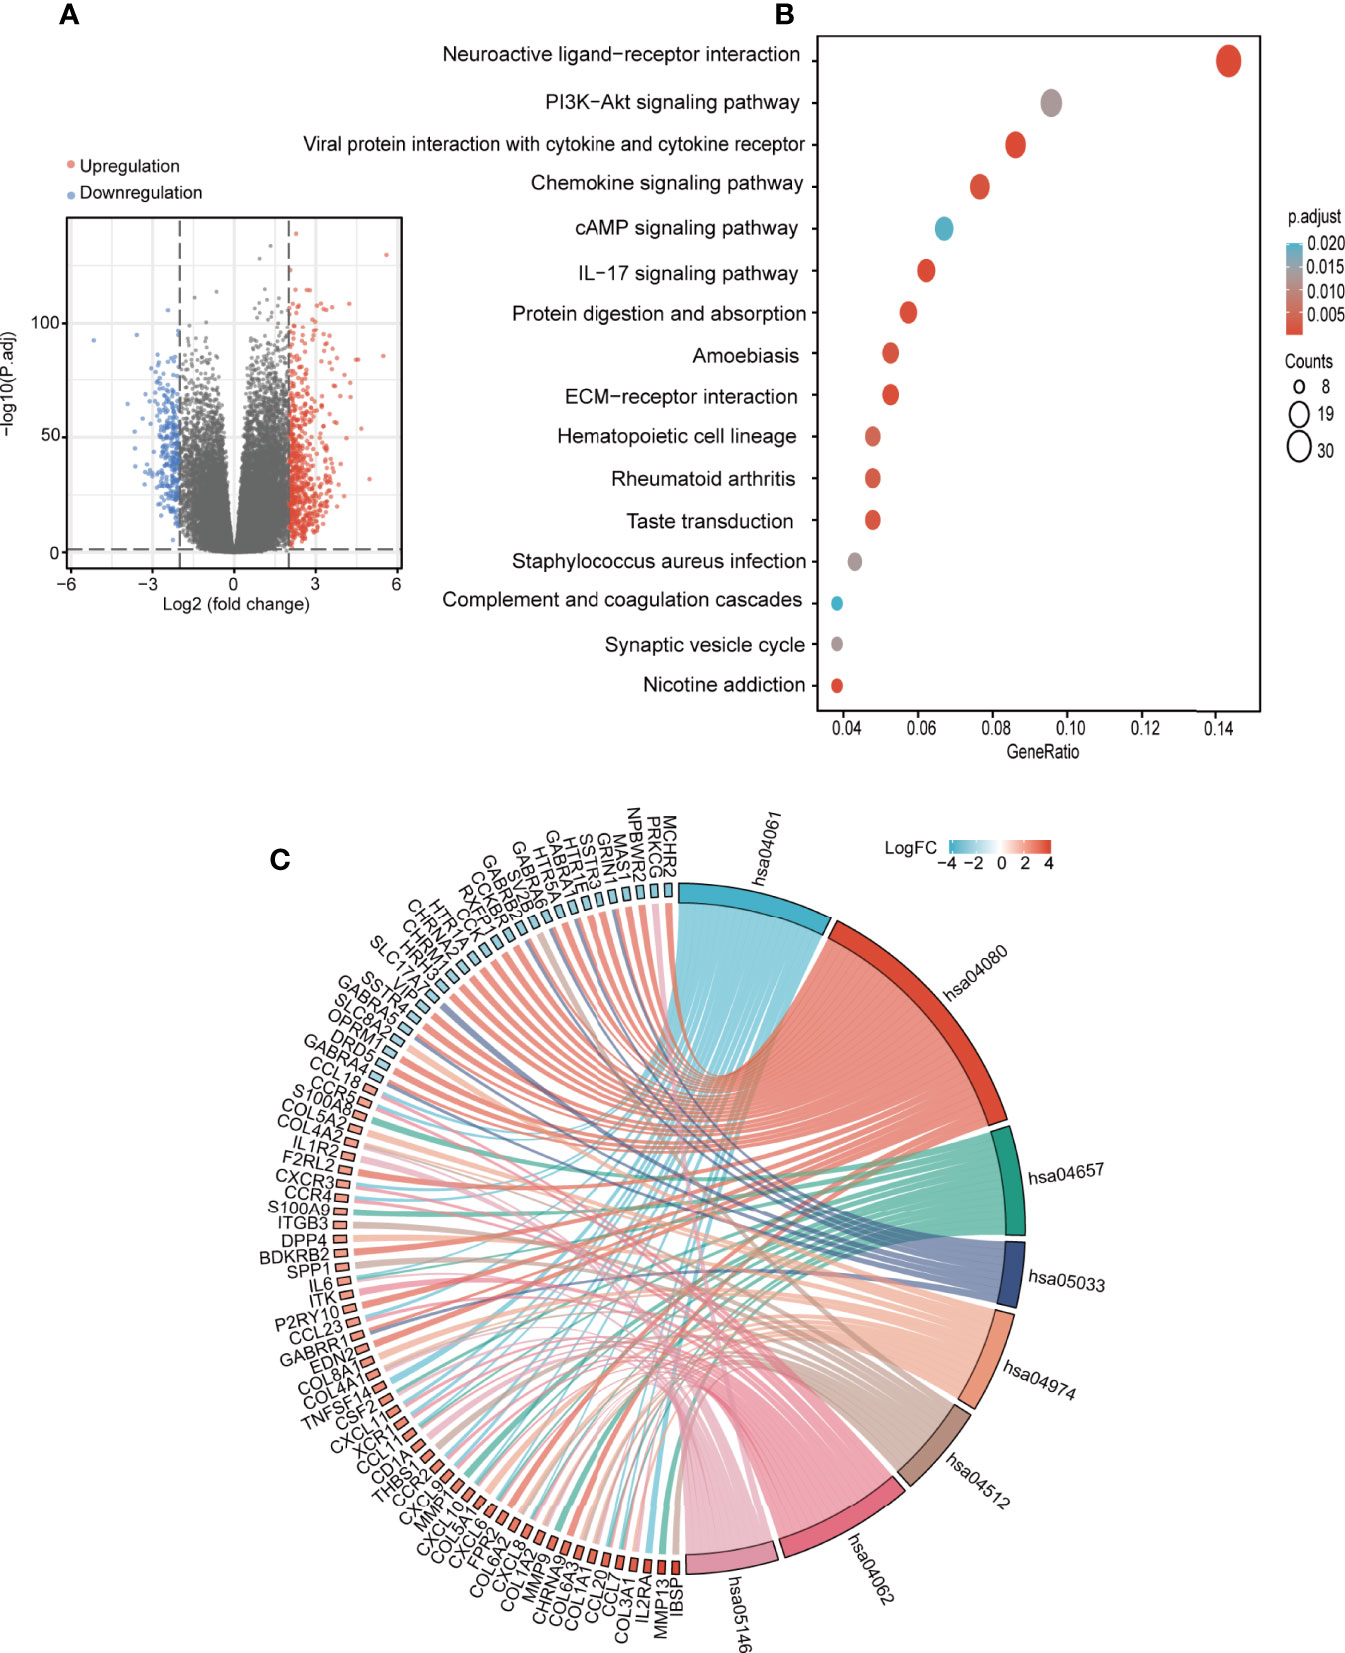
Figure 7 SOAT1 was involved in a variety of pathways and BPs in glioma. (A) Volcano plot of DEGs between the high SOAT1 and low SOAT1 expression groups based on TCGA cohort. (B) KEGG enrichment analysis of SOAT1 in glioma based on TCGA cohort. (C) Chordal graph of significantly enriched pathways and BPs of SOAT1 in glioma as shown by KEGG analysis based on TCGA cohort. hsa04080, neuroactive ligand-receptor interaction; hsa04061, viral protein interaction with cytokine and cytokine receptor; hsa04657, IL-17 signaling pathway; hsa05033, nicotine addiction; hsa04974, protein digestion and absorption; hsa04512, ECM-receptor interaction; hsa04062, chemokine signaling pathway; hsa05146, amoebiasis. SOAT1, sterol O-acyltransferase 1; DEGs, differentially expressed genes; TCGA, The Cancer Genome Atlas; KEGG, Kyoto Encyclopedia of Genes and Genomes; BPs, biological processes.
A PPI network was constructed using the STRING website and the 50 identified SOAT1-binding proteins (Figure 8A). Subsequently, a co-expression analysis of SOAT1 in glioma was performed using Pearson’s correlation coefficient, and the results showed that 1287 genes were positively correlated, and 24 genes were negatively correlated with SOAT1 expression in glioma under the screening threshold (adjusted P<0.05 and |Pearson’s correlation coefficient|>0.6). In addition, the top 5 positively correlated genes were MOB kinase activator 1A (MOB1A), CKLF like MARVEL transmembrane domain containing 6 (CMTM6), major facilitator superfamily domain containing 1 (MFSD1), LHFPL tetraspan subfamily member 2 (LHFPL2), and LIM and senescent cell antigen-like-containing (LIMS1), and the top 5 negatively correlated genes were mitochondrially encoded 12S RRNA (MT-RNR1), mitochondrially encoded 16S RRNA (MT-RNR2), mitochondrially encoded cytochrome C oxidase II (MT-CO2), Rho GDP dissociation inhibitor gamma (ARHGDIG), and RUN domain containing 3A (RUNDC3A) (Figure 8B).
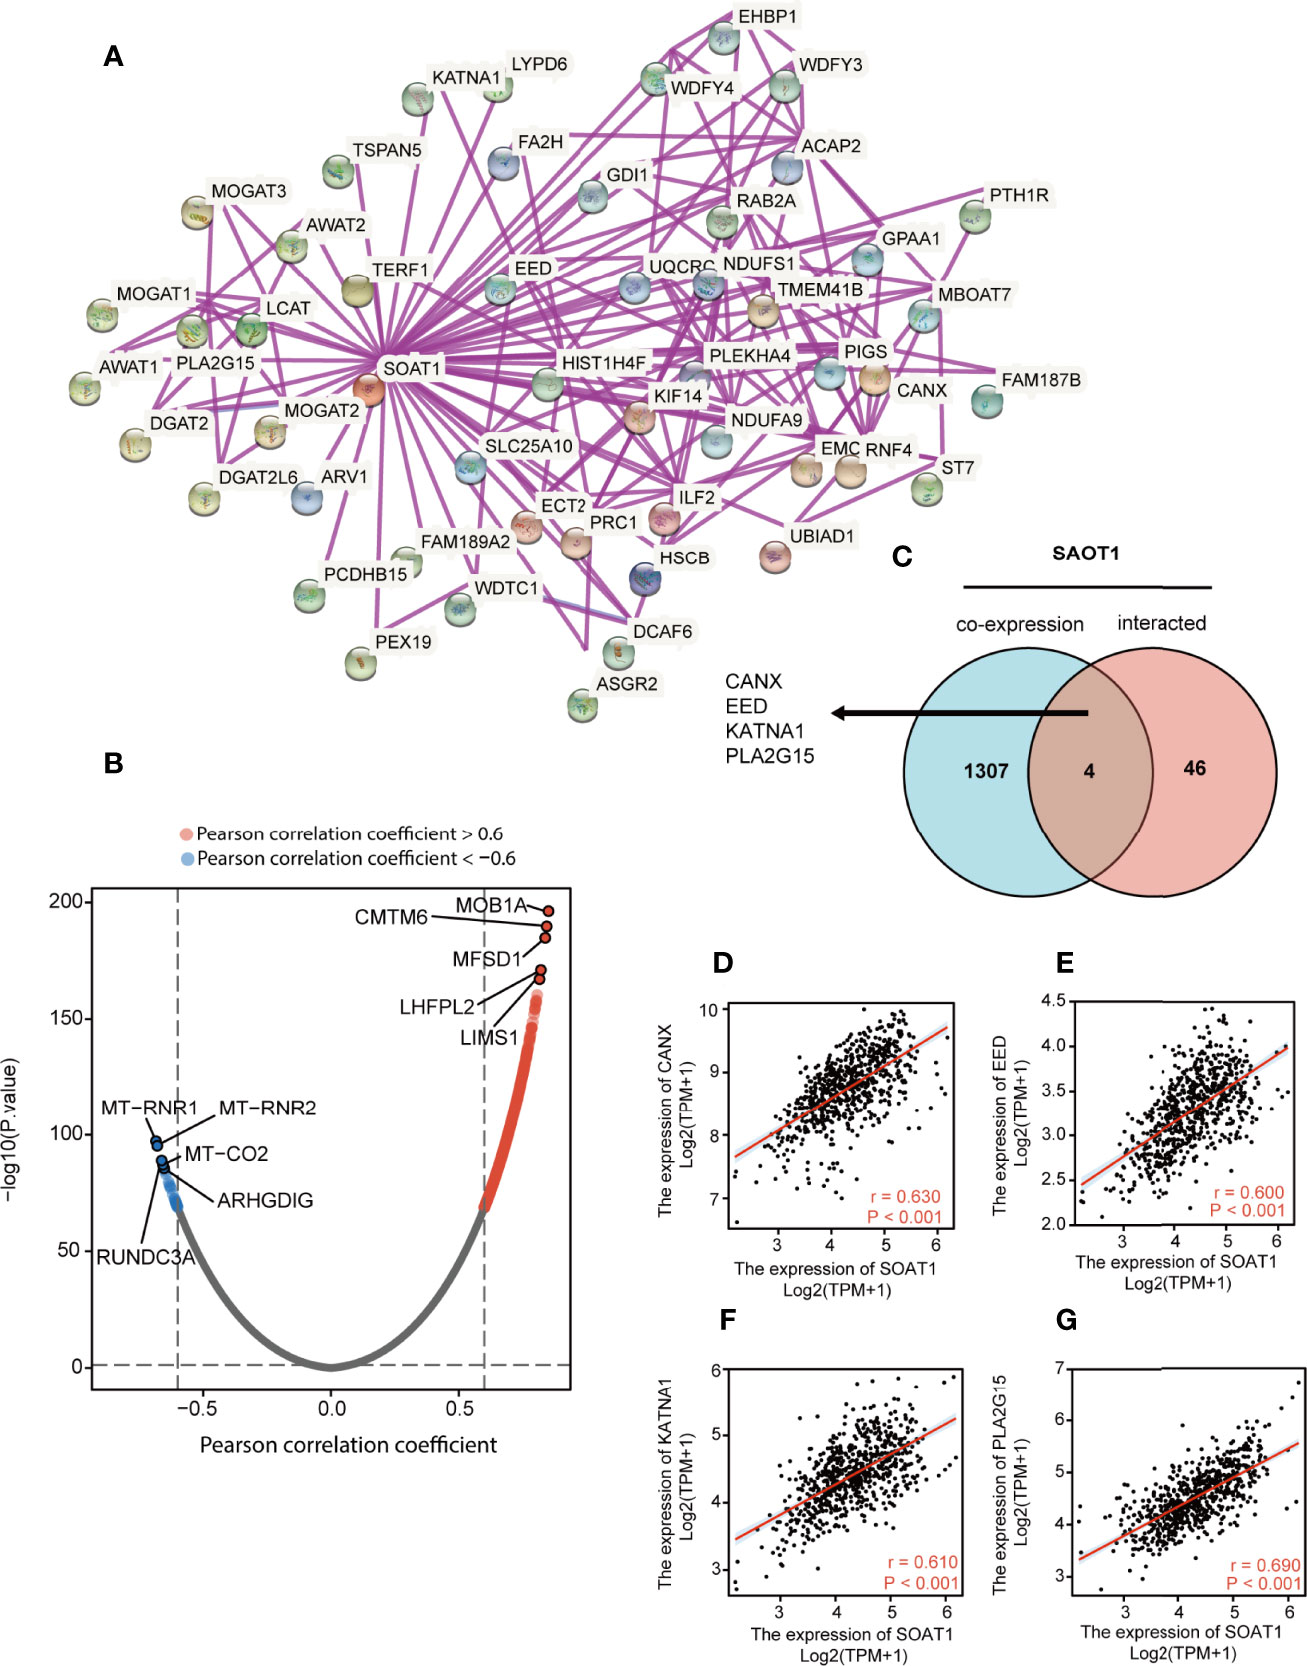
Figure 8 PPI network and co-expression analysis of SOAT1 in glioma. (A) A PPI network of SOAT1 was constructed using the STRING website. (B) Co-expression analysis of SOAT1 in glioma based on the TCGA cohort (C) An intersection analysis of SOAT1 co-expression analysis and PPI network was performed by Venn diagram. (D–G) Pearson’s correlation coefficient of CANX, EED, KATNA1, and PLA2G15 with SOAT1 expression in glioma, respectively. PPI, protein-protein interaction; CANX, calnexin; EED, embryonic ectoderm development; KATNA1, katanin catalytic subunit A1; PLA2G15, phospholipase A2 group XV; STRING, Search Tool for the Retrieval of Interacting Genes/Proteins; TCGA, The Cancer Genome Atlas; SOAT1, sterol O-acyltransferase 1.
The Venn diagram showed that 4 genes were shared between the PPI network and the co-expression analysis: Calnexin (CANX), embryonic ectoderm development (EED), katanin catalytic subunit A1 (KATNA1), and phospholipase A2 group XV (PLA2G15) (Figure 8C). The correlations between SOAT1 expression in glioma were demonstrated in Figures 8D–G. CANX is a calcium-binding, endoplasmic reticulum-associated protein that interacts transiently with newly synthesized N-linked glycoproteins, facilitating protein folding and assembly. The interaction between SOAT1 and CANX was detected by co-sedimentation via a density gradient assay (38). Embryonic ectoderm development encodes a member of the polycomb-group (PcG) family. PcG family members form multimeric protein complexes, which are involved in maintaining the transcriptional repressive state of genes over successive cell generations, and the interaction between SOAT1 and CANX was detected by affinity chromatography technology assay (39). KATNA1 is the catalytic subunit of a complex which severs microtubules in an ATP-dependent manner. The interaction between SOAT1 and KATNA1 was detected using an anti-tag coimmunoprecipitation assay (https://www.ebi.ac.uk/). PLA2G15 encodes the protein that hydrolyzes lysophosphatidylcholine to glycerophosphorylcholine and a free fatty acid. The interaction between SOAT1 and PLA2G15 was detected by genetic interference assay (40). In combination, these genes may play a significant role in the regulatory mechanism of SOAT1 in gliomas.
SOAT1 was found to be overexpressed in glioma, compared to normal brain tissue, which was consistent with the report by Geng et al. In addition, it was found that the high SOAT1 expression was associated with malignant pathological characteristics in glioma, indicating that lipid metabolism was linked to glioma heterogeneity and excessive lipid metabolism indicated a malignant subtype. Geng et al. also found that LDs were correlated with poor survival in patients with GBM. Therefore, the prognostic value of SOAT1 in glioma was comprehensively explored. Not surprisingly, SOAT1 expression was associated with poor prognosis in all gliomas taken together but it has no prognostic significance in individual glioma type and grade. Our evidence showed the SOAT1 higher expression in higher grade and astrocytoma phenotype may explain the association of SOAT1 with poor prognosis in glioma.
Numerous studies have shown that decreased Treg infiltration reflects an attenuated immunosuppression microenvironment and was correlated with favorable prognosis (34, 41–43). However, the clinical prognostic value of FoxP3+ Tregs in glioma remains controversial. Studies have shown that Treg infiltration predicted a poor prognosis in glioma (44, 45), while others found there was no correlation between Tregs and glioma prognosis (33, 46). In addition, FoxP3+ Tregs are most frequently found in GBM and very rarely found in low-grade astrocytomas and oligodendroglial tumors (33, 47). The present study came to similar conclusions; however, some FoxP3+ Treg infiltration was still observed in grade 3 gliomas and oligodendroglial tumors. Furthermore, we also found that correlation between SOAT1 expression and Treg infiltration was not strong in glioma. Since it is a small cohort of 55 cases with different tumors of different grades, definite conclusions cannot be drawn based on the limited data. A larger cohort may be required to conclusively prove FoxP3 association with SOAT1 expression.
In addition to Tregs, multiple immune cell infiltration and chemokines/chemokine receptors were found to be positively correlated with SOAT1 expression in glioma, such as macrophages, CCL16, and CCL20. In fact, increasing evidence shows that there is a strong connection between the tumor metabolic microenvironment and the immune microenvironment. Farnesyl diphosphate synthase (FDPS) is a key enzyme in isoprenoid biosynthesis. Chen et al. found that FDPS promoted glioma proliferation and macrophage recruitment by regulating CCL20 via the Wnt/β-catenin signaling pathway (48). The unsaturated fatty acid 20-hydroxyeicosatetraenoic acid, a catalytic product of cytochrome P450 4A (CYP4A), along with VEGF and TGF-β, promoted angiogenesis by enhancing the migration of glioma-associated macrophages (GAMs), and inhibition of CYP4A prolonged survival and normalized tumor vasculature in glioma (49). A recent study found that extracellular lipid-loading promoted GAM infiltration and neovascularization in tumors, an effect that was augmented by an elevated, continuous supply of systemic lipids (50). This is direct evidence that LD+ GBM cells are associated with the infiltration of immune-suppressive phenotype GAMs. Since LD is formed by the aggregation of CEs, it is not surprising that the expression of SOAT1 is associated with M2 macrophage infiltration in glioma. The above studies demonstrated that lipid metabolic reprogramming contributes toward an immune-suppressive phenotype in glioma.
Studies have found that SOAT1 acts an oncogene through multiple pathways. The downregulation of SOAT1 has been found to suppress the proliferation and migration of hepatocellular carcinoma cells by reducing the cholesterol content of the plasma membrane, and then inhibiting the integrin and TGF-β signaling pathways (51). Similarly, integrin binding was also significantly enriched (adjusted P=0.021), as shown by the GO and KEGG analyses of upregulated DEGs in glioma (Supplementary Table S3). SOAT1 inhibition can inhibit pancreatic ductal adenocarcinoma (PDAC) progression by activating cholesterol-mediated negative feedback of the mevalonate pathway (13). Xu et al. demonstrated that SOAT1 inhibition upregulated Wnt/PCP-YAP signaling by elevating cellular cholesterol in colon cancer. Nystatin, an inhibitor of cholesterol, synergizes with targeting SOAT1 in suppressing the viability of colon cancer cells (52). In addition, CE was found to activate the AKT/mTOR pathway and promotes tumor growth in breast cancer (53).
CMTM6 is a membrane protein that co-localizes with the immune checkpoint molecule PD-L1 on the cell membrane to protect PD-L1 from degradation, thereby promoting tumor immune escape. Domschke et al. found that silencing CMTM6 reduced macrophage LDL-uptake (54), suggesting that CMTM6 was involved in the regulation of cholesterol metabolism. Consistently, our analysis showed that CMTM6 expression was strongly correlated with SOAT1 expression in glioma, further evidence revealing the connection between metabolic remodeling and tumor immune escape. LIMS1 is an adaptor protein that contains five LIM domains and is likely involved in integrin signaling. Huang et al. demonstrated that LIMS1 promoted pancreatic cancer cell survival under oxygen-glucose deprivation conditions by activating AKT/mTOR signaling and enhancing HIF1A protein translation (55). The present study showed that LIMS1 was strongly correlated with SOAT1 expression and may also exert the same function by regulating lipid metabolism. In addition, SOAT1 was found to be expressed under diverse regulatory mechanisms in tumors. Runt-related transcription factor 1 promoted the expression of SOAT1 by binding to the promoter region of SOAT1 in squamous cell carcinomas (56). The p53 loss of heterozygosity can promote SOAT1 expression by enhancing the transcription of SOAT1 in PDAC (13). Furthermore, β-catenin can directly bind to SOAT1 promoter element, promoting SOAT1 transcription in colorectal cancer (57).
In the present study, the prognostic value of SOAT1 in glioma and its association with immune cell infiltration was elucidated. In addition, various BPs and signaling pathways that SOAT1 may be involved in during glioma pathogenesis were explored. Finally, multiple genes that may interact with SOAT1 in gliomas were identified via PPI network and co-expression analyses. Therefore, SOAT1 may serve as a novel target that drives the development of novel strategies of immunotherapy and metabolic therapy.
The datasets presented in this study can be found in online repositories. The names of the repository/repositories and accession number(s) can be found in the article/Supplementary Material.
The studies involving human participants were reviewed and approved by Ethics Committee of the Fifth Affiliated Hospital of Zhengzhou University. Written informed consent for participation was not required for this study in accordance with the national legislation and the institutional requirements.
XG participated in the research design and experimental implementation, statistical analysis, and article writing. SZ and ZY provided guidance, funding support, and help to obtain materials for the study. WH, LD, and Z-AL participated in the collection of clinical data. WL provided guidance for the study. XW provided guidance on research design, as well as technical, material, and financial support for the study. All authors agree to be accountable for the content of the work. All authors read and approved the final manuscript.
This study was supported by the National Natural Science Foundation of China: 81972361, 81874068. and the Henan Province Science and Technology Research Project: 222102310039.
The authors declare that the research was conducted in the absence of any commercial or financial relationships that could be construed as a potential conflict of interest.
All claims expressed in this article are solely those of the authors and do not necessarily represent those of their affiliated organizations, or those of the publisher, the editors and the reviewers. Any product that may be evaluated in this article, or claim that may be made by its manufacturer, is not guaranteed or endorsed by the publisher.
Thanks to the Fifth Affiliated Hospital of Zhengzhou University.
The Supplementary Material for this article can be found online at: https://www.frontiersin.org/articles/10.3389/fonc.2022.896433/full#supplementary-material
Supplementary Figure 1 | (A–S) Correlation between SOAT1 expression and immune infiltrating cells in GBM based on TISIDB dataset. SOAT1, sterol O-acyltransferase 1; GBM, glioblastoma; TISIDB, an integrated repository portal for tumor-immune system interactions.
Supplementary Figure 2 | (A–R) Correlation between SOAT1 expression and immune infiltrating cells in LGG based on TISIDB dataset. SOAT1, sterol O-acyltransferase 1; LGG, lower grade glioma; TISIDB, an integrated repository portal for tumor-immune system interactions.
Supplementary Figure 3 | (A) GO enrichment analysis of SOAT1 in glioma based on the TCGA cohort. (B) Chordal graph of significantly enriched BP of SOAT1 in glioma by GO analysis based on TCGA cohort. GO:0006958 complement activation, classical pathway. GO:0002455 humoral immune response mediated by circulating immunoglobulin. GO:0006956 complement activation. GO:0006959 humoral immune response. GO, Gene Ontology; SOAT1, sterol O-acyltransferase 1; TCGA, The Cancer Genome Atlas; BP, biological processes.
Supplementary Figure 4 | (A) Chordal graph of significantly enriched MF and CC of SOAT1 in glioma by GO analysis based on TCGA cohort. GO:0019814 immunoglobulin complex, GO:0042571 immunoglobulin complex circulating, GO:0003823 antigen binding, GO:0034987 immunoglobulin receptor binding. MF, molecular functions; CC, cellular component; SOAT1, sterol O-acyltransferase 1; GO, Gene Ontology; TCGA, The Cancer Genome Atlas.
Supplementary Figure 5 | (A–F) K-M curves of each type of glioma based on WHO 2021 classification of brain tumors in the TCGA cohort. K-M, Kaplan-Meier; WHO, World Health Organization; TCGA, The Cancer Genome Atlas.
1. Ostrom QT, Patil N, Cioffi G, Waite K, Kruchko C, Barnholtz-Sloan JS. CBTRUS Statistical Report: Primary Brain and Other Central Nervous System Tumors Diagnosed in the United States in 2013–2017. Neuro Oncol (2020) 22(12 Suppl 2):iv1–iv96. doi: 10.1093/neuonc/noaa200
2. Ribas A, Wolchok JD. Cancer Immunotherapy Using Checkpoint Blockade. Science (2018) 359(6382):1350–5. doi: 10.1126/science.aar4060
3. Filley AC, Henriquez M, Dey M. Recurrent Glioma Clinical Trial, CheckMate-143: The Game Is Not Over Yet. Oncotarget (2017) 8(53):91779–94. doi: 10.18632/oncotarget.21586
4. Schalper KA, Rodriguez-Ruiz ME, Diez-Valle R, López-Janeiro A, Porciuncula A, Idoate MA, et al. Neoadjuvant Nivolumab Modifies the Tumor Immune Microenvironment in Resectable Glioblastoma. Nat Med (2019) 25(3):470–6. doi: 10.1038/s41591-018-0339-5
5. Zaidi N, Jaffee EM. Immune Cells Track Hard-to-Target Brain Tumours. Nature (2019) 565(7738):170–1. doi: 10.1038/d41586-018-07728-9
6. O'Rourke DM, Nasrallah MP, Desai A, Melenhorst JJ, Mansfield K, Morrissette JJD, et al. A Single Dose of Peripherally Infused EGFRvIII-Directed CAR T Cells Mediates Antigen Loss and Induces Adaptive Resistance in Patients With Recurrent Glioblastoma. Sci Transl Med (2017) 9(399):1–15. doi: 10.1126/scitranslmed.aaa0984
7. Jackson CM, Choi J, Lim M. Mechanisms of Immunotherapy Resistance: Lessons From Glioblastoma. Nat Immunol (2019) 20(9):1100–9. doi: 10.1038/s41590-019-0433-y
8. Qiu R, Zhong Y, Li Q, Li Y, Fan H. Metabolic Remodeling in Glioma Immune Microenvironment: Intercellular Interactions Distinct From Peripheral Tumors. Front Cell Dev Biol (2021) 9:693215. doi: 10.3389/fcell.2021.693215
9. Wegiel B, Vuerich M, Daneshmandi S, Seth P. Metabolic Switch in the Tumor Microenvironment Determines Immune Responses to Anti-Cancer Therapy. Front Oncol (2018) 8:284. doi: 10.3389/fonc.2018.00284
10. Chang CC, Noll WW, Nutile-McMenemy N, Lindsay EA, Baldini A, Chang W, et al. Localization of Acyl Coenzyme A:cholesterol Acyltransferase Gene to Human Chromosome 1q25. Somatic Cell Mol Genet (1994) 20(1):71–4. doi: 10.1007/BF02257489
11. Cadigan KM, Heider JG, Chang TY. Isolation and Characterization of Chinese Hamster Ovary Cell Mutants Deficient in Acyl-Coenzyme A:cholesterol Acyltransferase Activity. J Biol Chem (1988) 263(1):274–82. doi: 10.1016/S0021-9258(19)57389-6
12. Cairns RA, Harris IS, Mak TW. Regulation of Cancer Cell Metabolism. Nat Rev Cancer (2011) 11(2):85–95. doi: 10.1038/nrc2981
13. Oni TE, Biffi G, Baker LA, Hao Y, Tonelli C, Somerville TDD, et al. SOAT1 Promotes Mevalonate Pathway Dependency in Pancreatic Cancer. J Exp Med (2020) 217(9):1–19. doi: 10.1084/jem.20192389
14. Geng F, Cheng X, Wu X, Yoo JY, Cheng C, Guo JY, et al. Inhibition of SOAT1 Suppresses Glioblastoma Growth via Blocking SREBP-1-Mediated Lipogenesis. Clin Cancer Res (2016) 22(21):5337–48. doi: 10.1158/1078-0432.CCR-15-2973
15. Liu Y, Wang Y, Hao S, Qin Y, Wu Y. Knockdown of Sterol O-Acyltransferase 1 (SOAT1) Suppresses SCD1-Mediated Lipogenesis and Cancer Procession in Prostate Cancer. Prostaglandins Other Lipid Mediators (2021) 153:106537. doi: 10.1016/j.prostaglandins.2021.106537
16. Mo Y, Lin L, Zhang J, Yu C. SOAT1 Enhances Lung Cancer Invasiveness by Stimulating AKT-Mediated Mitochondrial Fragmentation. Biochem Cell Biol = Biochimie Biologie Cellulaire (2022) 100(1):68–74. doi: 10.1139/bcb-2021-0175
17. Sbiera S, Leich E, Liebisch G, Sbiera I, Schirbel A, Wiemer L, et al. Mitotane Inhibits Sterol-O-Acyl Transferase 1 Triggering Lipid-Mediated Endoplasmic Reticulum Stress and Apoptosis in Adrenocortical Carcinoma Cells. Endocrinology (2015) 156(11):3895–908. doi: 10.1210/en.2015-1367
18. Bindea G, Mlecnik B, Tosolini M, Kirilovsky A, Waldner M, Obenauf AC, et al. Spatiotemporal Dynamics of Intratumoral Immune Cells Reveal the Immune Landscape in Human Cancer. Immunity (2013) 39(4):782–95. doi: 10.1016/j.immuni.2013.10.003
19. Hänzelmann S, Castelo R, Guinney J. GSVA: Gene Set Variation Analysis for Microarray and RNA-Seq Data. BMC Bioinf (2013) 14:7. doi: 10.1186/1471-2105-14-7
20. Yu G, Wang LG, Han Y, He QY. Clusterprofiler: An R Package for Comparing Biological Themes Among Gene Clusters. Omics J Integr Biol (2012) 16(5):284–7. doi: 10.1089/omi.2011.0118
21. Louis DN, Perry A, Wesseling P, Brat DJ, Cree IA, Figarella-Branger D, et al. The 2021 WHO Classification of Tumors of the Central Nervous System: A Summary. Neuro Oncol (2021) 23(8):1231–51. doi: 10.1093/neuonc/noab106
22. Everson RG, Antonios JP, Liau LM. Cell-Based Immunotherapy of Gliomas. Prog Neurological Surg (2018) 32:90–100. doi: 10.1159/000469683
23. Xiao Y, Zhang T, Ma X, Yang QC, Yang LL, Yang SC, et al. Microenvironment-Responsive Prodrug-Induced Pyroptosis Boosts Cancer Immunotherapy. Advanced Sci (Weinheim Baden Wurttemberg Germany) (2021) 8(24):e2101840. doi: 10.1002/advs.202101840
24. Lv S, Song K, Yen A, Peeler DJ, Nguyen DC, Olshefsky A, et al. Well-Defined Mannosylated Polymer for Peptide Vaccine Delivery With Enhanced Antitumor Immunity. Advanced Healthc Mater (2021) 2101651:e2101651. doi: 10.1002/adhm.202101651
25. Nguyen NT, Huang K, Zeng H, Jing J, Wang R, Fang S, et al. Nano-Optogenetic Engineering of CAR T Cells for Precision Immunotherapy With Enhanced Safety. Nat Nanotechnol (2021) 16(12):1424–34. doi: 10.1038/s41565-021-00982-5
26. Chen X, LeCompte MC, Kleinberg LR, Hales RK, Voong KR, Forde P, et al. Immune Checkpoint Inhibitors Improve Survival and Local Control in Patients With Spine Metastasis After Stereotactic Body Radiotherapy. Int J Radiat Oncol Biol Phys (2021) 111(3s):e604–e5. doi: 10.1016/j.ijrobp.2021.07.1613
27. Ono M, Yaguchi H, Ohkura N, Kitabayashi I, Nagamura Y, Nomura T, et al. Foxp3 Controls Regulatory T-Cell Function by Interacting With AML1/Runx1. Nature (2007) 446(7136):685–9. doi: 10.1038/nature05673
28. Hori S, Nomura T, Sakaguchi S. Control of Regulatory T Cell Development by the Transcription Factor Foxp3. Science (2003) 299(5609):1057–61. doi: 10.1126/science.1079490
29. Fontenot JD, Gavin MA, Rudensky AY. Pillars Article: Foxp3 Programs the Development and Function of CD4+CD25+ Regulatory T Cells. Nat Immunol (2003) 4:330–6. doi: 10.1038/ni904
30. Fu W, Ergun A, Lu T, Hill JA, Haxhinasto S, Fassett MS, et al. A Multiply Redundant Genetic Switch 'Locks In' the Transcriptional Signature of Regulatory T Cells. Nat Immunol (2012) 13(10):972–80. doi: 10.1038/ni.2420
31. Rudra D, deRoos P, Chaudhry A, Niec RE, Arvey A, Samstein RM, et al. Transcription Factor Foxp3 and its Protein Partners Form a Complex Regulatory Network. Nat Immunol (2012) 13(10):1010–9. doi: 10.1038/ni.2402
32. Wang X, Cheng H, Shen Y, Li B. Metabolic Choice Tunes Foxp3+ Regulatory T Cell Function. Adv Exp Med Biol (2021) 1278:81–94. doi: 10.1007/978-981-15-6407-9_5
33. Heimberger AB, Abou-Ghazal M, Reina-Ortiz C, Yang DS, Sun W, Qiao W, et al. Incidence and Prognostic Impact of FoxP3+ Regulatory T Cells in Human Gliomas. Clin Cancer Res (2008) 14(16):5166–72. doi: 10.1158/1078-0432.CCR-08-0320
34. Chang AL, Miska J, Wainwright DA, Dey M, Rivetta CV, Yu D, et al. CCL2 Produced by the Glioma Microenvironment Is Essential for the Recruitment of Regulatory T Cells and Myeloid-Derived Suppressor Cells. Cancer Res (2016) 76(19):5671–82. doi: 10.1158/0008-5472.CAN-16-0144
35. Wang C, Li Y, Jia L, Kim JK, Li J, Deng P, et al. CD276 Expression Enables Squamous Cell Carcinoma Stem Cells to Evade Immune Surveillance. Cell Stem Cell (2021) 28(9):1597–613.e7. doi: 10.1016/j.stem.2021.04.011
36. Batash R, Asna N, Schaffer P, Francis N, Schaffer M. Glioblastoma Multiforme, Diagnosis and Treatment; Recent Literature Review. Curr Med Chem (2017) 24(27):3002–9. doi: 10.2174/0929867324666170516123206
37. Wick W, Dettmer S, Berberich A, Kessler T, Karapanagiotou-Schenkel I, Wick A, et al. N2M2 (NOA-20) Phase I/II Trial of Molecularly Matched Targeted Therapies Plus Radiotherapy in Patients With Newly Diagnosed Non-MGMT Hypermethylated Glioblastoma. Neuro Oncol (2019) 21(1):95–105. doi: 10.1093/neuonc/noy161
38. Lynes EM, Bui M, Yap MC, Benson MD, Schneider B, Ellgaard L, et al. Palmitoylated TMX and Calnexin Target to the Mitochondria-Associated Membrane. EMBO J (2012) 31(2):457–70. doi: 10.1038/emboj.2011.384
39. Cao Q, Wang X, Zhao M, Yang R, Malik R, Qiao Y, et al. The Central Role of EED in the Orchestration of Polycomb Group Complexes. Nat Commun (2014) 5:3127. doi: 10.1038/ncomms4127
40. Li D, Song JZ, Li H, Shan MH, Liang Y, Zhu J, et al. Storage Lipid Synthesis Is Necessary for Autophagy Induced by Nitrogen Starvation. FEBS Lett (2015) 589(2):269–76. doi: 10.1016/j.febslet.2014.11.050
41. Agliardi G, Liuzzi AR, Hotblack A, De Feo D, Núñez N, Stowe CL, et al. Intratumoral IL-12 Delivery Empowers CAR-T Cell Immunotherapy in a Pre-Clinical Model of Glioblastoma. Nat Commun (2021) 12(1):444. doi: 10.1038/s41467-020-20599-x
42. Long Y, Tao H, Karachi A, Grippin AJ, Jin L, Chang YE, et al. Dysregulation of Glutamate Transport Enhances Treg Function That Promotes VEGF Blockade Resistance in Glioblastoma. Cancer Res (2020) 80(3):499–509. doi: 10.1158/0008-5472.CAN-19-1577
43. Aslan K, Turco V, Blobner J, Sonner JK, Liuzzi AR, Núñez NG, et al. Heterogeneity of Response to Immune Checkpoint Blockade in Hypermutated Experimental Gliomas. Nat Commun (2020) 11(1):931. doi: 10.1038/s41467-020-14642-0
44. Jacobs JF, Idema AJ, Bol KF, Grotenhuis JA, de Vries IJ, Wesseling P, et al. Prognostic Significance and Mechanism of Treg Infiltration in Human Brain Tumors. J Neuroimmunol (2010) 225(1-2):195–9. doi: 10.1016/j.jneuroim.2010.05.020
45. Guo XY, Zhang GH, Wang ZN, Duan H, Xie T, Liang L, et al. A Novel Foxp3-Related Immune Prognostic Signature for Glioblastoma Multiforme Based on Immunogenomic Profiling. Aging (Albany NY) (2021) 13(3):3501–17. doi: 10.18632/aging.202282
46. Thomas AA, Fisher JL, Rahme GJ, Hampton TH, Baron U, Olek S, et al. Regulatory T Cells are Not a Strong Predictor of Survival for Patients With Glioblastoma. Neuro Oncol (2015) 17(6):801–9. doi: 10.1093/neuonc/nou363
47. Han S, Zhang C, Li Q, Dong J, Liu Y, Huang Y, et al. Tumour-Infiltrating CD4(+) and CD8(+) Lymphocytes as Predictors of Clinical Outcome in Glioma. Br J Cancer (2014) 110(10):2560–8. doi: 10.1038/bjc.2014.162
48. Chen Z, Chen G, Zhao H. FDPS Promotes Glioma Growth and Macrophage Recruitment by Regulating CCL20 via Wnt/β-Catenin Signalling Pathway. J Cell Mol Med (2020) 24(16):9055–66. doi: 10.1111/jcmm.15542
49. Wang C, Li Y, Chen H, Zhang J, Zhang J, Qin T, et al. Inhibition of CYP4A by a Novel Flavonoid FLA-16 Prolongs Survival and Normalizes Tumor Vasculature in Glioma. Cancer Lett (2017) 402:131–41. doi: 10.1016/j.canlet.2017.05.030
50. Offer S, Menard JA, Pérez JE, de Oliveira KG, Chandran VI, Johansson MC, et al. Extracellular Lipid Loading Augments Hypoxic Paracrine Signaling and Promotes Glioma Angiogenesis and Macrophage Infiltration. J Exp Clin Cancer Res (2019) 38(1):241. doi: 10.1186/s13046-019-1228-6
51. Jiang Y, Sun A, Zhao Y, Ying W, Sun H, Yang X, et al. Proteomics Identifies New Therapeutic Targets of Early-Stage Hepatocellular Carcinoma. Nature (2019) 567(7747):257–61. doi: 10.1038/s41586-019-0987-8
52. Xu H, Xia H, Zhou S, Tang Q, Bi F. Cholesterol Activates the Wnt/PCP-YAP Signaling in SOAT1-Targeted Treatment of Colon Cancer. Cell Death Discovery (2021) 7(1):38. doi: 10.1038/s41420-021-00421-3
53. Wei L, Lu X, Weng S, Zhu S, Chen Y. Cholesteryl Ester Promotes Mammary Tumor Growth in MMTV-PyMT Mice and Activates Akt-mTOR Pathway in Tumor Cells. Biomolecules (2021) 11(6):853–63. doi: 10.3390/biom11060853
54. Domschke G, Linden F, Pawig L, Hafner A, Akhavanpoor M, Reymann J, et al. Systematic RNA-Interference in Primary Human Monocyte-Derived Macrophages: A High-Throughput Platform to Study Foam Cell Formation. Sci Rep (2018) 8(1):10516. doi: 10.1038/s41598-018-28790-3
55. Huang C, Li Y, Li Z, Xu Y, Li N, Ge Y, et al. LIMS1 Promotes Pancreatic Cancer Cell Survival Under Oxygen-Glucose Deprivation Conditions by Enhancing HIF1A Protein Translation. Clin Cancer Res (2019) 25(13):4091–103. doi: 10.1158/1078-0432.CCR-18-3533
56. Jain P, Nattakom M, Holowka D, Wang DH, Thomas Brenna J, Ku AT, et al. Runx1 Role in Epithelial and Cancer Cell Proliferation Implicates Lipid Metabolism and Scd1 and Soat1 Activity. Stem Cells (Dayton Ohio) (2018) 36(10):1603–16. doi: 10.1002/stem.2868
Keywords: SOAT1, glioma, immune infiltration, prognosis, cholesterol metabolism
Citation: Guo X, Zhou S, Yang Z, Li Z-A, Hu W, Dai L, Liang W and Wang X (2022) Comprehensive Analysis of Sterol O-Acyltransferase 1 as a Prognostic Biomarker and Its Association With Immune Infiltration in Glioma. Front. Oncol. 12:896433. doi: 10.3389/fonc.2022.896433
Received: 15 March 2022; Accepted: 11 April 2022;
Published: 12 May 2022.
Edited by:
Weihua Zhou, University of Michigan, United StatesReviewed by:
Teng Ma, Capital Medical University, ChinaCopyright © 2022 Guo, Zhou, Yang, Li, Hu, Dai, Liang and Wang. This is an open-access article distributed under the terms of the Creative Commons Attribution License (CC BY). The use, distribution or reproduction in other forums is permitted, provided the original author(s) and the copyright owner(s) are credited and that the original publication in this journal is cited, in accordance with accepted academic practice. No use, distribution or reproduction is permitted which does not comply with these terms.
*Correspondence: Xinjun Wang, d2FuZ3hqQHp6dS5lZHUuY24=
Disclaimer: All claims expressed in this article are solely those of the authors and do not necessarily represent those of their affiliated organizations, or those of the publisher, the editors and the reviewers. Any product that may be evaluated in this article or claim that may be made by its manufacturer is not guaranteed or endorsed by the publisher.
Research integrity at Frontiers
Learn more about the work of our research integrity team to safeguard the quality of each article we publish.