 Dantong Zhu
 Fengtong Han
 Sandeep K. Agnihotri
 Ying Hu
- Harbin Institute of Technology, School of Life Science and Technology, Harbin, China
Mitochondrial metabolism and dynamics (fission and fusion) critically regulate cell survival and proliferation, and abnormalities in these pathways are implicated in both neurodegenerative disorders and cancer. Mitochondrial fission is necessary for the growth of mutant Ras-dependent tumors. Here, we investigated whether loss of PTEN-induced kinase 1 (PINK1) - a mitochondrial kinase linked to recessive familial Parkinsonism - affects the growth of oncogenic Ras-induced tumor growth in vitro and in vivo. We show that RasG12D-transformed embryonic fibroblasts (MEFs) from PINK1-deficient mice display reduced growth in soft agar and in nude mice, as well as increased necrosis and decreased cell cycle progression, compared to RasG12D-transformed MEFs derived from wildtype mice. PINK1 re-expression (overexpression) at least partially rescues these phenotypes. Neither PINK1 deletion nor PINK1 overexpression altered Ras expression levels. Intriguingly, PINK1-deficient Ras-transformed MEFs exhibited elongated mitochondria and altered DRP1 phosphorylation, a key event in regulating mitochondrial fission. Inhibition of DRP1 diminished PINK1-regulated mitochondria morphological changes and tumor growth suggesting that PINK1 deficiency primarily inhibits Ras-driven tumor growth through disturbances in mitochondrial fission and associated cell necrosis and cell cycle defects. Moreover, we substantiate the requirement of PINK1 for optimal growth of Ras-transformed cells by showing that human HCT116 colon carcinoma cells (carrying an endogenous RasG13D mutation) with CRISPR/Cas9-introduced PINK1 gene deletions also show reduced mitochondrial fission and decreased growth. Our results support the importance of mitochondrial function and dynamics in regulating the growth of Ras-dependent tumor cells and provide insight into possible mechanisms underlying the lower incidence of cancers in Parkinson’s disease and other neurodegenerative disorders.
Introduction
Most types of cancers are less common in patients with Parkinson’s disease (PD), but specific tumors may occur more frequently (1, 2) and are associated with mutations or altered expression of familial PD genes (3–5). Although several PD genes act in pathways that protect cells against oxidative stress and mitochondrial dysfunction, they can affect tumor growth in various ways, likely depending on the specific metabolic and cell signaling requirements of different tumor types. For example, DJ-1 acts similar to an oncogene (6, 7), while Parkin has characteristics of a tumor suppressor (8, 9). PINK1 is a mitochondrial kinase linked to recessive familial PD (10). PINK1 phosphorylates ubiquitin on the outer mitochondrial membrane and together with the E3 ligase Parkin promotes the selective degradation of depolarized mitochondria through mitophagy (11, 12).In addition, PINK1 phosphorylates several mitochondrial proteins to increase mitochondrial respiration and regulate mitochondrial dynamics, transport and cellular oxidative stress resistance (13–16). Several studies have linked PINK1 to cancer but its involvement in carcinogenesis is complex and context-dependent, and both pro- and anti-tumorigenic effects of PINK1 have been reported (17–24). Cancer cells undergo complex metabolic rewiring, and increasing evidence shows that many cancers depend on mitochondrial metabolism, signaling and dynamics to promote cancer progression and metastasis, maintain cancer stem cell survival, and confer drug resistance to tumor cells (25, 26). Mutations in the proto-oncogene RAS are a frequent cause for a broad spectrum of human cancers (27, 28). Mutant Ras affects mitochondrial function and dynamics in complex ways to promote cell transformation and proliferation (29–31). Because of the central role of PINK1 in mitochondrial function and dynamics, and to further explore the function of PINK1 in cancer, we studied the consequences of PINK1 loss on the growth of oncogenic Ras-driven tumors. Using SV40 large T-immortalized, K-RasG12D-transformed embryonic fibroblasts from PINK1-deficient mice and human HCT116 cells (expressing endogenous RasG13D) with CRISPR/Cas9-induced PINK1 gene knockout, we show that PINK1 deficiency reduces the growth of tumors expressing oncogenic Ras.
Results
PINK1 Deficiency Reduces Growth Rates of RasG12D-Transformed Mouse Embryonic Fibroblasts (MEFs)
To generate RasG12D-transformed cell populations of mouse embryonic fibroblasts (MEFs), we first infected primary MEFs from wild type (WT) and PINK1-deficient mice with a retrovirus expressing simian virus-40 large T antigen (SV40LT), which led to the emergence of continuously growing (immortalized) cells. Subsequently, immortalized MEFs were infected twice with a retrovirus expressing human K-RasG12D to generate RasG12D-transformed cells, which were used to derive single clones of RasG12D-transformed MEFs by limiting dilution. We selected two single clones with similar SV40LT expression levels for each genotype (Figure S1A). PINK1 WT clones 1 and 6 and PINK1-deficient clones 2 and 5 expressed comparable levels of Ras protein (Figure 1A). These four RasG12D-transformed clones were therefore selected for growth comparison in soft agar, which showed that the average colony area for PINK1-/- clones was about 5-fold smaller than that of the WT control clones (18.8% of WT). No difference in soft agar growth was observed between WT and PINK1-deficient MEFs that only expressed SV40LT (Figure 1B). We next measured soft agar growth with WT and PINK1-/- RasG12D-transformed cell populations and also generated a cell population (PINK1-/-plus huPINK1) in which human PINK1 was re-expressed in mouse PINK1-deficient RasG12D-transformed cells. Characterization of protein expression showed that Ras protein levels in PINK1-/-, WT and PINK1-/-plus huPINK1 population cells are similar (Figure 1C). We also examined the rate of glucose consumption in WT and PINK1-/- RasG12D-transformed cells, and the results showed that MEFs from PINK1-/- RasG12D-transformed had reduced uptake of glucose (Figure S1C). The average area of PINK1-deficient colonies reached only 13% of that of WT colonies (Figure 1D). Re-expression of human PINK1 after lentiviral infection substantially rescued the growth deficit, increasing the average colony area to 74% of WT (Figure 1D). We did not detect PINK1 by western blot in WT RasG12D-transformed MEFs (Figure 1E), possibly because most of PINK1 is constitutively degraded in normal cells and PINK1 only becomes stabilized upon significant mitochondrial depolarization (11, 32, 33). As expected, PINK1 was absent from PINK1-deficient RasG12D-transformed cells that were derived from MEFs of mice with a null mutation in PARK6 (34). In contrast, both 62 kDa and 52 kDa PINK1 species were readily detected in PINK1-/-plus huPINK1 cells (Figure 1E), suggesting that human PINK1 was imported to the inner mitochondrial membrane and cleaved by PARL, but that lentiviral over-expression of PINK1 may have saturated its mitochondrial import/cleavage and proteasomal degradation (32, 33).
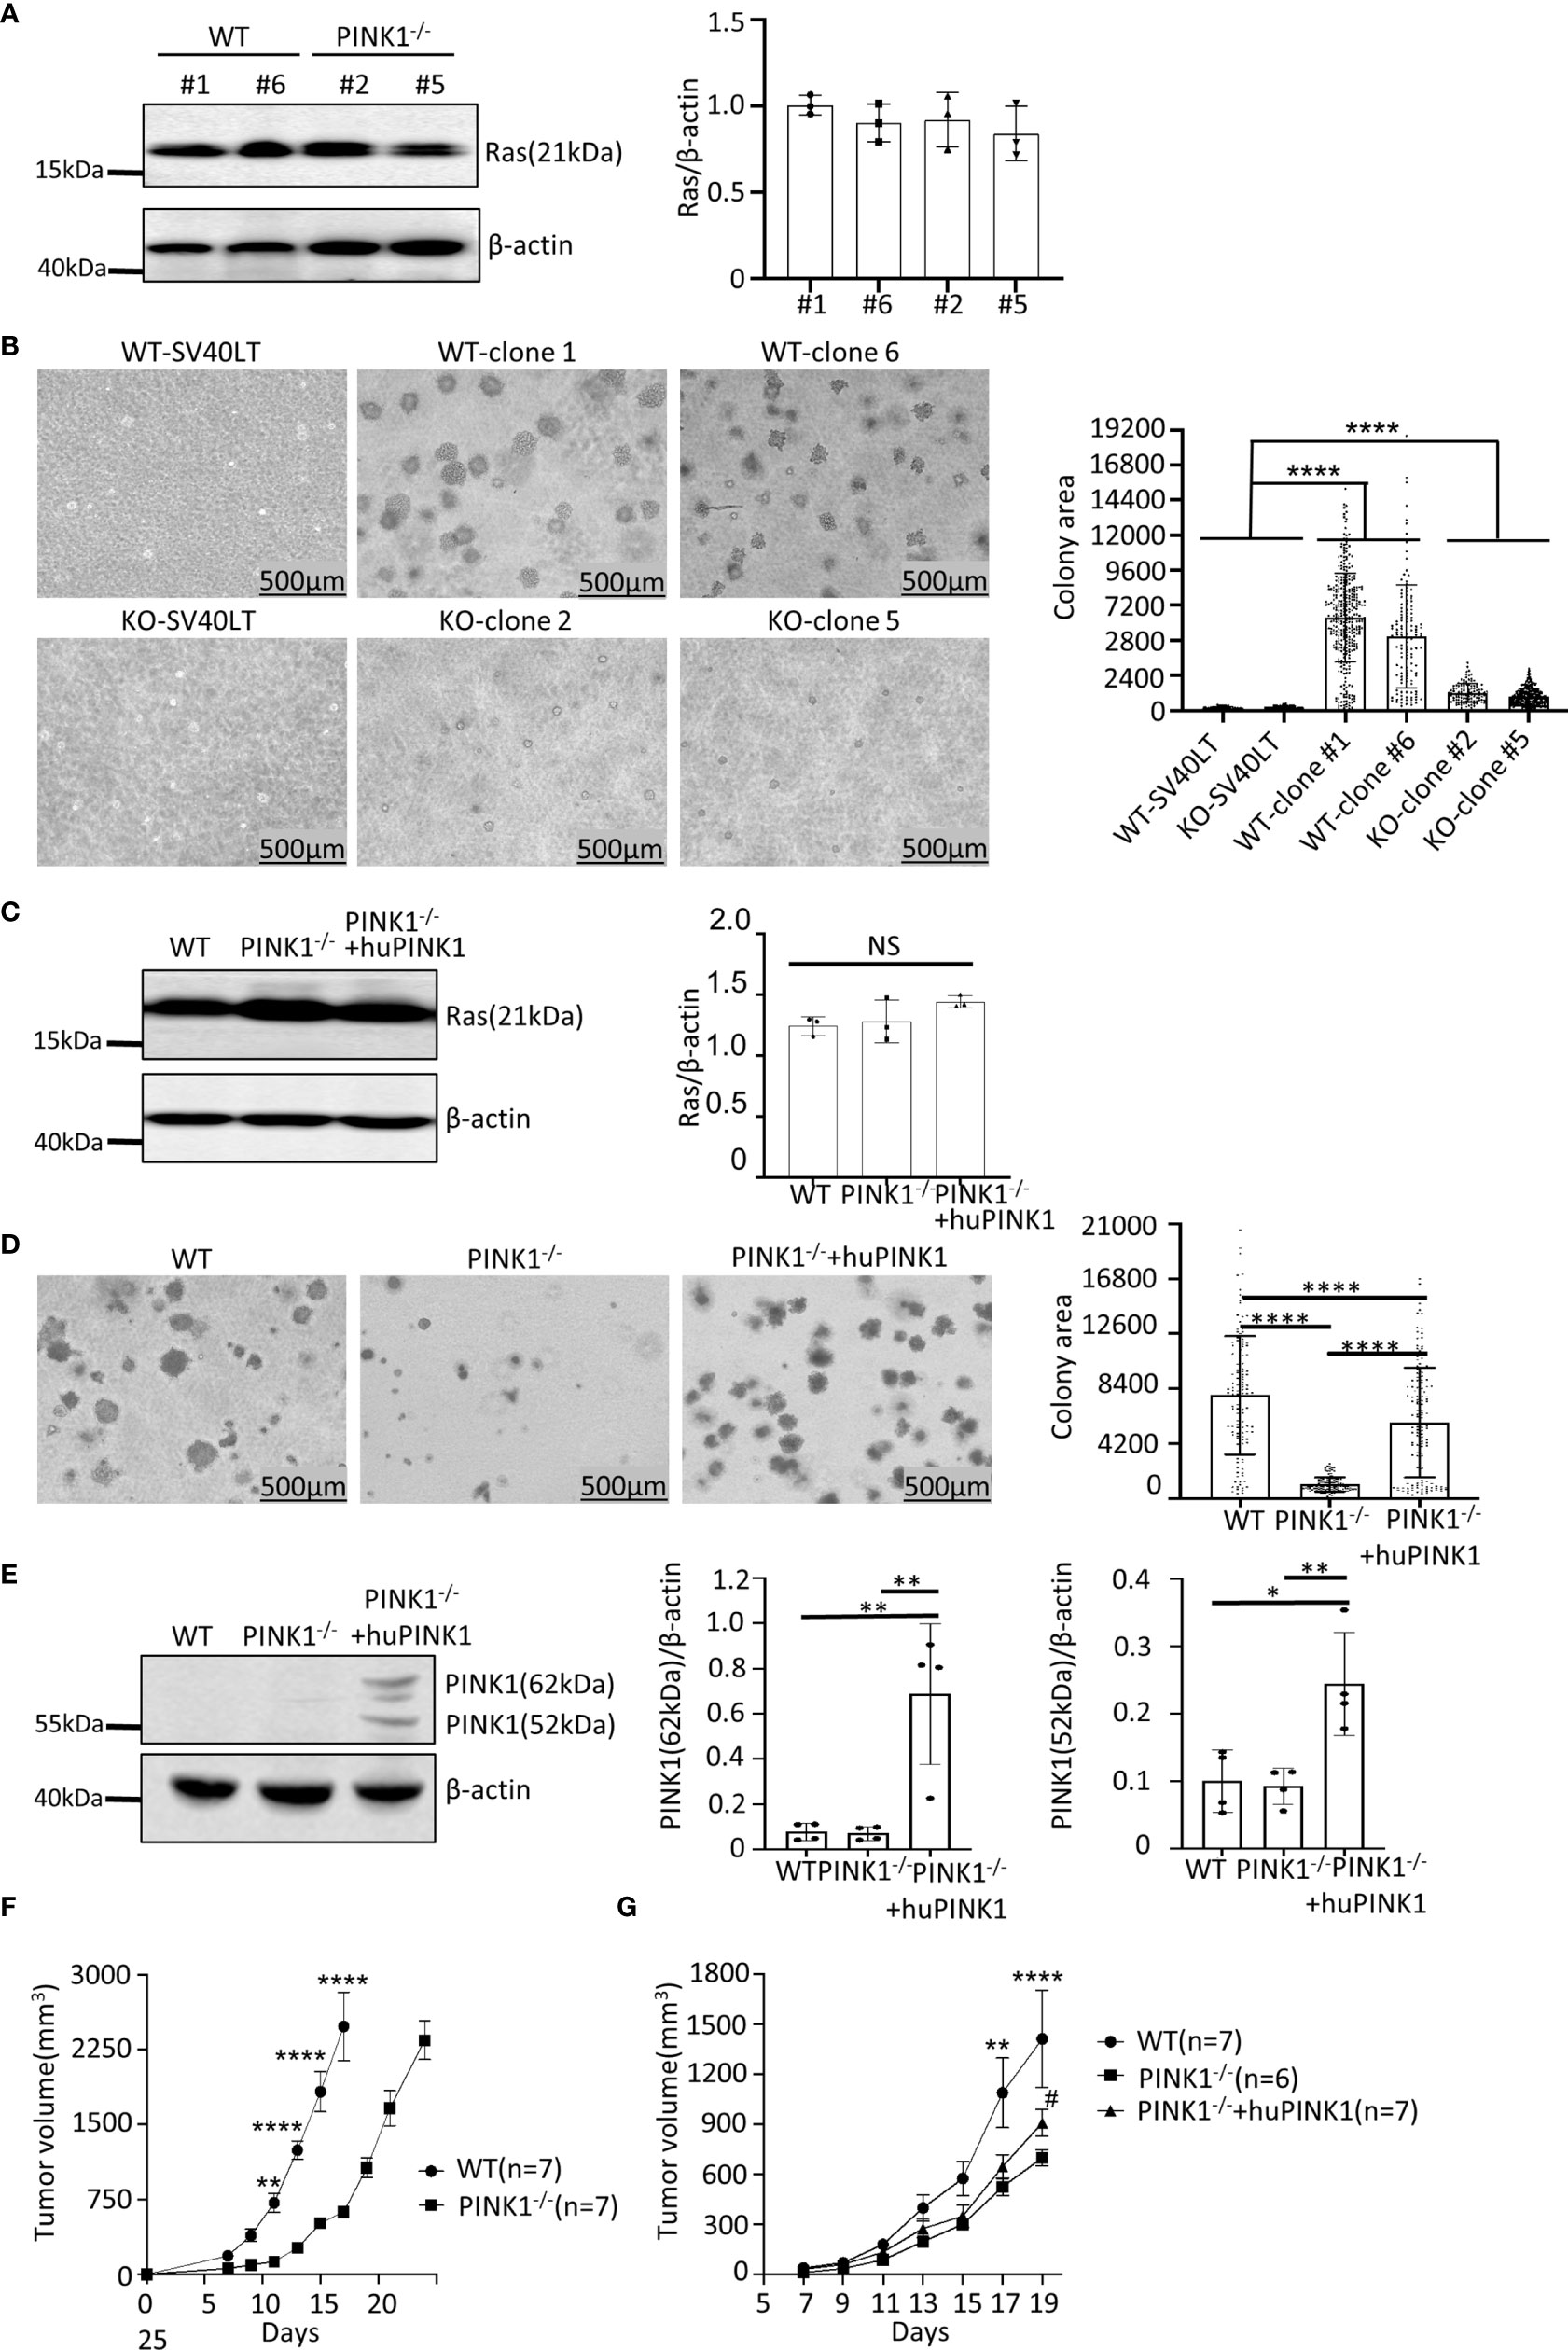
Figure 1 PINK1 deficiency reduces growth of RasG12D-transformed mouse embryonic fibroblasts (MEFs). (A) Ras protein expression by western blot with lysates of WT tumor clones 1 and 6 and PINK1-/- tumor clones 2 and 5. (B) Image J-measured area of soft agar colonies (mean ± SD, ****p < 0.0001) formed by WT clones 1 and 6, PINK1-/- clones 2 and 5, and immortalized WT and PINK1-/- MEFs that only express SV40LT. Numbers (n) of colonies measured: WT clone 1 = 350; WT clone 6 = 132; PINK1-/- clone 2 = 115; PINK1-/- clone 5 = 292; WT-SV40LT= 106; PINK1-/–SV40LT = 305. (C) Ras expression in RasG12D-transformed cells populations (n=3 independent protein isolations and western blots). (D) Colony area for RasG12D-transformed cells populations (mean ± SD, ****p < 0.0001). Number (n) of analyzed colonies: WT = 128; PINK1-/- = 134; PINK1-/- + huPINK1 = 149). Representative images of colonies are shown. (E) PINK1 expression in RasG12D-transformed cells populations (n = 4 independent protein isolations and western blots. 62 kDa (full-length) PINK1 and the 52 kDa PINK1 isoform (product of cleavage by PARL at the inner mitochondrial membrane) are indicated. 62 kDa PINK1: **p = 0.003; 52 kDa PINK1: *p = 0.01; **p = 0.008. (F) Tumor volume in nude mice (mean ± SEM, n = 7 mice per genotype/cell population) in experiment terminated on day 17 for WT tumors (due to tumor burden) and on day 24 for PINK1-/- tumors. (G) Tumor volume in nude mice (mean ± SEM, n=6-7 mice per genotype/cell population) in experiment terminated on day 19. Stars indicate days with significantly different volumes between WT and PINK1-/- tumors (**p < 0.01, ****p < 0.0001). The # symbol indicates significant different volumes of tumors between PINK1-/- and huPINK1 (p < 0.05). NS, not significant.
PINK1 Deficiency Impairs Tumor Growth of RasG12D-Transformed MEFs in Nude Mice
In nude mice, we injected the same number of MEFs from these two different genotypes (PINK1-/- RasG12D and PINK1+/+ RasG12D). The tumor formation of PINK1-/- cells was significantly reduced when compared with PINK1+/+ cells in nude mice. PINK1-/- tumors showed a trend of slower growth at each measurement, and the WT tumors were on average 4.6-fold larger (range: 3.6-5.6) than the PINK1-/- tumors between days 11-17. On day 17, mice with WT tumors were euthanized due to excessive tumor burden, while PINK1-/- tumors were allowed to grow longer until day 24, when they reached similar volumes as the WT tumors had reached on day 17 (Figure 1F and Figure S1B). In agreement with soft agar results, these experiments show that PINK1 deficiency slows the growth of RasG12D-induced tumors in nude mice. Overexpression of PINK1 in the PINK1-/-plus huPINK1 population increased tumor growth by day 19 compared to PINK1-/- RasG12D-transformed cells (Figure 1G), although the rescue effect was less pronounced than in soft agar (mean tumor volume on day 19: WT = 1413 mm3; PINK1-/-= 700 mm3; PINK1-/-plus huPINK1 = 911 mm3).
PINK1 Deficiency Increases Cell Death and Alters Cell Cycle Progression in RasG12D-Transformed MEFs
We further asked whether the reduced growth of PINK1-deficient tumors is due to increased cell death or decreased cell cycle progression, as both are hallmarks of cancer and involved in Ras-induced tumorigenesis. Cell death was measured with Annexin V/propidium iodide (PI) staining assays in RasG12D-transformed MEFs with different genetic backgrounds. As shown, PINK1 loss increased the percentage of necrotic but not apoptotic cells, which was fully reversed by re-expression of human PINK1 (Figures 2A, B). Consistent with the function of PINK1 in maintaining mitochondrial integrity and its roles in regulating cell death, PINK1-/- cells displayed reduced membrane potential (Δψm) (Figure S2A). There was a positive correlation between Δψm and mean colony area in soft agar (Figure S2B). In addition, total ROS and mitochondrial ROS were reduced in PINK1-/- cells. Recovery PINK1 expression at least partially restored the reduced ROS in PINK1-/- cells (Figures S2D, E). Furthermore, basal mitochondrial respiration was reduced in PINK1-/- RasG12D-transformed MEFs as revealed by Seahorse analysis (Figure S2C). These data suggest that mitochondrial metabolism is changed by PINK1.
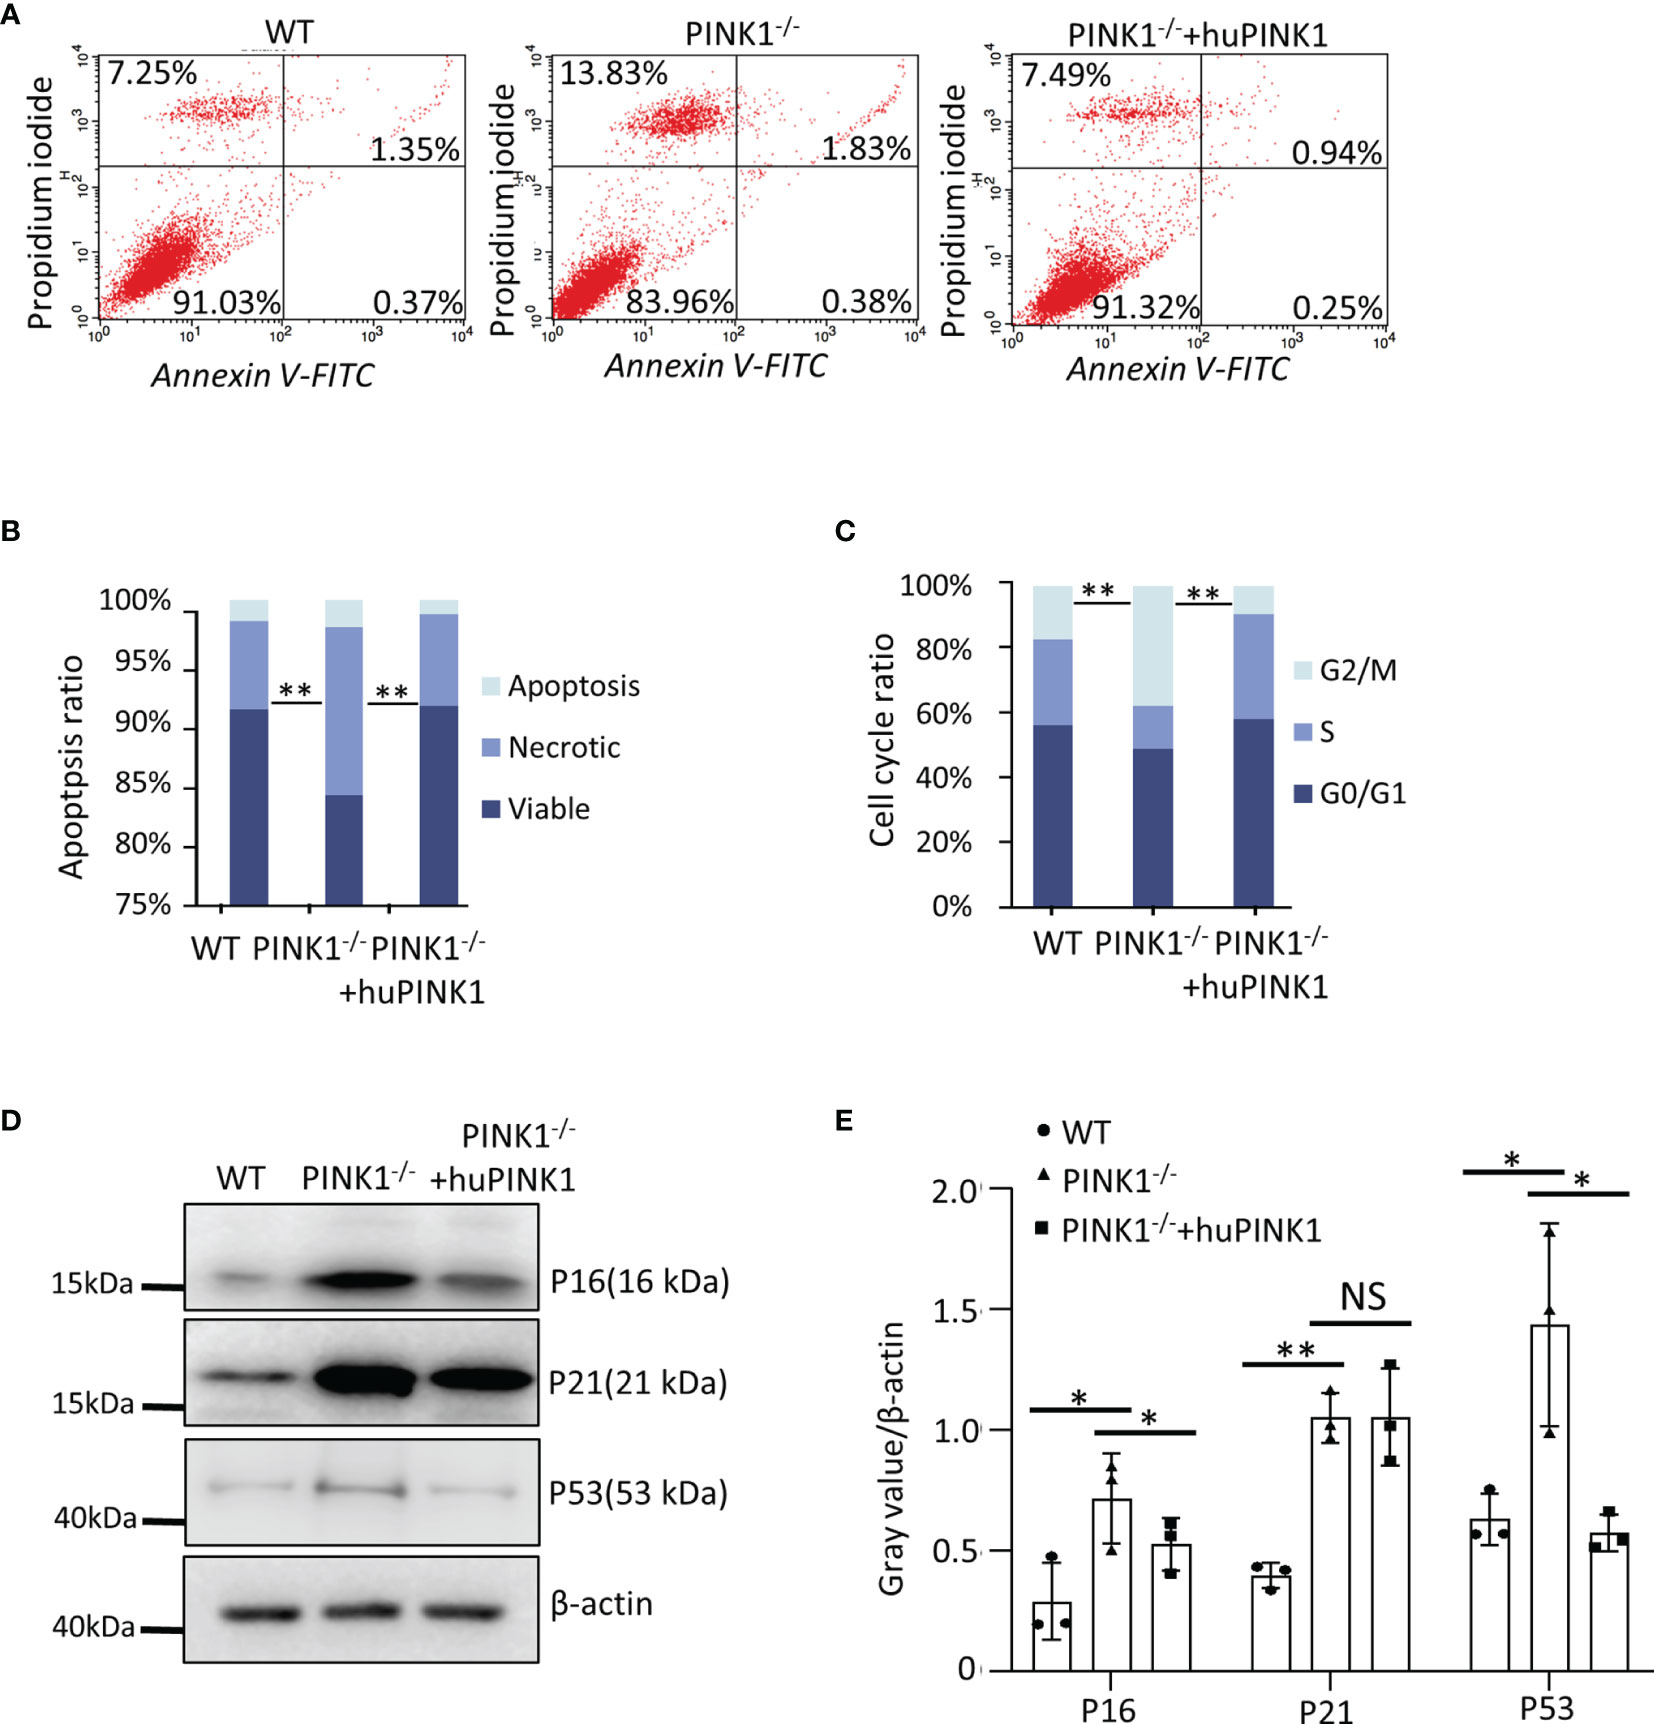
Figure 2 PINK1 deficiency increases cell death and alters cell cycle progression in RasG12D-transformed MEFs. (A, B) Apoptotic (Annexin V-FITC+) and necrotic (Propidium iodide+) cells were analyzed by flow cytometry. (C) Flow cytometry analysis of the cell cycle. Parts-of-whole columns show percentage of cells in different cell cycle phases. For each genotype/population, cells were plated into n = 3 wells, which were separately stained with propidium iodide and analyzed by flow cytometry (**p < 0.01, ANOVA). (D, E) Western blot for P16, P21 and P53 of WT, PINK1-/- and PINK1-/- +huPINK1 cells (n = 3 independent protein isolations, *p < 0.05, **p < 0.01). NS, not significant.
Cell cycle analysis of PI-stained cells by FACS demonstrated that PINK1 deficiency led to an increase of RasG12D-transformed cells in the G2/M phase and decrease of cells in the G0/G1 phase. Overexpression of PINK1 had the opposite effect, reducing the percentage of cells in G2/M and increasing the proportion of cells in G0/G1 (Figure 2C). In line with these results, protein levels of p16 and p21 were increased in PINK1-/- cells by Western blot analysis (Figures 2D, E). In addition, p53 protein expression was increased in PINK1-/- RasG12D-transformed cells (Figures 2D, E). These data suggest that loss of PINK1 promotes cell death and cell cycle arrest.
The Impact of PINK1 on Cell Death and Cell Cycle Progression Is Validated In Vivo in Nude Mice
To study the mechanisms underlying PINK1-regualted tumor growth in vivo, we examined cell proliferation rates in tumor tissues derived from WT, PINK1-/- and PINK1-/-plus huPINK1 cells in nude mice. RasG12D protein levels were comparable in the various tumor populations (Figure 3A). In contrast, expression of the cell proliferation marker Ki67 in PINK1-/- tumors was reduced compared to WT, while expression of Ki67 in PINK1-/-plus huPINK1 tumors that over-expressed huPINK1 was increased, indicating reversible inhibition of tumor cell proliferation in vivo by ablation of PINK1 (Figure 3B). Thus, the reduced growth of PINK1-deficient RasG12D-transformed cells in vitro is validated and supported by reduced proliferation of the corresponding tumor cells in nude mice.
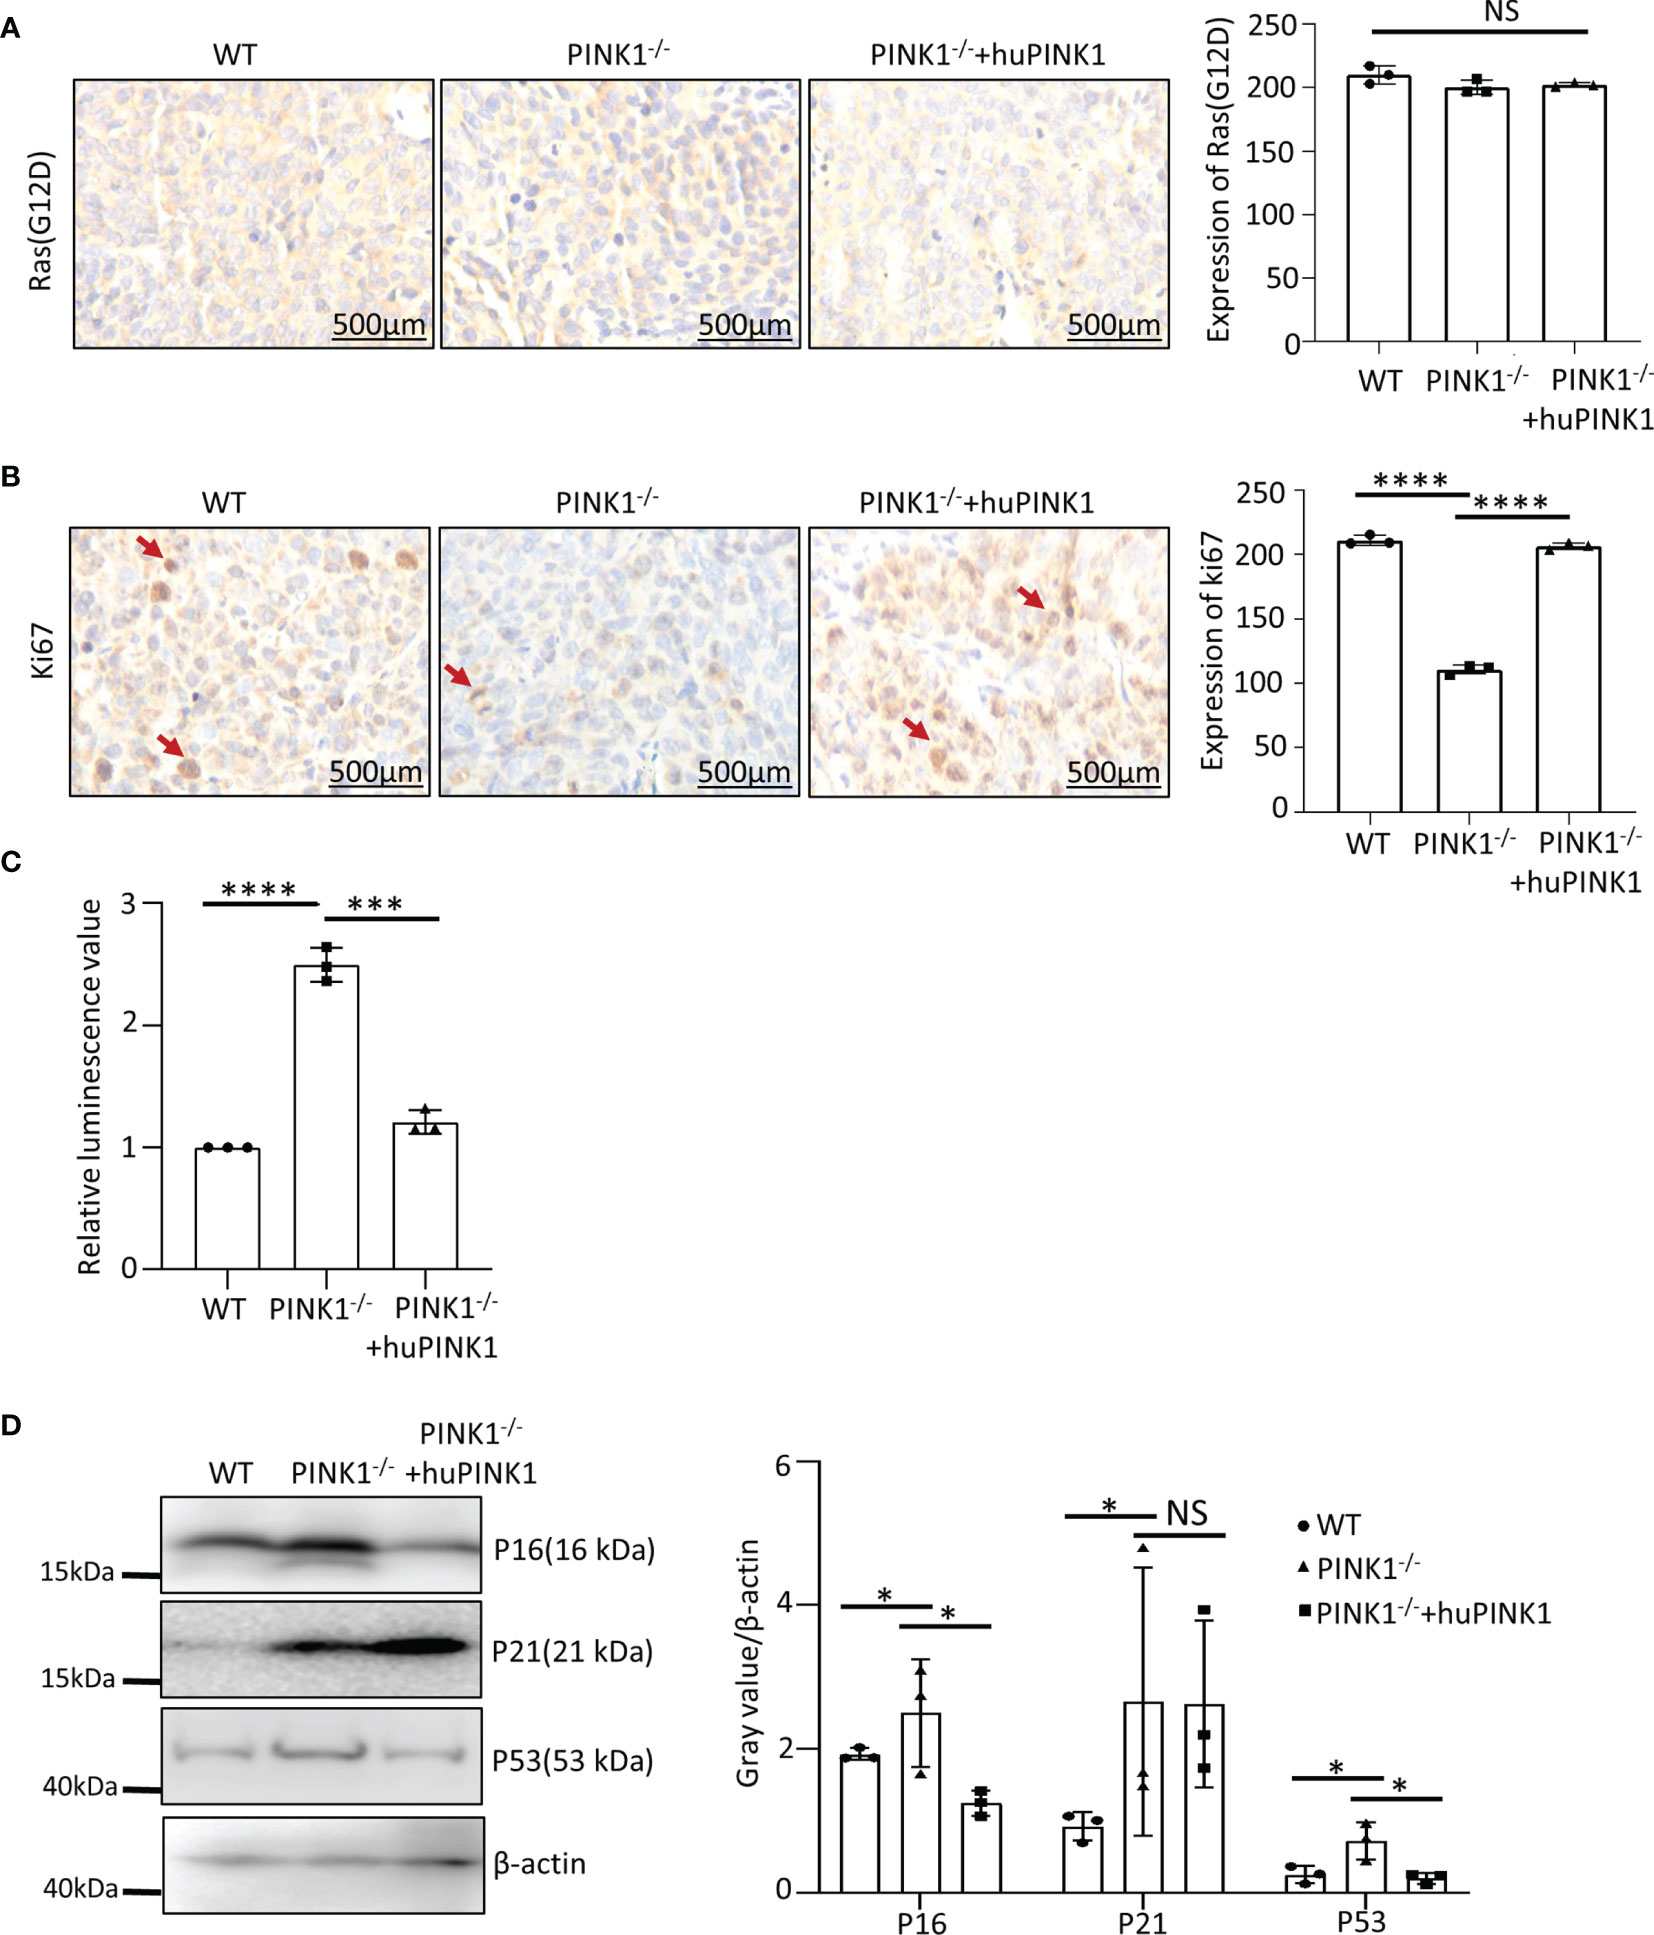
Figure 3 Impact of PINK1 deletion on cell death and cell cycle progression are validated in vivo in nude mice. (A) Immunohistochemical analysis of WT, PINK1-/- and PINK1-/- +huPINK1 tumor tissue was performed using RasG12D antibody. Image gray value is analyzed by Image J (n = 3 immunohistochemical images of tumor tissue). (B) Immunohistochemical analysis of WT, PINK1-/- and PINK1-/- +huPINK1 tumor tissue with Ki67 antibody. Image gray value is analyzed by Image J (n = 3 immunohistochemical images of tumor tissue, ****p < 0.0001). (C) Detection of apoptosis in WT, PINK1-/- and PINK1-/- +huPINK1 tumor tissue detected by the caspase 3/7 kit. (n = 3 tumor tissues, ***p < 0.001, ****p < 0.0001). (D) Western blot for P16, P21 and P53 of WT, PINK1-/- and PINK1-/- +huPINK1 tumor tissue (n = 3 tumor tissue protein lysates, *p < 0.05). NS, not significant.
Using the caspase 3/7 apoptosis detection kit, we also observed increased apoptosis of PINK1-/- tumor cells in nude mice (Figure 3C). Expression levels of p16, p21 and p53 were significantly increased in PINK1-/- tumor tissues, which was reversed after re-expression of human PINK1. However, unlike in MEFs, p21 was not downregulated significantly after re-expression of human PINK1 (Figure 3D).
PINK1 Deficiency Impairs Mitochondrial Fission in RasG12D-Transformed MEFs
We next explored possible mitochondrial mechanisms underlying the reduced growth of PINK1-deficient RasG12D-transformed cells. As indicated above, PINK1 deletion did not influence Ras expression levels (Figure 1C). Several studies have shown that PINK1 acts as a pro-fission factor (14, 35–38), consistent with mitochondrial fission preceding mitophagy (36, 39) and the enlarged mitochondrial morphology in various cells of PINK1-deficient mice (40). To analyze whether loss of PINK1 altered mitochondrial morphology, we stained mitochondria in MEFs by immunocytochemistry with an antibody against LRP130. LRP130 is a suitable marker because it is exclusively expressed in the mitochondrial matrix where it regulates the assembly and activity of cytochrome c oxidase (complex IV) (41). The mitochondrial network was highly fragmented in the majority (74.5%) of WT RasG12D-transformed cells (Figure 4A). In contrast, only 32% of PINK1-/- RasG12D-transformed cells showed a fragmented mitochondrial network, while 59.4% showed an intermediate network and 8.6% showed an elongated/fused network (Figure 4A). Re-expression of PINK1 restored mitochondrial fragmentation to 69.6% of the cells, similar to that in WT cells (Figure 4A). Thus, loss of PINK1 interfered with mitochondrial dynamics in RasG12D-transformed MEFs, which could be reversed by re-expression of PINK1.
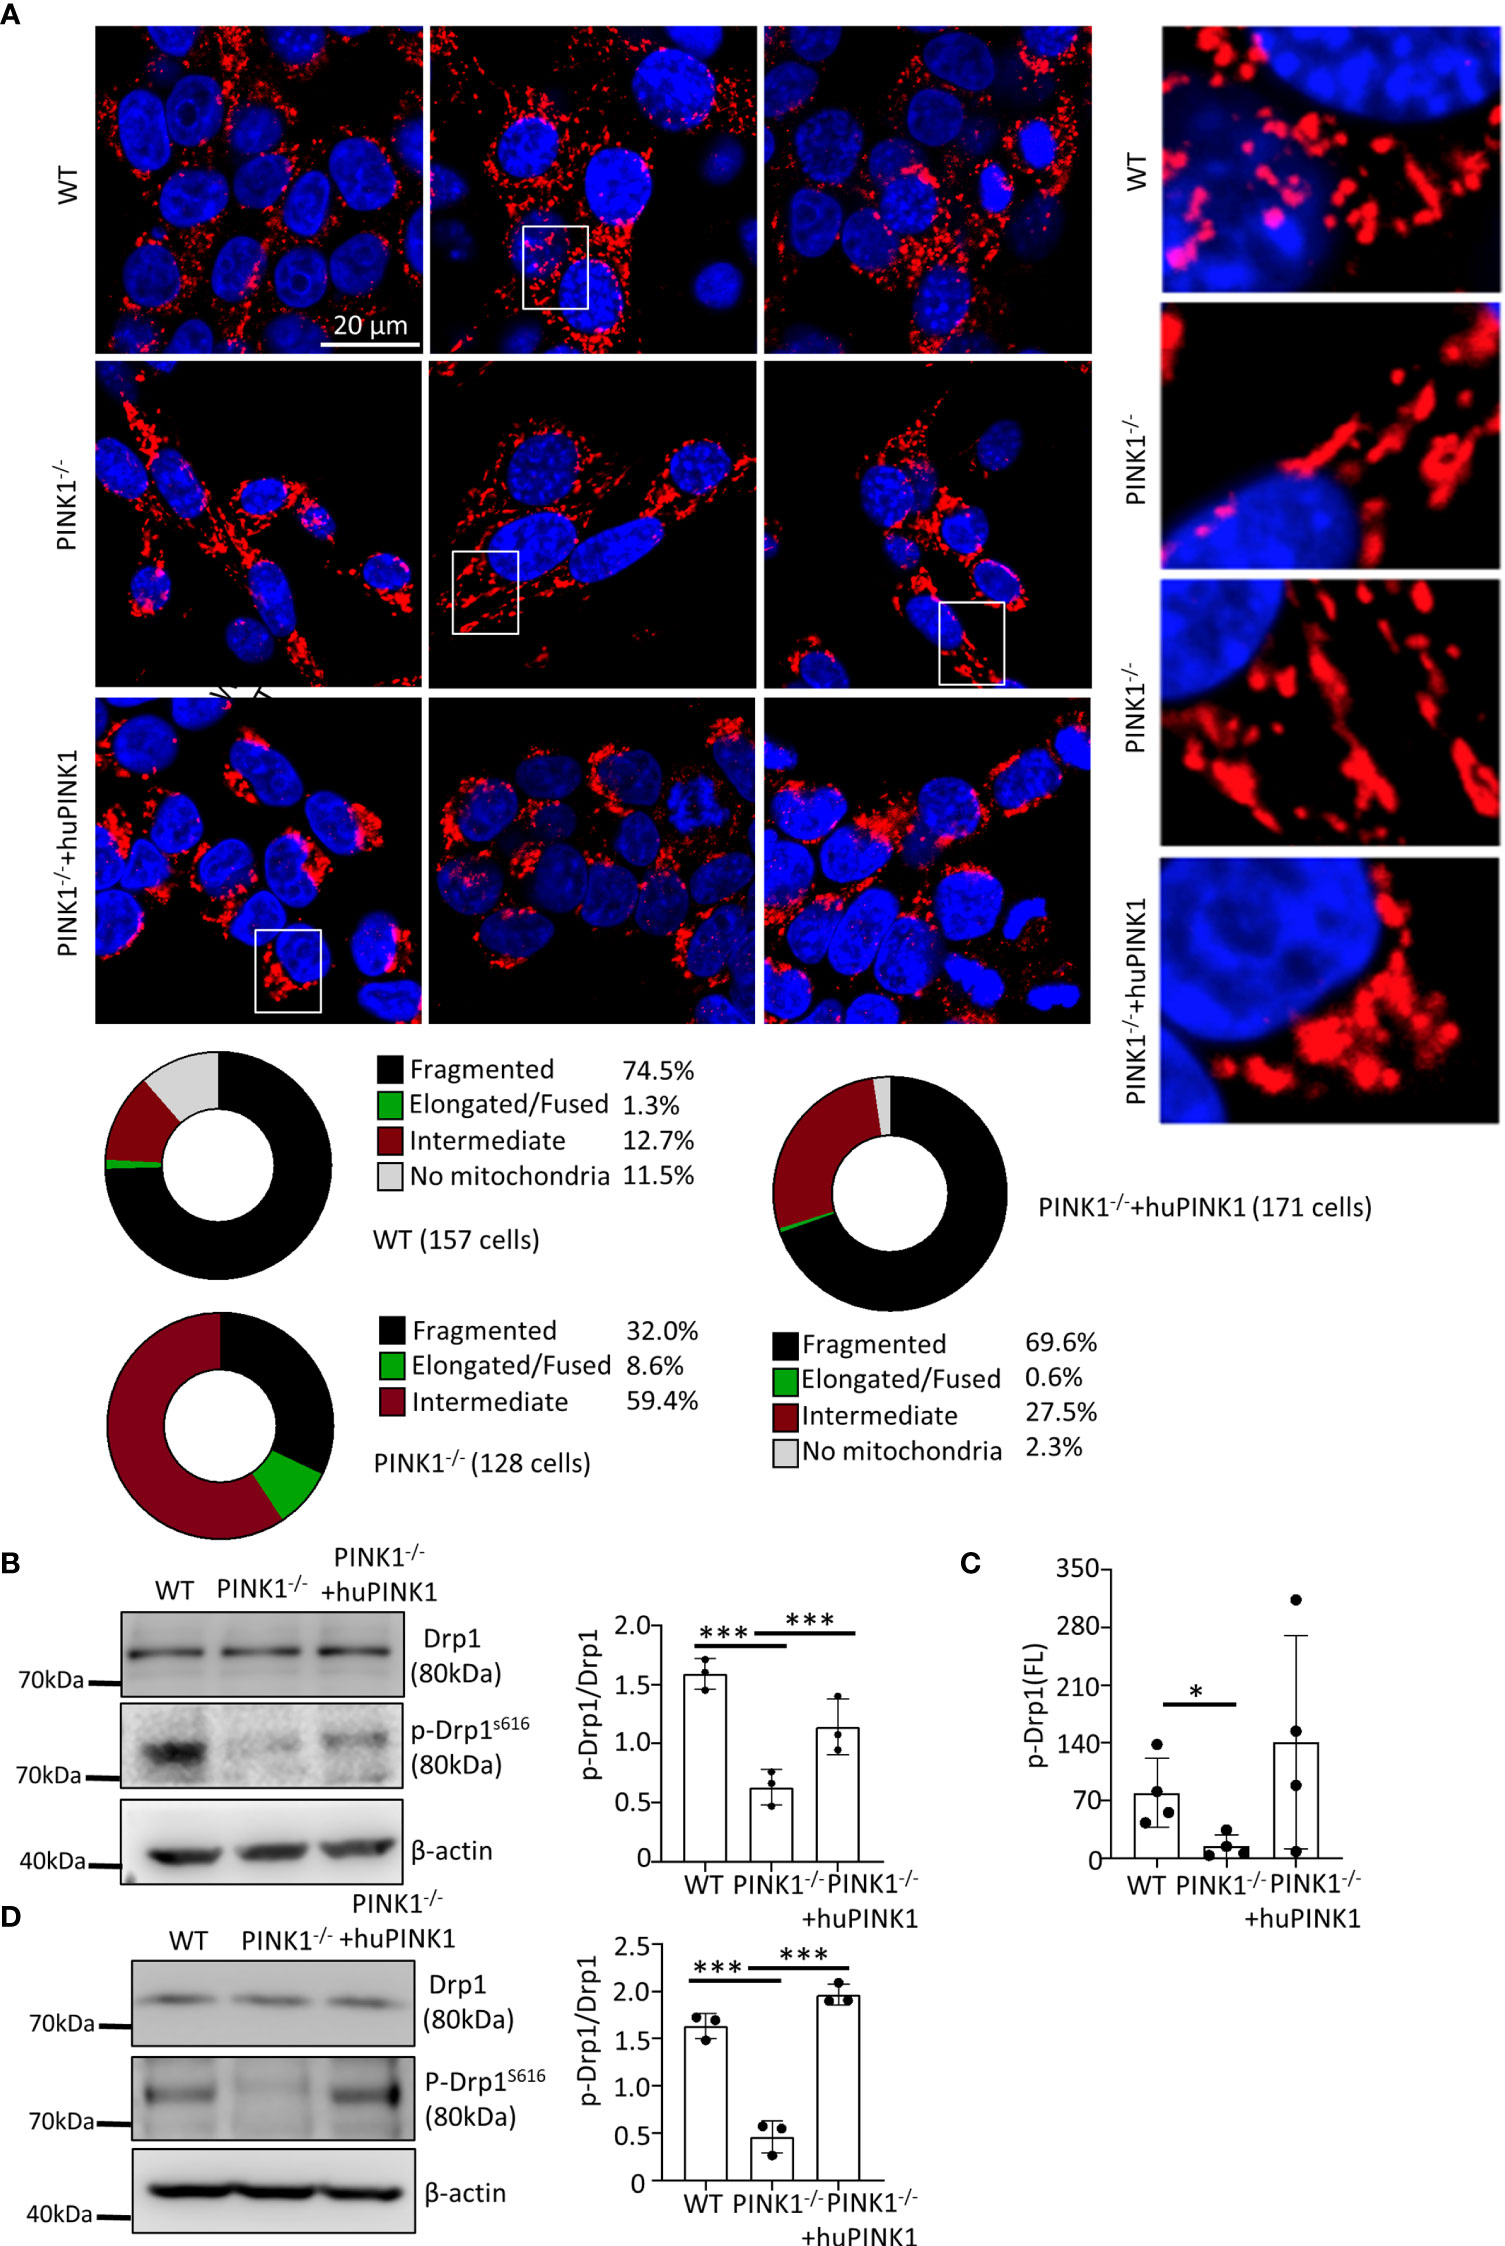
Figure 4 PINK1 deficiency impacts mitochondrial fission in RasG12D-transformed MEFs. (A) Cells were stained with an antibody against LRP130, which is exclusively expressed in the matrix of mitochondria. Nuclei were visualized with DAPI. Three representative images for each genotype of cells are shown, with magnifications of the mitochondria within white rectangles displayed on the right side. Bottom: Mitochondrial network morphology was analyzed as described in the Methods, and the percentage of cells with fragmented, intermediate, and elongated/fused mitochondrial networks, or no mitochondria, is indicated for WT, PINK1-/- and PINK1-/- +huPINK1 cell populations. Number of cells analyzed: WT = 157, PINK1-/- = 128; PINK1-/- +huPINK1 = 171. (B) Expression and phosphorylation of Drp1 in WT, PINK1-/- and PINK1-/- +huPINK1 cells by western blots (n = 3 cell protein lysates). (C) Expression and phosphorylation of Drp1 in WT, PINK1-/- and PINK1-/- +huPINK1 cells analyzed by flow cytometry (n = 3, mean ± SD, *p < 0.05). (D) Expression and phosphorylation of Drp1 in WT, PINK1-/- and PINK1-/- +huPINK1 tumor tissue analyzed by western blots (n = 3 cell protein lysates). ***p < 0.001.
Because it has been shown that PINK1 promotes mitochondrial fission by phosphorylating Drp1 at Ser616 (42), we studied whether altered mitochondrial dynamics in PINK1-/- RasG12D- MEFs was related to abnormal phosphorylation or expression of Drp1. To this end, the expression of Drp1 and phosphorylated Drp1 was detected by western blotting and flow cytometry. There was no significant difference in Drp1 protein expression. PINK1-/- MEFs showed a significant decrease of phospho-Drp1 (Ser616) levels compared to WT MEFs. Re-expression of huPINK1 in PINK1-/- cells partially rescued the decreased phospho-Drp1 (Ser616) levels (Figures 4B, C). Analysis of the expression of Drp1 and phosphorylated Drp1(Ser616) showed that phosphorylation of DRP1 was also decreased in PINK1-/- tumor tissues (Figure 4D). It has been also shown that ERK can increase Drp1 phosphorylation (43). However, our data did not show a reliable link between ERK phosphorylation (activation) and PINK1 expression (Figure S2G), suggesting that decreased phosphorylation at Drp1 (Ser616) may be due to a direct effect of PINK1 loss. In contrast to the phosphorylation at Drp1(ser616), phosphorylation at Drp1(Ser637) inhibits mitochondria fission and modulate mitophagy (44). Interestingly, PINK1 deficiency did not cause alterations in Drp1(Ser637) phosphorylation (Figure S2F). In line with above data, although PINK1 deficiency increased p62 and LC3-1/II, the recovery of PINK1 expression had no ability to abolish it (Figure S2H), suggesting that the increased p62 and LC3-1/II is not intrinsic effect of PINK1. Therefore, PINK1 deficiency regulate mitochondria morphology mainly by reducing Drp1(Ser616) phosphorylation-mediated mitochondria fission.
Drp1 affects mitochondrial fission, leading to cell cycle arrest and apoptosis (45–47), which prompted us to explore the impact of PINK1 on cell growth in the presence of the mitochondrial fission (Drp1) inhibitor Mdivi-1. Mdivi-1 significantly inhibited the growth of RasG12D-transformed WT cells, while the inhibitory effect of Mdivi-1 was compromised in PINK1-deficient cells. Re-expression of PINK1 in PINK1-/- RasG12D MEFs restored Mdivi-1-mediated growth inhibition (Figure S3A). Therefore, PINK1 loss inhibits tumor growth at least in part through impaired regulation of Drp1. Together with data presented above, these results demonstrate a pro-fission and pro-growth function of the PINK1-Drp1 axis in RasG12D-transformed MEFs.
PINK1 Knockout Reduces the Growth of HCT 116 Human Colon Carcinoma Cells In Vitro
In MEFs, RasG12D was overexpressed after viral transduction. To study whether PINK1 loss similarly affected the growth of authentic human RasG13D-transformed tumor cells in which mutated Ras is expressed at physiological levels, we introduced CRISPR-Cas9-mediated deletions into the PINK1 gene of HCT116 cells that were originally isolated from a primary human colon carcinoma. Several PINK1-deficient HCT116 clones with varying PINK1 deletions were identified by PCR with genomic DNA using primers and DNA sequencing that flanked the two CRISPR target sites (Figures S3B, C). We did not detect PINK1 protein expression by Western blots in WT HCT116 cells, likely due to constitutive degradation in cells without severe mitochondrial depolarization (32). However, in addition to sequencing, we confirmed that the CRISPR/Cas9-generated genomic PINK1 deletions produced null mutations at the mRNA level by PCR amplification of total cellular cDNA with two different primers pairs (Figure S4A). PINK1-knockout clones 45 and 51 produced the expected PCR fragments (deletions), which were unable to encode any functional PINK1 protein. In addition, clones 3, 11 and 50 yielded no bands or only very faint PCR products, suggesting that in these clones the genomic deletions destabilized the resulting PINK1 mRNAs to levels below detection. Collectively, these results show that all CRISPR/Cas9-generated PINK1 deletions produced null mutations.
HCT116 clones lacking PINK1 showed reduced growth in soft agar when compared to the control clones, which were transfected with px458 vector only (Figure 5A). This was not due to altered Ras expression, because PINK1-deficient and control vector-transfected HCT116 clones expressed comparable levels of Ras (Figure 5B). Deletion of PINK1 also did not affect the GTPase activity of Ras (Figure S4B). Like in MEFs, we detected Drp1 and phosphorylated Drp1(Ser616) protein in HCT116 cells by western blotting and flow cytometry and found a decrease in phosphorylated Drp1(Ser616) in PINK1 knockout HCT116 cells (Figures 5C, D). In tissue culture, growth of PINK1 knockout HCT116 cells was significantly slower than that of the control group (Figure 5E). Overall, these results show that in human tumor cells with a common Ras mutation, the loss of PINK1 also causes impaired tumor growth.
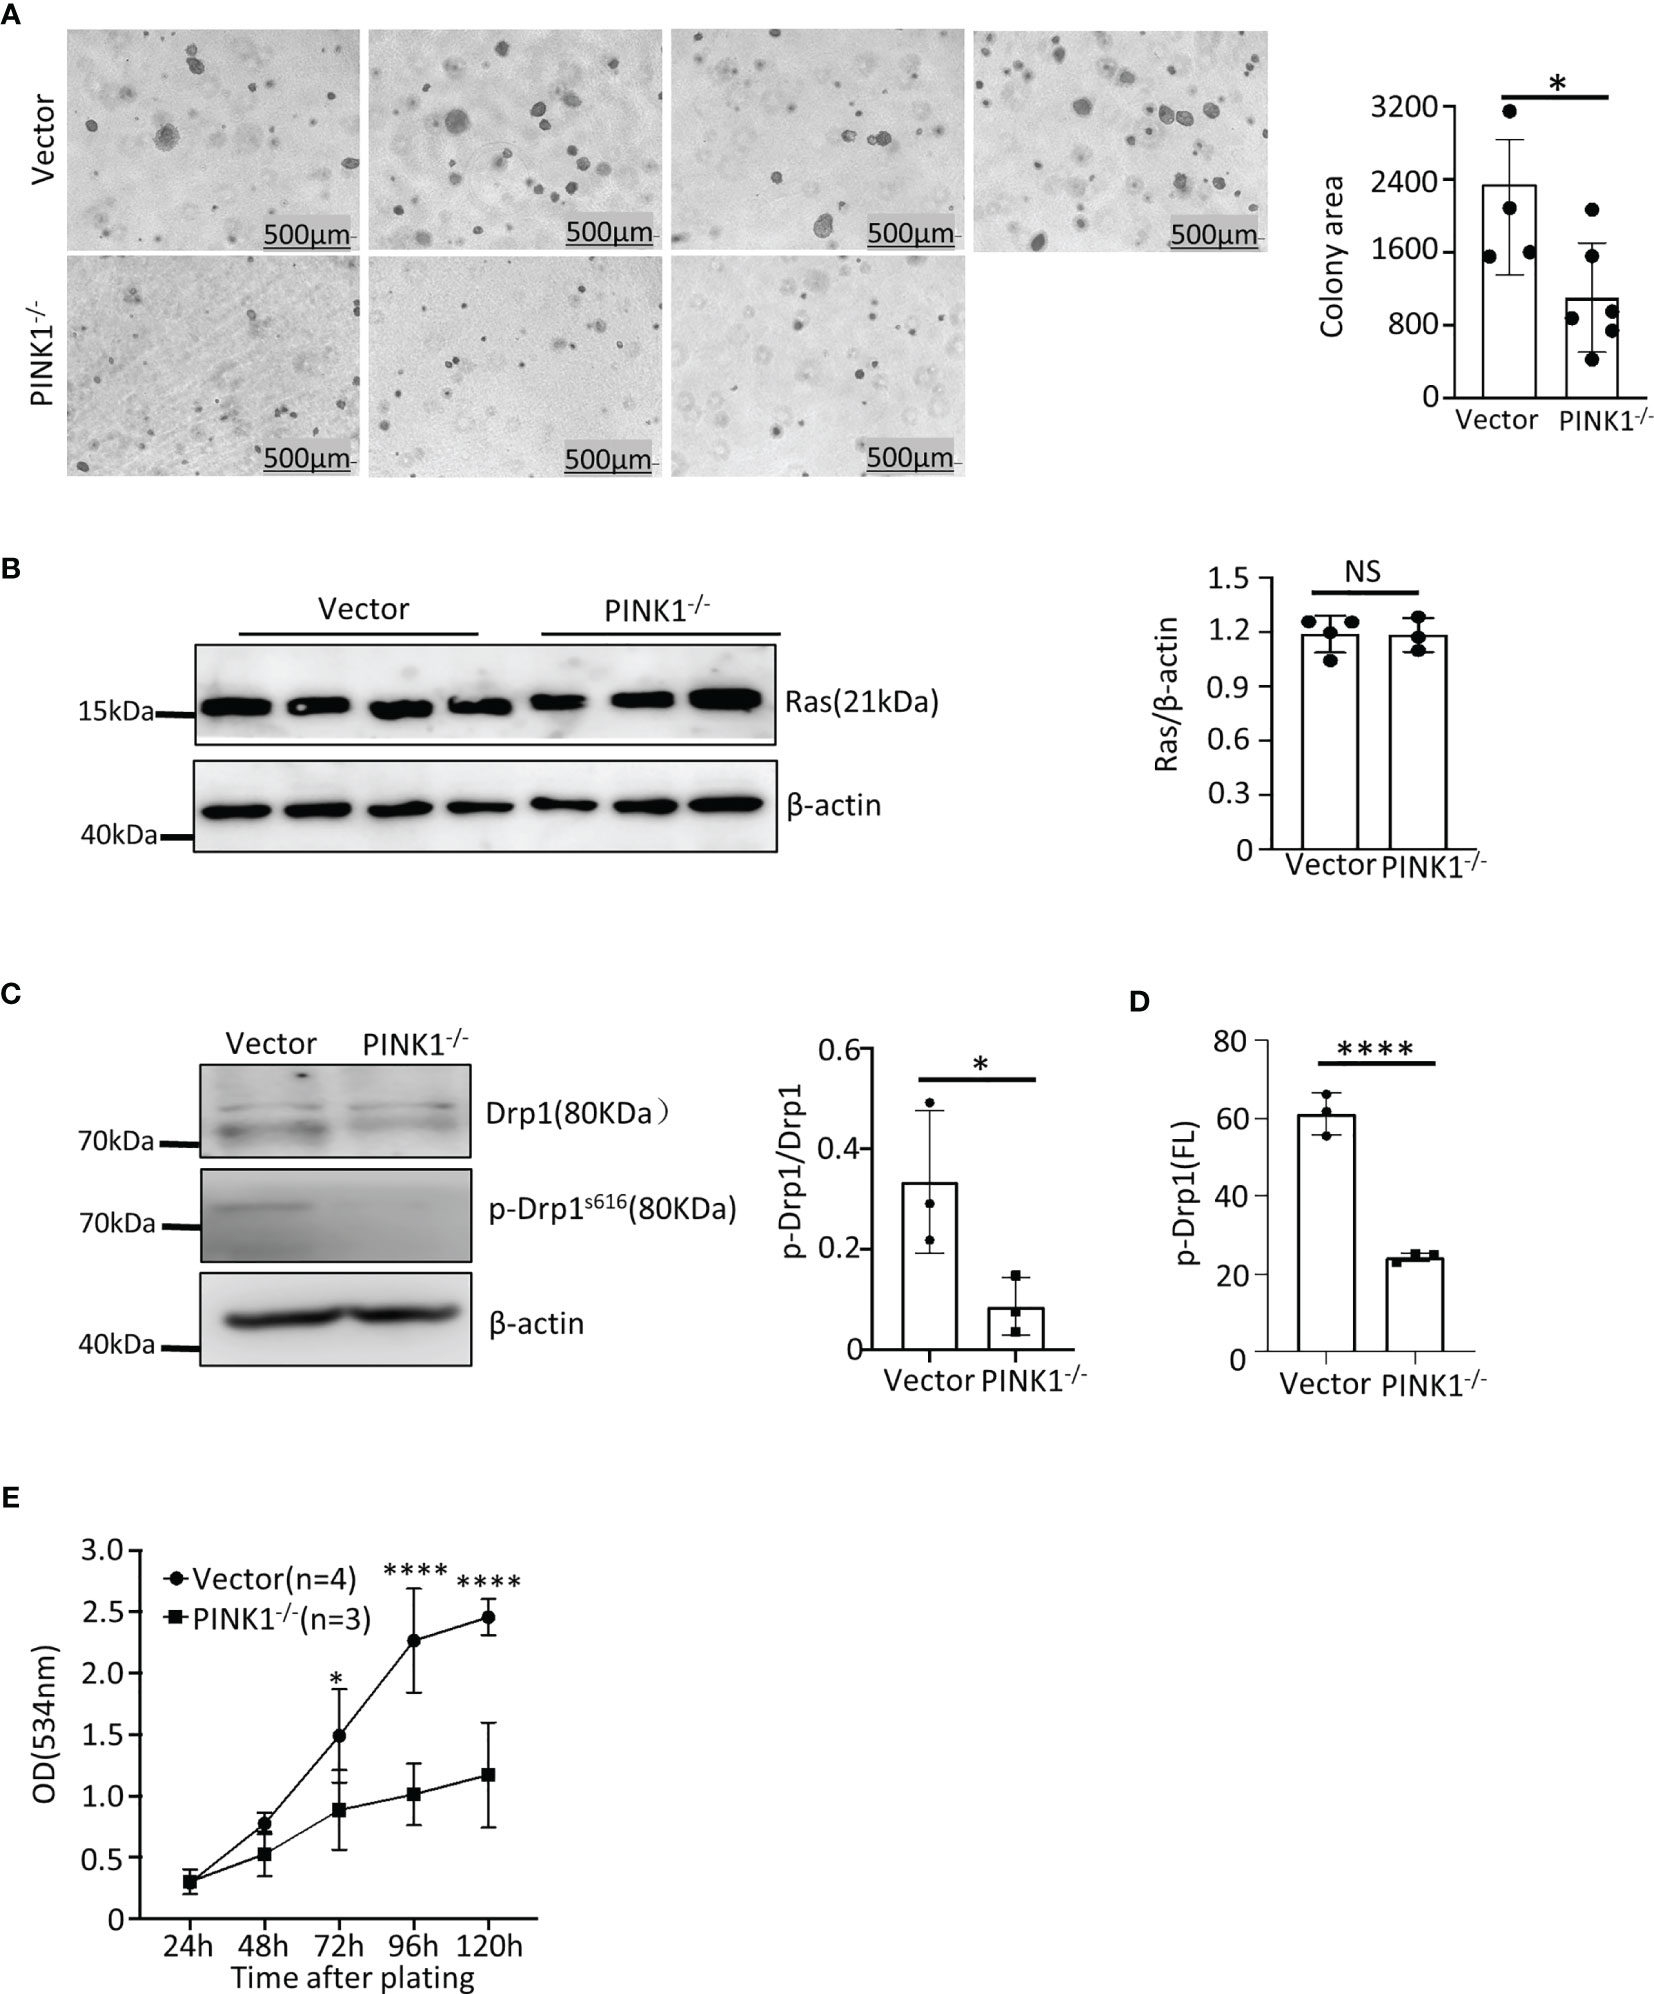
Figure 5 PINK1 knockout reduces the growth of HCT 116 human colon carcinoma cells in vitro. (A) Left: Representative images of soft agar colonies with vector and PINK1-/- genotype. Right: Graph comparing average colony area (mean ± SD) of 4 control vector-transfected HCT116 clones and 6 CRISPR-generated PINK1-knockout HCT116 clones (*p = 0.047). (B) Western blot quantification of Ras expression in the vector and PINK1-/- HCT116 cell clones (n = 3 clones per genotype). (C) Expression and phosphorylation of Drp1 vector-transfected and PINK1-/- cells by western blots. (D) Phosphorylation of Drp1 in vector and PINK1-/- HCT116 clones by flow cytometry (n=3 clones, mean ± SD, ****p < 0.0001). (E) Cell number (growth) of HCT116 control and PINK1-/- cell clones measured in tissue culture with the sulforhodamine B assay (mean ± SD, two-way ANOVA, *p = 0.037 and ****p < 0.0001).
PINK1 Ablation Affects Mitochondrial Fission and Increases Cell Death in HCT-116 Cells
Similar to the results reported in other studies that most of the mitochondria were fragmented in cell lines containing Ras mutations (48), mitochondrial fragmentation was also observed in HCT116 vector-transfected cells. In contrast, HCT116 PINK1 knockout cells showed significantly less fragmentation with a shift to intermediate-size mitochondria. Specifically, PINK1-/- cells contained 29.2% fragmented mitochondria compared with 77.7% in the vector group (Figure 6). It has been reported previously that upon Drp1 deletion, the mitochondrial morphology in HCT116 cells was more intermediate (48–50). In our study, we inhibited Drp1 expression in HCT116 cells by small interfering RNA (siRNA), and the knockdown efficacy was determined by western blot (Figure S4C). Followed by confocal microscopy analysis of mitochondrial morphology. We observed a decrease in intracellular mitochondrial fragmentation after Drp1 knockdown (KD) in the control cells. However, in PINK1-/- HCT116 cells, mitochondrial morphology did not change much and more of it was still in fusion state (Figure 6). This suggests that the effect of PINK1-/- on mitochondrial morphology is similar to that of Drp1 reduction.
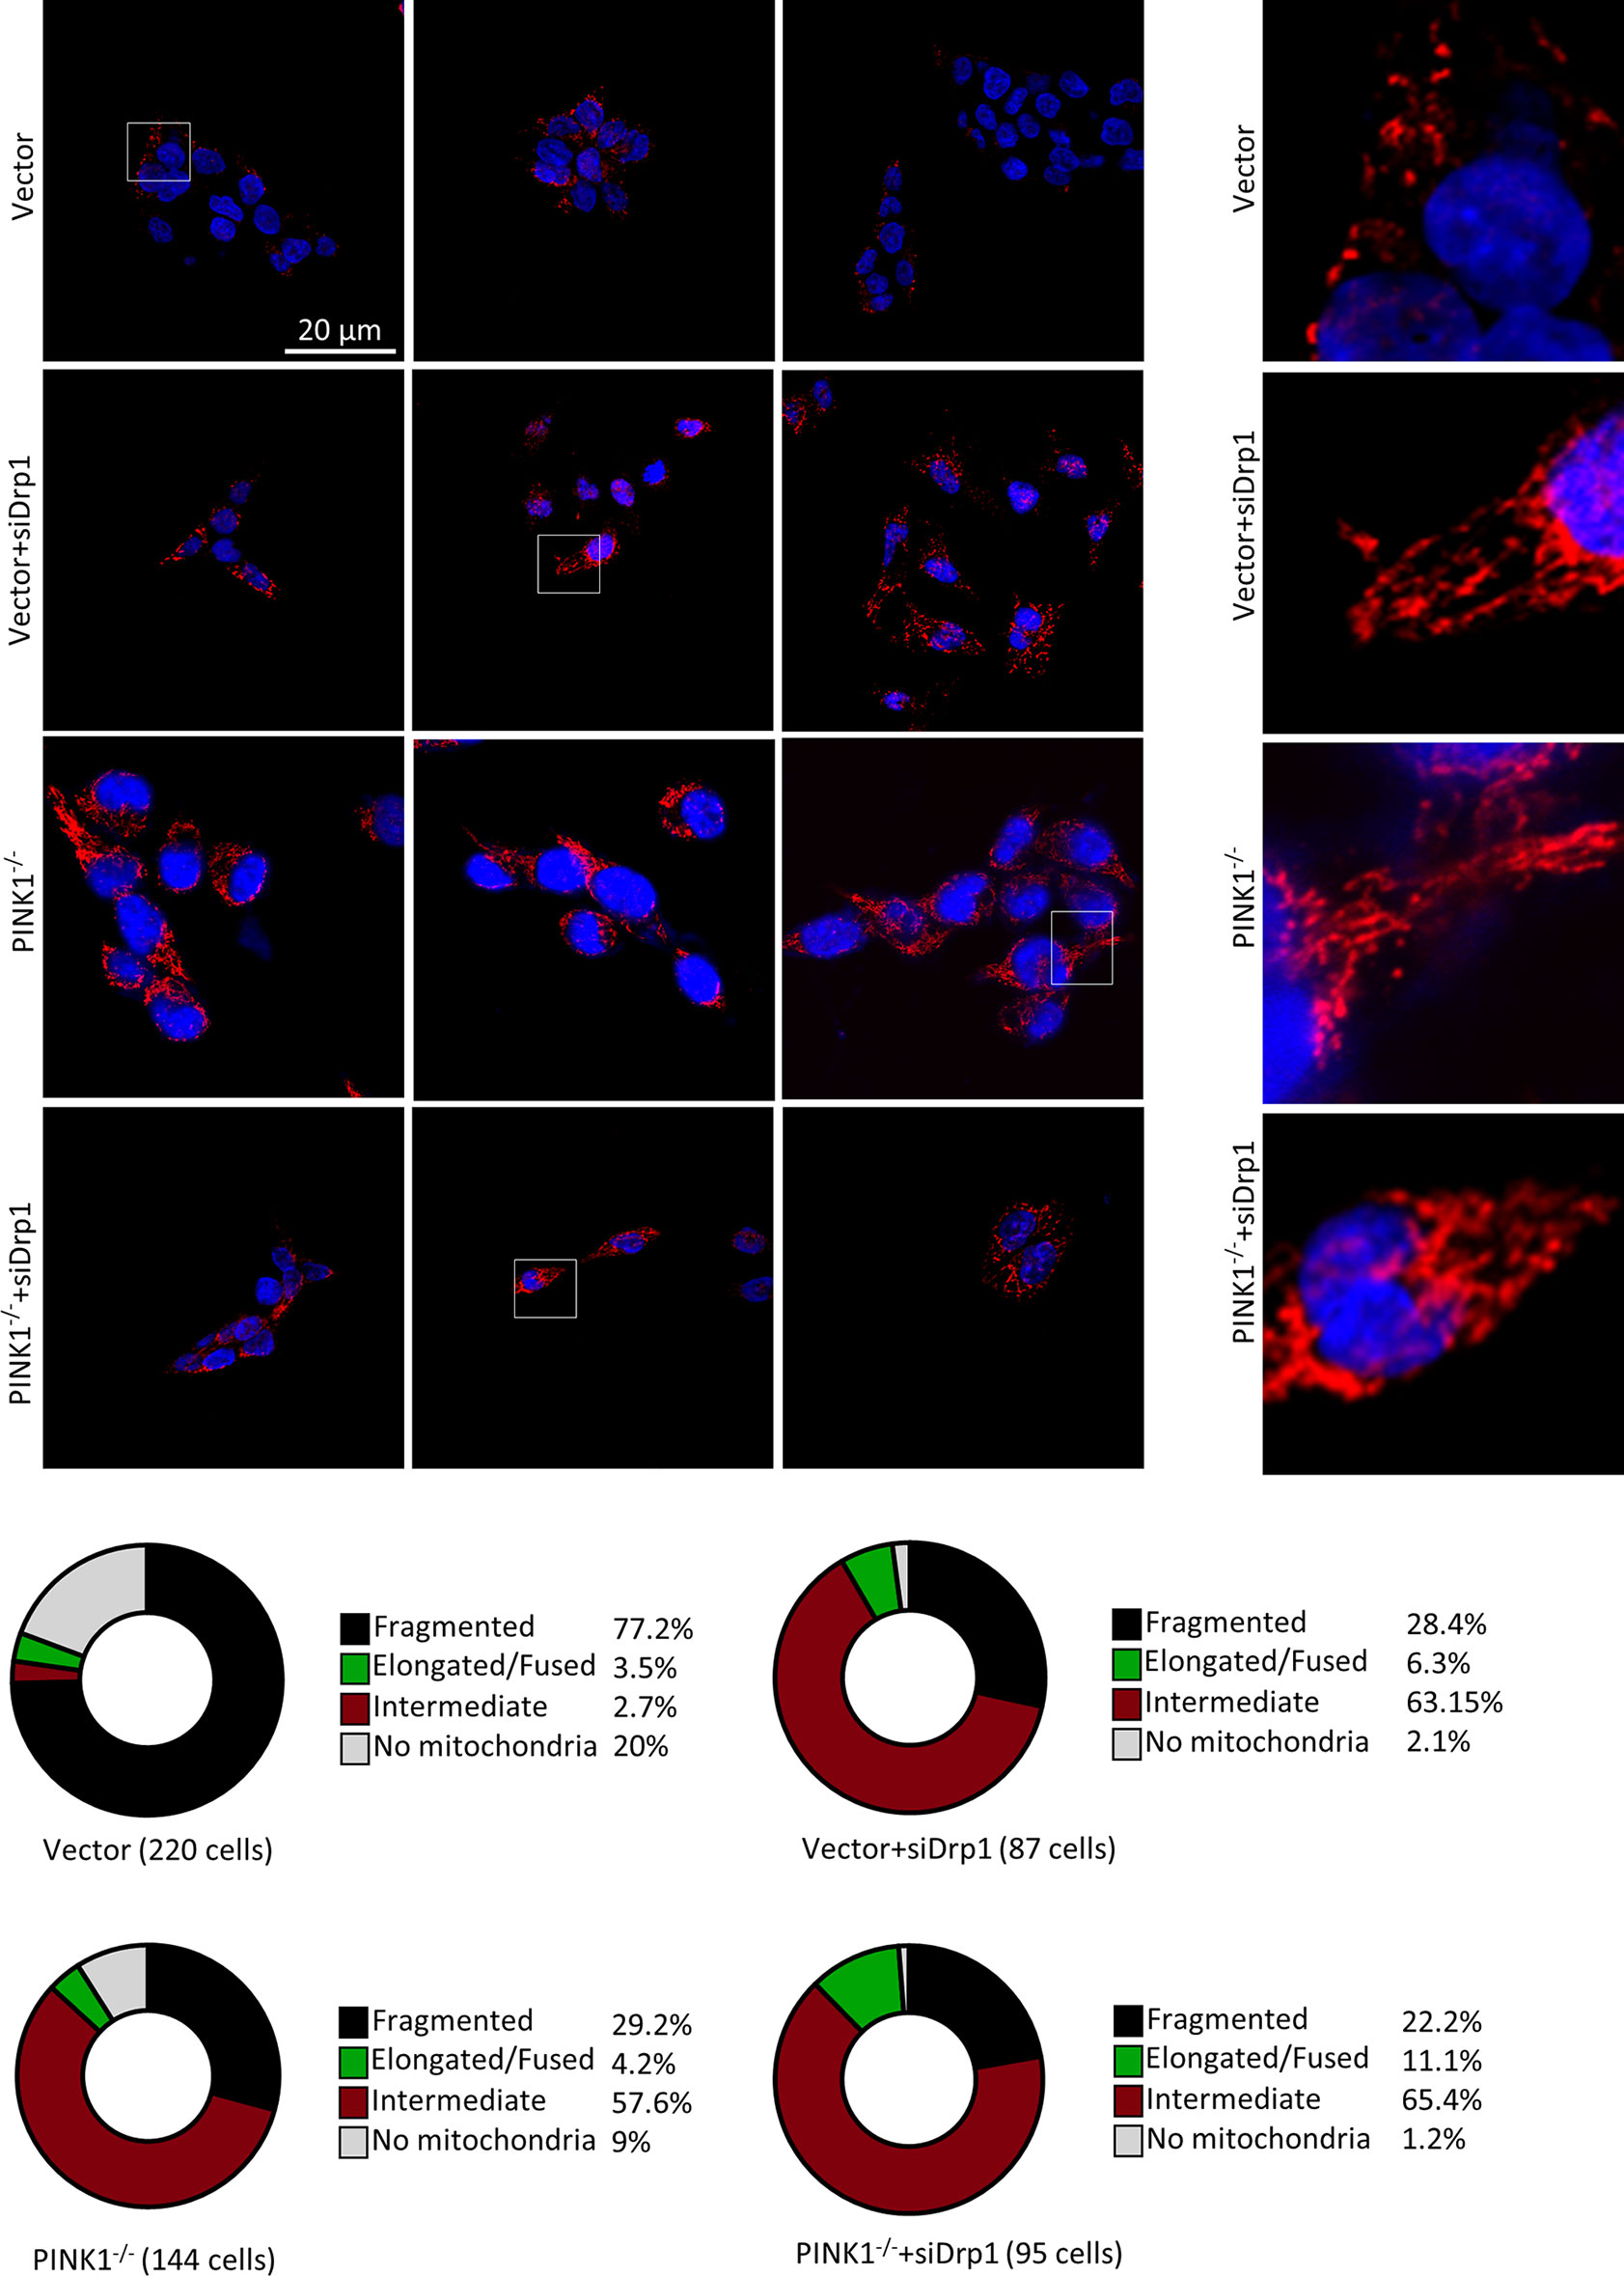
Figure 6 PINK1 knockout affects mitochondrial fission in HCT116 cells. Cells were stained with an antibody against LRP130, which is exclusively expressed in the matrix of mitochondria, and nuclei were visualized with DAPI. Three representative images for each genotype of cells, with magnifications of the mitochondria within white rectangles displayed on the right side. Bottom: Mitochondrial network morphology was analyzed as described in the Methods, and the percentage of cells with fragmented, intermediate, and elongated/fused mitochondrial networks, or no mitochondria, is indicated for vector, vector+siDrp1, PINK1-/-and PINK1-/-+siDrp1. Number of cells analyzed: Vector = 220, Vector+siDrp1 = 87, PINK1-/- = 144, PINK1-/-+siDrp1 = 95. NS, not significant.
It has been shown previously that deletion of Drp1 increases apoptosis (49). Analyzing apoptosis in HCT116 cells, we found that 22.51% of the PINK1-/- cells underwent apoptosis while only 6.95% of the WT cells were apoptotic (Figure 7A). Thus, similar to MEFs, cell death was also increased in PINK1-/- HCT116 cells, although in MEFs increased death was mainly due to increased necrosis rather than apoptosis. In HCT116 cells, we also used PI to study the cell cycle. In contrast to MEFs, we found no difference in the percentage of cells in the G2/M phase in HCT116 cells lacking PINK1(Figure 7B). In agreement with this result, expression of the cell cycle-related checkpoint proteins p16 and p53 was unaltered in PINK1-/- HCT116 cells (Figure 7C).
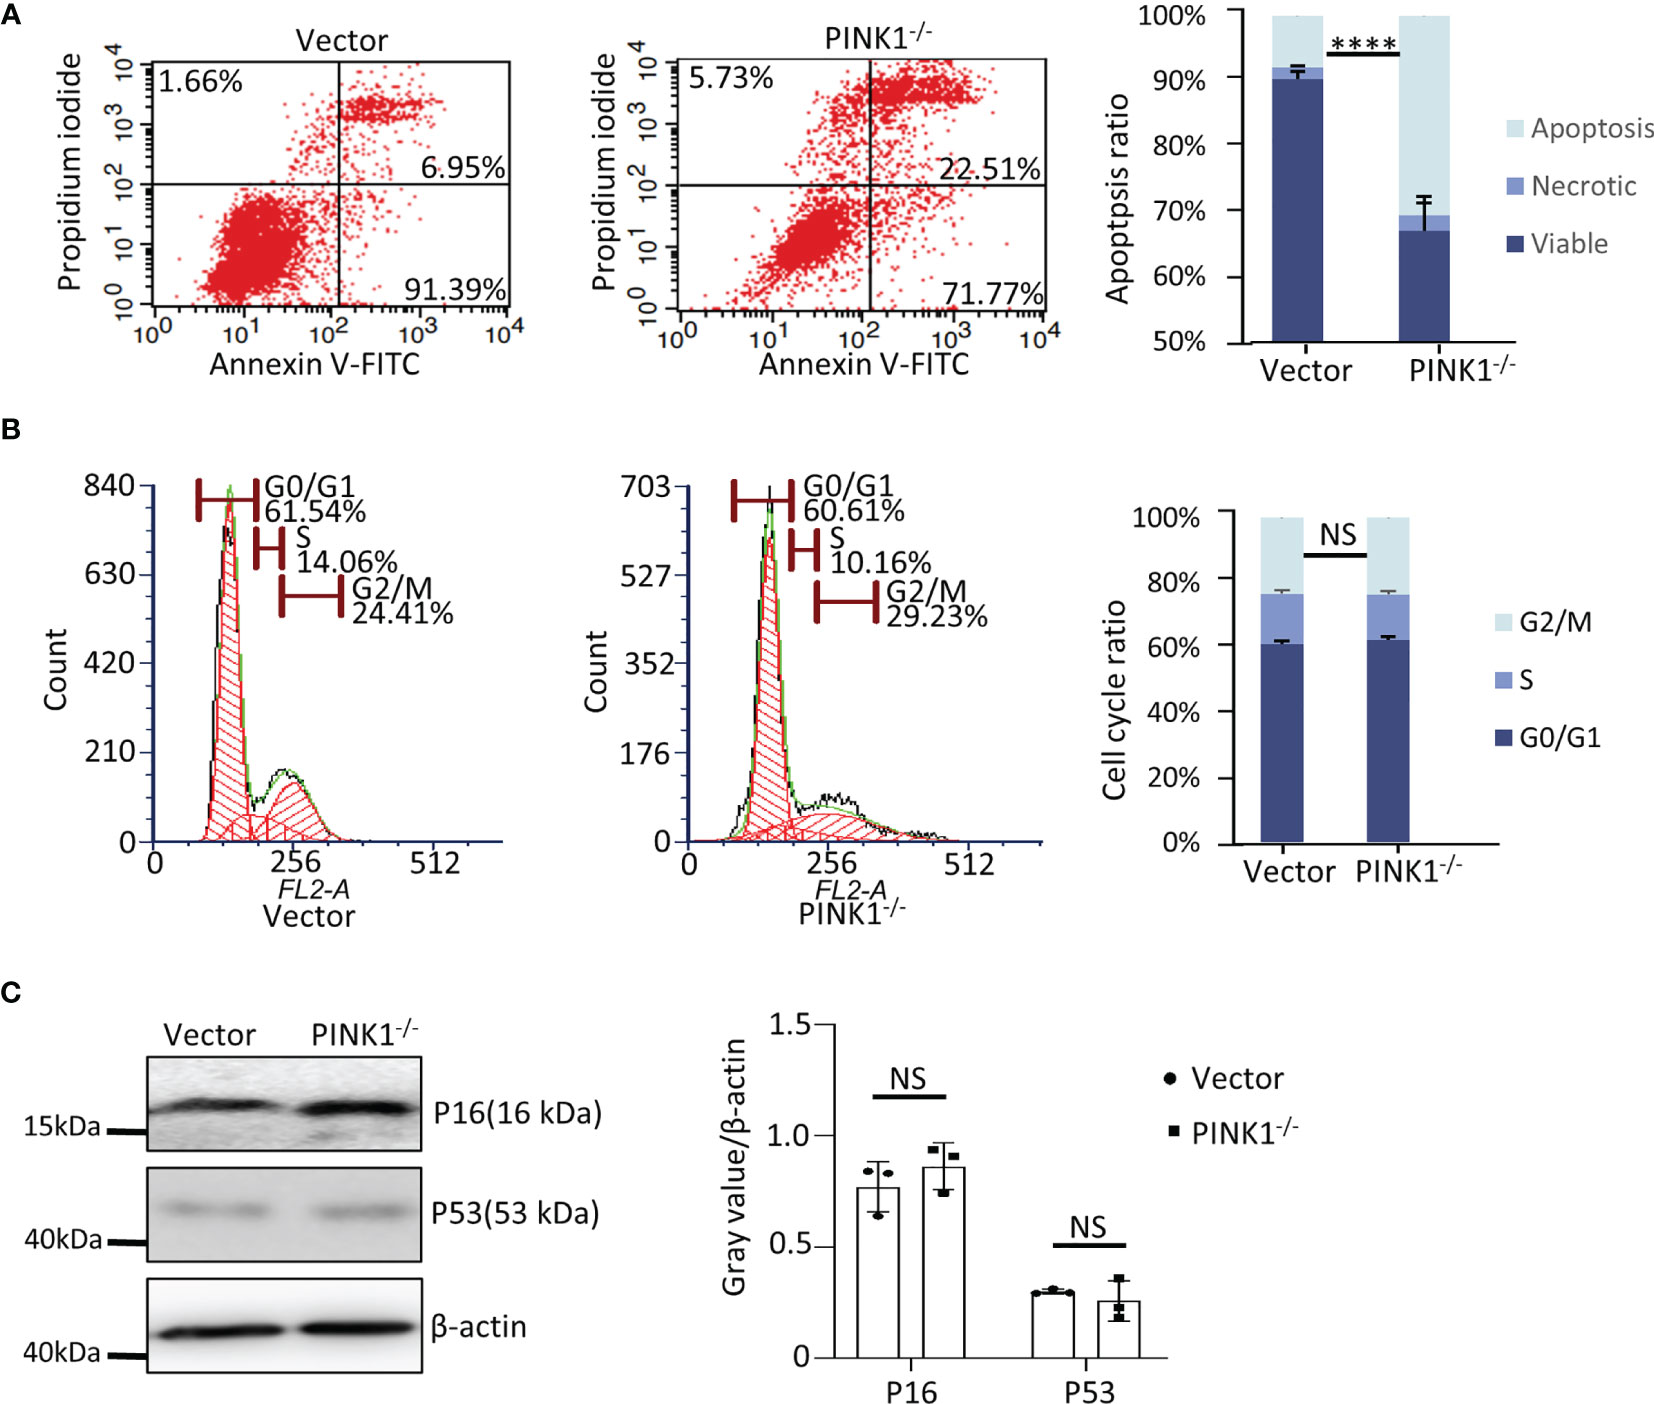
Figure 7 PINK1 knockout affects cell death in HCT116 cells. (A) Apoptotic (Annexin V-FITC+) and necrotic (Propidium iodide+) cells of vector and PINK1-/- HCT116 clones were analyzed by flow cytometry (n = 3 clones per genotype, mean ± SD, ****p < 0.0001). (B) Flow cytometry analysis of the cell cycle. Representative cell cycle profiles of vector and PINK1-/- are depicted. Parts-of-whole columns show percentage of cells in different cell cycle phases. For each genotype, cells were separately stained with propidium iodide and analyzed by flow cytometry (n = 3 clones per genotype). (C) Western blot for P16 and P53 expression in vector and PINK1-/- cells (n=3 clones per genotype). NS, not significant.
Discussion
Oncogenic RAS mutations are a frequent cause of many human tumors (estimated 30%), especially cancers of the pancreas, lung and colon (27, 28). Here we show that loss of PINK1 reduces tumor cell growth in two different Ras-driven tumor models: Embryonic fibroblasts (MEFs) from PINK1-/- mice immortalized with SV40 large T and transduced with a RasG12D retrovirus, and patient-derived HCT116 human colon carcinoma cells expressing an endogenous RasG13D mutation with CRISPR-Cas9-introduced PINK1 gene deletions. We cannot entirely exclude that a subtle difference in Ras expression may have contributed to reduced tumor cell growth in the MEF system. However, the fact that two individual PINK1-/- Ras-transformed MEF clones that expressed Ras protein at levels comparable to two WT clones were severely growth-impaired, strongly supports an important role for PINK1 in the growth of Ras-driven tumors. This conclusion is corroborated by the observation that PINK1 ablation also reduced the growth of several RasG13D-transformed human HCT116 tumor cell clones – without decreasing Ras protein expression or Ras GTPase activity. Finally, PINK1 loss failed to reduce the growth of immortalized MEFs that only expressed SV40LT but not RasG12D. Taken together, these results demonstrate that PINK1 ablation does not generally reduce cell growth but that PINK1 expression is required for optimal growth of Ras-transformed cells.
Mitochondrial dynamics supports different stages of tumorigenesis (51). Mitochondrial fission (or fragmentation) is required for Ras-induced carcinogenesis (48, 52, 53). Intriguingly, we found that PINK1 deletion impairs mitochondrial fragmentation in RasG12D-induced MEF cells and HCT116 cells containing an endogenous RasG13D mutation. This suggests that PINK1 may support mutant Ras-mediated tumorigenesis by stimulating fission to facilitate tumor growth. Indeed, PINK1 and Parkin promote fission and/or inhibit fusion (14, 35–38), and we have previously shown that elongated and enlarged mitochondria accumulate in several primary cell types from PINK1-deficient mice (40). Drp1 affects mitochondrial morphology and is critical for mitochondrial fission in mammalian cells (54, 55). We also show that PINK1 deficiency impairs Drp1 phosphorylation in tumor cells, as has been reported previously in other cells (42). Reduced levels of phospho-Drp1 (Ser616) in PINK1-/- tumor cells shown here, and impaired PINK1/Parkin-mediated proteasomal degradation of mitofusin (36, 56–58), may have contributed to increased mitochondrial fusion in PINK1-/- tumor cells. We also show that PINK1 deletion compromised the ability of the Drp1 inhibitor Mdivi-1 to reduce the growth of Ras-transduced cells, supporting that PINK1 acts at least in part by regulating Drp1 to inhibit tumor growth, likely via PINK1-mediated phosphorylation of Drp1. However PINK1 may also support Ras-induced tumorigenesis by Drp1-independent mechanisms.
Mitochondrial dynamics regulates cell cycle progression, and blocking mitochondrial fission interferes with the completion of mitosis (43, 54, 59–61). It was therefore interesting to study cell cycle progression in PINK1-deficient RasG12D-transformed cells with aberrant mitochondrial dynamics. The shift toward increased mitochondrial fusion in PINK1-/- MEF RasG12D-transformed cells may explain the accumulation of these cells in G2/M, as it is observed in tumor cells after Drp1 knockdown (61). In addition, PINK1 phosphorylates Drp1 at Ser616 which stimulates fission (42), and we show here impaired phosphorylation of Ser616 of Drp1 in PINK1-deficient RasG12D-transformed cells. In contrast, PINK1 overexpression decreased the percentage of cells in G2/M and increased the proportion of cells in G0/G1. Because mitochondrial hyper-fusion is necessary for progression from G1 into S phase (60), PINK1-stimulated mitochondrial fission (14, 37) in cells overexpressing PINK1 likely accounts for the accumulation of cells in G0/G1 in the PINK1-/-plus huPINK1 population. Similar cell cycle defects have been described for SV40LT-immortalized mouse embryonic fibroblasts lacking PINK1 (20), showing that mitotic defects due to PINK1 loss are not limited to RasG12D-transformed cells. However, the mechanisms of mitotic arrest may be different in RasG12D expressing cells, because cellular signaling and context not only influences mitochondrial dynamics but also determines the consequences of abnormal mitochondrial dynamics on cell proliferation and death (59). Consistent with the cell cycle defects, p16, p21, and p53 were elevated in PINK1-deficient MEF cells. PINK1 overexpression rescued impaired mitochondrial fission and reversed cell cycle deficits, consistent with the importance of mitochondrial dynamics for cell cycle regulation (31, 43, 54, 59, 60). Taken together, these results suggest that aberrant mitochondrial dynamics due to impaired phosphorylation of Drp1 and associated cell cycle and cell survival defects may be primary mechanisms underlying reduced tumor cell growth in PINK1-/- MEF cells (Figure 8).
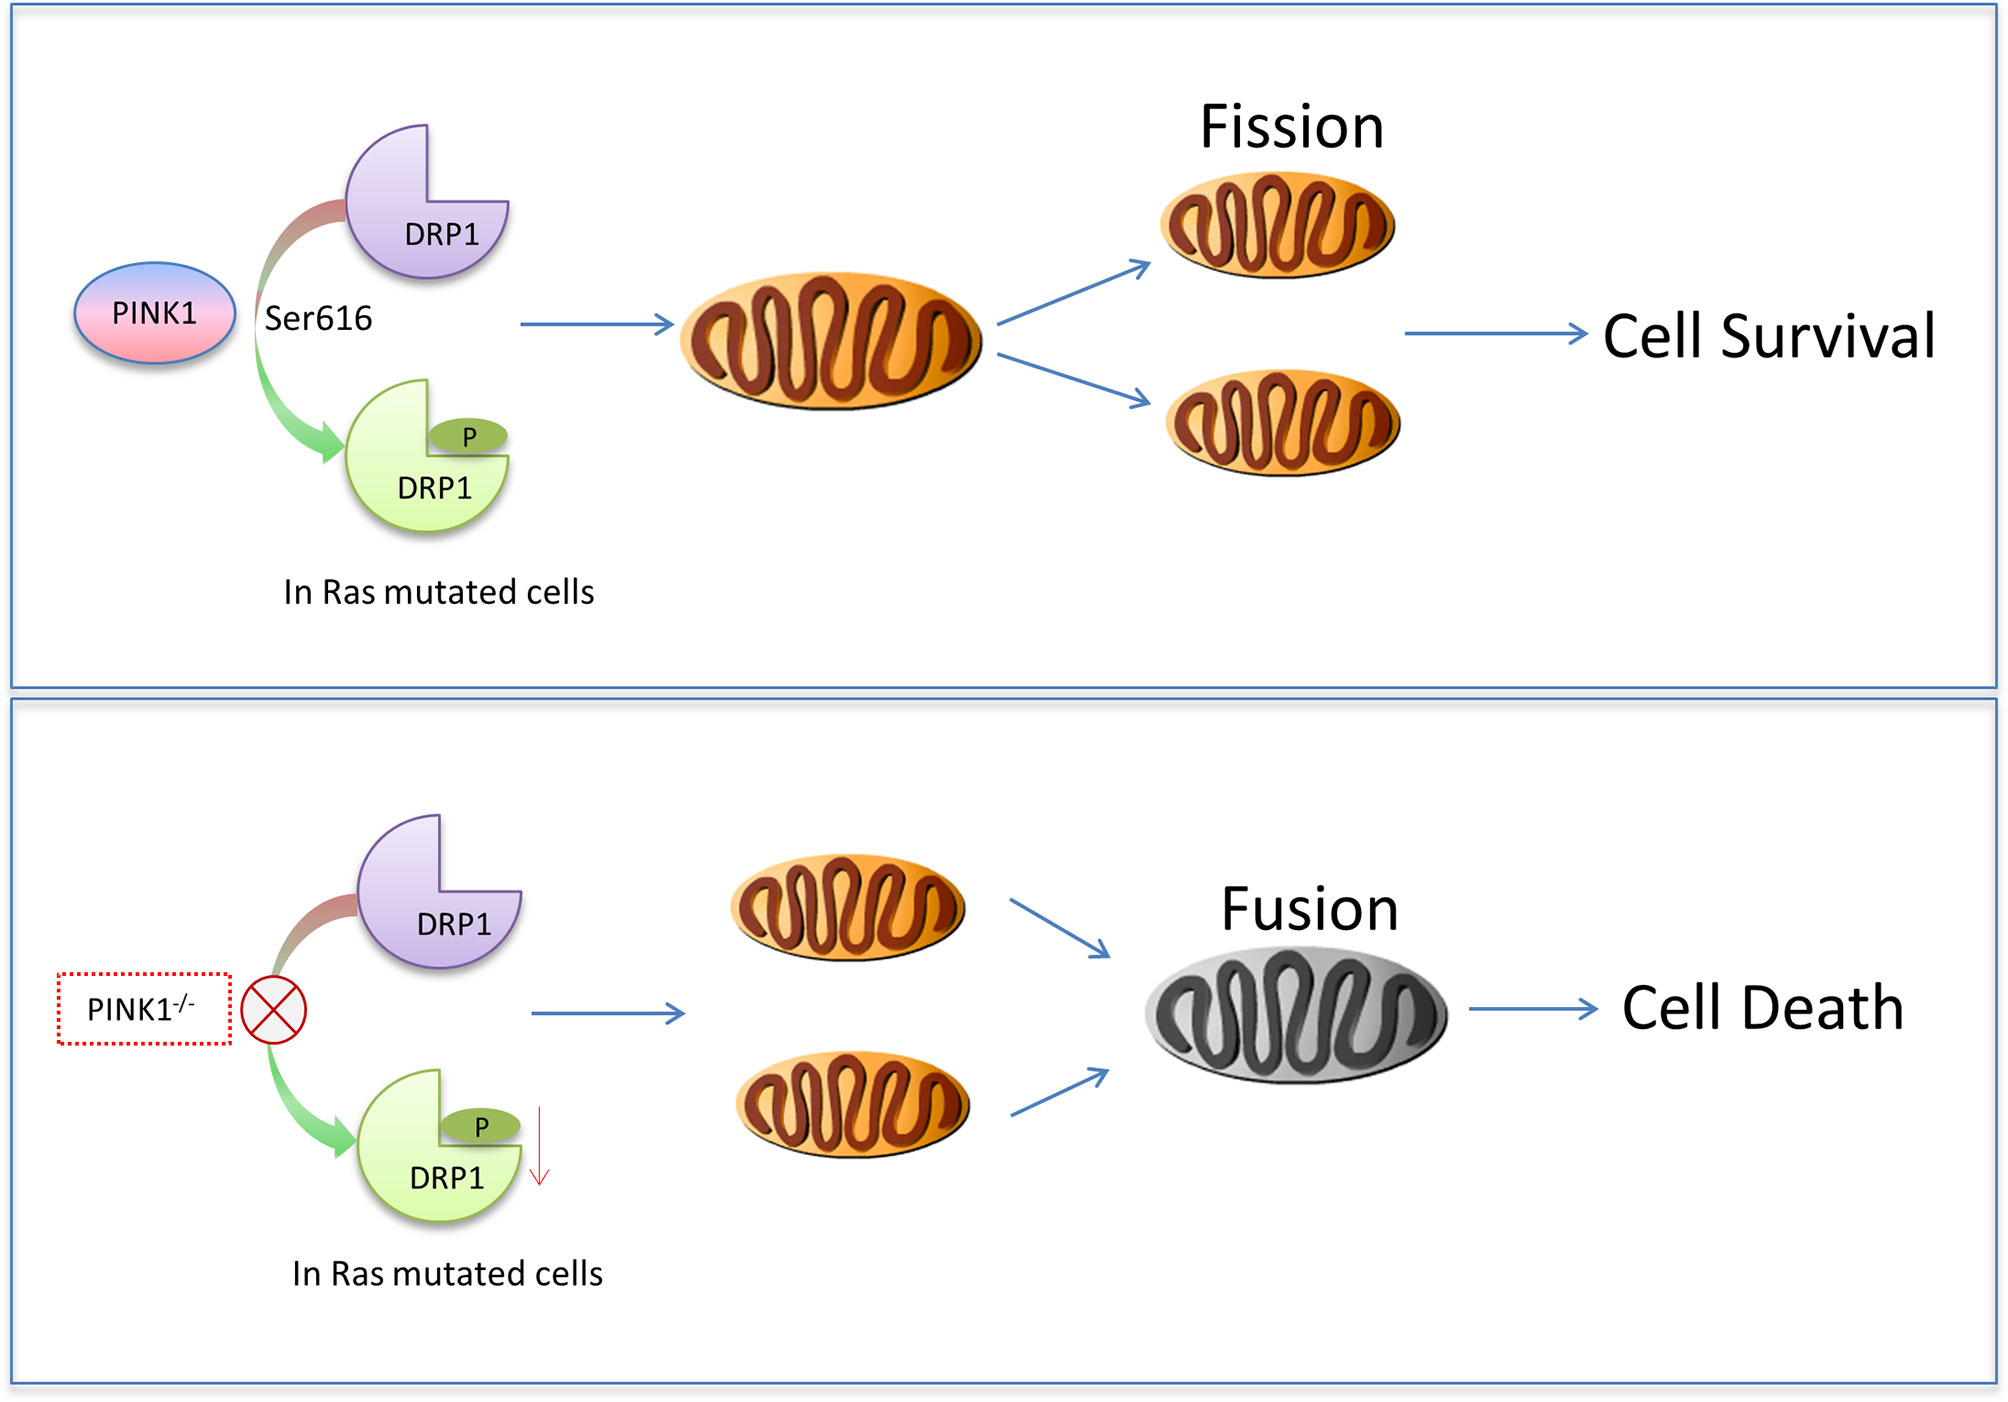
Figure 8 Model of how PINK1 may cause cell death in mutant Ras-transformed tumor cells. In cells with Ras mutations that contain endogenous PINK1, Drp1 S616 is phosphorylated for mitochondrial fission to promote cell survival. When PINK1 was absent, Drp1 S616 was not phosphorylated, more mitochondrial fusion occurred, and cells with Ras mutation died more.
It should be noted that in the human colon cancer cell line HCT116, deletion of PINK1 mainly increased apoptosis of tumor cells but had no effect on G2/M cell cycle arrest. In contrast, PINK1-deficient Ras-transformed MEFs showed increased necrosis, possibly through the aging pathway (62). Because HCT116 is a mature human tumor cell line, various pathways are likely different from those in Ras-transformed engineered MEFs.
Conclusions
Our results corroborate the importance of mitochondrial function and dynamics in promoting the growth of Ras-dependent tumors and provide insights into possible mechanisms underlying the lower incidence of cancers in Parkinson’s disease and other neurodegenerative disorders. Because a single inhibitor or antineoplastic agent against PINK1 has great limitations, future studies are warranted and necessary to determine whether reducing PINK1 expression, especially in combination with chemical anti-tumor agents (63–66), could constitute a viable approach to combat mutant Ras-induced and other types of cancers. In addition, although our work does not place PINK1 in a Ras-dependent transformation pathway, separate projects addressing such a possibility with additional transformed tumor models may be interesting.
Experimental Procedures
Animals
PINK1-/- mice have been described previously (34) and were backcrossed for at least 15 generations onto the pure C57BL/6J background. Male nude mice (BALB/c-nu, 4-6 weeks old) were purchased from Beijing Vital River Laboratory Animal Technology, China. Animal experiments were performed according to the “Guide for the Care and Use of Laboratory Animals”, 8th Edition, 2011 (The National Academic Press, Washington, and D.C.) and approved by the Institutional Animal Care and Use Committee/Animal Experimentation Ethics Committee of the Harbin Institute of Technology (HIT-IACUC).
Oligonucleotides, Antibodies and Tissue Culture Media
Oligonucleotides (Table S1) and antibodies (Table S2) are listed in Supporting Information. We used antibodies at the manufacturer-recommended concentrations, and obtained tissue culture media, trypsin and phosphate-buffered saline (PBS) from Thermo Fisher and fetal bovine serum (FBS) from JYK Biotechnology, China.
Construction and Production of Recombinant Viral Vectors
Retroviral vectors expressing SV40LT, EGFP and human K-RasG12D were based on the vector SFG-MCS, a derivative of the plasmid MFG (67). To generate recombinant retroviruses, we transfected 10 μg viral vector DNA per 6-cm plate into PlatE packaging cells (68) using the calcium phosphate co-precipitation method. To produce lentiviral particles for PINK1 re-expression, we inserted the human PINK1 coding sequence into the lentiviral vector pLVSIN-CMV-Pur (Takara Biotech) and co-transfected 293T cells in 6-cm plates with 5 μg lentiviral vector plasmid, 3.33 μg HIV gag/pol expression plasmid psPAX2 (Addgene #12260) and 1.67 μg VSV-G expression plasmid pMD2.G (Addgene # 12259) (3:2:1 ratio). Viral particles in the medium were collected 24 and 48 hours after transfection, passed through a 0.45 μm filter and stored at -80°C.
Generation of RasG12D-Transformed MEF Tumor Clones and Populations
We isolated mouse embryonic fibroblasts (MEFs) from E14.5 stage embryos of WT and PINK1-/- mice as described (69). For immortalization, we infected MEFs with SFG-SV40LT retrovirus in the presence of 4 μg/ml polybrene (Sigma H9268). The immortalized phenotype was confirmed by unlimited passage ability, in contrast to MEFs infected with SFG-EGFP retrovirus that stopped dividing several passages after infection. For transformation, we infected SV40LT-immortalized MEFs twice separated by 24 hours with SFG-RasG12D retrovirus in presence of 4 μg/ml polybrene to yield a RasG12D-transformed population. Individual RasG12D transformed tumor clones were obtained by limiting dilution in 96-well plates. To express human PINK1 in mouse PINK1-deficient RasG12D-transformed cells, we infected cells with the pLVSIN-PINK1-Pur lentiviral vector and selected stably transduced cells by growth in medium containing 2 μg/ml puromycin (Sigma P8833).
CRISPR/Cas9-Mediated Generation and Characterization of PINK1-Deficient HCT116 Tumor Cells
HCT116 cells were obtained from American Type Culture Collection (ATTC, CCL-247). We used a modified version of the CRISPR-Cas9 plasmid pSpCas9(BB)-2A-GFP (PX458) (Addgene 48138) that was engineered to contain a puromycin expression cassette and BbsI and BsaI cloning sites for insertion of two double-stranded oligonucleotides encoding different sgRNAs. The oligonucleotides encoding sgRNAs targeting two sites in PINK1 exon 1 are shown in Table S1. After transfecting the CRISPR/Cas9 PINK1 targeting vector into HCT116 cells, puromycin-resistant (2 μg/ml) single clones were obtained by limiting dilution. Genomic DNA from clones was PCR-amplified with primers PINK1-KO-screen-fw and PINK1-KO-screen-rev to identify clones that produced a single, shorter PCR product compared to wildtype genomic DNA (Figure S3B). PCR products from such clones were sequenced and the sequences aligned with the human PINK1 gene (gene ID: 65018) to determine the exact PINK1 deletions in different HCT116 PINK1-knockout clones (Figure S3C). The two CRISPR target sites, clone-specific deletions and PCR primers used to identify PINK1-knockout clones are indicated in Table S1. In all clones, the deletions resulted in severely truncated proteins containing only 72 to 113 N-terminal amino acids before running into a premature stop codon, thereby lacking the entire PINK1 kinase domain. To analyze deletions in PINK1 mRNA, cDNA was synthesized from total RNA (Prime Script cDNA kit, Takara Bio) and PCR-amplified with two different primer pairs (fw-1/rev-1 and fw-1/rev2) flanking the deletions (Figure S4A).
Growth of Tumor Cells in Soft Agar and Tissue Culture
Cells were grown in DMEM with 10% FBS. Before the soft agar assay, 1.5x10⁴ cells were resuspended in 0.35% low-melting point agarose (Sigma) in DMEM/10% FBS and plated into triplicate wells of a 6-well plate containing a 2 ml base agarose layer (0.7%). After 8-10 days, images of cells were taken with a Nikon inverted microscope at 200x magnification. Three random images per well were captured at different soft agar depths (9 images total), and the colony areas were measured with Image J software (imagej.nih.gov/ij). To measure the growth of HCT116 tumor clones in tissue culture, we plated 104 cells per clone and well (in triplicate wells) and measured cell numbers with the sulforhodamine B assay (70) over a period of 5 days. The average OD534 from three wells was statistically compared between PINK-1 deficient and control tumor clones using 2-way ANOVA.
Growth of Tumor Cells in Nude Mice
Cells were detached with trypsin, resuspended in DMEM/10% FBS and centrifuged for 5 min at 500 x g. The cell pellet was washed twice in PBS and cells were counted in a hemocytometer (four big squares). Cell density was adjusted to 1.25x10⁷ or 2.5x10⁷ cells/ml, and 200 μl of cell suspension (2.5x10⁶ or 5x10⁶ cells, matched for all genotypes) was injected subcutaneously into mice. Tumor growth was monitored starting at 7 days and dimensions of tumors were measured with a caliper at the days indicated in the figures. Tumor volumes (in mm3) were calculated as length x width2 x 0.5 (width being the smaller dimension) and compared using two-way ANOVA. At the end of the experiment mice were euthanized by CO2 inhalation.
Quantification of SV40LT mRNA With Real-Time qPCR
Cellular RNA was isolated with Trizol reagent, and first strand cDNA synthesized with the Prime Script RT kit (Takara Inc.) from 500 ng total RNA. Two μl of the resulting cDNA (5-fold dilution) was subjected to real-time PCR using SYBR Premix Ex Taq II (Tli RNase H Plus) master mix (Takara Inc). PCR primers are listed in Table S1. Melting curve analysis was done to confirm single PCR products. We used the 2-ΔCt method (71) to calculate mRNA expression of each gene relative to 18S rRNA.
Quantification of Proteins by Western Blots
Cells were lysed in modified RIPA buffer (50 mM Tris-HCl pH 8.0, 1 % Triton X-100, 0.1 % SDS, 0.14 M NaCl, 1 mM EDTA, and 1 mM EGTA) containing 1% (v/v) protease inhibitor cocktail and - where appropriate - phosphatase inhibitor cocktail (Amresco). 20-30 μg total proteins in the cleared lysates (supernatants of 10 min, 12,000 x g centrifugation) were analyzed by standard Western blot procedures. Secondary antibodies were conjugated to fluorophores or HRP, and protein bands were detected with the Odyssey Infrared Imaging System (Li-COR) or the enhanced chemiluminescence imager. Protein bands were quantified using Image J software (imagej.nih.gov/ij). Three to four independent cell lysates (prepared at different passage numbers) of each genotype (MEF population) and the indicated number of WT and PINK1-deficient cell clones were analyzed and used for statistical evaluation.
Flow Cytometry
To measure expression of total Drp1 and phospho-Drp1 (Ser616) by flow cytometry, 5x10⁵ cells were fixed in 4% PFA for 30 min and centrifuged at 500 x g for 5 min. The cell pellet was gently resuspended and incubated in 100 μl PBS/0.2% Triton X-100 for 10 min, washed with PBS, and the cells were incubated with primary antibody diluted in PBS/0.05% Tween-20 (PBST) for 1 hour at RT (antibody dilutions as recommended by the manufacturer). After washing twice in PBST, the cells were incubated for 30 min with 1:400-diluted Cy3-conjugated secondary antibody, followed by a final wash and re-suspension in PBST before flow cytometry. To determine background fluorescence and set the fluorescence window for positive cells (M1), control cells were incubated with secondary antibody only. N=4 independent antibody incubations/flow cytometry experiments were carried out with each genotype/cell population for statistical analysis. To measure the mitochondrial membrane potential Δψm, cells were incubated with 50 nM TMRE for 30 min at 37°C. Δψm was compared between groups of WT and PINK1-/- cells, where the groups were comprised of individual cell clones and the cell population for each genotype (n=3-4 clones/populations per genotype, each clone and population measured in triplicate). Mitochondrial ROS were measured in WT, PINK1-/- and PINK1-/-plus huPINK1 (human PINK1-overexpressing) cell populations incubated for 30 min at 37°C with 2.5 μM MitoSOX Red (ThermoFisher M36008) (n=3 dye incubations/flow cytometry experiments per genotype/population). Negative control cells were incubated in buffer without TMRE or MitoSOX to determine background fluorescence and set the window for positive cells (M1). Fluorescence (FL2-H) was measured with the BD FACSCalibur using a 585/42 nm band pass emission filter, and the mean fluorescence of the cells in the positive window (M1) was compared between genotypes/cell populations.
Analysis of Mitochondrial Morphology
For analysis of mitochondrial network morphology, cells (4x10⁵/35-mm plate) grown on cover glasses were washed with PBS, fixed in 4% PFA and mitochondria were stained by immunocytochemistry with anti-LRP130 antibody and Cy3-conjugated secondary IgG. LRP130 is exclusively expressed in mitochondria (41). Nuclei were visualized with DAPI. The percentage of cells with various mitochondrial morphologies was analyzed in a blinded manner using 15 random confocal images per genotype (87-243 cells; 5-13 images from 3 cover glasses), taken with 40x objective and digitally enlarged 3x for analysis using Image J software. Cells with mostly (>80-90%) small and spherical (fragmented) mitochondria were classified as having a “fragmented” mitochondrial network, cells with appreciable proportions (>40-50%) of elongated/fused mitochondria that also contained fragmented mitochondria were classified as “intermediate”, and cells with mostly (>80-90%) elongated/fused mitochondria were classified as “elongated/fused".
Cell Cycle Analysis
Cells (105/cm2) were grown for 48 hours before being collected by trypsinization and resuspended in ice-cold 70% ethanol for fixation (1 hour on ice). Fixed cells were centrifuged (400 x g for 5 min), washed once with 2 ml PBS and centrifuged again. The final cell pellet was resuspended in PBS containing 1:10 diluted propidium iodide/RNase A solution (Sungene Biotech, China), and cells were incubated for 30 min at RT and protected from light. Cells were analyzed by flow cytometry (FACSCalibur, Becton Dickinson) and data files were imported into FCS Express 6.0 Plus software (De Novo software, Glendale, CA). For processing and quantification, the main cell population was gated in the FSC vs. SSC plot. Within the main population, cell debris and aggregated cells were excluded by gating on single cells in the FL2-A vs. FL2-W plot. Markers for G0/G1, S and G2/M phases were placed in the FL2-A vs. cell count plot of WT RasG12D-transformed cells, and the same markers were used for all other cell samples.
Immunohistochemical Analysis
Tumor tissues dissected from nude mice fixed with 10% formalin, and embedded in paraffin. The tissue sample was subjected to antigen retrieval by boiling in 0.01 mol/L citrate buffer for 5 min. Slides were then incubated with anti-RasG12D or anti-Ki-67 antibody at 4°C. for the night. Slides were then washed with PBS, fixed with 10% formalin and provided for staining. Detection was carried out by the REAL EnVision detection system (Dako) with diaminobenzidine peroxidase serving as chromogen. Images were collected, and were de-interfered and then quantitatively analyzed for gray values using Image J software.
Caspase 3/7 Activity Apoptosis Assay
The apoptotic rates were evaluated by Caspase-Glo® 3/7 Assay kit (Promega, G8090). Briefly, the tumor tissues were harvested in urea buffer (2M Thiourea, 4% CHAPS, 40mM Tris-Base, 40mM DTT, 2% Pharmalyte) and sonicated to crush DNA. The same amount of tumor tissues protein lysates (500μg) was transfer into the 96-well cell culture plate. Caspase 3/7 activity assay was repeated independently for three times according to its manufacturer’s instructions, which was represented as a fold-increase of fluorescence calculated by comparing to vector groups.
Ras Activation Assay
The small GTPase activity of Ras was measured using the Ras activation assay Biochem kit (cytoskeleton #BK008). Cells were harvested with cell lysis buffer (50 mM Tris pH 7.5, 10 mM MgCl2, 0.5 M NaCl, and 2% Igepal when reconstituted) contains 1×Protease Inhibitor Cocktail on ice. The resulting protein lystates were immediately clarified by centrifugation at 10,000 rpm, for 2 min at 4°C and protein concentrations were determined by Bradford kit. After that, 400ug of protein lysates was incubated with Raf-RBD beads (Cat. # RF02) on a rotator at 4°C for 1h. The Raf-RBD beads were pelleted by centrifugation at 3-5,000 × g for 1 min at 4°C. 90% of the supernatant was carefully removed and the beads were washed once with 500μl Wash Buffer. The Raf-RBD beads were pelleted again by centrifugation at 3,000xg for 3 min at 4°C. The supernatant was carefully removed without disturbing the beads. 20 μl of 2×Laemmli sample buffer was added into each tube and the beads were boiled for 2 min. Then resulting lysates were subjected to the following western blot analysis of Ras.
Quantification of Cell Death (Apoptosis and Necrosis)
Apoptotic and necrotic cells were detected by the Annexin V-FITC apoptosis analysis kit (Tianjin Sungene Biotech, China). Different genotypes of cells density were adjusted to 5 × 10⁶ cells/ml. About 100 μl cell suspension was incubated with 2.5 μl AnnexinV/FITC for 10 min and then 2.5 μl PI for 5 min at room temperature in dark. The rate of apoptosis was measured by flow cytometry (BD Pharmingen).
Statistics
Statistics was performed with Prism 9.0 software (Graph Pad). All data are presented as mean ± SD, except tumor volumes in nude mice, which are shown as mean ± SEM. Two groups were compared by unpaired t-test, and three or more groups were compared by ANOVA and Tukey’s multiple comparisons test. Two-way ANOVA with Sidak’s multiple comparisons test was used to compare tumor growth in nude mice and the growth of WT and PINK1-knockout HCT116 clones in culture. Differences were considered significant at P<0.05.
Data Availability Statement
The original contributions presented in the study are included in the article/Supplementary Material. Further inquiries can be directed to the corresponding authors.
Ethics Statement
The animal study was reviewed and approved by Harbin Institute of Technology.
Author Contributions
DZ contributed to the main experimental data. MEF immortalized cell lines were prepared by FH and LS provided immunofluorescence images. SA assisted tumor injection and dissection in nude mice. YH and HB are my supervisors, who supervised the overall development of this manuscript and provided funds and laboratory support. All authors contributed to the article and approved the submitted version.
Funding
This work was supported by a grant from the China National Science Foundation (31970715) to HB.
Conflict of Interest
The authors declare that the research was conducted in the absence of any commercial or financial relationships that could be construed as a potential conflict of interest.
Publisher’s Note
All claims expressed in this article are solely those of the authors and do not necessarily represent those of their affiliated organizations, or those of the publisher, the editors and the reviewers. Any product that may be evaluated in this article, or claim that may be made by its manufacturer, is not guaranteed or endorsed by the publisher.
Acknowledgments
The CRISPR targeting plasmid was a kind gift of Professor Qiong Wu from the School of Life Science and Technology, Harbin Institute of Technology.
Supplementary Material
The Supplementary Material for this article can be found online at: https://www.frontiersin.org/articles/10.3389/fonc.2022.893396/full#supplementary-material
References
1. Driver JA. Inverse Association Between Cancer and Neurodegenerative Disease: Review of the Epidemiologic and Biological Evidence. Biogerontology (2014) 15:547–57. doi: 10.1007/s10522-014-9523-2
2. Catala-Lopez F, Suarez-Pinilla M, Suarez-Pinilla P, Valderas JM, Gomez-Beneyto M, Martinez S, et al. Inverse and Direct Cancer Comorbidity in People With Central Nervous System Disorders: A Meta-Analysis of Cancer Incidence in 577,013 Participants of 50 Observational Studies. Psychother Psychosom (2014) 83:89–105. doi: 10.1159/000356498
3. Agalliu I, San Luciano M, Mirelman A, Giladi N, Waro B, Aasly J, et al. Higher Frequency of Certain Cancers in LRRK2 G2019S Mutation Carriers With Parkinson Disease: A Pooled Analysis. JAMA Neurol (2015) 72:58–65. doi: 10.1001/jamaneurol.2014.1973
4. Hu HH, Kannengiesser C, Lesage S, Andre J, Mourah S, Michel L, et al. PARKIN Inactivation Links Parkinson’s Disease to Melanoma. J Natl Cancer Inst (2016) 108(3):1–8. doi: 10.1093/jnci/djv340
5. Matsuo Y, Kamitani T. Parkinson’s Disease-Related Protein, Alpha-Synuclein, in Malignant Melanoma. PloS One (2010) 5:e10481. doi: 10.1371/journal.pone.0010481
6. Kim YC, Kitaura H, Iguchi-Ariga SM, Ariga H. DJ-1, an Oncogene and Causative Gene for Familial Parkinson’s Disease, Is Essential for SV40 Transformation in Mouse Fibroblasts Through Up-Regulation of C-Myc. FEBS Lett (2010) 584:3891–5. doi: 10.1016/j.febslet.2010.08.010
7. Clements CM, McNally RS, Conti BJ, Mak TW, Ting JP. DJ-1, a Cancer- and Parkinson’s Disease-Associated Protein, Stabilizes the Antioxidant Transcriptional Master Regulator Nrf2. Proc Natl Acad Sci USA (2006) 103:15091–6. doi: 10.1073/pnas.0607260103
8. Cesari R, Martin ES, Calin GA, Pentimalli F, Bichi R, McAdams H, et al. Parkin, a Gene Implicated in Autosomal Recessive Juvenile Parkinsonism, is a Candidate Tumor Suppressor Gene on Chromosome 6q25-Q27. Proc Natl Acad Sci USA (2003) 100:5956–61. doi: 10.1073/pnas.0931262100
9. da Costa CA, Checler F. A Novel Parkin-Mediated Transcriptional Function Links P53 to Familial Parkinson’s Disease. Cell Cycle (2010) 9:16–7. doi: 10.4161/cc.9.1.10420
10. Valente EM, Abou-Sleiman PM, Caputo V, Muqit MM, Harvey K, Gispert S, et al. Hereditary Early-Onset Parkinson’s Disease Caused by Mutations in PINK1. Science (2004) 304:1158–60. doi: 10.1126/science.1096284
11. Narendra DP, Jin SM, Tanaka A, Suen DF, Gautier CA, Shen J, et al. PINK1 Is Selectively Stabilized on Impaired Mitochondria to Activate Parkin. PloS Biol (2010) 8:e1000298. doi: 10.1371/journal.pbio.1000298
12. Lazarou M, Sliter DA, Kane LA, Sarraf SA, Wang C, Burman JL, et al. The Ubiquitin Kinase PINK1 Recruits Autophagy Receptors to Induce Mitophagy. Nature (2015) 524:309–14. doi: 10.1038/nature14893
13. Wang X, Winter D, Ashrafi G, Schlehe J, Wong YL, Selkoe D, et al. PINK1 and Parkin Target Miro for Phosphorylation and Degradation to Arrest Mitochondrial Motility. Cell (2011) 147:893–906. doi: 10.1016/j.cell.2011.10.018
14. Yu W, Sun Y, Guo S, Lu B. The PINK1/Parkin Pathway Regulates Mitochondrial Dynamics and Function in Mammalian Hippocampal and Dopaminergic Neurons. Hum Mol Genet (2011) 20:3227–40. doi: 10.1093/hmg/ddr235
15. Morais VA, Haddad D, Craessaerts K, De Bock PJ, Swerts J, Vilain S, et al. PINK1 Loss-of-Function Mutations Affect Mitochondrial Complex I Activity via NdufA10 Ubiquinone Uncoupling. Science (2014) 344:203–7. doi: 10.1126/science.1249161
16. Pridgeon JW, Olzmann JA, Chin LS, Li L. PINK1 Protects Against Oxidative Stress by Phosphorylating Mitochondrial Chaperone TRAP1. PloS Biol (2007) 5:e172. doi: 10.1371/journal.pbio.0050172
17. Zhang R, Gu J, Chen J, Ni J, Hung J, Wang Z, et al. High Expression of PINK1 Promotes Proliferation and Chemoresistance of NSCLC. Oncol Rep (2017) 37:2137–46. doi: 10.3892/or.2017.5486
18. Agnihotri S, Golbourn B, Huang X, Remke M, Younger S, Cairns RA, et al. PINK1 Is a Negative Regulator of Growth and the Warburg Effect in Glioblastoma. Cancer Res (2016) 76:4708–19. doi: 10.1158/0008-5472.CAN-15-3079
19. Yamashita K, Miyata H, Makino T, Masuike Y, Furukawa H, Tanaka K, et al. High Expression of the Mitophagy-Related Protein Pink1 is Associated With a Poor Response to Chemotherapy and a Poor Prognosis for Patients Treated With Neoadjuvant Chemotherapy for Esophageal Squamous Cell Carcinoma. Ann Surg Oncol (2017) 24:4025–32. doi: 10.1245/s10434-017-6096-8
20. O’Flanagan CH, Morais VA, Wurst W, De Strooper B, O’Neill C. The Parkinson’s Gene PINK1 Regulates Cell Cycle Progression and Promotes Cancer-Associated Phenotypes. Oncogene (2015) 34:1363–74. doi: 10.1038/onc.2014.81
21. Li GB, Fu RQ, Shen HM, Zhou J, Hu XY, Liu YX, et al. Polyphyllin I Induces Mitophagic and Apoptotic Cell Death in Human Breast Cancer Cells by Increasing Mitochondrial PINK1 Levels. Oncotarget (2017) 8:10359–74. doi: 10.18632/oncotarget.14413
22. Chang G, Zhang W, Ma Y, Wen Q. PINK1 Expression Is Associated With Poor Prognosis in Lung Adenocarcinoma. Tohoku J Exp Med (2018) 245:115–21. doi: 10.1620/tjem.245.115
23. Lu X, Liu QX, Zhang J, Zhou D, Yang GX, Li MY, Dai JG, et al. PINK1 Overexpression Promotes Cell Migration and Proliferation via Regulation of Autophagy and Predicts a Poor Prognosis in Lung Cancer Cases. Cancer Manage Res (2020) 12:7703–14. doi: 10.2147/CMAR.S262466
24. Dai K, Radin DP, Leonardi D. Deciphering the Dual Role and Prognostic Potential of PINK1 Across Cancer Types. Neural Regen Res (2021) 16:659–65. doi: 10.4103/1673-5374.295314
25. Frattaruolo L, Brindisi M, Curcio R, Marra F, Dolce V, Cappello AR. Targeting the Mitochondrial Metabolic Network: A Promising Strategy in Cancer Treatment. Int J Mol Sci (2020) 21(17):6014. doi: 10.3390/ijms21176014
26. Ghosh P, Vidal C, Dey S, Zhang L. Mitochondria Targeting as an Effective Strategy for Cancer Therapy. Int J Mol Sci (2020) 21(9):3363. doi: 10.3390/ijms21093363
27. Pylayeva-Gupta Y, Grabocka E, Bar-Sagi D. RAS Oncogenes: Weaving a Tumorigenic Web. Nat Rev Cancer (2011) 11:761–74. doi: 10.1038/nrc3106
28. Karnoub AE, Weinberg RA. Ras Oncogenes: Split Personalities. Nat Rev Mol Cell Biol (2008) 9:517–31. doi: 10.1038/nrm2438
29. Weinberg F, Hamanaka R, Wheaton WW, Weinberg S, Joseph J, Lopez M, et al. Mitochondrial Metabolism and ROS Generation are Essential for Kras-Mediated Tumorigenicity. Proc Natl Acad Sci USA (2010) 107:8788–93. doi: 10.1073/pnas.1003428107
30. Chiaradonna F, Gaglio D, Vanoni M, Alberghina L. Expression of Transforming K-Ras Oncogene Affects Mitochondrial Function and Morphology in Mouse Fibroblasts. Biochim Biophys Acta (2006) 1757(9-10):1338–56. doi: 10.1016/j.bbabio.2006.08.001
31. Serasinghe MN, Wieder SY, Renault TT, Elkholi R, Asciolla JJ, Yao JL, et al. Mitochondrial Division Is Requisite to RAS-Induced Transformation and Targeted by Oncogenic MAPK Pathway Inhibitors. Mol Cell (2015) 57:521–36. doi: 10.1016/j.molcel.2015.01.003
32. Yamano K, Youle RJ. PINK1 is Degraded Through the N-End Rule Pathway. Autophagy (2013) 9:1758–69. doi: 10.4161/auto.24633
33. Jin SM, Lazarou M, Wang C, Kane LA, Narendra DP, Youle RJ. Mitochondrial Membrane Potential Regulates PINK1 Import and Proteolytic Destabilization by PARL. J Cell Biol (2010) 191:933–42. doi: 10.1083/jcb.201008084
34. Akundi RS, Huang Z, Eason J, Pandya JD, Zhi L, Cass WA, et al. Increased Mitochondrial Calcium Sensitivity and Abnormal Expression of Innate Immunity Genes Precede Dopaminergic Defects in Pink1-Deficient Mice. PloS One (2011) 6:e16038. doi: 10.1371/journal.pone.0016038
35. Deng H, Dodson MW, Huang H, Guo M. The Parkinson’s Disease Genes Pink1 and Parkin Promote Mitochondrial Fission and/or Inhibit Fusion in Drosophila. Proc Natl Acad Sci USA (2008) 105:14503–8. doi: 10.1073/pnas.0803998105
36. Gegg ME, Cooper JM, Chau KY, Rojo M, Schapira AH, Taanman JW. Mitofusin 1 and Mitofusin 2 are Ubiquitinated in a PINK1/parkin-Dependent Manner Upon Induction of Mitophagy. Hum Mol Genet (2010) 19:4861–70. doi: 10.1093/hmg/ddq419
37. Pryde KR, Smith HL, Chau KY, Schapira AH. PINK1 Disables the Anti-Fission Machinery to Segregate Damaged Mitochondria for Mitophagy. J Cell Biol (2016) 213:163–71. doi: 10.1083/jcb.201509003
38. Poole AC, Thomas RE, Andrews LA, McBride HM, Whitworth AJ, Pallanck LJ. The PINK1/Parkin Pathway Regulates Mitochondrial Morphology. Proc Natl Acad Sci USA (2008) 105:1638–43. doi: 10.1073/pnas.0709336105
39. Garza-Lombo C, Pappa A, Panayiotidis MI, Franco R. Redox Homeostasis, Oxidative Stress and Mitophagy. Mitochondrion (2020) 51:105–17. doi: 10.1016/j.mito.2020.01.002
40. Akundi RS, Zhi L, Sullivan PG, Bueler H. Shared and Cell Type-Specific Mitochondrial Defects and Metabolic Adaptations in Primary Cells From PINK1-Deficient Mice. Neuro-Degener Dis (2013) 12:136–49. doi: 10.1159/000345689
41. Sterky FH, Ruzzenente B, Gustafsson CM, Samuelsson T, Larsson NG. LRPPRC is a Mitochondrial Matrix Protein That Is Conserved in Metazoans. Biochem Biophys Res Commun (2010) 398:759–64. doi: 10.1016/j.bbrc.2010.07.019
42. Han H, Tan J, Wang R, Wan H, He Y, Yan X, et al. PINK1 Phosphorylates Drp1(S616) to Regulate Mitophagy-Independent Mitochondrial Dynamics. EMBO Rep (2020) 21:e48686. doi: 10.15252/embr.201948686
43. Kashatus JA, Nascimento A, Myers LJ, Sher A, Byrne FL, Hoehn KL, et al. Erk2 Phosphorylation of Drp1 Promotes Mitochondrial Fission and MAPK-Driven Tumor Growth. Mol Cell (2015) 57:537–51. doi: 10.1016/j.molcel.2015.01.002
44. Knott AB, Perkins G, Schwarzenbacher R, Bossy-Wetzel E. Mitochondrial Fragmentation in Neurodegeneration. Nat Rev Neurosci (2008) 9:505–18. doi: 10.1038/nrn2417
45. Tailor D, Hahm ER, Kale RK, Singh SV, Singh RP. Sodium Butyrate Induces DRP1-Mediated Mitochondrial Fusion and Apoptosis in Human Colorectal Cancer Cells. Mitochondrion (2014) 16:55–64. doi: 10.1016/j.mito.2013.10.004
46. Prasad P, Ghosh S, Roy SS. Glutamine Deficiency Promotes Stemness and Chemoresistance in Tumor Cells Through DRP1-Induced Mitochondrial Fragmentation. Cell Mol Life Sci (2021) 78:4821–45. doi: 10.1007/s00018-021-03818-6
47. O’Flanagan CH, Morais VA, Wurst W, De Strooper B, O’Neill C. The Parkinson’s Gene PINK1 Regulates Cell Cycle Progression and Promotes Cancer-Associated Phenotypes. Oncogene (2014) 34:1363–74. doi: 10.1038/onc.2014.81
48. Nagdas S, Kashatus JA, Nascimento A, Hussain SS, Trainor RE, Pollock SR, et al. Drp1 Promotes KRas-Driven Metabolic Changes to Drive Pancreatic Tumor Growth. Cell Rep (2019) 28:1845–59.e1845. doi: 10.1016/j.celrep.2019.07.031
49. Inoue-Yamauchi A, Oda H. Depletion of Mitochondrial Fission Factor DRP1 Causes Increased Apoptosis in Human Colon Cancer Cells. Biochem Biophys Res Commun (2012) 421:81–5. doi: 10.1016/j.bbrc.2012.03.118
50. Hu M, Zhao Y, Cao Y, Tang Q, Feng Z, Ni J, et al. DRP1 Promotes Lactate Utilization in KRAS-Mutant Non-Small-Cell Lung Cancer Cells. Cancer Sci (2020) 111:3588–99. doi: 10.1111/cas.14603
51. Vyas S, Zaganjor E, Haigis MC. Mitochondria and Cancer. Cell (2016) 166:555–66. doi: 10.1016/j.cell.2016.07.002
52. Palorini R, De Rasmo D, Gaviraghi M, Sala Danna L, Signorile A, Cirulli C, et al. Oncogenic K-Ras Expression is Associated With Derangement of the cAMP/PKA Pathway and Forskolin-Reversible Alterations of Mitochondrial Dynamics and Respiration. Oncogene (2013) 32:352–62. doi: 10.1038/onc.2012.50
53. Lin HH, Chung Y, Cheng CT, Ouyang C, Fu Y, Kuo CY, et al. Autophagic Reliance Promotes Metabolic Reprogramming in Oncogenic KRAS-Driven Tumorigenesis. Autophagy (2018) 14:1481–98. doi: 10.1080/15548627.2018.1450708
54. Taguchi N, Ishihara N, Jofuku A, Oka T, Mihara K. Mitotic Phosphorylation of Dynamin-Related GTPase Drp1 Participates in Mitochondrial Fission. J Biol Chem (2007) 282:11521–9. doi: 10.1074/jbc.M607279200
55. Smirnova E, Griparic L, Shurland DL, van der Bliek AM. Dynamin-Related Protein Drp1 Is Required for Mitochondrial Division in Mammalian Cells. Mol Biol Cell (2001) 12:2245–56. doi: 10.1091/mbc.12.8.2245
56. Chen Y, Dorn GW. PINK1-Phosphorylated Mitofusin 2 Is a Parkin Receptor for Culling Damaged Mitochondria. Science (2013) 340:471–5. doi: 10.1126/science.1231031
57. Poole AC, Thomas RE, Yu S, Vincow ES, Pallanck L. The Mitochondrial Fusion-Promoting Factor Mitofusin Is a Substrate of the PINK1/parkin Pathway. PloS One (2010) 5:e10054. doi: 10.1371/journal.pone.0010054
58. Rakovic A, Grunewald A, Kottwitz J, Bruggemann N, Pramstaller PP, Lohmann K, et al. Mutations in PINK1 and Parkin Impair Ubiquitination of Mitofusins in Human Fibroblasts. PloS One (2011) 6:e16746. doi: 10.1371/journal.pone.0016746
59. Mitra K. Mitochondrial Fission-Fusion as an Emerging Key Regulator of Cell Proliferation and Differentiation. BioEssays (2013) 35:955–64. doi: 10.1002/bies.201300011
60. Mitra K, Wunder C, Roysam B, Lin G, Lippincott-Schwartz J. A Hyperfused Mitochondrial State Achieved at G1-S Regulates Cyclin E Buildup and Entry Into S Phase. Proc Natl Acad Sci USA (2009) 106:11960–5. doi: 10.1073/pnas.0904875106
61. Tanwar DK, Parker DJ, Gupta P, Spurlock B, Alvarez RD, Basu MK, et al. Crosstalk Between the Mitochondrial Fission Protein, Drp1, and the Cell Cycle Is Identified Across Various Cancer Types and can Impact Survival of Epithelial Ovarian Cancer Patients. Oncotarget (2016) 7:60021–37. doi: 10.18632/oncotarget.11047
62. Coppe JP, Patil CK, Rodier F, Sun Y, Munoz DP, Goldstein J, et al. Senescence-Associated Secretory Phenotypes Reveal Cell-Nonautonomous Functions of Oncogenic RAS and the P53 Tumor Suppressor. PloS Biol (2008) 6:2853–68. doi: 10.1371/journal.pbio.0060301
63. Dai K, Radin DP, Leonardi D. PINK1 Depletion Sensitizes non-Small Cell Lung Cancer to Glycolytic Inhibitor 3-Bromopyruvate: Involvement of ROS and Mitophagy. Pharmacol Rep: PR (2019) 71:1184–9. doi: 10.1016/j.pharep.2019.08.002
64. Takeda M, Koseki J, Takahashi H, Miyoshi N, Nishida N, Nishimura J, et al. Disruption of Endolysosomal RAB5/7 Efficiently Eliminates Colorectal Cancer Stem Cells. Cancer Res (2019) 79:1426–37. doi: 10.1158/0008-5472.CAN-18-2192
65. Villa E, Proics E, Rubio-Patino C, Obba S, Zunino B, Bossowski JP, et al. Parkin-Independent Mitophagy Controls Chemotherapeutic Response in Cancer Cells. Cell Rep (2017) 20:2846–59. doi: 10.1016/j.celrep.2017.08.087
66. Yao N, Wang C, Hu N, Li Y, Liu M, Lei Y, et al. Inhibition of PINK1/Parkin-Dependent Mitophagy Sensitizes Multidrug-Resistant Cancer Cells to B5G1, a New Betulinic Acid Analog. Cell Death Dis (2019) 10:232. doi: 10.1038/s41419-019-1470-z
67. Ory DS, Neugeboren BA, Mulligan RC. A Stable Human-Derived Packaging Cell Line for Production of High Titer Retrovirus/Vesicular Stomatitis Virus G Pseudotypes. Proc Natl Acad Sci USA (1996) 93:11400–6. doi: 10.1073/pnas.93.21.11400
68. Morita S, Kojima T, Kitamura T. Plat-E: An Efficient and Stable System for Transient Packaging of Retroviruses. Gene Ther (2000) 7:1063–6. doi: 10.1038/sj.gt.3301206
69. A, E. M. Isolation and Propagation of Mouse Embryonic Fibroblasts and Preparation of Mouse Embryonic Feeder Layer Cells. Curr Protoc Stem Cell Biol (2007). 3(1):1C–3, Chapter 1, Unit1C 3. doi: 10.1002/9780470151808.sc01c03s3
70. Vichai V, Kirtikara K. Sulforhodamine B Colorimetric Assay for Cytotoxicity Screening. Nat Protoc (2006) 1:1112–6. doi: 10.1038/nprot.2006.179
Keywords: PTEN-induced kinase-1 (PINK1), mitochondrial metabolism, mitochondrial dynamics, Ras protein, Ras-induced tumors, dynamin-related protein 1 (DRP1), cell cycle
Citation: Zhu D, Han F, Sun L, Agnihotri SK, Hu Y and Büeler H (2022) Loss of PTEN-Induced Kinase 1 Regulates Oncogenic Ras-Driven Tumor Growth By Inhibiting Mitochondrial Fission. Front. Oncol. 12:893396. doi: 10.3389/fonc.2022.893396
Received: 10 March 2022; Accepted: 08 April 2022;
Published: 05 May 2022.
Edited by:
Chunquan Li, Harbin Medical University, ChinaCopyright © 2022 Zhu, Han, Sun, Agnihotri, Hu and Büeler. This is an open-access article distributed under the terms of the Creative Commons Attribution License (CC BY). The use, distribution or reproduction in other forums is permitted, provided the original author(s) and the copyright owner(s) are credited and that the original publication in this journal is cited, in accordance with accepted academic practice. No use, distribution or reproduction is permitted which does not comply with these terms.
*Correspondence: Hansruedi Büeler, aGFidWxleEB5YWhvby5jb20=; Ying Hu, aHV5aW5nQGhpdC5lZHUuY24=
†Present address: Liuke Sun, State Key Laboratory of Veterinary Biotechnology, Harbin Veterinary Research Institute, Chinese Academy of Agricultural Sciences, Harbin, China
Sandeep K. Agnihotri, Suiren Inc., Zhangjiang Hi-Tech Park, Shanghai, China