 Shengyu Fang1,2Lianwang Li2Shimeng Weng2Yuhao Guo2Zhang Zhong1Xing Fan1*Tao Jiang1,2,3*Yinyan Wang1,2*
- 1Department of Neurosurgery, Beijing Tiantan Hospital, Capital Medical University, Beijing, China
- 2Beijing Neurosurgical Institute, Capital Medical University, Beijing, China
- 3Research Unit of Accurate Diagnosis, Treatment and Translational Medicine of Brain Tumors, Chinese Academy of Medical Sciences, Beijing, China
Background: Some gliomas in sensorimotor areas induce motor deficits, while some do not. Cortical destruction and reorganization contribute to this phenomenon, but detailed reasons remain unclear. This study investigated the differences of the functional connectivity and topological properties in the contralesional sensorimotor network (cSMN) between patients with motor deficit and those with normal motor function.
Methods: We retrospectively reviewed 65 patients (32 men) between 2017 and 2020. The patients were divided into four groups based on tumor laterality and preoperative motor status (deficit or non-deficit). Thirty-three healthy controls (18 men) were enrolled after matching for sex, age, and educational status. Graph theoretical measurement was applied to reveal alterations of the topological properties of the cSMN by analyzing resting-state functional MRI.
Results: The results for patients with different hemispheric gliomas were similar. The clustering coefficient, local efficiency, transitivity, and vulnerability of the cSMN significantly increased in the non-deficit group and decreased in the deficit group compared to the healthy group (p < 0.05). Moreover, the nodes of the motor-related thalamus showed a significantly increased nodal efficiency and nodal local efficiency in the non-deficit group and decreased in the deficit group compared with the healthy group (p < 0.05).
Conclusions: We posited the existence of two stages of alterations of the preoperative motor status. In the compensatory stage, the cSMN sacrificed stability to acquire high efficiency and to compensate for impaired motor function. With the glioma growing and the motor function being totally damaged, the cSMN returned to a stable state and maintained healthy hemispheric motor function, but with low efficiency.
Highlights
This study investigated how the contralesional hemispheric sensorimotor network (cSMN) was altered in glioma patients with different motor status (deficit or normal). Two potential stages (compensated and decompensated) of motor function alteration were found. When the glioma initially appeared and the motor function of patients was normal, the cSMN sacrificed stability to acquire high efficiency in order to compensate for the impaired motor function induced by glioma. With the glioma growing and the degree of disruption of motor function being high, the damaged motor function was unable to be compensated by the cSMN; the cSMN, therefore, returned to a stable state and maintained healthy hemispheric motor function, but with low efficiency. Our findings verified that the contralesional hemispheric cortex participated in the motor functional compensation through altering the functional brain network.
Introduction
Motor function is essential for daily life, and motor dysfunction induced by a glioma has a major impact on a patient’s quality of life (1). Owing to neural plasticity and functional compensation, some deficits can be recovered (2–4). Normal cortices surrounding lesions (5) and mirror-symmetrical cortices in the contralesional hemisphere are recruited to compensate for the dysfunction (4–6). However, since primary sensorimotor cortices are responsible for a sole function, remodeling through surrounding areas and then compensating for the damaged motor function are difficult (7). Accordingly, it becomes crucial to investigate network remodeling in the mirror-symmetrical sensorimotor cortices to understand the compensation for motor deficits.
Many multimodal imaging studies have demonstrated that cortical compensation in the contralesional hemisphere was related to functional recovery (8–11). Glioma is a progressive disease. It is probable for a glioma that grew on the sensorimotor network to induce preoperative motor deficit, but not all gliomas do. Cortical destruction and reorganization are related to this phenomenon, but the detailed mechanisms remain unclear. Hence, we investigated how alterations of the contralesional sensorimotor network (cSMN) in patients with different preoperative motor status help in understanding the mechanisms of motor functional compensation.
Resting-state functional MRI (rs-fMRI) is widely used to delineate functional networks. Accumulating rs-fMRI studies investigated the correlations between alterations of functional connectivity (FC) and glioma-induced functional plasticity in glioma patients (8, 12). In addition to FC, topological properties are another dimension to delineate network connections (13), which show the hierarchical connections of nodes in a network and represent the characteristics of information conveying (14, 15). Thus, the topological properties of functional networks are expected to provide a new perspective in explaining functional compensation. The current study aimed to 1) reveal how the cSMN is altered in patients with gliomas that have invaded sensorimotor-related structures and 2) identify relevant changes between the topological properties and preoperative motor deficits by comparing patients with different motor status. Subsequently, we hoped to provide some evidence for recovery treatments by identifying crucial nodes of the cSMN.
Materials and Methods
This study was reviewed and approved by the institutional review board of the Beijing Tiantan Hospital. Written informed consent was obtained from all patients for their original treatments.
Participants
We retrospectively reviewed the medical records of 70 patients who were diagnosed with gliomas in sensorimotor function-related areas between August 2017 and March 2020 at Beijing Tiantan Hospital. The inclusion criteria were as follows: 1) adult patients and 2) a primary glioma without any history of treatment. The exclusion criteria were as follows: 1) head motion >1 mm in translation or 1° in rotation, 2) lesions located bilaterally, and 3) tumor resulting in midline shifting.
All enrolled patients were first divided based on tumor location and were subsequently classified into a deficit and a non-deficit group based on their preoperative motor status. The muscle strength of each patient was tested using the British Medical Research Council scale and by neurosurgeons who have over 10 years of work experience in clinical neurosurgery. If the muscle strength of any limbs was lower than grade 5, the patient would be defined as having preoperative motor deficit. After matching for age, sex, and educational status, 33 healthy participants were enrolled as controls (men, n = 18). The handedness of all patients and participants was examined using the Edinburgh Handedness Inventory test. All of them were right-handed.
MRI Acquisition
In the current study, a Siemens 3.0-T MR scanner (MAGNETOM Prisma, Erlangen, Germany) was used to collect imaging data. The parameters for the T1 magnetization-prepared rapid acquisition gradient echo with gadolinium enhancement were as follows: repetition time (TR) = 2,300 ms, echo time (TE) = 2.3 ms, field of view (FOV) = 240 × 240 mm2, flip angle (FA) = 8°, slice number = 192, and voxel size = 1.0 × 1.0 × 1.0 mm3. The parameters for the T2-weighted fluid-attenuated inversion recovery (T2-FLAIR) sequence were: TR = 5,000 ms, TE = 387 ms, FOV = 220 × 220 mm2, FA = 150°, slice number = 128, thickness = 0.9 mm, and voxel size = 0.4 × 0.4 × 0.9 mm3.
The rs-fMRI images were acquired with an echo planar imaging sequence. The parameters were as follows: TR = 2,000 ms, TE = 30 ms, FOV = 220 × 220 mm2, FA = 90°, slice number = 30, voxel size = 3.0 × 3.0 × 3.0 mm3, and acquisition duration = 8 min. Participants were asked to get monitored without thinking about anything during rs-fMRI acquisition.
Regions of Tumor Invasion
Two neuroradiologists independently reviewed the MR images using MRIcron software (http://www.mccauslandcenter.sc.edu/mricro/mricron/) to manually determine the extent of glioma invasion (shown in Figures 1, 2) (16). The tumor masks of lower-grade glioma (grades II and III) and glioblastoma (grade IV) were drawn based on the high-intensity regions of FLAIR and the enhancement regions of the contrast-enhanced T1-weighted images, respectively. If there was a more than 5% difference in the region drawn by the two neuroradiologists, a third neuroradiologist with 25 years of experience made the final decision. All tumor masks were normalized to the MNI-152 T1 template using SPM 8 software (University College London, London, UK; http://www.fil.ion.ucl.ac.uk/spm/). The tumor volumes were calculated with a volumetric measurement.
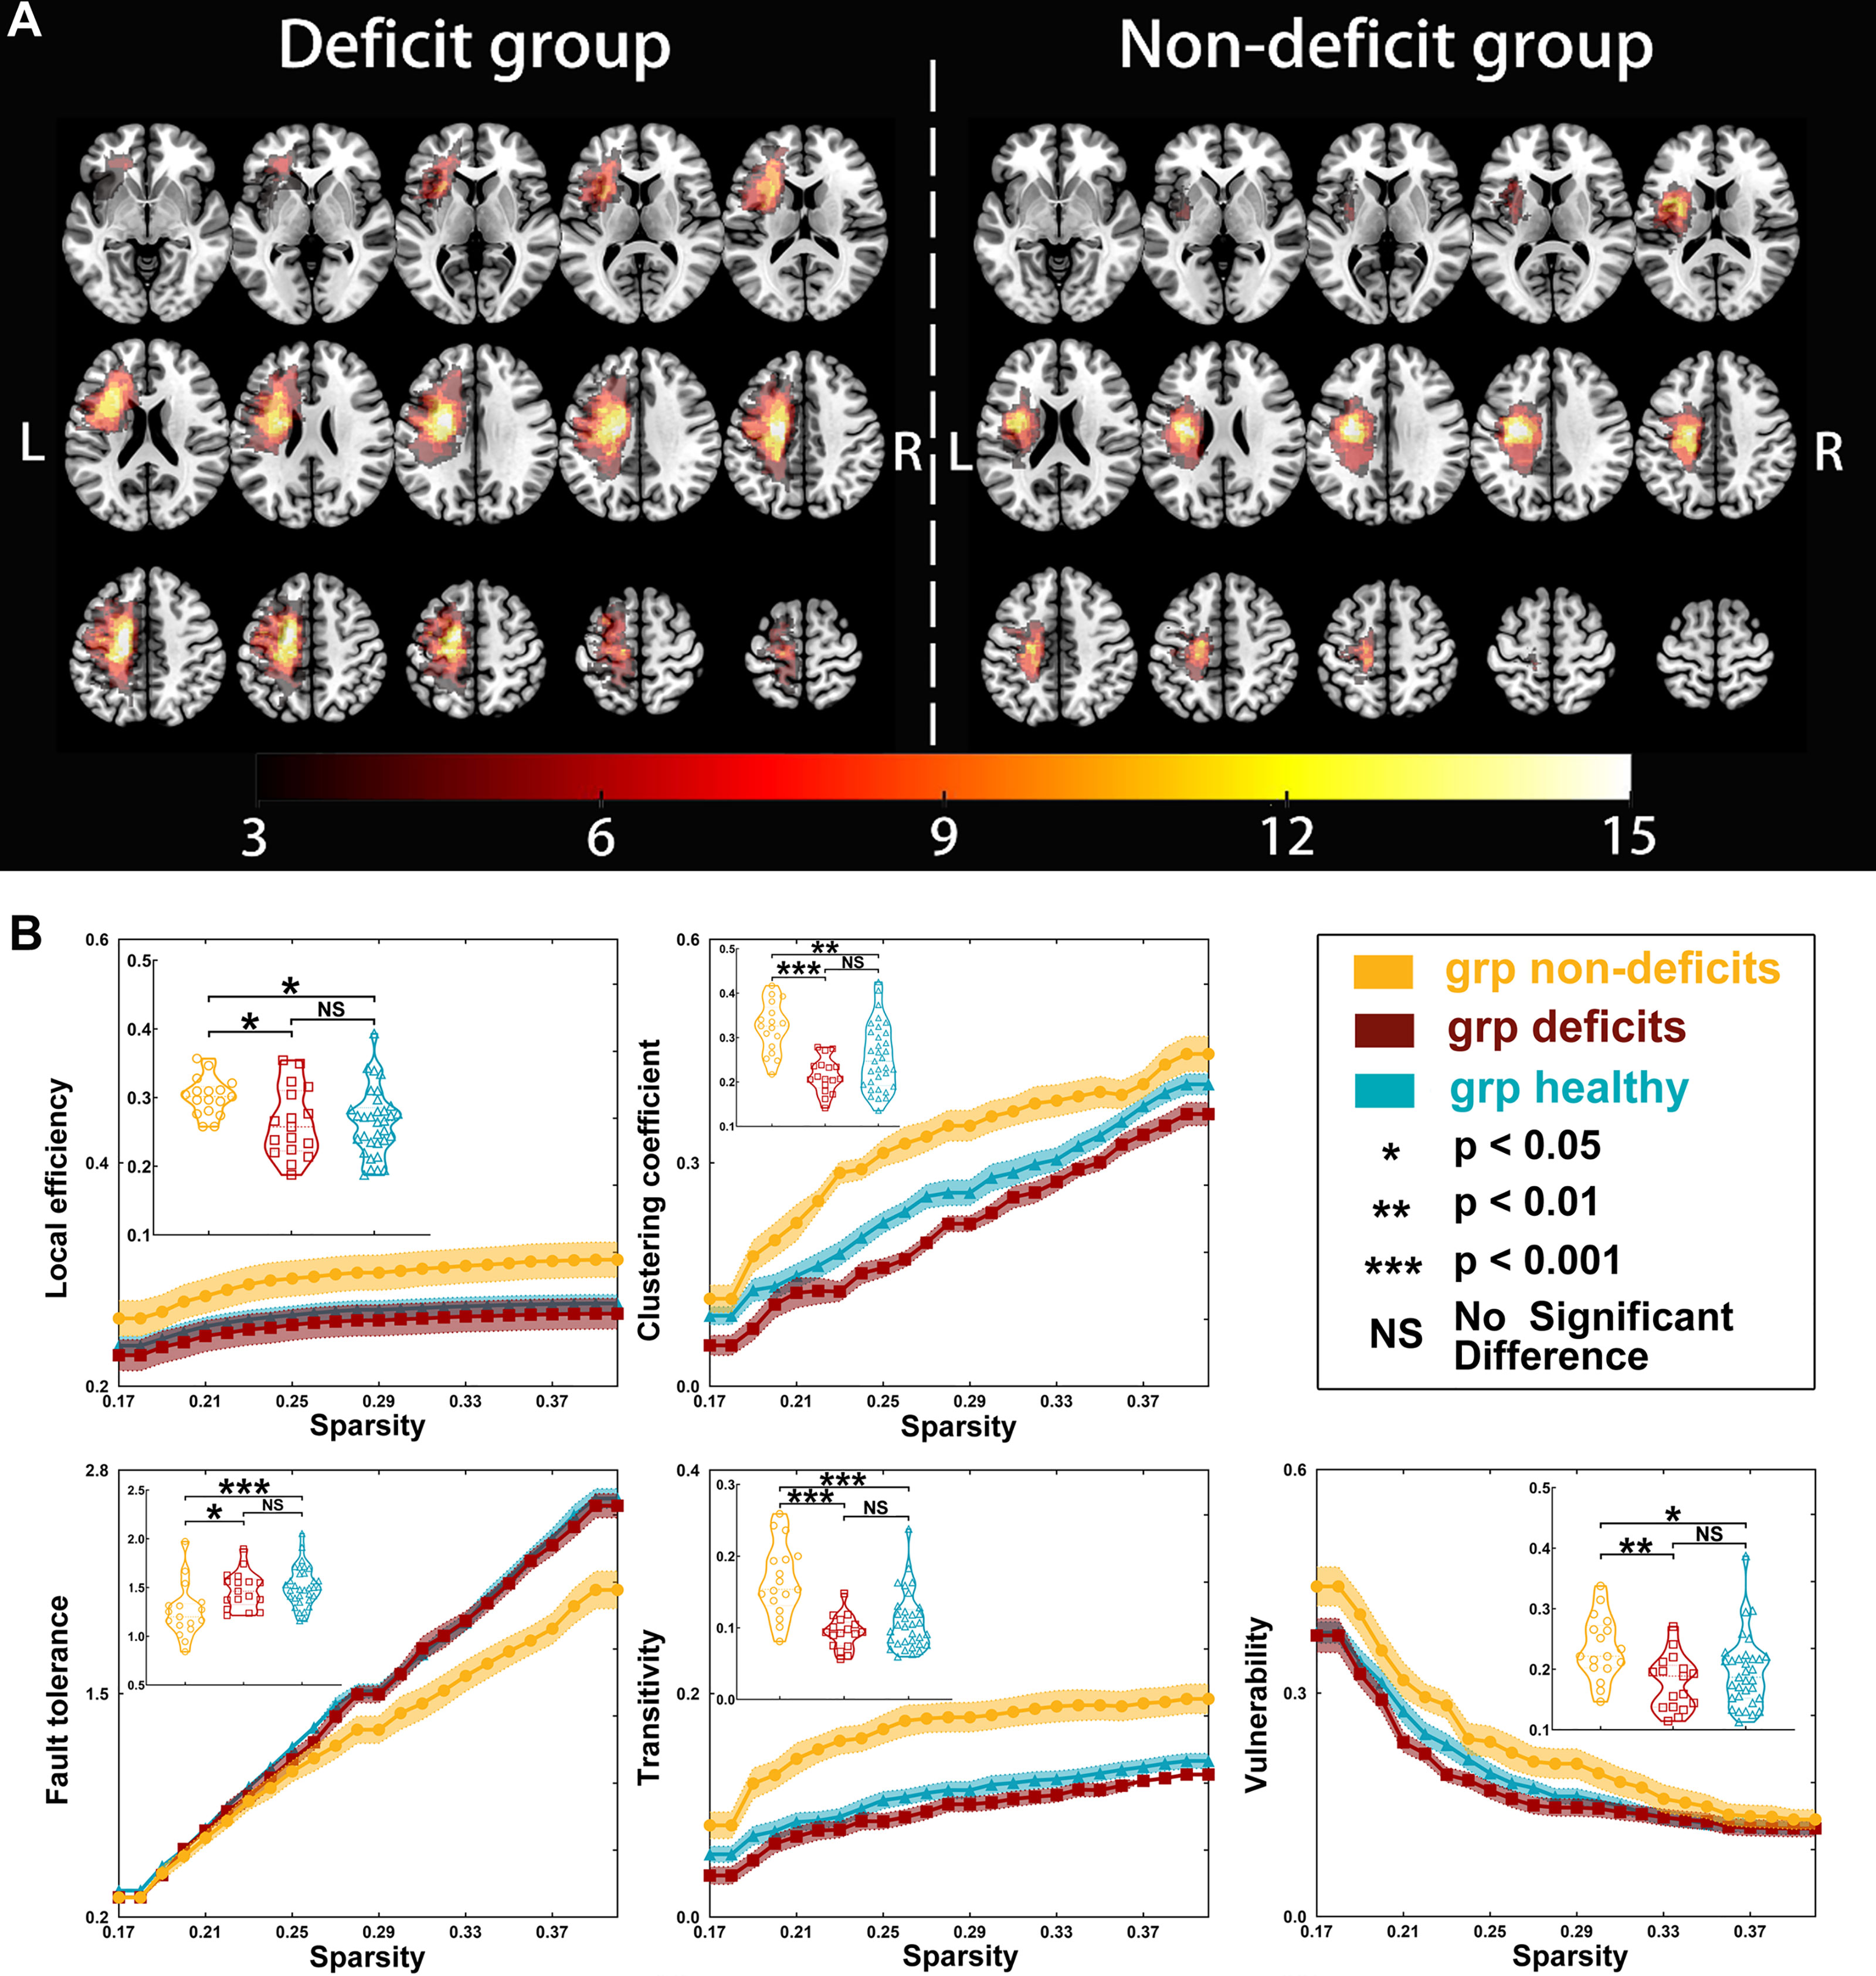
Figure 1 Tumor location and global properties of patients with left hemispheric gliomas. (A) Overlapping results of gliomas in the left hemisphere. The value of the color bar represents the number of patients with tumors located in a same region. (B) Differences in global topological properties of the sensorimotor network in the contralesional hemisphere among the three groups.
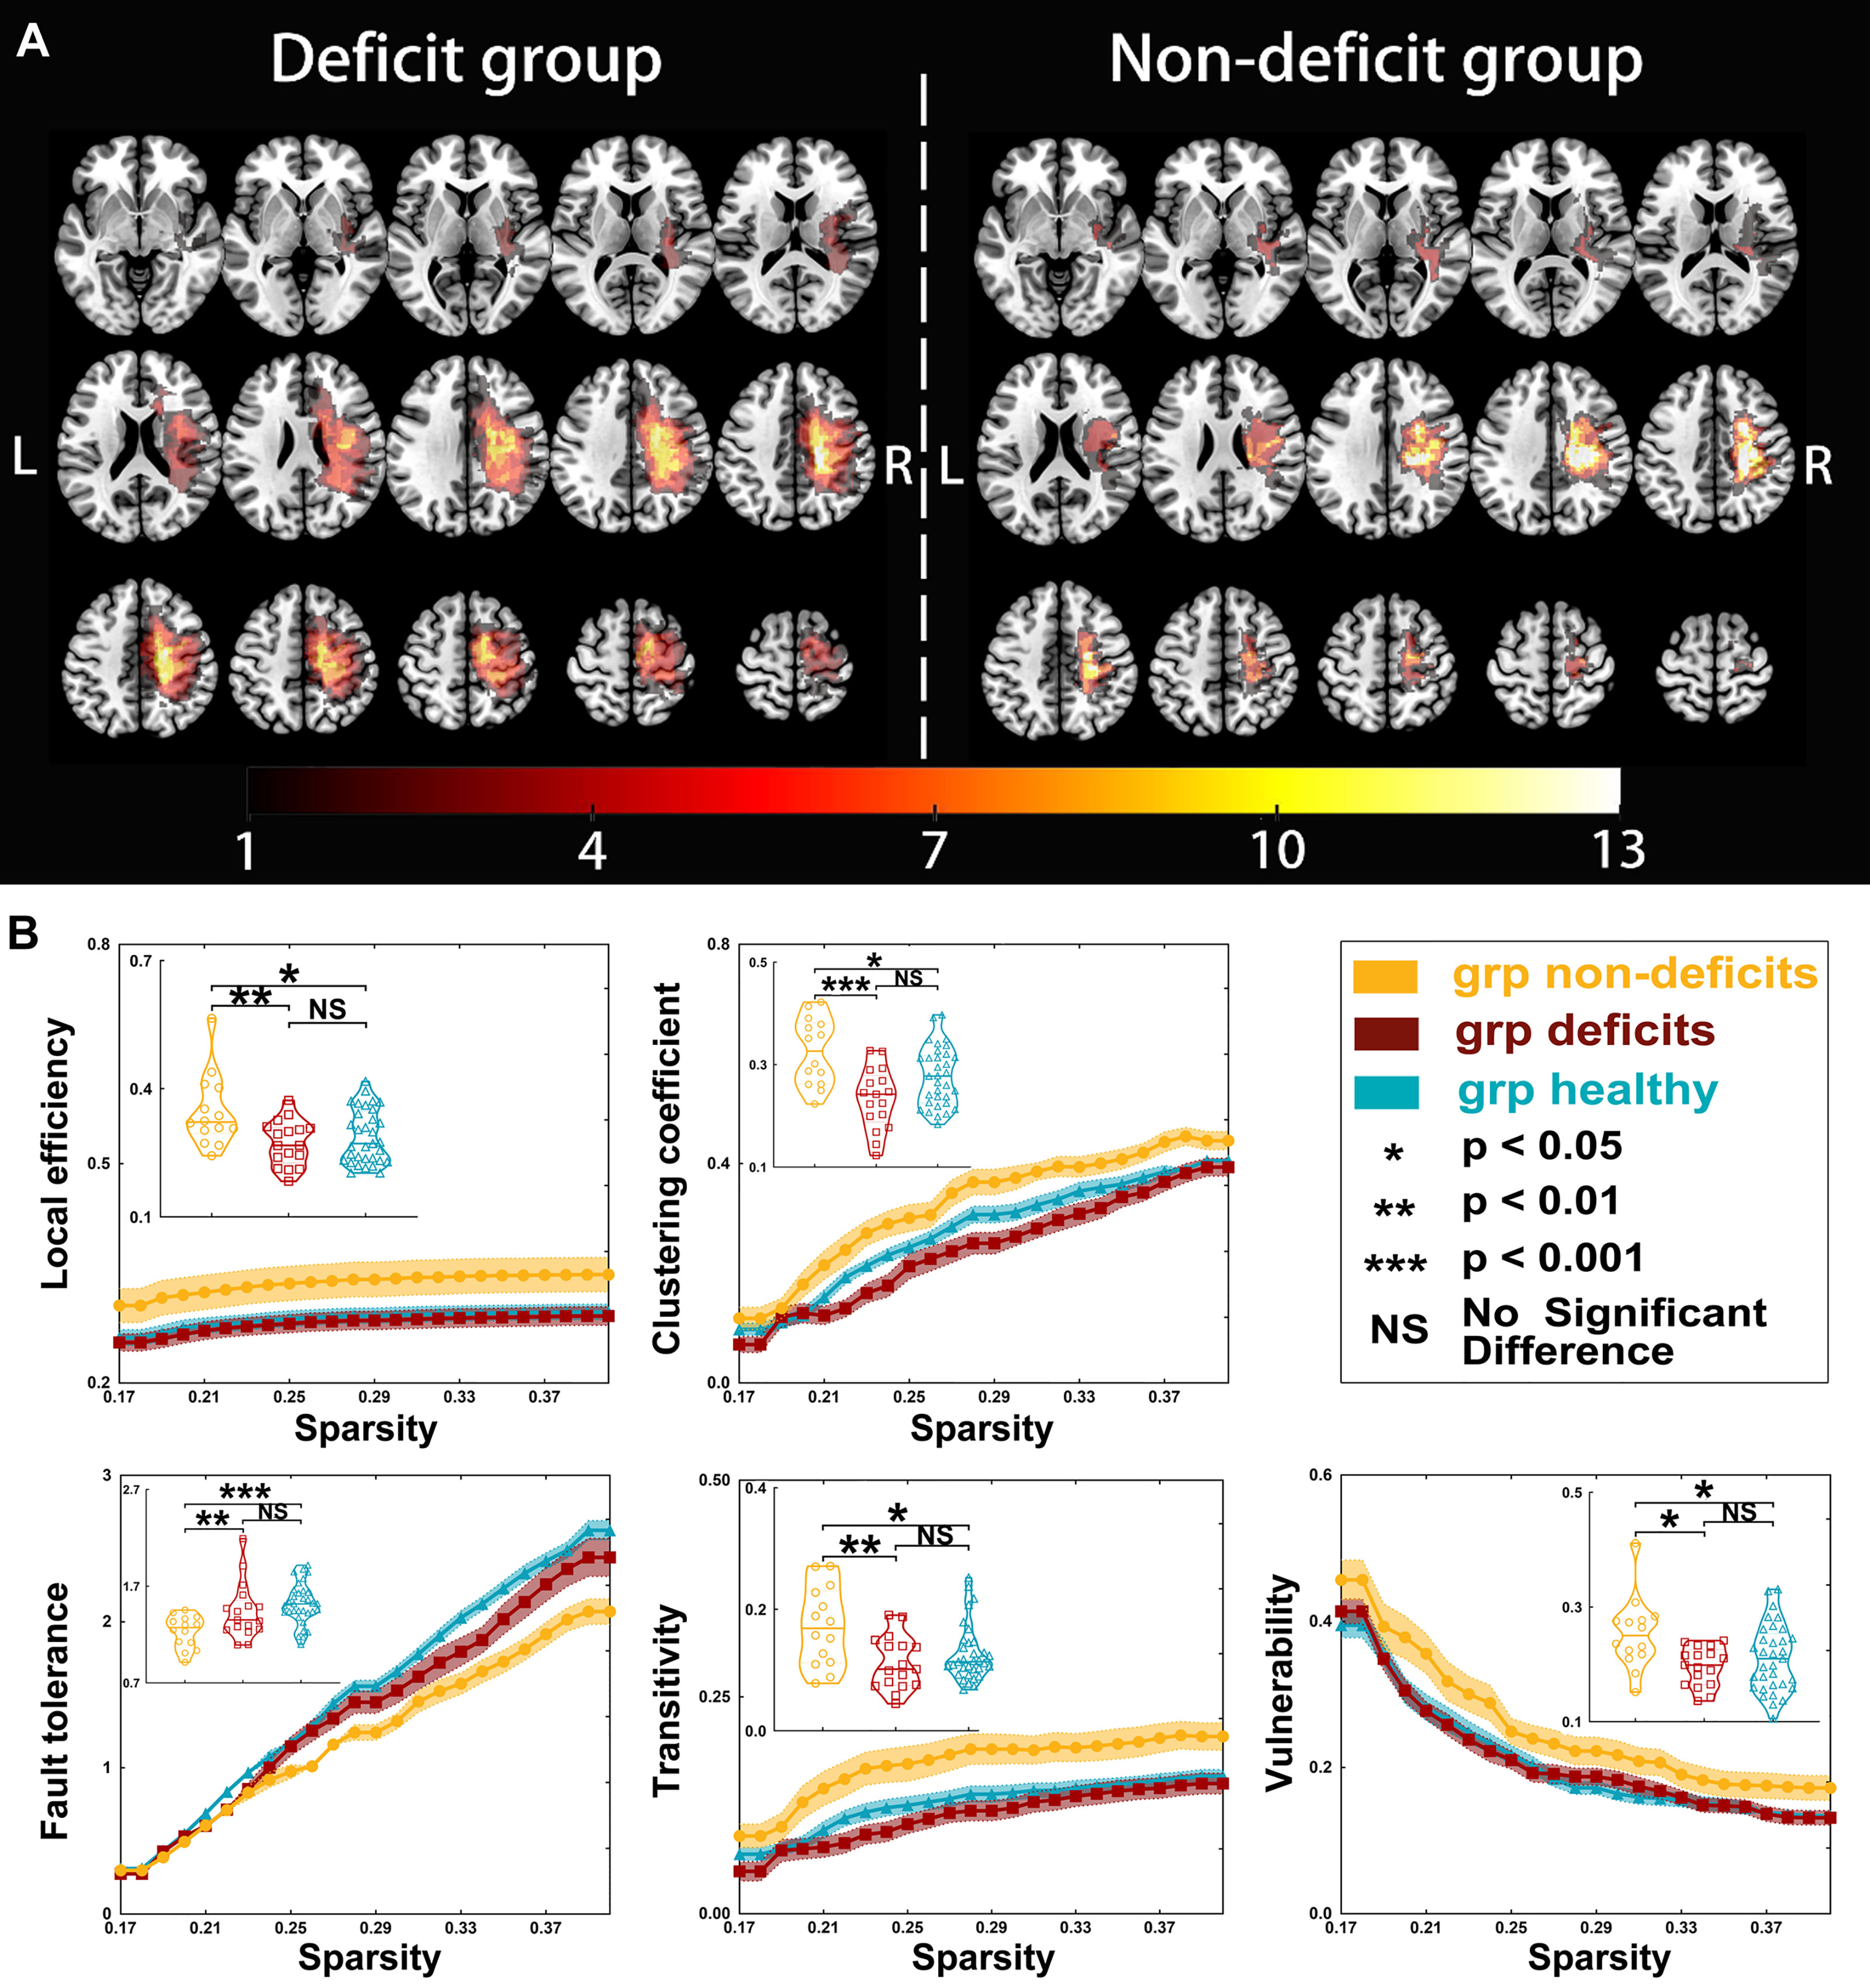
Figure 2 Tumor location and global properties of patients with right hemispheric gliomas. (A) Overlapping results of gliomas in the right hemisphere. The value of the color bar represents the number of patients with tumors located in a same region. (B) Differences in global topological properties of the sensorimotor network in the contralesional hemisphere among the three groups.
Functional MRI Preprocessing
We used GRETNA (https://www.nitrc.org/projects/gretna) (17, 18) to preprocess the rs-fMRI data. Information of the preprocessing pipeline and the parameters in each step were as follows: 1) transformation to a NIFTI file; 2) removal of the first images (time point number to remove = 5); 3) slice timing correction; 4) realignment; 5) spatial normalization (normalized to echo planar imaging template) (19); 6) smoothing (full width at half maximum = 4 mm); 7) temporal detrending (linear detrending); 8) regressing out the covariance (white matter signal: with WMMask_3mm; CSF signal: with CSFMask_3mm; head motion: Friston, 24 parameters); 9) temporal filtering (0.01–0.08 Hz); and 10) scrubbing (using default parameters and the interpolation strategy: linear interpolation; FD threshold, 0.5; previous time point number, 1; subsequent time point number, 2).
Regions of Interest
Tumor occupation can induce a mismatch during the step of normalization, and neurovascular uncoupling decreases the accuracy of blood oxygen signals (20–22). Accordingly, the results related to the lesional sensorimotor network would be inaccurate with the effects of these factors. To avoid these effects, the regions of interest in the cSMN that were unrelated to these factors, to keep our results reliable, were extracted from a brain atlas (http://www.brainnetome.org/) (23) using the BRANT software. The seeds were generated as 5-mm spheres based on the coordinates of the sensorimotor network. Finally, 14 nodes were extracted to construct a cSMN template (Supplementary Tables S1, S2).
Network Construction
Pearson’s correlation coefficients were applied to construct the FC matrices by calculating the regional mean time series for all extracted nodes of the sensorimotor networks.
Graph Theoretical Measures
Graph theoretical measurement is a reliable method to quantitatively reveal topological properties (24, 25). In this study, all weighted matrices were transformed into absolute to calculate the topological properties, including local efficiency, clustering coefficient, global efficiency, the shortest path length, small-worldness (gamma, lambda, and sigma), fault tolerance, transitivity, vulnerability, nodal efficiency, nodal local efficiency, nodal cluster coefficient, and betweenness centrality (24, 26–28). Detailed information of each property is shown in the Supplementary Material.
Statistical Analyses
We used SPSS 25.0 software (Microsoft®, IBM Corp., Armonk, NY, USA) to perform statistical analyses. The clinical characteristics were compared between the patient and control groups using Student’s t-test, Mann–Whitney U test, chi-square test, and one-way ANOVA according to the type of data. To explore group differences in network topological properties, we applied a series of sparsity thresholds (from 0.17 to 0.40, interval = 0.01) consistent with the literature (29). We selected the tumor volume and malignancy grade as covariates during the comparison of the FCs and topological properties among the groups. Bonferroni correction was used to correct the FC results. The topological properties were compared among the groups using one-way ANOVA. Bonferroni correction was subsequently used for post-hoc analysis when the results of one-way ANOVA were significantly different. A p-value <0.05 was considered as significant. Furthermore, we analyzed the correlation between the preoperative muscle strength of deficit hand and topological properties using Spearman’s correlation.
Results
Sixty-five right-handed patients (men, n = 32) met the inclusion criteria. The preoperative Karnofsky performance scores of the non-deficit group were higher than those of the deficit group (p < 0.001). Moreover, the tumor volumes were larger in the deficit group than those in the non-deficit group (left hemisphere, p = 0.016; right hemisphere, p = 0.033). No differences were observed in age, sex, or educational status among the three groups (Table 1). The differences in FC are shown in the Supplementary Material.
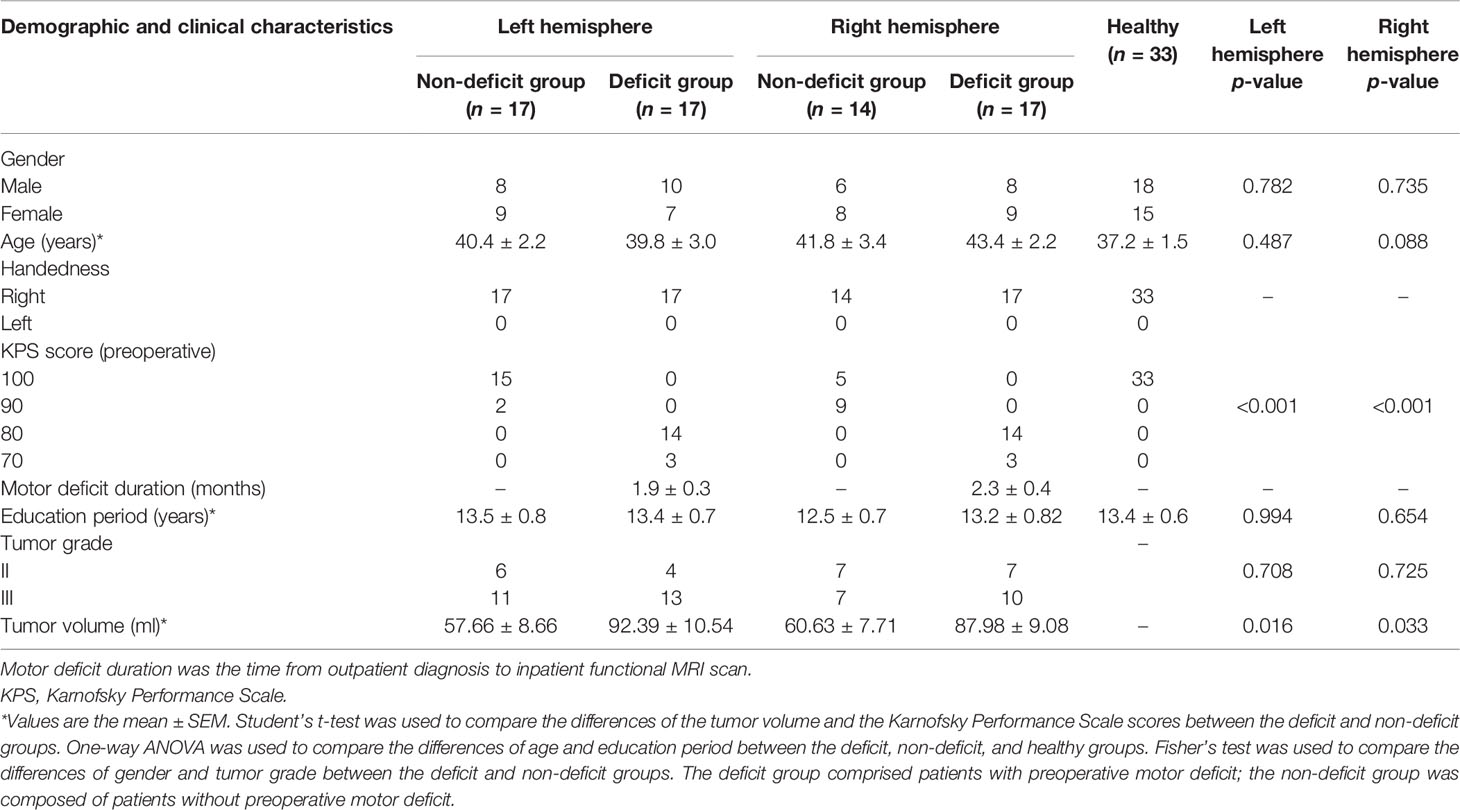
Table 1 Demographic and clinical characteristics.
Differences in Global Topological Properties
Regarding left hemispheric gliomas (for detailed results, see Table 2 and Figure 1), the local efficiency (p = 0.0138), clustering coefficient (p < 0.0001), fault tolerance (p = 0.0009), transitivity (p < 0.0001), and vulnerability (p = 0.0074) were different among the three groups (non-deficit, deficit, and healthy groups). Post-hoc analysis with Bonferroni correction showed that the non-deficit group had greater local efficiency than the deficit (p = 0.0461) and healthy (p = 0.0181) groups. Moreover, compared to the non-deficit group, the clustering coefficient and transitivity decreased in the deficit (p < 0.0001 and p < 0.0001, respectively) and healthy (p = 0.0022 and p < 0.0001, respectively) groups. Additionally, compared to the non-deficit group, the fault tolerance increased in the deficit (p = 0.0138) and healthy (p = 0.0008) groups. Furthermore, the vulnerability was weaker in the deficit (p = 0.0077) and healthy (p = 0.0439) groups than that in the non-deficit group.
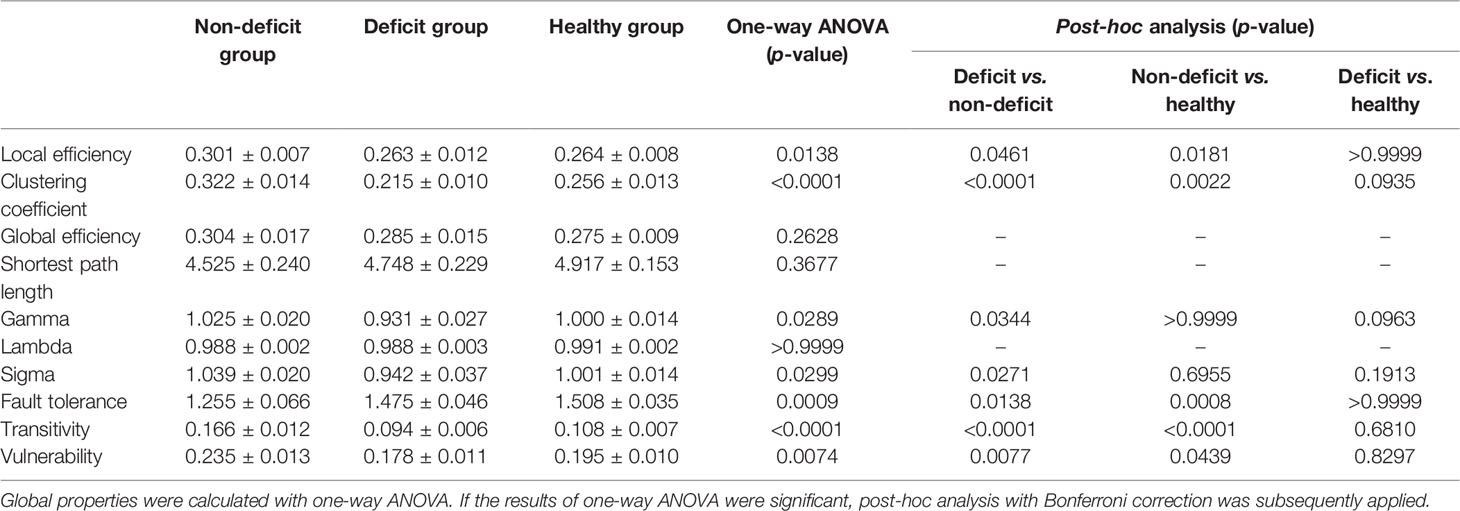
Table 2 Global properties compared between the patient and healthy groups for tumors located on the left hemisphere.
Regarding right hemispheric gliomas (for detailed results, see Table 3 and Figure 2), the local efficiency (p = 0.0063), clustering coefficient (p = 0.0003), fault tolerance (p = 0.0008), transitivity (p = 0.0045), and vulnerability (p = 0.0130) were different among the three groups. Post-hoc analysis with Bonferroni correction revealed that the local efficiency was weaker in the deficit (p = 0.0084) and healthy (p = 0.0191) groups than that in the non-deficit group. Moreover, compared with the non-deficit group, the clustering coefficient and transitivity decreased in the deficit (p = 0.0002 and p = 0.0048, respectively) and healthy (p = 0.0386 and p = 0.0199, respectively) groups. Additionally, compared to the non-deficit group, the fault tolerance increased in the deficit (p = 0.0035) and healthy (p = 0.0005) groups. Furthermore, the vulnerability was weaker in the deficit (p = 0.0141) and healthy (p = 0.0469) groups than that in the non-deficit group.
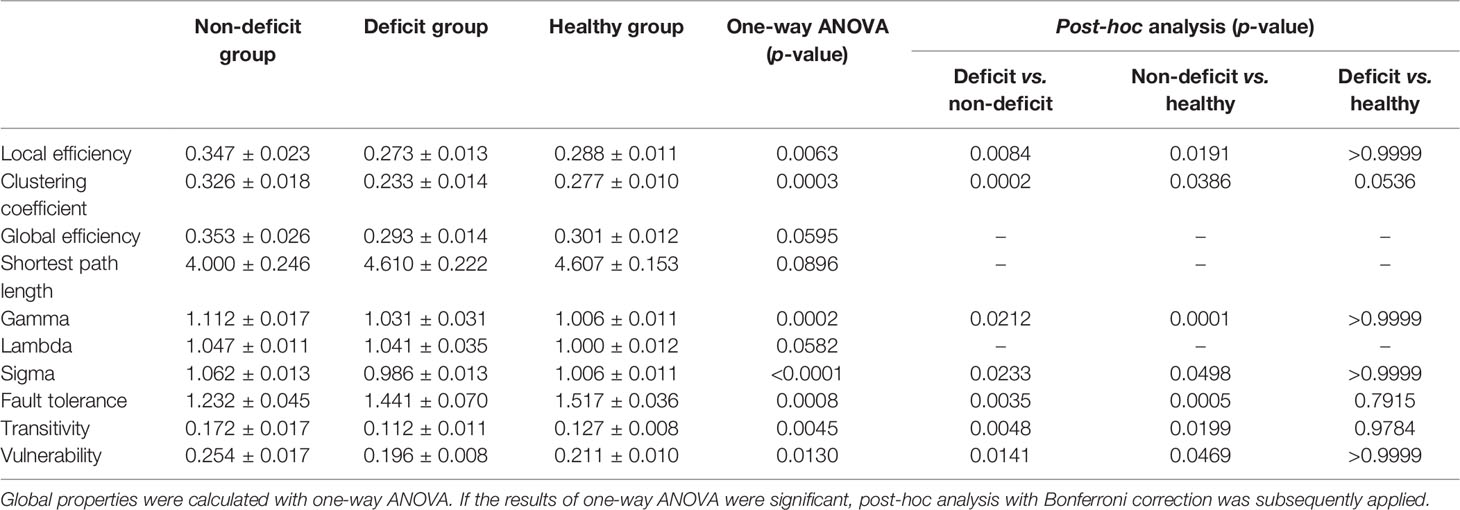
Table 3 Global properties compared between the patient and healthy groups for tumors located on the right hemisphere.
Small-World Properties
There were some differences in the gamma (left-sided glioma, p = 0.0289; right-sided glioma, p = 0.0001) and sigma (left-sided glioma, p = 0.0299; right-sided glioma, p = 0.0153) values among the three groups (for detailed results, see Tables 2 and 3). However, there was no difference in the lambda (left-sided glioma, p > 0.9999; right-sided glioma, p > 0.9999) values among the three groups.
Regarding left hemispheric gliomas, the gamma value was greater in the non-deficit group than that in the deficit group (p = 0.0344) after post-hoc analysis with Bonferroni correction. Moreover, the sigma value was greater in the non-deficit group than that in the deficit group (p = 0.0271).
Regarding right hemispheric gliomas, the gamma value was greater in the non-deficit group than that in the deficit (p = 0.0212) and healthy (p = 0.0001) groups after post-hoc analysis with Bonferroni correction. Moreover, the sigma value was greater in the non-deficit group than that in the deficit (p = 0.0233) and healthy (p = 0.0498) groups.
Nodal Topological Properties
Regarding left hemispheric gliomas, among the three groups (for detailed results, see Supplementary Tables S3–S7 and Figure 3), the nodal local efficiency values of five nodes—caudal dorsolateral Brodmann area (BA) 6 (A6cdl), lower limb BA 4 (A4ll), upper limb and face BA 1/2/3 (A1_2_3ulhf), tongue and larynx of BA 1/2/3 (A1_2_3tonIa), and premotor thalamus (mPMtha)—were significantly altered on post-hoc tests with Bonferroni correction. Compared with the non-deficit group, the nodal local efficiency of these nodes decreased in the deficit (A6cdl, p = 0.0048; A4ll, p = 0.0014; A1_2_3ulhf, p = 0.0044; A1_2_3tonIa, p = 0.0270; and mPMtha, p = 0.0011) and healthy (A6cdl, p = 0.0005; A4ll, p = 0.0278; A1_2_3ulhf, p = 0.0075; A1_2_3tonIa, p = 0.0119; and mPMtha, p = 0.0019) groups. Similarly, the nodal clustering coefficients of these nodes (except node A4ll) were greater in the non-deficit group than those in the deficit (A6cdl, p = 0.0212; A1_2_3ulhf, p = 0.0113; A1_2_3tonIa, p = 0.0394; and mPMtha, p = 0.0027) and healthy (A6cdl, p = 0.0034; A1_2_3ulhf, p = 0.0342; A1_2_3tonIa, p = 0.0300; and mPMtha, p = 0.0138) groups. Moreover, the nodal efficiency values of three nodes—upper limb BA 4 (A4ul), A1_2_3tonIa, and mPMtha—were significantly altered. Compared with the non-deficit group, the nodal efficiency of these nodes decreased in the deficit (A4ul, p = 0.0007; A1_2_3tonIa, p = 0.0134; and mPMtha, p = 0.0182) and healthy (A4ul, p = 0.0030; A1_2_3tonIa, p = 0.0174; and mPMtha, p = 0.0058) groups. Additionally, the degree centrality of two nodes (A4ul and A1_2_3tonIa) was significantly altered. Compared with the non-deficit group, the degree centrality decreased in the deficit (A4ul, p = 0.0020; A1_2_3tonIa, p = 0.0146) and healthy (A4ul, p = 0.0023; A1_2_3tonIa, p = 0.0436) groups. Furthermore, the betweenness centrality of node A4ul was significantly altered. Compared with the non-deficit group, the betweenness centrality decreased in the deficit (p = 0.0379) and healthy (p = 0.0402) groups.
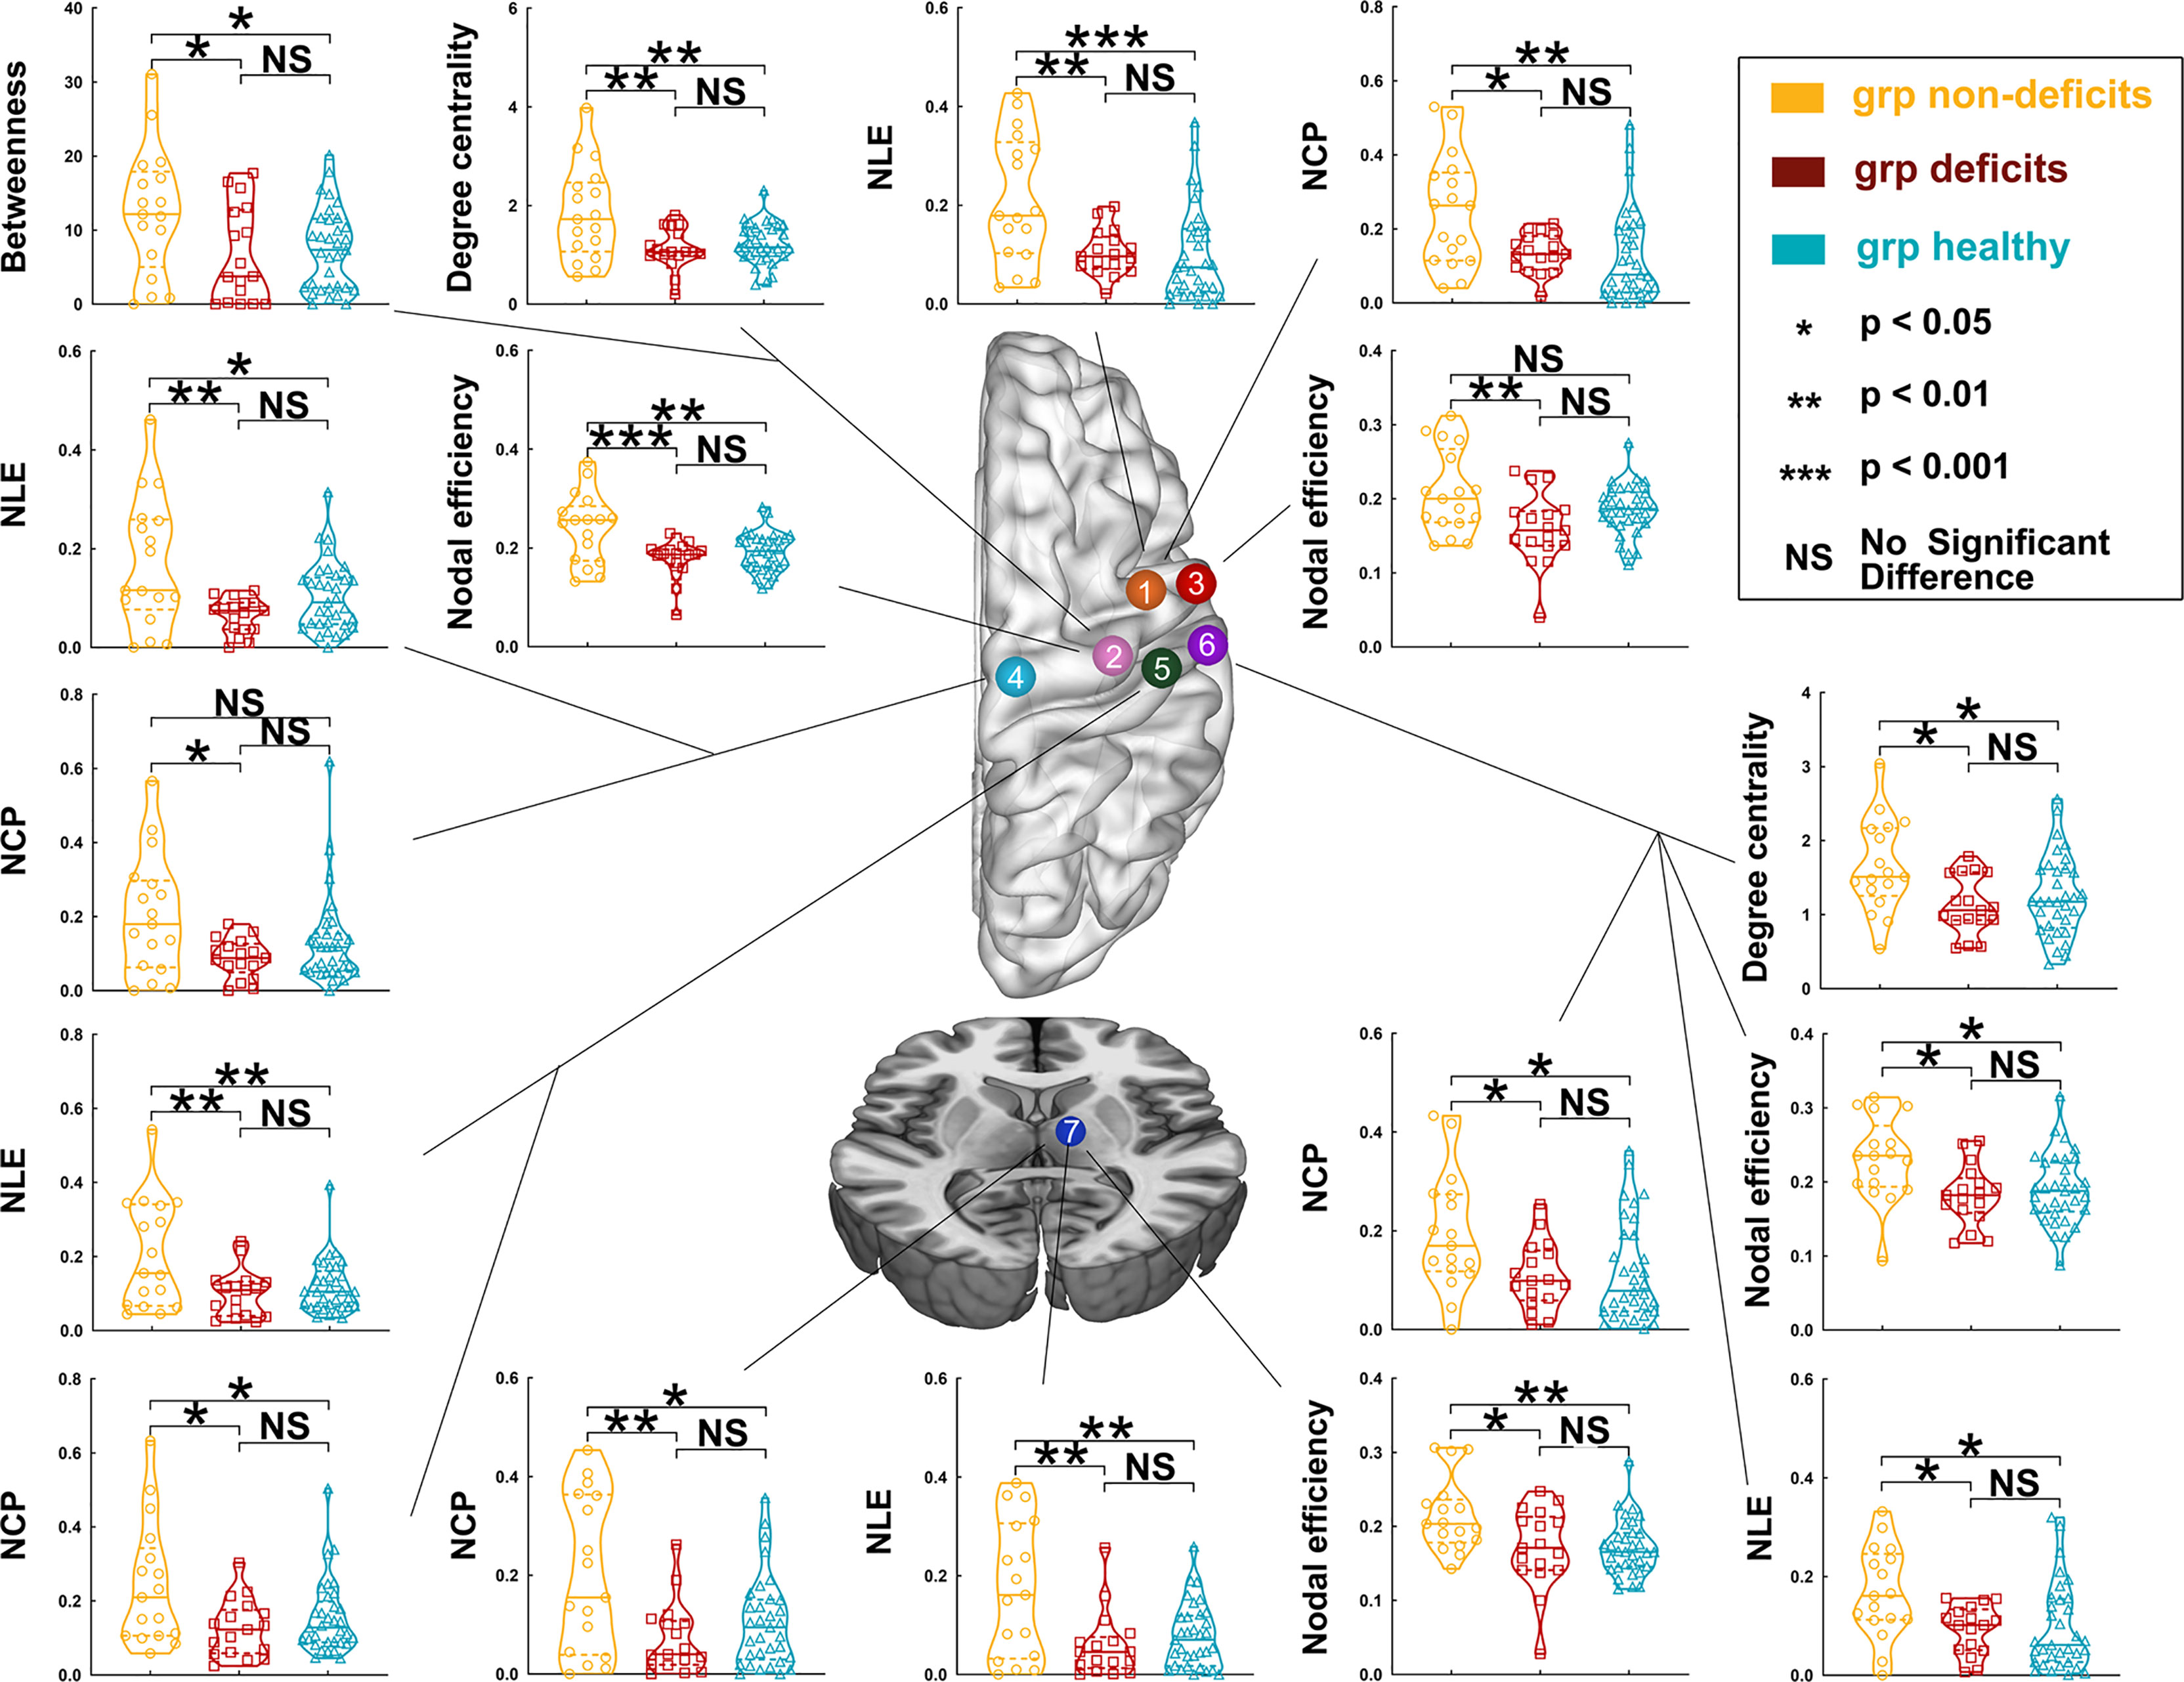
Figure 3 Differences in nodal topological properties of the sensorimotor network in the contralesional hemisphere among the three groups, with left hemisphere glioma. Orange node (No. 1), caudal dorsolateral Brodmann area (BA) 6 (A6cdl); pink node (No. 2), upper limb of BA 4 (A4ul); red node (No. 3), tongue and larynx of BA 4 (A4tl); light blue node (No. 4), lower limb region of BA 4 (A4ll); green node (No. 5), upper limb, head, and face regions of BA 1/2/3 (A1/2/3ulhf); purple node (No. 6), tongue and larynx of BA 1/2/3 (A1_2_3tonIa); and dark blue node (No. 7), premotor-related thalamus (mPMtha).
Regarding right hemispheric gliomas, among the three groups (for detailed results, see Supplementary Tables S8–S12 and Figure 4), the nodal local efficiency values of four nodes—A6cdl, A4tl, A1_2_3tonIa, and mPMtha—were significantly altered on post-hoc tests with Bonferroni correction. Compared with the non-deficit group, the nodal local efficiency values of these nodes decreased in the deficit (A6cdl, p = 0.0172; A4tl, p = 0.0210; A1_2_3tonIa, p < 0.0001; and mPMtha, p = 0.0056) and healthy (A6cdl, p = 0.0492; A4tl, p = 0.0057; A1_2_3tonIa, p = 0.0027; and mPMtha, p = 0.0158) groups. The nodal clustering coefficient of node A1_2_3tonIa was greater in the non-deficit group than that in the deficit (p = 0.0027) and healthy (p = 0.0500) groups. Moreover, the nodal efficiency values of four nodes—A6cdl, A4ul, trunk BA 1/2/3 (A1_2_3tru), and mPMtha—were significantly altered. Compared with the non-deficit group, the nodal efficiency of these nodes decreased in the deficit (A6cdl, p = 0.0187; A4ul, p = 0.0175; A1_2_3tru, p = 0.0445; and mPMtha, p = 0.0065) and healthy (A6cdl, p = 0.0213; A4ul, p = 0.0215; A1_2_3tru, p = 0.0003; and mPMtha, p < 0.0001) groups. Additionally, the degree centrality of node A1_2_3tonIa was significantly altered. Compared with the non-deficit group, the degree centrality decreased in the deficit group (p = 0.0248). Furthermore, the betweenness centrality of node A1_2_3ulhf was significantly altered. Compared with the non-deficit group, the betweenness centrality decreased in the deficit (p = 0.0468) and healthy (p = 0.0050) groups.
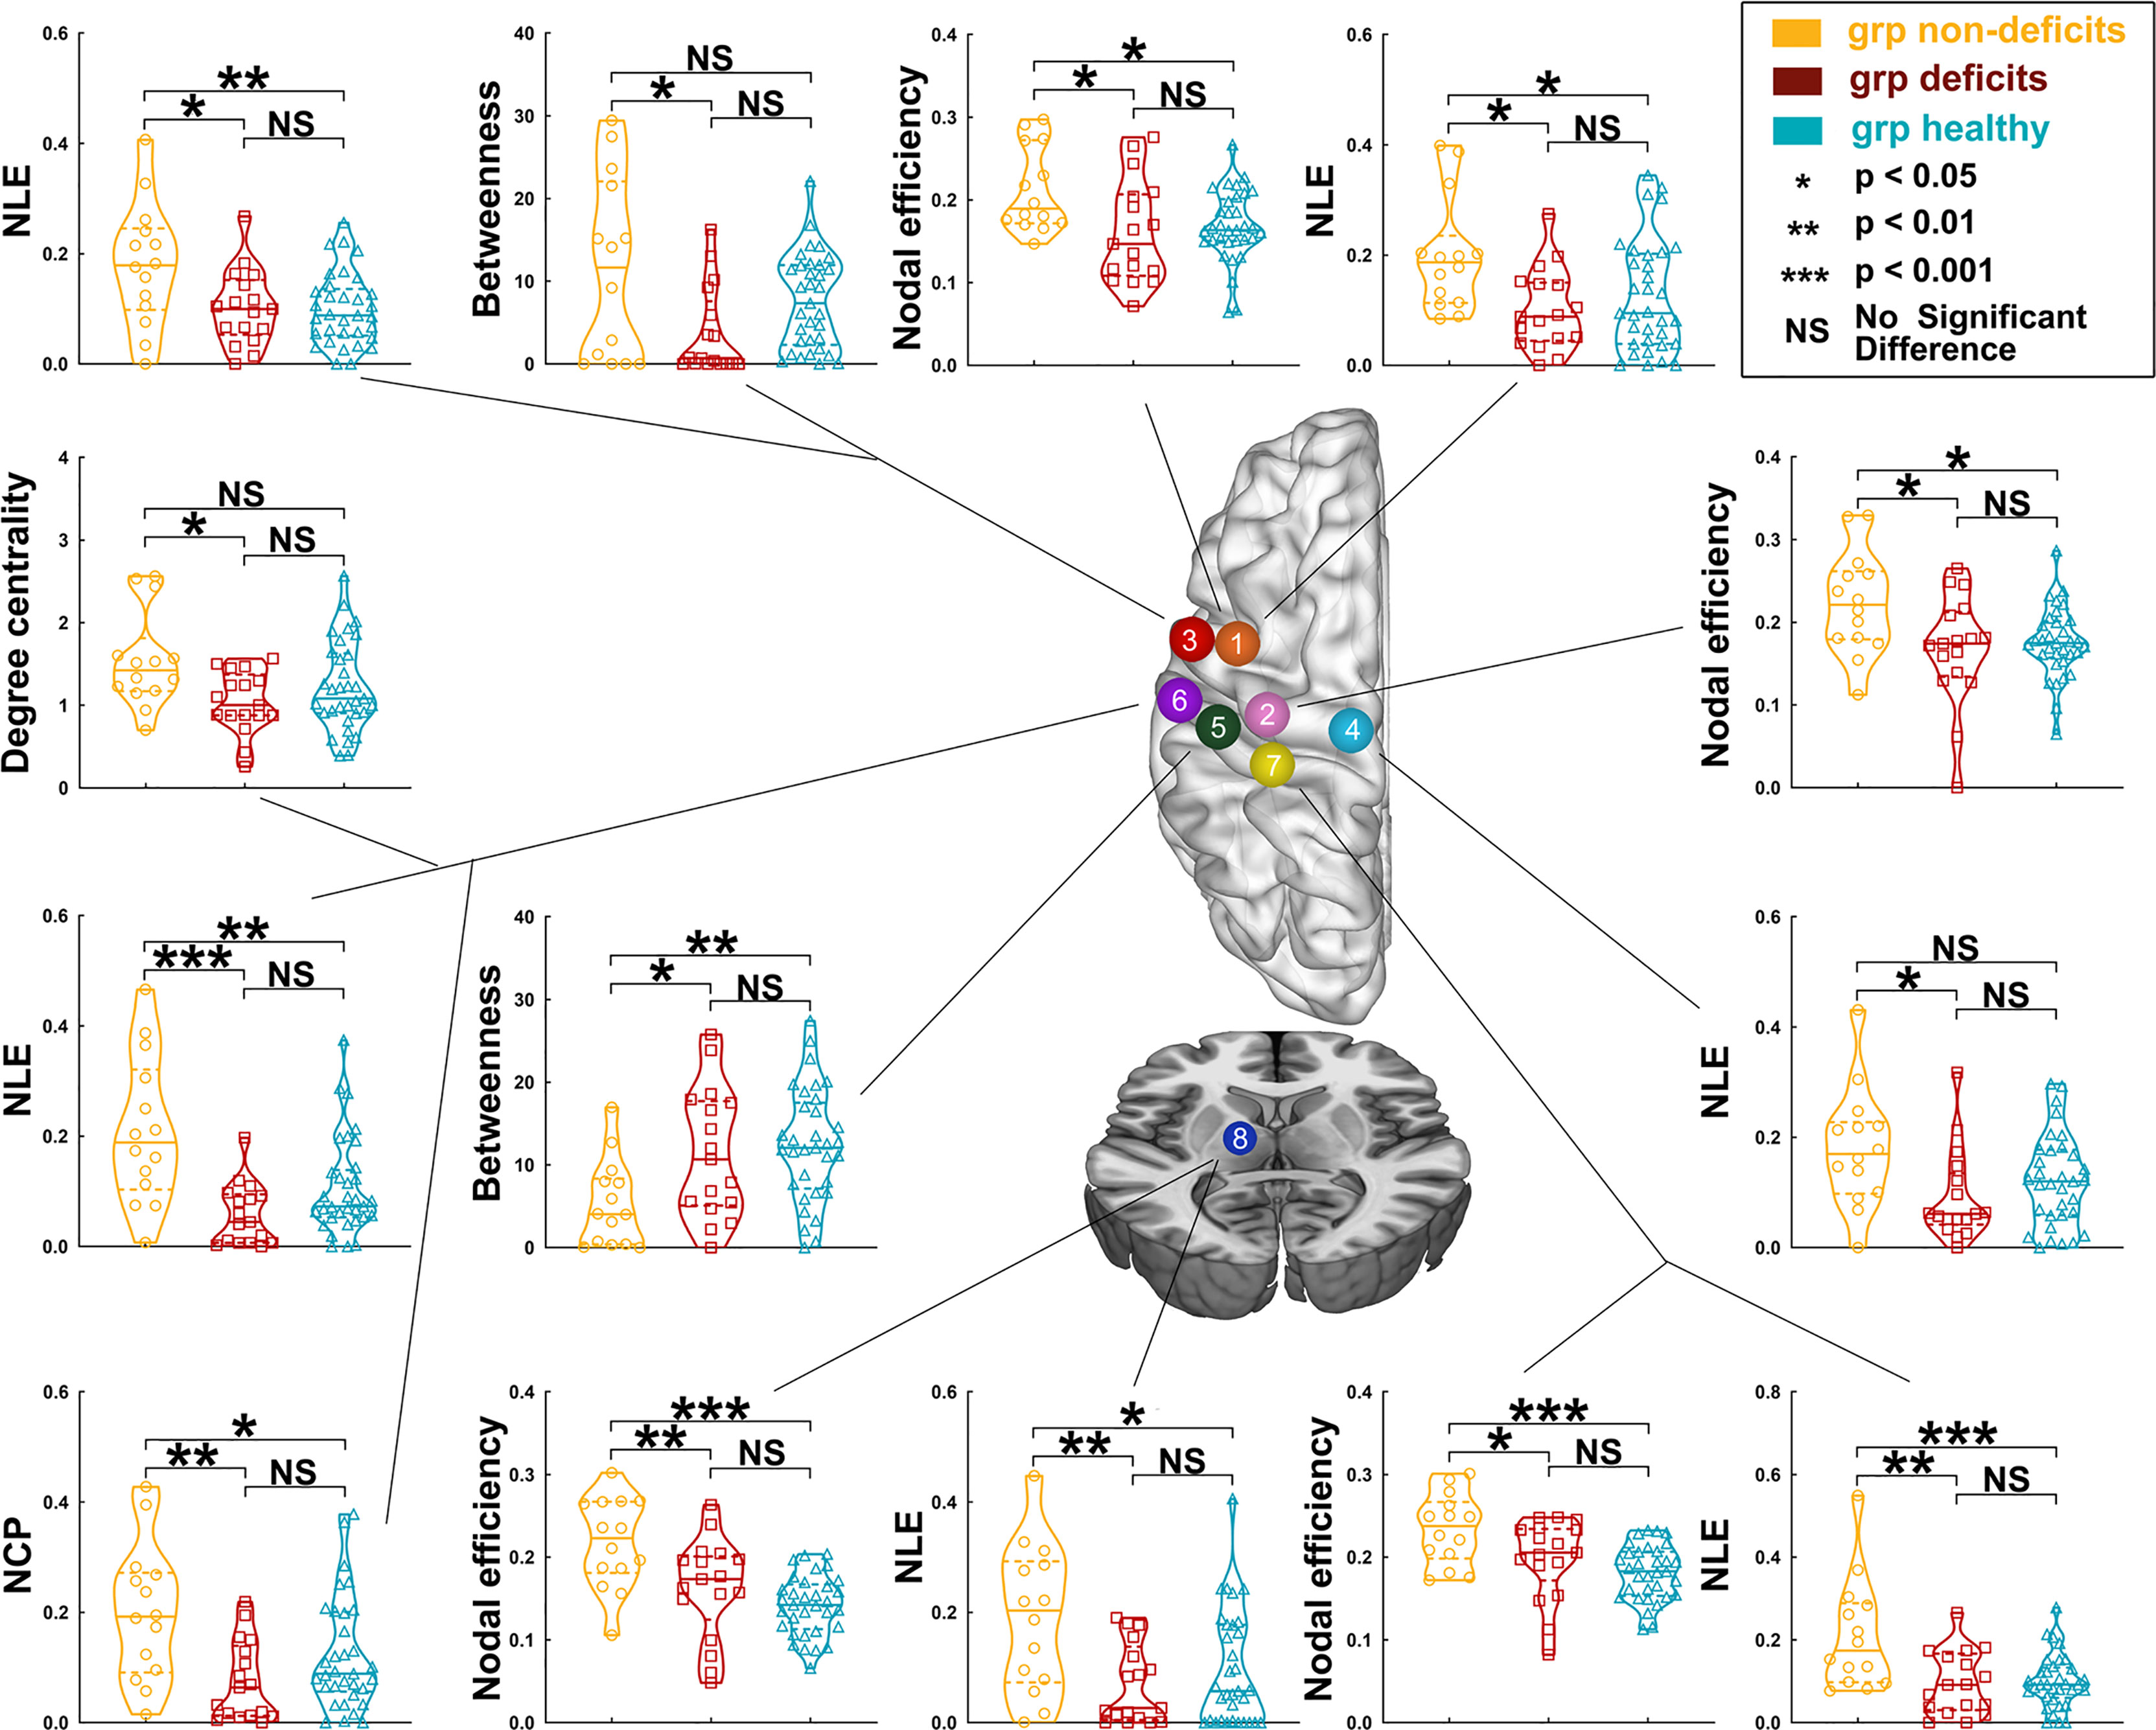
Figure 4 Differences in nodal topological properties of the sensorimotor network in the contralesional hemisphere among the three groups, with right hemisphere glioma. Orange node (No. 1), caudal dorsolateral Brodmann area (BA) 6 (A6cdl); pink node (No. 2), upper limb of BA 4 (A4ul); red node (No. 3), tongue and larynx of BA 4 (A4tl); light blue node (No. 4), lower limb region of BA 4 (A4ll); green node (No. 5), upper limb, head, and face regions of BA 1/2/3 (A1/2/3ulhf); purple node (No. 6), tongue and larynx of BA 1/2/3 (A1_2_3tonIa); yellow node (No. 7), trunk region of BA 1/2/3 (A1_2_3tru); and dark blue node (No. 8), premotor-related thalamus (mPMtha).
Correlation Between Muscle Strength and Topological Properties
Regarding patients with left glioma, the clustering coefficient (r = 0.805, p < 0.0001), local efficiency (r = 0.356, p = 0.0390), gamma (r = 0.695, p < 0.0001) and sigma (r = 0.677, p < 0.0001) values, transitivity (r = 0.741, p < 0.0001), and vulnerability (r = 0.540, p = 0.0010) were positively correlated with muscle strength of deficit hand. Similarly, regarding patients with right glioma, the clustering coefficient (r = 0.704, p < 0.0001), local efficiency (r = 0.477, p = 0.0067), gamma (r = 0.702, p < 0.0001) and sigma (r = 0.711, p < 0.0001) values, transitivity (r = 0.603, p = 0.0003), and vulnerability (r = 0.510, p = 0.0034) were positively correlated with the muscle strength of deficit hand (Supplementary Figure S1).
Discussion
This study investigated the alterations of the cSMN in patients with gliomas and with different preoperative motor status. The results revealed that the FC of the cSMN was not different between the patient and healthy groups (for detailed information, see part 2 of the Supplementary Material). However, the topological properties of the cSMN were significantly different between patients with and without motor deficits.
In our study, the network properties (such as the clustering coefficient and local efficiency) in the non-deficit group were greater than those in the healthy group. The clustering coefficient represents the ratio between the number of actual edges and the maximum number of possible edges in a network (26). Thus, compared with the healthy group, the increased clustering coefficient in the non-deficit group meant that the network was remodeled through increasing the number of actual edges. The remodeling networks implied that the mirrored motor cortices on the contralesional hemisphere participated in functional compensation in the non-deficit group, and this compensation process resulted in normal motor function when the glioma involved the primary motor area (2, 7, 30).
How do contralesional cortices compensate for motor function? The tendency of alterations of the topological properties among the three groups indicated that two stages of motor functional compensation might exist.
In our study, the cSMN in the non-deficit group showed small-world properties and was significantly increased compared with that of the healthy group, but the cSMN in the deficit group did not have small-world properties (σ < 1). Small-world properties were calculated based on the clustering coefficient and shortest path length (31–33). The small-world properties were found to be increased in the non-deficit group and decreased in the deficit group compared with the healthy group. Specifically, the clustering coefficient was changed and the shortest path length was unchanged. The inverse tendency of alterations of the clustering coefficients between the non-deficit and deficit groups was determined by the different degrees of network disruption. The network disruptions were more serious in the deficit group than those in the non-deficit group, as patients in the deficit group had larger tumor volumes (30, 34, 35). The different degrees of network disruptions also explained that the local efficiency, clustering coefficient, gamma and sigma values, and transitivity were positively correlated with the muscle strength of contralesional hemisphere limbs. Moreover, the contralesional primary motor area is necessary for recovery if a lesion invaded large parts of the motor area (36). Since the contralateral cortex is persistently involved in compensating for impaired motor function, we believed that the reason patients suffer from preoperative motor deficits was that this compensated motor function was further damaged by growing gliomas. In addition, the shortest path length was insignificantly changed both in the deficit and non-deficit groups. Accordingly, similar to stroke patients increasing the small-worldness of the network after recovery training (29). Based on the evidence we found in patients with glioma, we hypothesized that the cSMN firstly acquired a high conveying efficiency (improved small-worldness of the cSMN) to participate in compensating for the damaged motor function in the lesional hemisphere (non-deficit stage). Subsequently, the cSMN developed a low conveying efficiency (reduced small-worldness in the cSMN) because the compensatory motor function was further damaged by the growing glioma (deficit stage). Furthermore, this finding does not contradict the conventional theory that motor function is controlled by the contralateral hemisphere. Despite the participation of the contralesional hemisphere in motor functional compensation, patients would still suffer from motor deficits as the disease progresses in the lesional hemisphere.
Vulnerability evaluates the stability of a network (14), which represents the alterations of the conveying efficiency if each node in a network is replaced (28, 37). In our study, the vulnerability of the cSMN increased in the non-deficit group, but was insignificantly altered in the deficit group. This finding indicates that the cSMN in the deficit group was more stable than that in the non-deficit group.
Tumor grade is not a determined factor for the different network alterations in the deficit and non-deficit groups. The theory of compensatory functions in glioma patients is that, when a glioma appears, the functional network begins remodeling to compensate for the damaged functions (8). This compensation firstly recruits tissues surrounding the glioma, and then the homotopic areas in the contralesional hemisphere if the damaged function cannot be compensated by surrounding tissues (3). This theory supports the existence of the compensatory stage of motor function in glioma patients. Some studies revealed that high-grade gliomas (HGGs), as well as low-grade gliomas (LGGs), were able to induce contralateral network reorganization (38–41) and neuroplasticity (42–44). Unlike stoke, gliomas are relatively slow growing; therefore, the brain tissue around the tumor has enough time to develop neuroplasticity, which may occur earlier in HGG than in LGG due to its high invasiveness (2, 40). In order to identify the differences of brain networks between the compensatory and decompensated stages, patients with HGGs are a good model since those with LGGs often have normal function at surgery. Moreover, the clinical manifestations of patients showed that the influence of HGGs is also gradually aggravated (45). To avoid bias, the tumor volume and tumor grade were regressed out as covariates in this study.
Some patients with HGGs suffered from motor deficits, which meant that the compensation of motor function was insufficient (46). Therefore, combined with the alterations of conveying efficiency in the different stages (compensatory and decompensatory stages), we concluded that the cSMN sacrificed stability to exchange conveying efficiency in order to compensate for the damaged motor function in the compensatory stage. Meanwhile, the healthy hemisphere maintained its own motor function with low conveying efficiency. In the decompensatory stage, when the motor function in the lesional hemisphere was completely destroyed by the growing glioma, the conveying efficiency of the contralesional hemisphere was unable to recover and remained low, and the cSMN returned to a stable status.
Regarding the alterations in nodal properties, we found that most of the alterations focused on the primary sensorimotor areas and motor-related thalamus. We found an increasing tendency of alterations of nodal properties in the non-deficit group and an unchanging tendency in the deficit group compared with the healthy group. This finding further verified that the contralesional sensorimotor cortices are crucial for motor functional compensation (47, 48). Moreover, our results showed that, regardless of the glioma location, the nodal efficiency, nodal clustering coefficient, and nodal local efficiency of the nodes (premotor-related thalamus) increased in the non-deficit group and decreased in the deficit group. These findings indicated that the premotor-related thalamus played an important role in compensating for the damaged motor function in the non-deficit stage and significantly decreased the conveying efficiency in the deficit stage. Previous studies showed that the contralesional motor-related thalamus participated in motor plasticity by changing pathways and building midline-crossing contralesional corticospinal fibers (47, 48). Hence, our findings verified this theory through functional networks and differed from previous verification through structural networks. Furthermore, as previous studies have shown, the motor-related thalamus is crucial for the modulation of motor function (30, 49–51). Our findings might provide a target for further protection in operations and for stimulating treatment using repetitive transcranial magnetic stimulation post-operation.
An important point that should be raised is that our study did not investigate the interhemispheric alterations of FCs or topological properties in order to avoid negative effects from neurovascular uncoupling and tumor occupation as much as possible. In this study, we chose the cSMN because the origin of blood supply in each hemisphere is different. Consequently, the interhemispheric FC, as well as the topological properties of the entire sensorimotor network, could not be investigated. Previous studies showed that neurovascular uncoupling affects the results of rs-fMRI (52), but we considered that their conclusions were biased due to the calculation of interhemispheric FCs (53). In fact, no significant difference in the FCs of the cSMN between the patient and healthy groups was found in previous glioma-relevant studies (53–55). Our findings in FCs are consistent with these previous studies.
The most important limitation of this study is that, although our findings are encouraging, they are still conjectures based on the controversial theory that the symmetric cortex is able to compensate for the damaged function in the lesional hemisphere (55, 56). The use of transcranial magnetic stimulation may validate our findings in the future.
In summary, alteration of the topological properties of the cSMN is a dynamic process in patients with gliomas. Two stages of motor functional alterations may exist. In the compensatory stage, the cSMN sacrificed stability to acquire high conveying efficiency and to compensate for the damaged motor function of the lesional hemisphere. With tumor growth and deterioration, patients enter the decompensatory stage, and motor dysfunction on the affected side arises. The cSMN returns to a stable state and maintains healthy hemispheric motor function, but with low efficiency.
Data Availability Statement
The raw data supporting the conclusions of this article will be made available by the authors, without undue reservation.
Ethics Statement
The studies involving human participants were reviewed and approved by the IRB of Beijing Tiantan Hospital. The patients/participants provided written informed consent to participate in this study.
Author Contributions
SF, LL, SW, and YG: study concept and design. SF, LL, SW, ZZ, and YG: data acquisition and analysis. SF, XF, and YW: statistics/verified analytical method. SF, XF, and YW: writing the first draft. XF, YW, and TJ: study supervision. All authors contributed to the article and approved the submitted version.
Funding
This work was supported by the Public Welfare Development and Reform Pilot Project of Beijing Medical Research Institute (PXM2019_026280_000008), Beijing Municipal Natural Science Foundation (No. 7202021), National Natural Science Foundation of China (No. 82001777), and the Research Unit of Accurate Diagnosis, Treatment, and Translational Medicine of Brain Tumors (No. 2019-I2M-5-021).
Conflict of Interest
The authors declare that the research was conducted in the absence of any commercial or financial relationships that could be construed as a potential conflict of interest.
Publisher’s Note
All claims expressed in this article are solely those of the authors and do not necessarily represent those of their affiliated organizations, or those of the publisher, the editors and the reviewers. Any product that may be evaluated in this article, or claim that may be made by its manufacturer, is not guaranteed or endorsed by the publisher.
Acknowledgments
We thank Dr. Meng Lanxi for imaging data acquisition.
Supplementary Material
The Supplementary Material for this article can be found online at: https://www.frontiersin.org/articles/10.3389/fonc.2022.882313/full#supplementary-material
References
1. Jiang T, Nam DH, Ram Z, Poon WS, Wang J, Boldbaatar D, et al. Clinical Practice Guidelines for the Management of Adult Diffuse Gliomas. Cancer Lett (2020) 499:60–72. doi: 10.1016/j.canlet.2020.10.050
2. Almairac F, Duffau H, Herbet G. Contralesional Macrostructural Plasticity of the Insular Cortex in Glioma Patients. Neurology (2018) 91(20):e1902–8. doi: 10.1212/wnl.0000000000006517
3. Duffau H. Brain Plasticity and Tumors. Adv Tech Stand Neurosurg (2008) 33:3–33. doi: 10.1007/978-3-211-72283-1_1
4. Payne BR, Lomber SG. Reconstructing Functional Systems After Lesions of Cerebral Cortex. Nat Rev Neurosci (2001) 212:911–9. doi: 10.1038/35104085
5. Heiss WD, Thiel A, Kessler J, Herholz K. Disturbance and Recovery of Language Function: Correlates in PET Activation Studies. Neuroimage (2003) 20 Suppl 1:S42–9. doi: 10.1016/j.neuroimage.2003.09.005
6. Duffau H. Hodotopy, Neuroplasticity and Diffuse Gliomas. Neurochirurgie (2017) 633:259–65. doi: 10.1016/j.neuchi.2016.12.001
7. Herbet G, Maheu M, Costi E, Lafargue G, Duffau H. Mapping Neuroplastic Potential in Brain-Damaged Patients. Brain (2016) 139(Pt 3):829–44. doi: 10.1093/brain/awv394
8. Duffau H. Functional Mapping Before and After Low-Grade Glioma Surgery: A New Way to Decipher Various Spatiotemporal Patterns of Individual Neuroplastic Potential in Brain Tumor Patients. Cancers (Basel) (2020) 129. doi: 10.3390/cancers12092611
9. Li Q, Dong JW, Del Ferraro G, Petrovich Brennan N, Peck KK, Tabar V, et al. Functional Translocation of Broca's Area in a Low-Grade Left Frontal Glioma: Graph Theory Reveals the Novel, Adaptive Network Connectivity. Front Neurol (2019) 10:702. doi: 10.3389/fneur.2019.00702
10. Stretton J, Sidhu MK, Winston GP, Bartlett P, McEvoy AW, Symms MR, et al. Working Memory Network Plasticity After Anterior Temporal Lobe Resection: A Longitudinal Functional Magnetic Resonance Imaging Study. Brain (2014) 137(Pt 5):1439–53. doi: 10.1093/brain/awu061
11. Polania R, Paulus W, Antal A, Nitsche MA. Introducing Graph Theory to Track for Neuroplastic Alterations in the Resting Human Brain: A Transcranial Direct Current Stimulation Study. Neuroimage (2011) 543:2287–96. doi: 10.1016/j.neuroimage.2010.09.085
12. Liu D, Chen J, Hu X, Hu G, Liu Y, Yang K, et al. Contralesional Homotopic Functional Plasticity in Patients With Temporal Glioma. J Neurosurg (2020) 1–9. doi: 10.3171/2019.11.JNS191982
13. Hart MG, Ypma RJ, Romero-Garcia R, Price SJ, Suckling J. Graph Theory Analysis of Complex Brain Networks: New Concepts in Brain Mapping Applied to Neurosurgery. J Neurosurg (2016) 1246:1665–78. doi: 10.3171/2015.4.JNS142683
14. Fang S, Zhou C, Fan X, Jiang T, Wang Y. Epilepsy-Related Brain Network Alterations in Patients With Temporal Lobe Glioma in the Left Hemisphere. Front Neurol (2020) 11:684. doi: 10.3389/fneur.2020.00684
15. Yun JY, Boedhoe PSW, Vriend C, Jahanshad N, Abe Y, Ameis SH, et al. Brain Structural Covariance Networks in Obsessive-Compulsive Disorder: A Graph Analysis From the ENIGMA Consortium. Brain (2020) 1432:684–700. doi: 10.1093/brain/awaa001
16. Fang S, Zhou C, Wang L, Fan X, Wang Y, Zhang Z, et al. Characteristic Alterations of Network in Patients With Intraoperative Stimulation-Induced Seizures During Awake Craniotomy. Front Neurol (2021) 12:602716. doi: 10.3389/fneur.2021.602716
17. Wang J, Wang X, Xia M, Liao X, Evans A, He Y. Corrigendum: GRETNA: A Graph Theoretical Network Analysis Toolbox for Imaging Connectomics. Front Hum Neurosci (2015) 9:458. doi: 10.3389/fnhum.2015.00458
18. Wang J, Wang X, Xia M, Liao X, Evans A, He Y. GRETNA: A Graph Theoretical Network Analysis Toolbox for Imaging Connectomics. Front Hum Neurosci (2015) 9:386. doi: 10.3389/fnhum.2015.00386
19. Calhoun VD, Wager TD, Krishnan A, Rosch KS, Seymour KE, Nebel MB, et al. The Impact of T1 Versus EPI Spatial Normalization Templates for fMRI Data Analyses. Hum Brain Mapp (2017) 3811:5331–42. doi: 10.1002/hbm.23737
20. Hadjiabadi DH, Pung L, Zhang J, Ward BD, Lim WT, Kalavar M, et al. Brain Tumors Disrupt the Resting-State Connectome. NeuroImage Clin (2018) 18:279–89. doi: 10.1016/j.nicl.2018.01.026
21. Agarwal S, Sair HI, Pillai JJ. The Problem of Neurovascular Uncoupling. Neuroimaging Clin N Am (2021) 311:53–67. doi: 10.1016/j.nic.2020.09.003
22. Sun H, Vachha B, Laino ME, Jenabi M, Flynn JR, Zhang Z, et al. Decreased Hand Motor Resting-State Functional Connectivity in Patients With Glioma: Analysis of Factors Including Neurovascular Uncoupling. Radiology (2020) 2943:610–21. doi: 10.1148/radiol.2019190089
23. Fan L, Li H, Zhuo J, Zhang Y, Wang J, Chen L, et al. The Human Brainnetome Atlas: A New Brain Atlas Based on Connectional Architecture. Cereb Cortex (2016) 268:3508–26. doi: 10.1093/cercor/bhw157
24. Bernhardt BC, Chen Z, He Y, Evans AC, Bernasconi N. Graph-Theoretical Analysis Reveals Disrupted Small-World Organization of Cortical Thickness Correlation Networks in Temporal Lobe Epilepsy. Cereb Cortex (2011) 219:2147–57. doi: 10.1093/cercor/bhq291
25. He Y, Wang J, Wang L, Chen ZJ, Yan C, Yang H, et al. Uncovering Intrinsic Modular Organization of Spontaneous Brain Activity in Humans. PloS One (2009) 44:e5226. doi: 10.1371/journal.pone.0005226
26. Mazrooyisebdani M, Nair VA, Garcia-Ramos C, Mohanty R, Meyerand E, Hermann B, et al. Graph Theory Analysis of Functional Connectivity Combined With Machine Learning Approaches Demonstrates Widespread Network Differences and Predicts Clinical Variables in Temporal Lobe Epilepsy. Brain Connect (2020) 101:39–50. doi: 10.1089/brain.2019.0702
27. Paldino MJ, Zhang W, Chu ZD, Golriz F. Metrics of Brain Network Architecture Capture the Impact of Disease in Children With Epilepsy. NeuroImage Clin (2017) 13:201–8. doi: 10.1016/j.nicl.2016.12.005
28. Latora V, Marchiori M. Vulnerability and Protection of Infrastructure Networks. Phys Rev E Stat Nonlin Soft Matter Phys (2005) 71(1 Pt 2):15103. doi: 10.1103/PhysRevE.71.015103
29. Laney J, Adali T, McCombe Waller S, Westlake KP. Quantifying Motor Recovery After Stroke Using Independent Vector Analysis and Graph-Theoretical Analysis. NeuroImage Clin (2015) 8:298–304. doi: 10.1016/j.nicl.2015.04.014
30. Aswendt M, Pallast N, Wieters F, Baues M, Hoehn M, Fink GR. Lesion Size- and Location-Dependent Recruitment of Contralesional Thalamus and Motor Cortex Facilitates Recovery After Stroke in Mice. Transl Stroke Res (2021) 12(1):87–97. doi: 10.1007/s12975-020-00802-3
31. Sporns O, Zwi JD. The Small World of the Cerebral Cortex. Neuroinformatics (2004) 22:145–62. doi: 10.1385/NI:2:2:145
32. Ponten SC, Bartolomei F, Stam CJ. Small-World Networks and Epilepsy: Graph Theoretical Analysis of Intracerebrally Recorded Mesial Temporal Lobe Seizures. Clin Neurophysiol (2007) 1184:918–27. doi: 10.1016/j.clinph.2006.12.002
33. Qi S, Mu YF, Cui LB, Zhang J, Guo F, Tan QR, et al. Anomalous Gray Matter Structural Networks in Recent Onset Post-Traumatic Stress Disorder. Brain Imaging Behav (2018) 122:390–401. doi: 10.1007/s11682-017-9693-z
34. Hendrix P, Hans E, Griessenauer CJ, Simgen A, Oertel J, Karbach J. Neurocognitive Status in Patients With Newly-Diagnosed Brain Tumors in Good Neurological Condition: The Impact of Tumor Type, Volume, and Location. Clin Neurol Neurosurg (2017) 156:55–62. doi: 10.1016/j.clineuro.2017.03.009
35. Noll KR, Sullaway C, Ziu M, Weinberg JS, Wefel JS. Relationships Between Tumor Grade and Neurocognitive Functioning in Patients With Glioma of the Left Temporal Lobe Prior to Surgical Resection. Neuro Oncol (2015) 174:580–7. doi: 10.1093/neuonc/nou233
36. Di Pino G, Pellegrino G, Assenza G, Capone F, Ferreri F, Formica D, et al. Modulation of Brain Plasticity in Stroke: A Novel Model for Neurorehabilitation. Nat Rev Neurol (2014) 1010:597–608. doi: 10.1038/nrneurol.2014.162
37. Hart MG, Price SJ, Suckling J. Connectome Analysis for Pre-Operative Brain Mapping in Neurosurgery. Br J Neurosurg (2016) 305:506–17. doi: 10.1080/02688697.2016.1208809
38. De Baene W, Rutten GJM, Sitskoorn MM. The Temporal Pattern of a Lesion Modulates the Functional Network Topology of Remote Brain Regions. Neural Plast (2017) 2017:3530723. doi: 10.1155/2017/3530723
39. Fandino J, Kollias SS, Wieser HG, Valavanis A, Yonekawa Y. Intraoperative Validation of Functional Magnetic Resonance Imaging and Cortical Reorganization Patterns in Patients With Brain Tumors Involving the Primary Motor Cortex. J Neurosurg (1999) 912:238–50. doi: 10.3171/jns.1999.91.2.0238
40. Cargnelutti E, Ius T, Skrap M, Tomasino B. What do We Know About Pre- and Postoperative Plasticity in Patients With Glioma? A Review of Neuroimaging and Intraoperative Mapping Studies. NeuroImage Clin (2020) 28:102435. doi: 10.1016/j.nicl.2020.102435
41. Zimmermann M, Rossler K, Kaltenhauser M, Grummich P, Brandner N, Buchfelder M, et al. Comparative fMRI and MEG Localization of Cortical Sensorimotor Function: Bimodal Mapping Supports Motor Area Reorganization in Glioma Patients. PloS One (2019) 143:e0213371. doi: 10.1371/journal.pone.0213371
42. Conway N, Wildschuetz N, Moser T, Bulubas L, Sollmann N, Tanigawa N, et al. Cortical Plasticity of Motor-Eloquent Areas Measured by Navigated Transcranial Magnetic Stimulation in Patients With Glioma. J Neurosurg (2017) 1275:981–91. doi: 10.3171/2016.9.JNS161595
43. Zhang N, Xia M, Qiu T, Wang X, Lin CP, Guo Q, et al. Reorganization of Cerebro-Cerebellar Circuit in Patients With Left Hemispheric Gliomas Involving Language Network: A Combined Structural and Resting-State Functional MRI Study. Hum Brain Mapp (2018) 3912:4802–19. doi: 10.1002/hbm.24324
44. Majos A, Bryszewski B, Kosla KN, Pfaifer L, Jaskolski D, Stefanczyk L. Process of the Functional Reorganization of the Cortical Centers for Movement in GBM Patients: fMRI Study. Clin Neuroradiol (2017) 271:71–9. doi: 10.1007/s00062-015-0398-7
45. Rossi M, Conti Nibali M, Vigano L, Puglisi G, Howells H, Gay L, et al. Resection of Tumors Within the Primary Motor Cortex Using High-Frequency Stimulation: Oncological and Functional Efficiency of This Versatile Approach Based on Clinical Conditions. J Neurosurg (2019) 1–13. doi: 10.3171/2019.5.JNS19453
46. Duffau H. The Huge Plastic Potential of Adult Brain and the Role of Connectomics: New Insights Provided by Serial Mappings in Glioma Surgery. Cortex (2014) 58:325–37. doi: 10.1016/j.cortex.2013.08.005
47. Snyder DB, Beardsley SA, Schmit BD. Role of the Cortex in Visuomotor Control of Arm Stability. J Neurophysiol (2019) 1225:2156–72. doi: 10.1152/jn.00003.2019
48. Chowdhury RH, Glaser JI, Miller LE. Area 2 of Primary Somatosensory Cortex Encodes Kinematics of the Whole Arm. Elife (2020) 9. doi: 10.7554/eLife.48198
49. DeSimone JC, Archer DB, Vaillancourt DE, Wagle Shukla A. Network-Level Connectivity is a Critical Feature Distinguishing Dystonic Tremor and Essential Tremor. Brain (2019) 1426:1644–59. doi: 10.1093/brain/awz085
50. Klingner CM, Brodoehl S, Witte OW, Guntinas-Lichius O, Volk GF. The Impact of Motor Impairment on the Processing of Sensory Information. Behav Brain Res (2019) 359:701–8. doi: 10.1016/j.bbr.2018.09.016
51. Wahl AS, Omlor W, Rubio JC, Chen JL, Zheng H, Schroter A, et al. Neuronal Repair. Asynchronous Therapy Restores Motor Control by Rewiring of the Rat Corticospinal Tract After Stroke. Science (2014) 3446189:1250–5. doi: 10.1126/science.1253050
52. Agarwal S, Sair HI, Yahyavi-Firouz-Abadi N, Airan R, Pillai JJ. Neurovascular Uncoupling in Resting State fMRI Demonstrated in Patients With Primary Brain Gliomas. J Magn Reson Imaging (2016) 43(3):620–6. doi: 10.1002/jmri.25012
53. Mallela AN, Peck KK, Petrovich-Brennan NM, Zhang Z, Lou W, Holodny AI. Altered Resting-State Functional Connectivity in the Hand Motor Network in Glioma Patients. Brain Connect (2016) 68:587–95. doi: 10.1089/brain.2016.0432
54. Agarwal S, Lu H, Pillai JJ. Value of Frequency Domain Resting-State Functional Magnetic Resonance Imaging Metrics Amplitude of Low-Frequency Fluctuation and Fractional Amplitude of Low-Frequency Fluctuation in the Assessment of Brain Tumor-Induced Neurovascular Uncoupling. Brain Connect (2017) 76:382–9. doi: 10.1089/brain.2016.0480
55. Fox ME, King TZ. Functional Connectivity in Adult Brain Tumor Patients: A Systematic Review. Brain Connectivity (2018) 87:381–97. doi: 10.1089/brain.2018.0623
Keywords: resting-state functional magnetic resonance images, graph theory, brain reorganization, topological property, glioma
Citation: Fang S, Li L, Weng S, Guo Y, Zhong Z, Fan X, Jiang T and Wang Y (2022) Contralesional Sensorimotor Network Participates in Motor Functional Compensation in Glioma Patients. Front. Oncol. 12:882313. doi: 10.3389/fonc.2022.882313
Received: 23 February 2022; Accepted: 11 March 2022;
Published: 22 April 2022.
Edited by:
Sandro M. Krieg, Technical University of Munich, GermanyReviewed by:
Guangxiang Chen, The Affiliated Hospital of Southwest Medical University, ChinaS. Ottavio Tomasi, Paracelsus Medical University, Austria
Copyright © 2022 Fang, Li, Weng, Guo, Zhong, Fan, Jiang and Wang. This is an open-access article distributed under the terms of the Creative Commons Attribution License (CC BY). The use, distribution or reproduction in other forums is permitted, provided the original author(s) and the copyright owner(s) are credited and that the original publication in this journal is cited, in accordance with accepted academic practice. No use, distribution or reproduction is permitted which does not comply with these terms.
*Correspondence: Xing Fan, xingkongyaoxiang@163.com; Tao Jiang, taojiang1964@foxmail.com; Yinyan Wang, tiantanyinyan@126.com