
94% of researchers rate our articles as excellent or good
Learn more about the work of our research integrity team to safeguard the quality of each article we publish.
Find out more
ORIGINAL RESEARCH article
Front. Oncol. , 13 May 2022
Sec. Pharmacology of Anti-Cancer Drugs
Volume 12 - 2022 | https://doi.org/10.3389/fonc.2022.877657
This article is part of the Research Topic Hepatocellular Carcinoma: Novel Treatment Strategies, volume II View all 22 articles
Neural infiltration is a critical component of the tumor microenvironment; however, owing to technological limitations, its role in hepatocellular cancer remains obscure. Herein, we obtained the RNA-sequencing data of liver hepatocellular carcinoma (LIHC) from The Cancer Genome Atlas database and performed a series of bioinformatic analyses, including prognosis analysis, pathway enrichment, and immune analysis, using the R software packages, Consensus Cluster Plus and Limma. LIHC could be divided into two subtypes according to the expression of neural-related genes (NRGs); moreover, there are statistic differences in the prognosis, stage, and immune regulation between the two subtypes. The prognostic model showed that high expression of NRGs correlated with a poor survival prognosis (P<0.05). Further, CHRNE, GFRA2, GFRA3, and GRIN2D was significantly correlated with LIHC clinical prognosis, clinical stage, immune infiltration, immune response, and vital signaling pathways. There was nerve-cancer crosstalk in LIHC. A reclassification of LIHC based on NRG expression may prove beneficial to clinical practice. CHRNE, GFRA2, GFRA3, and GRIN2D may serve as potential biomarker for liver cancer prognosis or immune response.
According to the annually published statistics of the American Cancer Society, liver cancer has been among the ten leading cancer types with respect to incidence and mortality rates (1). Despite the majority of the risk factors, such as hepatitis virus infection, and excess alcohol consumption, being modifiable, the incidence of liver cancer in women is estimated to rise (1).
The liver is under neural control through sympathetic and parasympathetic nerves. For example, the sympathetic nerve fiber modulator neuregulin 4 (NRG4) negatively regulates brown adipocyte differentiation, hepatic steatosis, and hepatic lipogenesis in a cell-autonomous manner (2). Recently, Mizuno et al. have shown that the nerve fiber areal ratios (NFARs) for total nerve fibers and sympathetic nerve fibers were reduced in the liver biopsy samples from patients with viral hepatitis and liver fibrosis, and NFAR recovery might be seen after the antiviral treatment for hepatitis C as well as the improvement of liver fibrosis (3). In general, previous studies have shown that the hepatic nervous system has several modulatory effects on liver glucose metabolism, lipid metabolism, bile secretion, repair, and regeneration (4).
Mounting evidence suggests a nerve–cancer crosstalk in liver cancer. Yong et al. uncovered that the mesencephalic astrocyte-derived neurotrophic factor inhibited epithelial–mesenchymal transition and liver cancer progression via the suppression of the nuclear factor kappa-light-chain-enhancer of activated B cells/Snail signaling, cultivating a nexus among endoplasmic reticulum stress, and liver cancer inflammation and progression (5). Additionally, Lin et al. demonstrated that the nerve growth factor influenced cancer invasion and metastasis by regulating the polarity and motility of liver cancer cells (6). Thus far, the research on nerve–cancer crosstalk is at an early stage, and the functional role of neural-related genes (NRGs) in liver cancer are obscure. We proposed that neuroregulation is associated with a series of biological processes in the liver, including cancer progression, metabolism, and immunoregulation. In this study, we attempted to provide a comprehensive analysis of the involvement of NRGs in the clinical prognosis as well as disease subgroups and interpret their biological and clinical significance in critical signaling pathways.
We obtained the original data and corresponding clinical information of 371 liver hepatocellular carcinoma (LIHC) cases from The Cancer Genome Atlas (TCGA) database (https://portal.gdc.com). A total of 42 NRGs were identified from a previous comprehensive review (7). Four NRGs, ADRB3, CHRM1, CHRM2, and CHRNA9, were eliminated since they were not expressed in LIHC. The R software package ConsensusClusterPlus (v1.54.0) (8) was applied for consensus analysis. The PAC structure of the tool identifies the default cluster number and is repeated 100 times to extract 80% of the sample, clusterAlg = “hc”, and innerLinkage= ‘ward. D2’. Heat map clustering was analyzed using the R software package pheatmap (v1.0.12). The genes with a variance above 0.1 were retained in the gene expression heat map. If the number of input target genes was more than 1,000, the top 25% genes were extracted and displayed, after sequencing, from a large to small variance.
Two subtypes were gained following a consensus analysis, and clinical information was downloaded. For CHRNE, GFRA2, GRIN2D, cutoff-high (top 25%) and cutoff-low (bottom 25%) and for GFRA3, cutoff-high (25%) and cutoff-low (25%) were used as thresholds. R software package (v4.0.3) ggplot2 (9) and pheatmap were applied. Significance p-values were analyzed by the chi-square test, where the size of the value was taken -log10 (p-value), and, if marked with *, it represents a significant difference in the distribution of this clinical characteristic in the corresponding two groups (p < 0.05).
The R software package Limma (v3.40.2) was used to study the differential expression of mRNA (10). Adjusted p-values were analyzed in TCGA or GTEx to correct for false- positive results. Adjusted P<0.05 with log2(FC) (multiple change)>1 or log2(FC) (multiple change) <-1 was defined as the threshold for the differential expression of mRNA. The differential expression analysis between subtypes was commonly used: C1 vs. C2. CHRNE, GFRA2, and GRIN2D used cutoff-high (top 25%) and cutoff-low (bottom 25%) as expression thresholds. GFRA3 used cutoff-high (25%) and cutoff-low (25%) as thresholds, since they had significantly low expression in LIHC.
The R software package ClusterProfiler (11) was used to carry out Gene Ontology (GO) (12), and the Kyoto Encyclopedia of Genes and Genomes (KEGG) (13) was used for the analysis of potential mRNA.
Based on the clinical information from 371 LIHC cases from the TCGA database, we generated Kaplan–Meier (KM) plots with log-rank P-value and time-dependent receiver operating characteristic (ROC) analysis to compare the predictive accuracy and risk score of 38 neural-related genes. The least absolute shrinkage and selection operator (LASSO) regression algorithm was used for feature selection, and 10-fold cross validation was used, lambda. min=0.071 (14). The R software package glmnet was used for the above analysis. For KM curves, p-values and hazard ratios with a 95% confidence interval (CI) were determined using a log rank test and univariate Cox proportional hazard regression. All the above analyses were performed using the R software package (v4.0.3). P<0.05 was considered as a statistical difference.
The one-class logistic regression (OCLR) algorithm, invented by Malta et al., was used to evaluate the stemness of mRNA (15).
CIBERSORT and EPIC from the R software package immunedeconv (https://grst.github.io/immunedeconv) were applied to analyze the immune infiltration of different subtypes (16). The R software packages (v4.0.3) ggplot2 and pheatmap were used for visualization.
We tested the correlation of specific neural-related gene expression and 8 commonly used immune checkpoint genes (ICGs) (e.g., CD274, CTLA4, HAVCR2, LAG3, PDCD1, PDCD1LC2, SIGLEC15 and TIGIT). The R software packages (v4.0.3) ggplot2 and pheatmap were used for visualization. The TIDE algorithm was applied to predict the therapeutic response to immune checkpoint blockades (ICBs) (16).
The data of 38 NRGs in LIHC were collected from the TCGA database. As mentioned previously, ADRB3, CHRM1, CHRM2, and CHRNA9 were eliminated since they were not expressed in LIHC. For identification of subtypes, the R software package ConsensusCluster Plus (V1.5.4.0) was applied to obtain 4 subtypes: group 1 (C1), group 2 (C2), group 3 (C3), and group 4 (C4) (Figures 1A–C). The groups C3 and C4 were excluded from this study due to limited sample size, which might lead to a confined biological or clinical value. Ten years post-follow-up, the overall survival (OS) and progression-free survival (PFS) of the four groups had no statistic difference (P>0.05) (Figure 1D). However, the 5-year OS and 3-year PFS of C1 were better than C2 (P=0.03; P=0.03) (Figure 1E). They could be attributable to the withdrawal of C1 during the sixth-year follow-up. In addition, C1 had a better T category, clinical staging, and pathological grading with a significant statistical difference (P<0.05) (Figure 2 and Table 1).
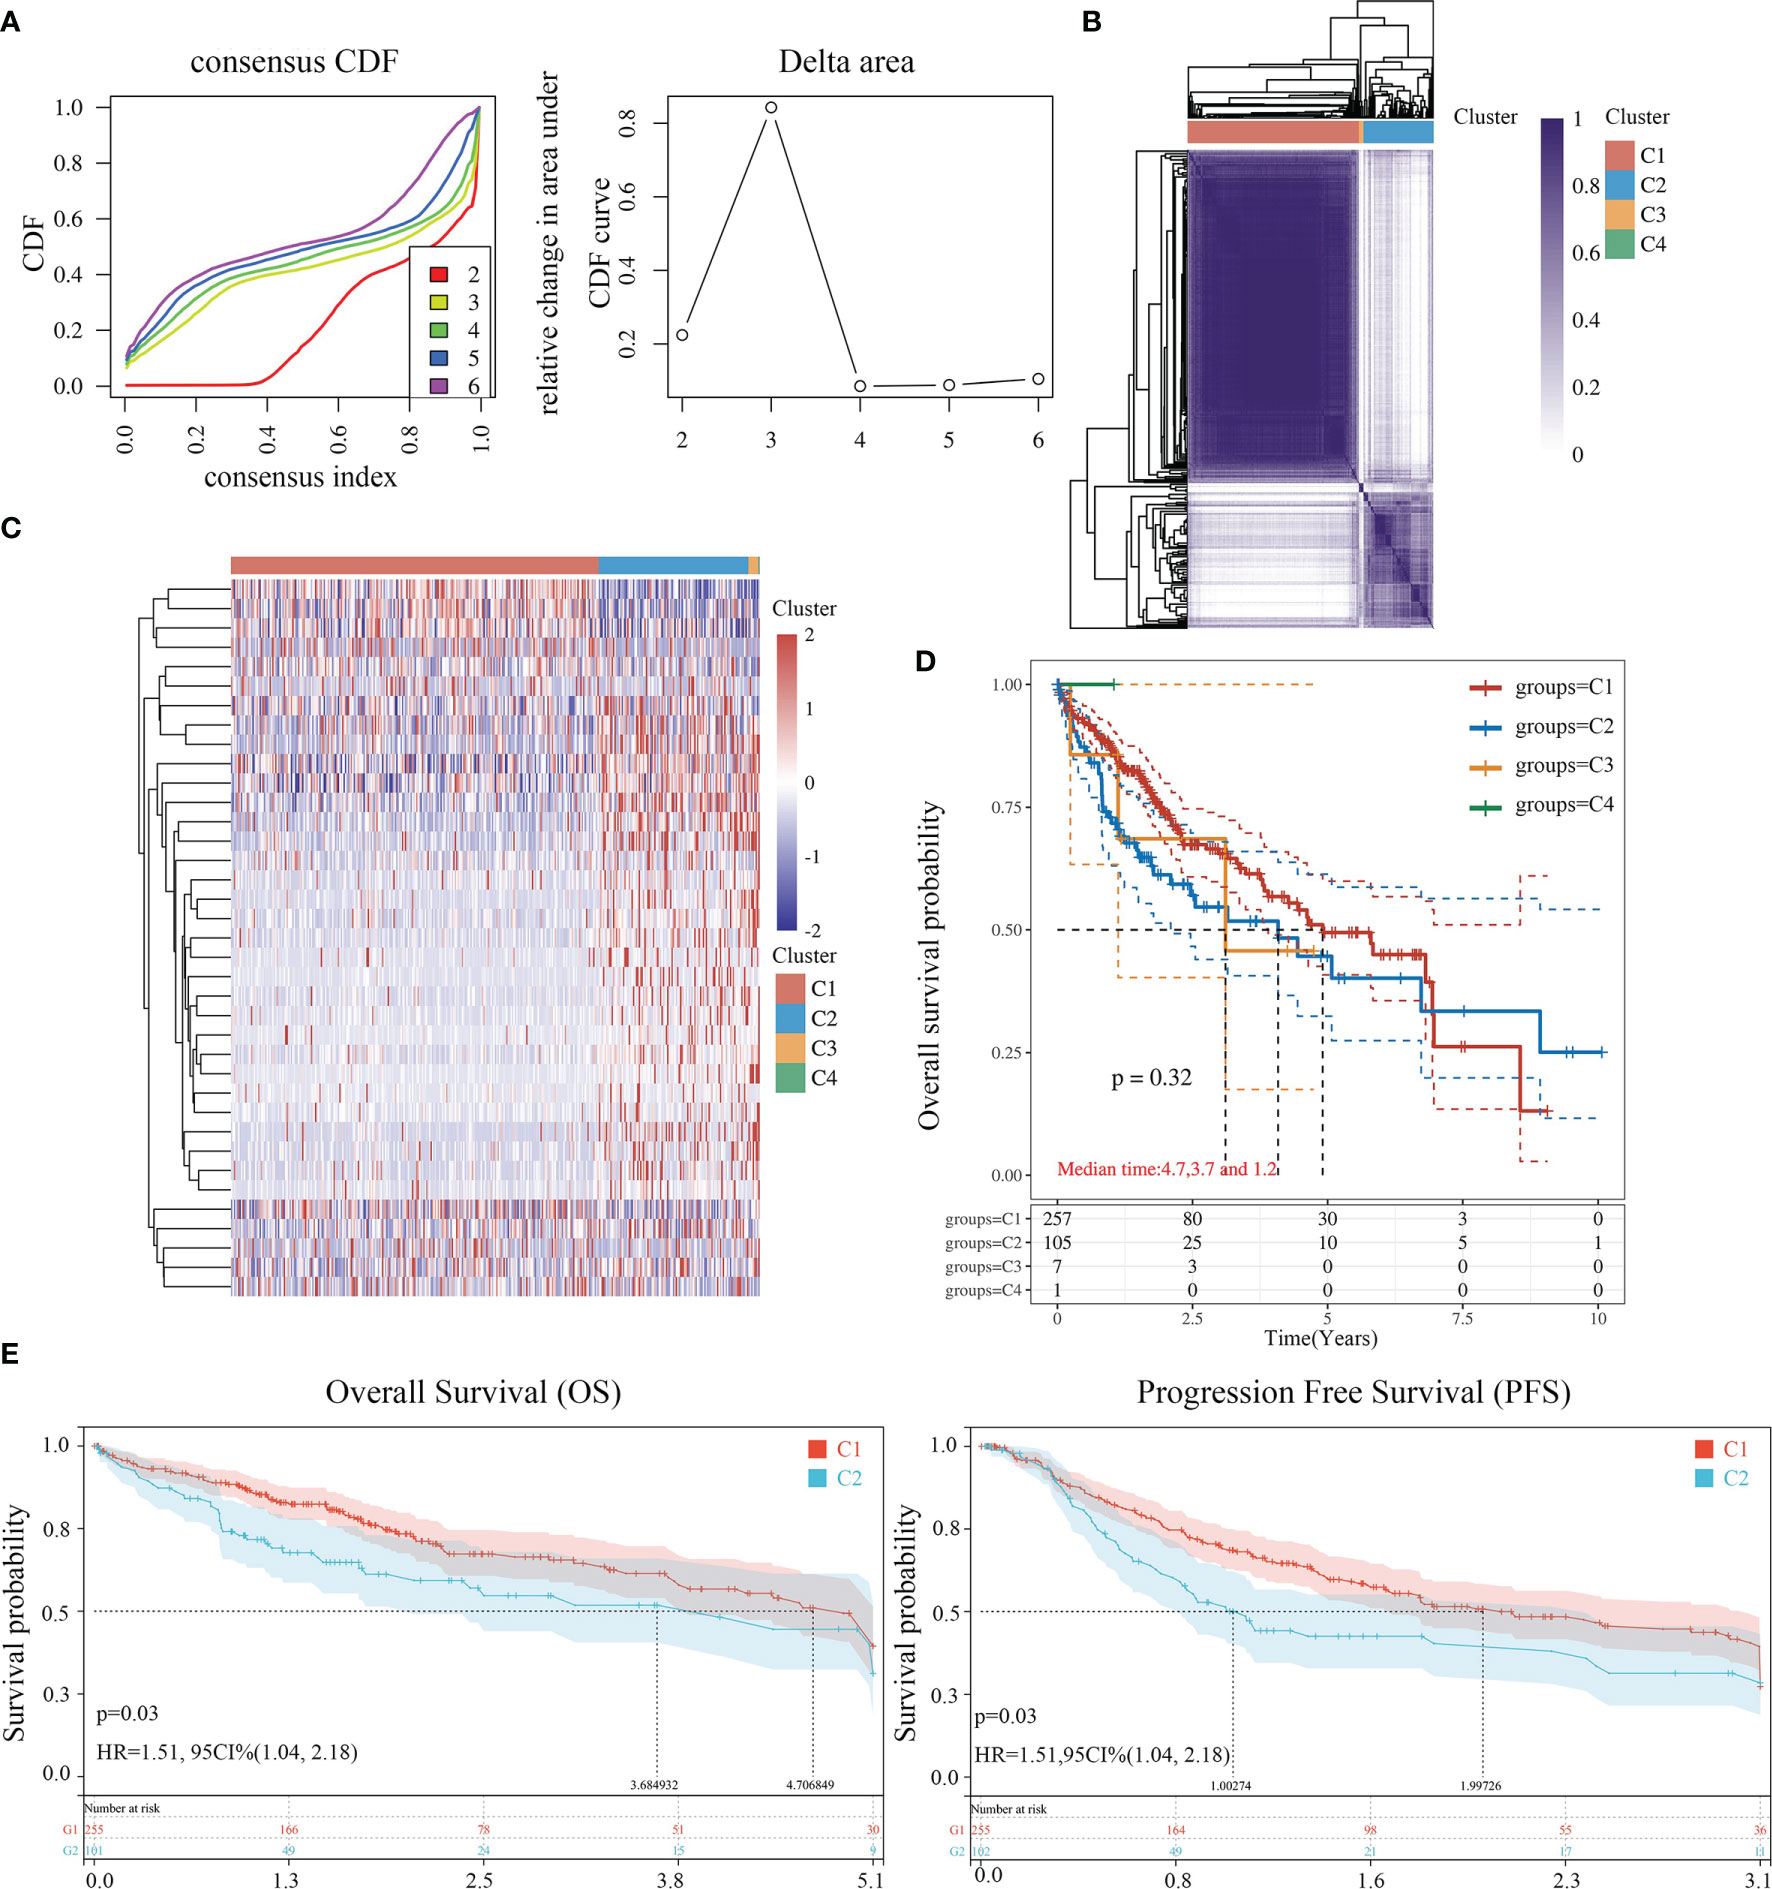
Figure 1 Identification of LIHC subtypes based on NRGs using ConsensusClusterPlus. (A) CDF curve and delta area curve of consensus clustering. (B) Heat map of consensus clustering solution. Rows and columns represent samples, and the colors represent different categories. (C) Heat map of NRG expression in different subtypes: red corresponds to high expression, while blue corresponds to low expression. (D) The KM survival curve of different samples in TCGA data sets. (E) The OS (5 years) and PFS KM curves (3 years) of groups C1 and C2.
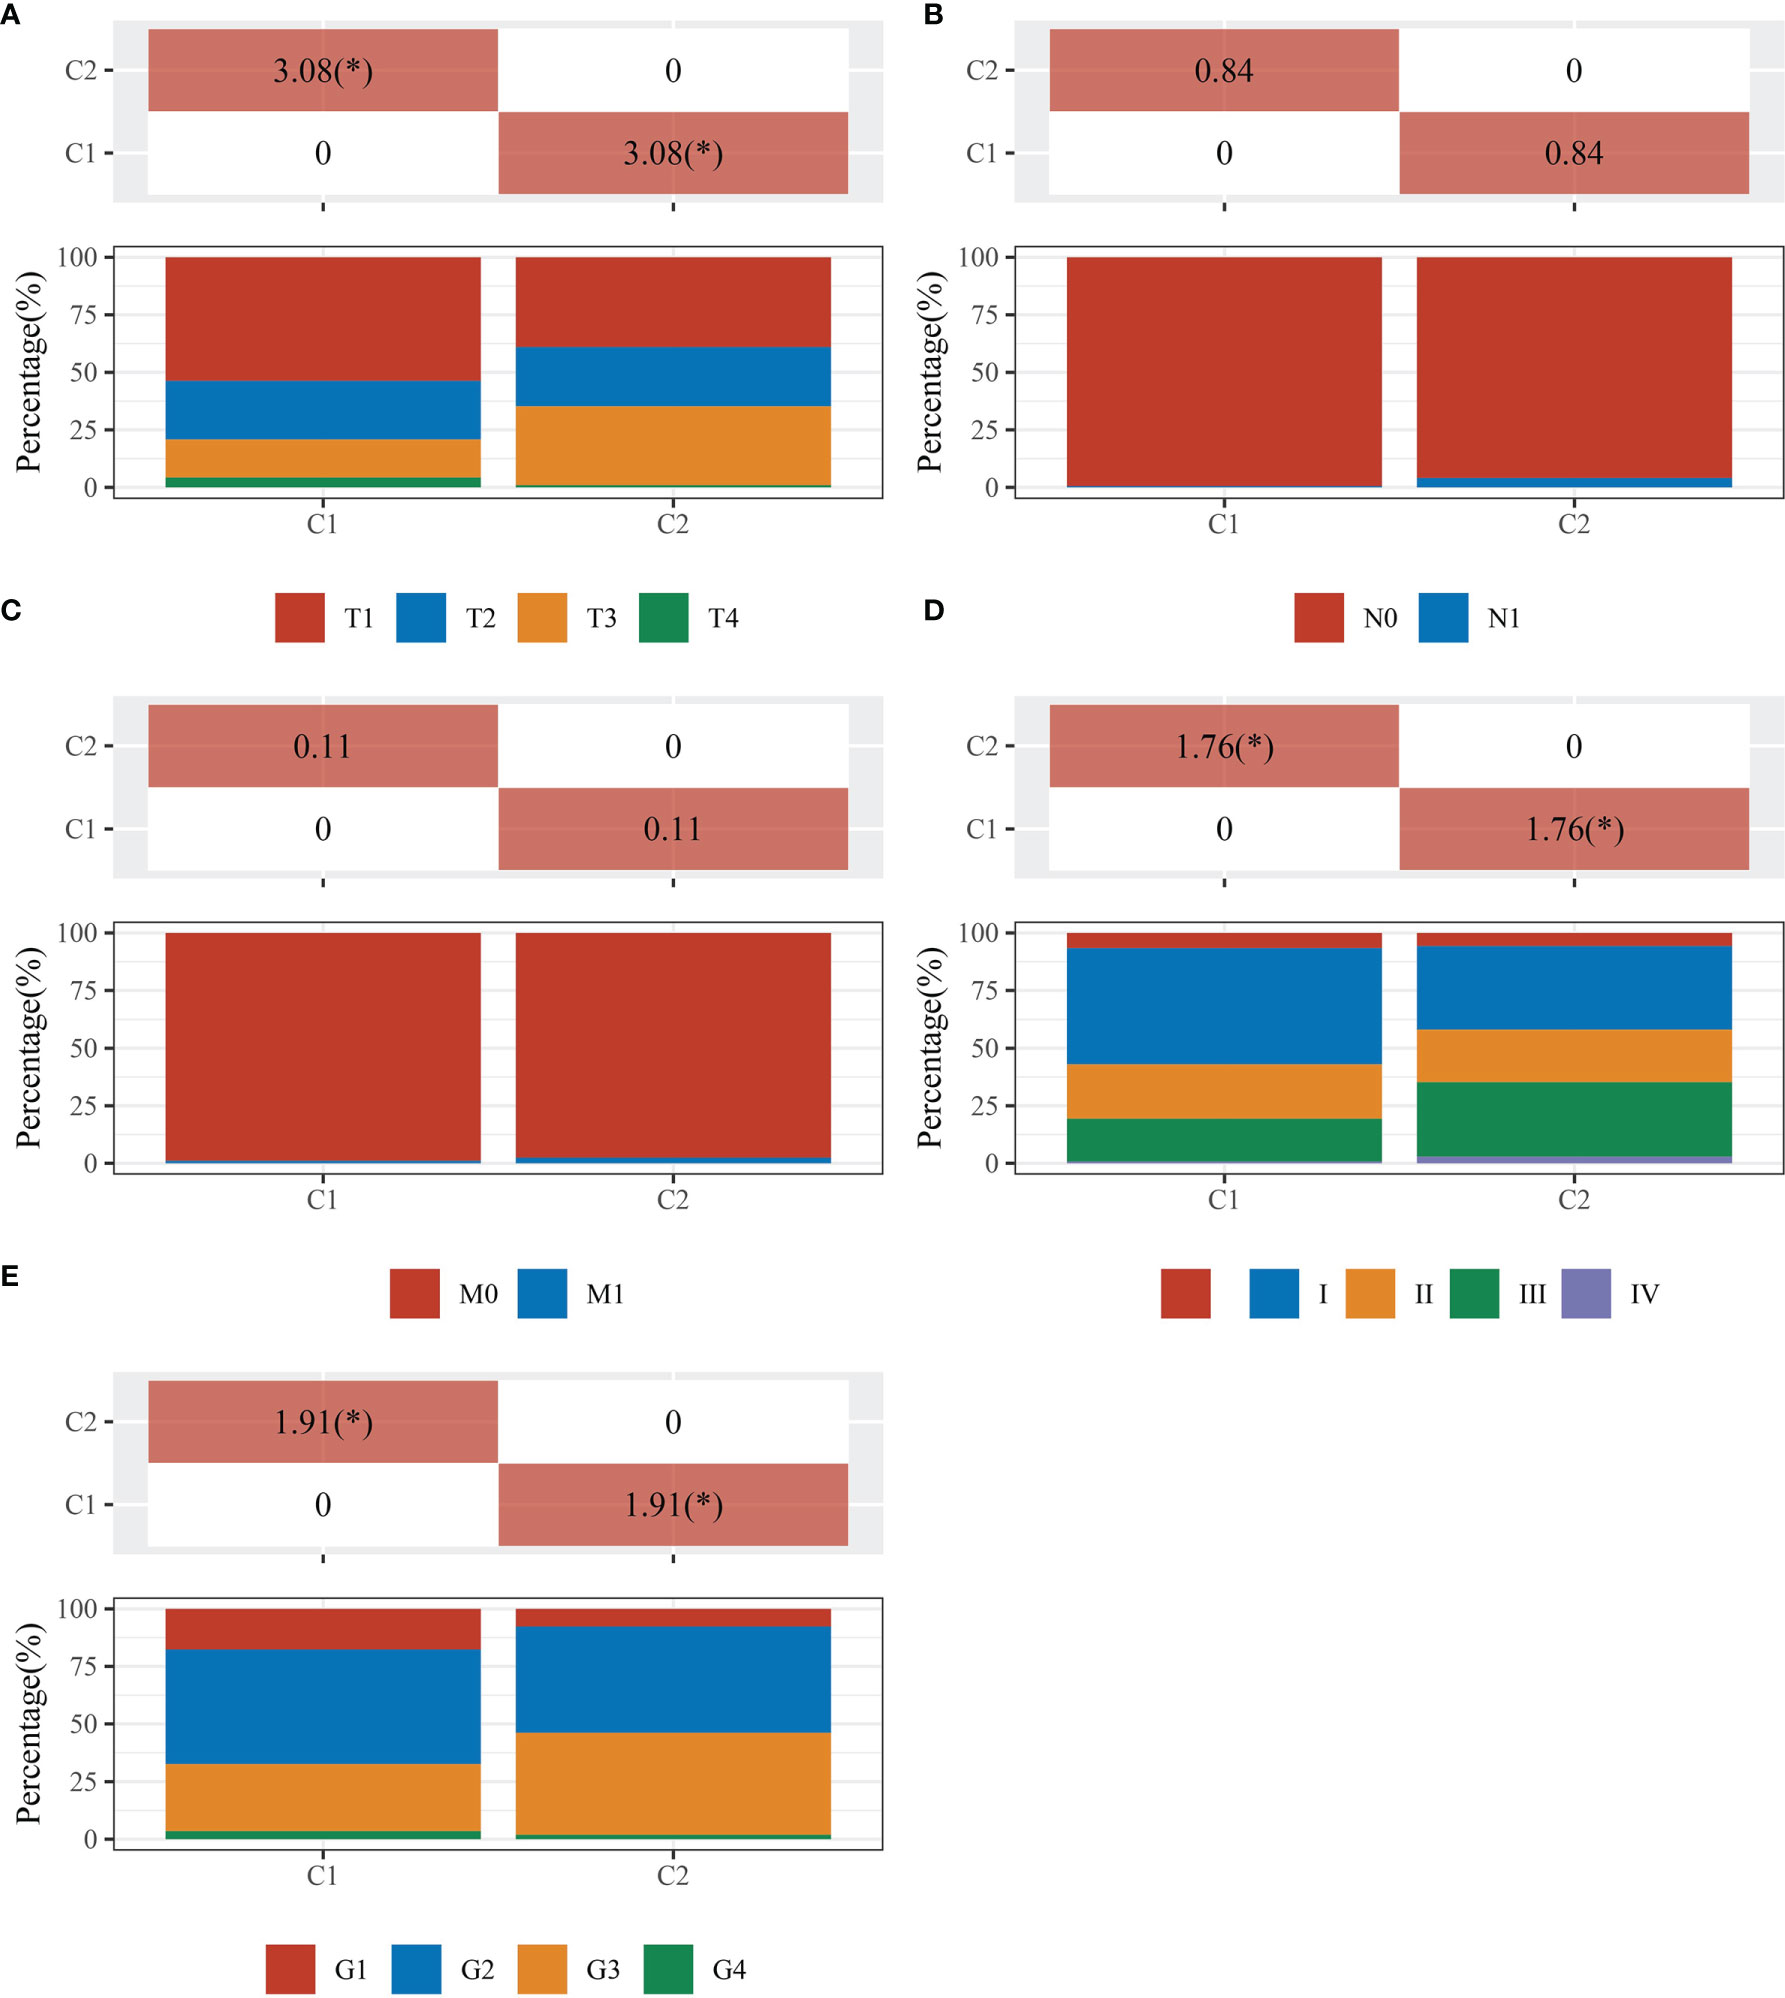
Figure 2 Comparisons of clinical characteristics between C1 and C2. The distribution of clinical characteristics of group C1 and C2. The horizontal axis represents different groups of samples. The vertical axis represents the percentage of clinical information contained in the corresponding grouped samples. The table above shows the p-value (-log10) of clinical feature significance in the two groups, which calculated by the chi-square test. The * mark indicates a significant difference in clinical features between the two groups (P<0.05). (A) T category. (B) N category. (C) M category. (D) TNM staging. (E) Pathological grading.
We used the R software package Limma (v3.40.2) to analyze differentially expressed genes in C1 and C2. Those with FC>2 and P<0.05 were interpreted as differentially expressed genes (DEGs). Compared to C2, C1 had 622 downregulated and 262 upregulated DEGs. Among 38 NRGs, C1 possessed 27 downregulated (e.g., CHIN3A), 5 upregulated (e.g., CHRNA4), and 6 unregulated (e.g., CHRM3) DEGs compared to C2 (Figures 3A, B, S1). Meanwhile, KEGG and GO analyses were carried out to further assess signaling pathways in C1 and C2 (Figures 3C, D). KEGG analysis revealed that compared to C2, C1 showed the activation of signaling pathways for liver metabolism, including bile secretion, cholesterol metabolism, glycolysis/gluconeogenesis, and chemical carcinogenesis (DNA adducts and receptor activation), while a suppression of cancer-associated signaling pathways such as bladder cancer, the cell cycle, central carbon metabolism in cancer, and PI3K-Akt signaling pathway (Figure 3C). GO analysis suggested that compared to C2, C1 had activated the liver metabolic process (e.g., alcohol metabolic process, fatty acid metabolic process) and a suppression of growth factor beta stimulus, negative regulation of cell adhesion, extracellular matrix organization, which were regarded as critical processes in promoting cancer growth and metastasis (Figure 3D).
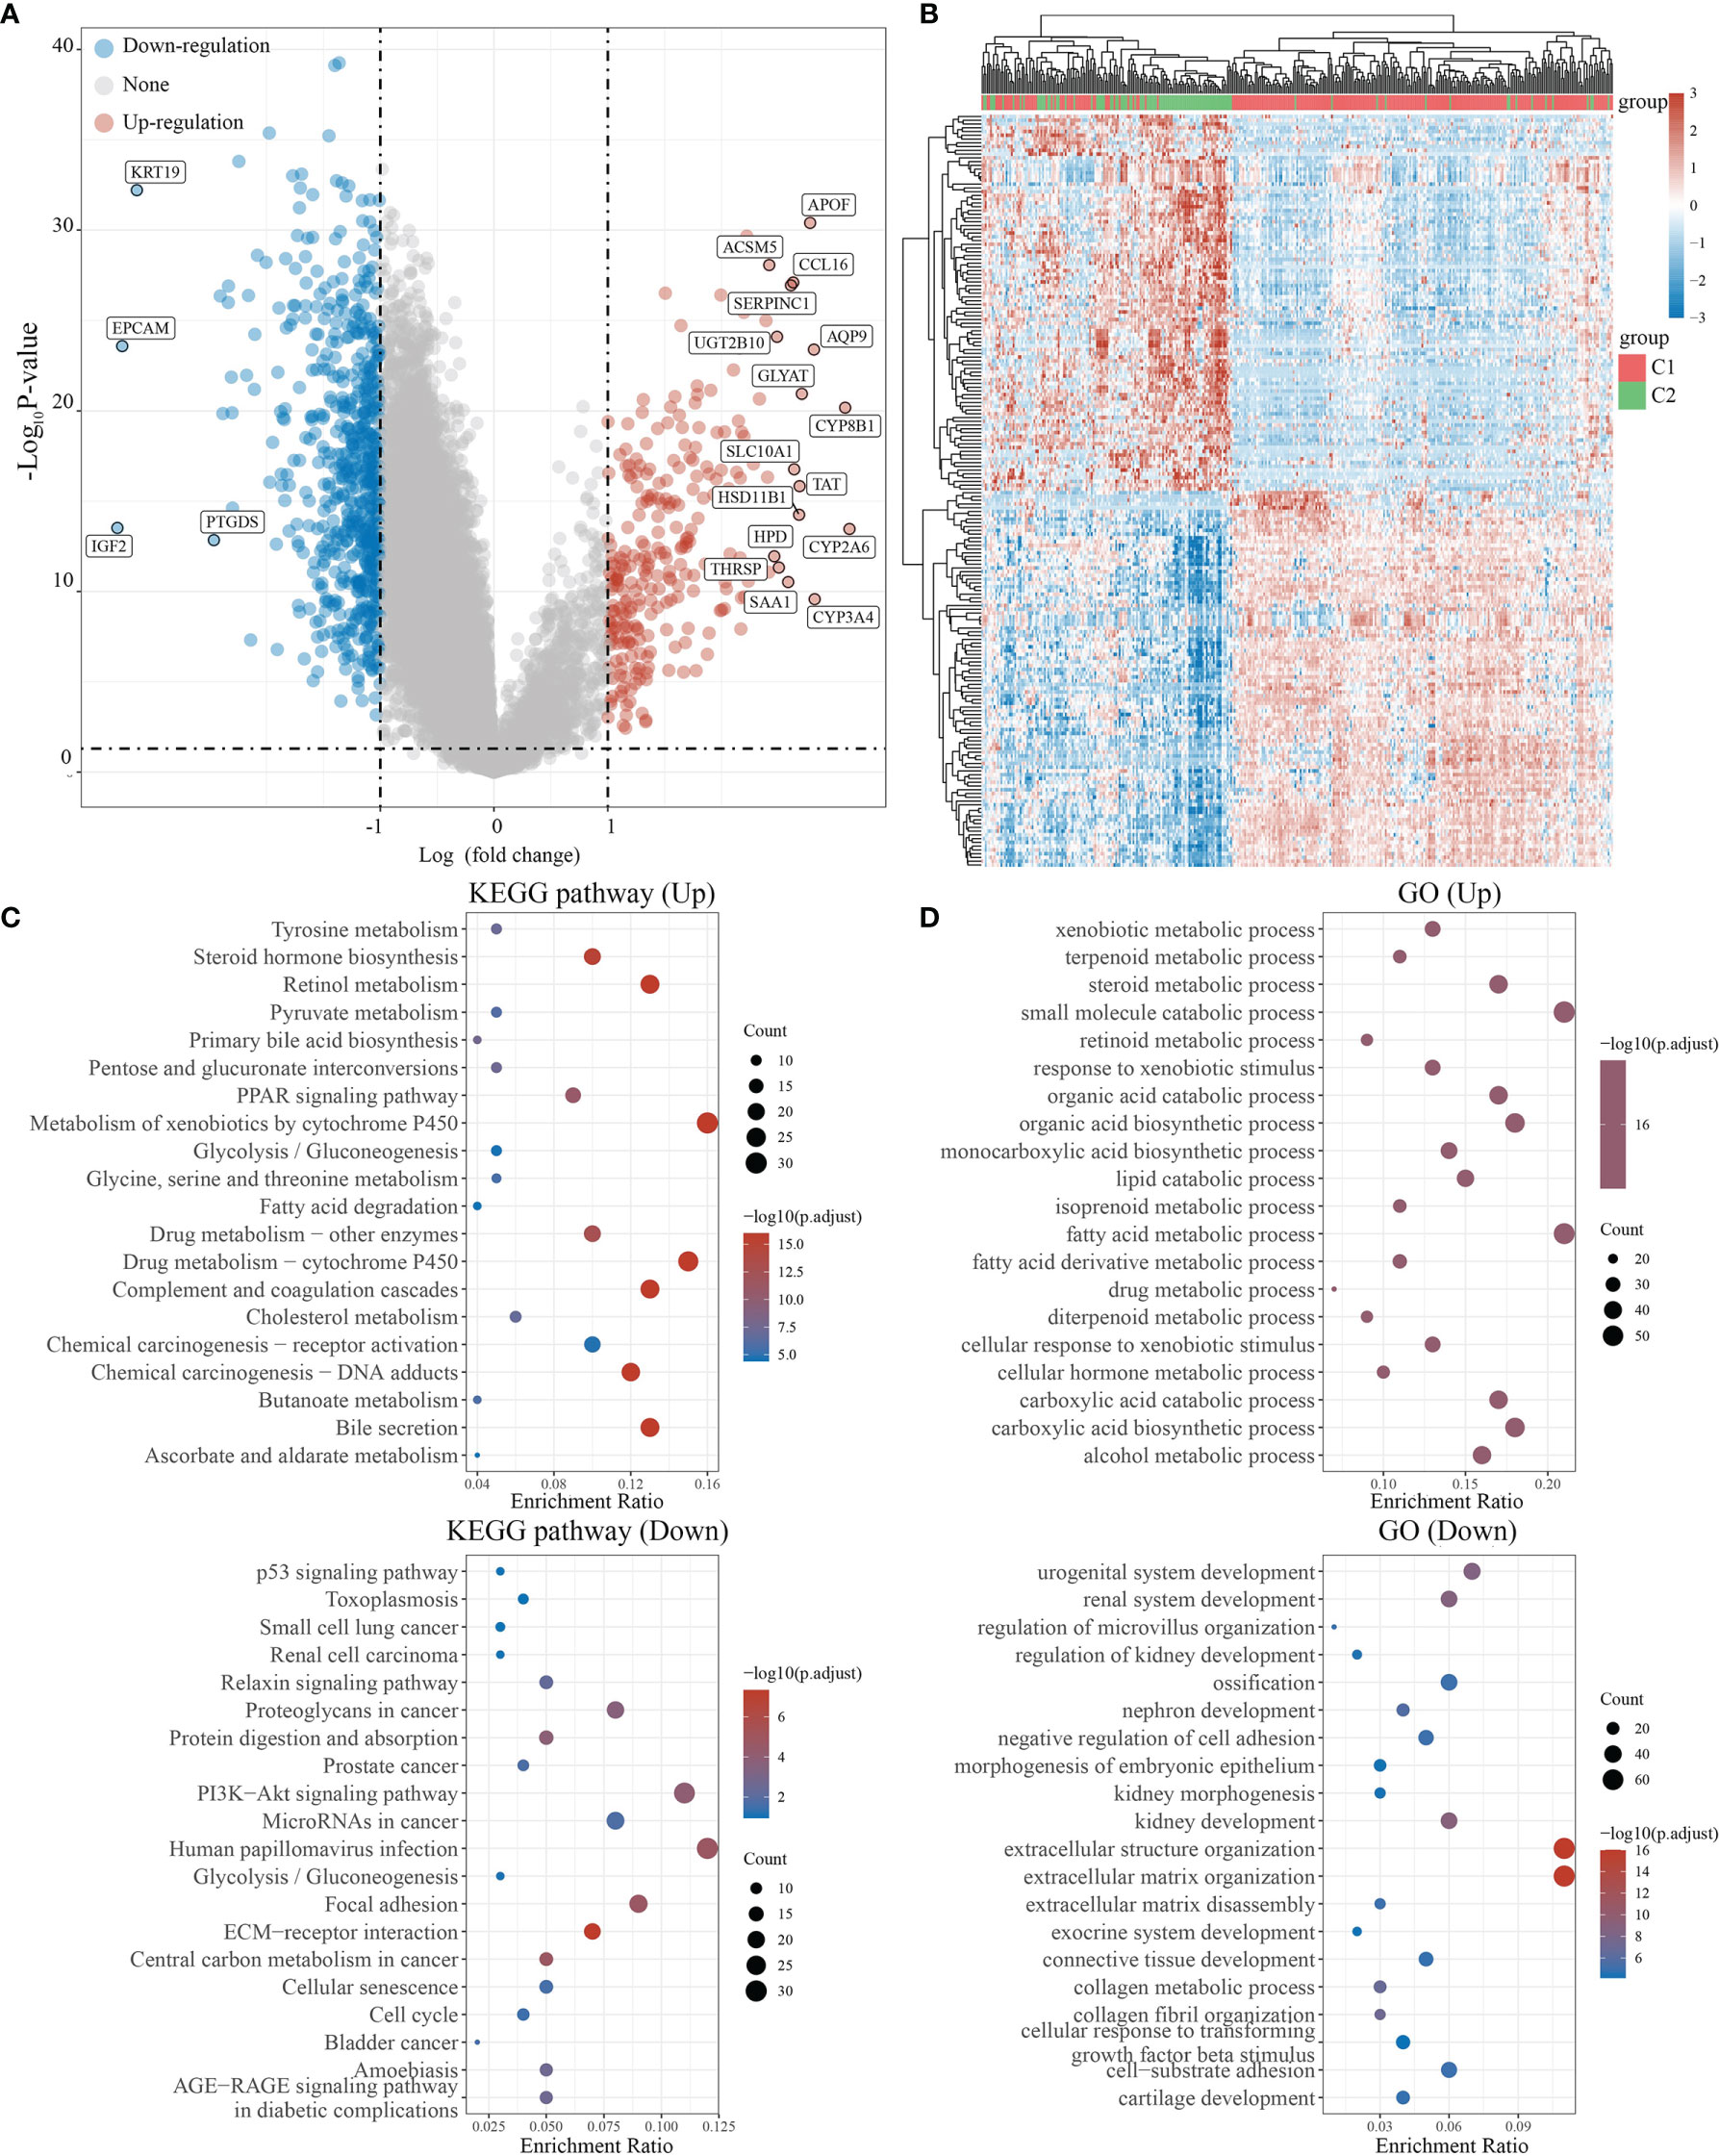
Figure 3 Differential expression and enrichment analysis of C1 and C2. (A) The volcano plot shows the differential gene expression of C1 and C2 drawn with fold-change values and adjusted P. (B) Heat map showing differential gene expression (only 50 genes were displayed because of the large quantity of the genes). (C, D) KEGG and GO analysis showed the upregulated/downregulated pathways of the C1 compared with C2. P<0.05 or FDR<0.05 is considered to be meaningful.
For the evaluation of the immune infiltration of C1 and C2, we used immunedeconv, an R software package based on the integration of CIBERSORT, EPIC, MCP-counter, quanTIseq, TIMER, and xCell (16). During the analysis, we used CIBERSORT and EPIC, which were the most used algorithms. CIBERSORT analysis revealed significant differences in the naïve B cell (P<0.01), memory B cell (P<0.001), regulatory T cell (Tregs)(P<0.001), monocyte (P<0.05), and macrophage M0 (P<0.001), suggesting that C1 exhibited stronger immunosuppression when compared with C2 (Figure 4A). EPIC further confirmed that C1 and C2 had significant difference in macrophage infiltration (P<0.001); however, there were insufficient data on macrophage subtypes (Figure 4B). We also applied R software packages ggplot2 and pheatmap to analyze ICGs in the two subtypes and showed that CTLA4, HAVCR2, LAG3, PDCD1, SIGLEC15 (P<0.001), and TIGIT (P<0.01) were downregulated in C1 when compared to C2 (Figure 4C). The TIDE algorithm, used to predict cancer immune response, was also used herein (16). The TIDE score was higher in C2 than C1, with significant difference (P<0.001), indicating that C1 might achieve more clinical benefit upon ICBs (Figure 4D). The OCLR algorithm showed that the stemness of C1 and C2 had no statistical difference (P>0.05) (16) (Figure 4E).
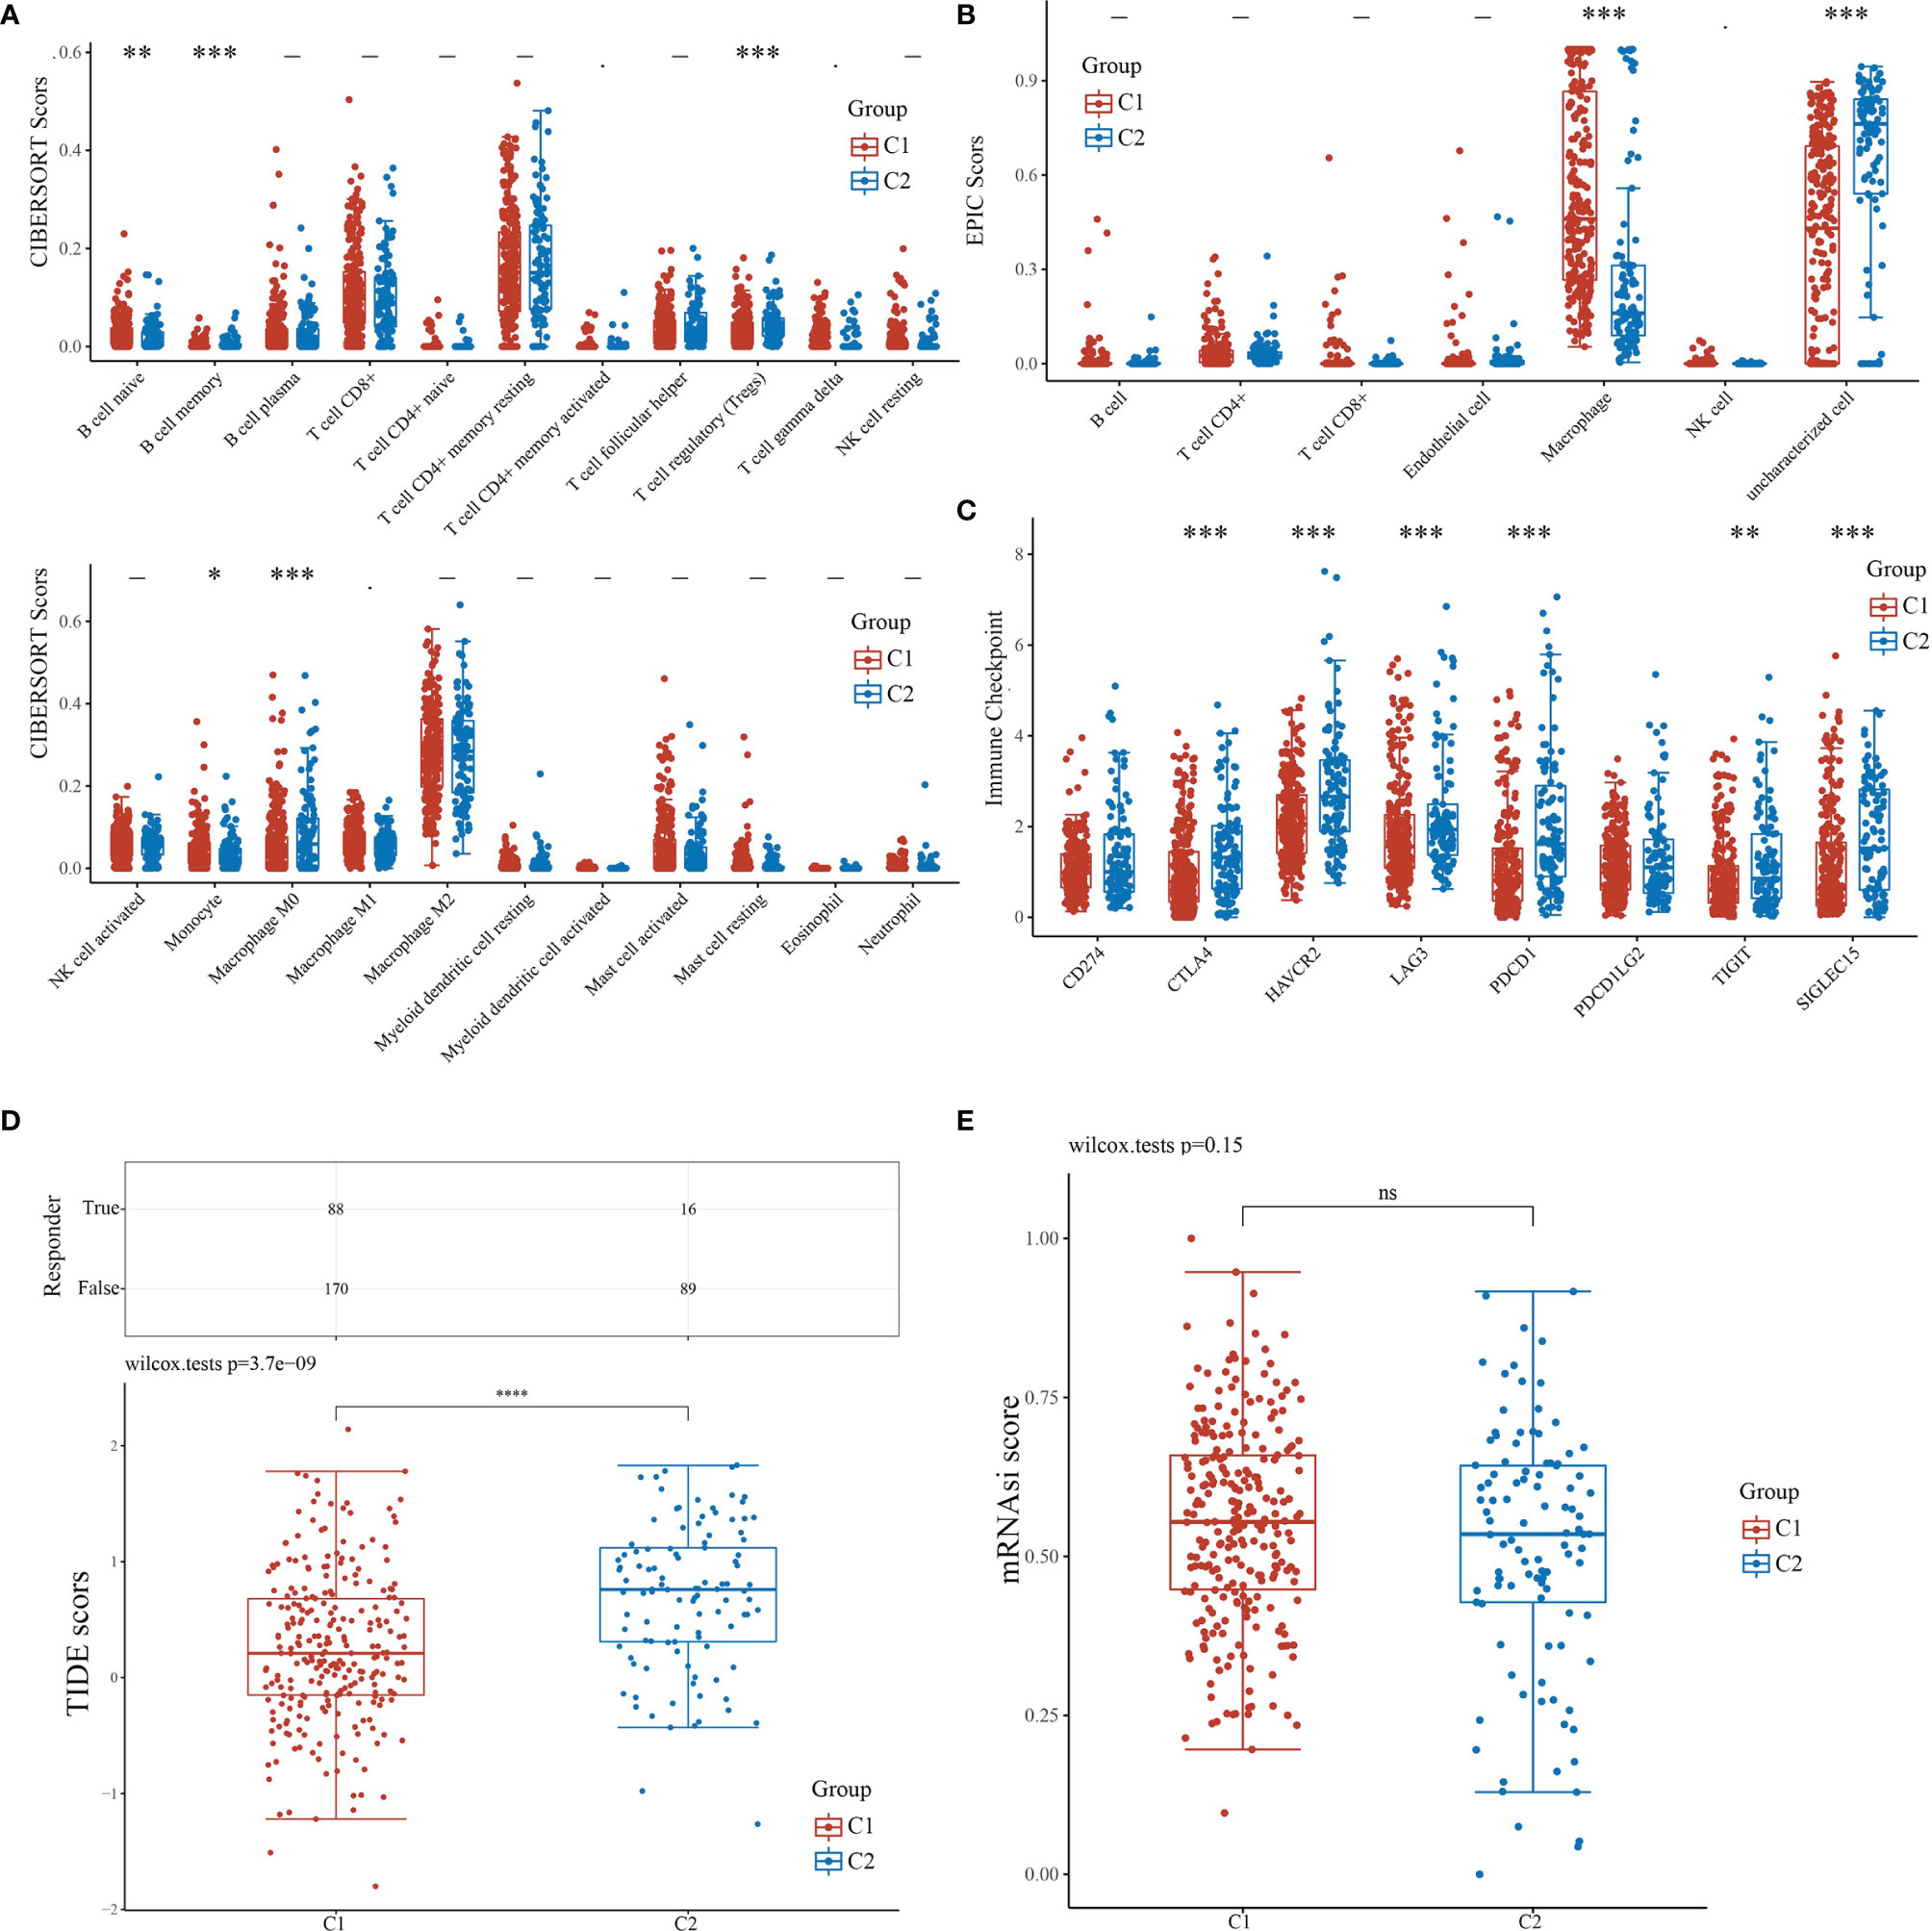
Figure 4 Comparisons of immune status and stemness between C1 and C2. (A, B) Comparison of C1 and C2 in immune infiltration obtained using CIBERSORT and EPIC algorithm. The horizontal axis represents different immune cells; the vertical axis represents the immune scores (*P<0.05, **P<0.01, ***P<0.001). (C) Comparison of immune-checkpoint gene expression in C1 and C2. The horizontal axis shows different immune checkpoint genes; the vertical axis shows the expression level (*P<0.05, **P<0.01, ***P<0.001). (D) Statistical table showing immune response and the distribution of immune response scores of the different groups with the predicted outcome. (E) Comparison of C1 and C2 in stemness demonstrated with mRNAsi score using the OCLR algorithm.
We attempted to elucidate the relationship between NRGs and LIHC prognosis using the LASSO regression algorithm, an R software package conducive to dimension reduction analysis and prognostic gene model construction (14). The results showed that the increased expression of neural-related genes was positively associated with the poor prognosis of LIHC (P<0.05) (Figures 5A–D). The expressions of 38 NRGs were potentially prognostic biomarkers for LIHC patients: the area under the curve (AUC) was 0.653 for 1-year, 0.646 for 3-year, and 0.665 for 5-year ROC curves (Figure 5E). Individual prognosis analysis showed that 4 of the 38 NRGs had a correlation with LIHC prognosis (P<0.05) (Figure 5F). The genes CHRNE and GFRA2, and GFRA3 and GRIN2D correlated positively and negatively with LIHC prognosis, respectively (Figure 5F). When the four aforementioned NRGs were included in the prognostic model, the AUC value was 0.672 for 1-year, 0.618 for 3-year, and 0.679 for 5-year ROC curves (Figure S2E). These results demonstrated that the expressions of specific neural-related genes including CHRNE, GFRA2, GFRA3, and GRIN2D might be potential biomarkers for LIHC prognosis.
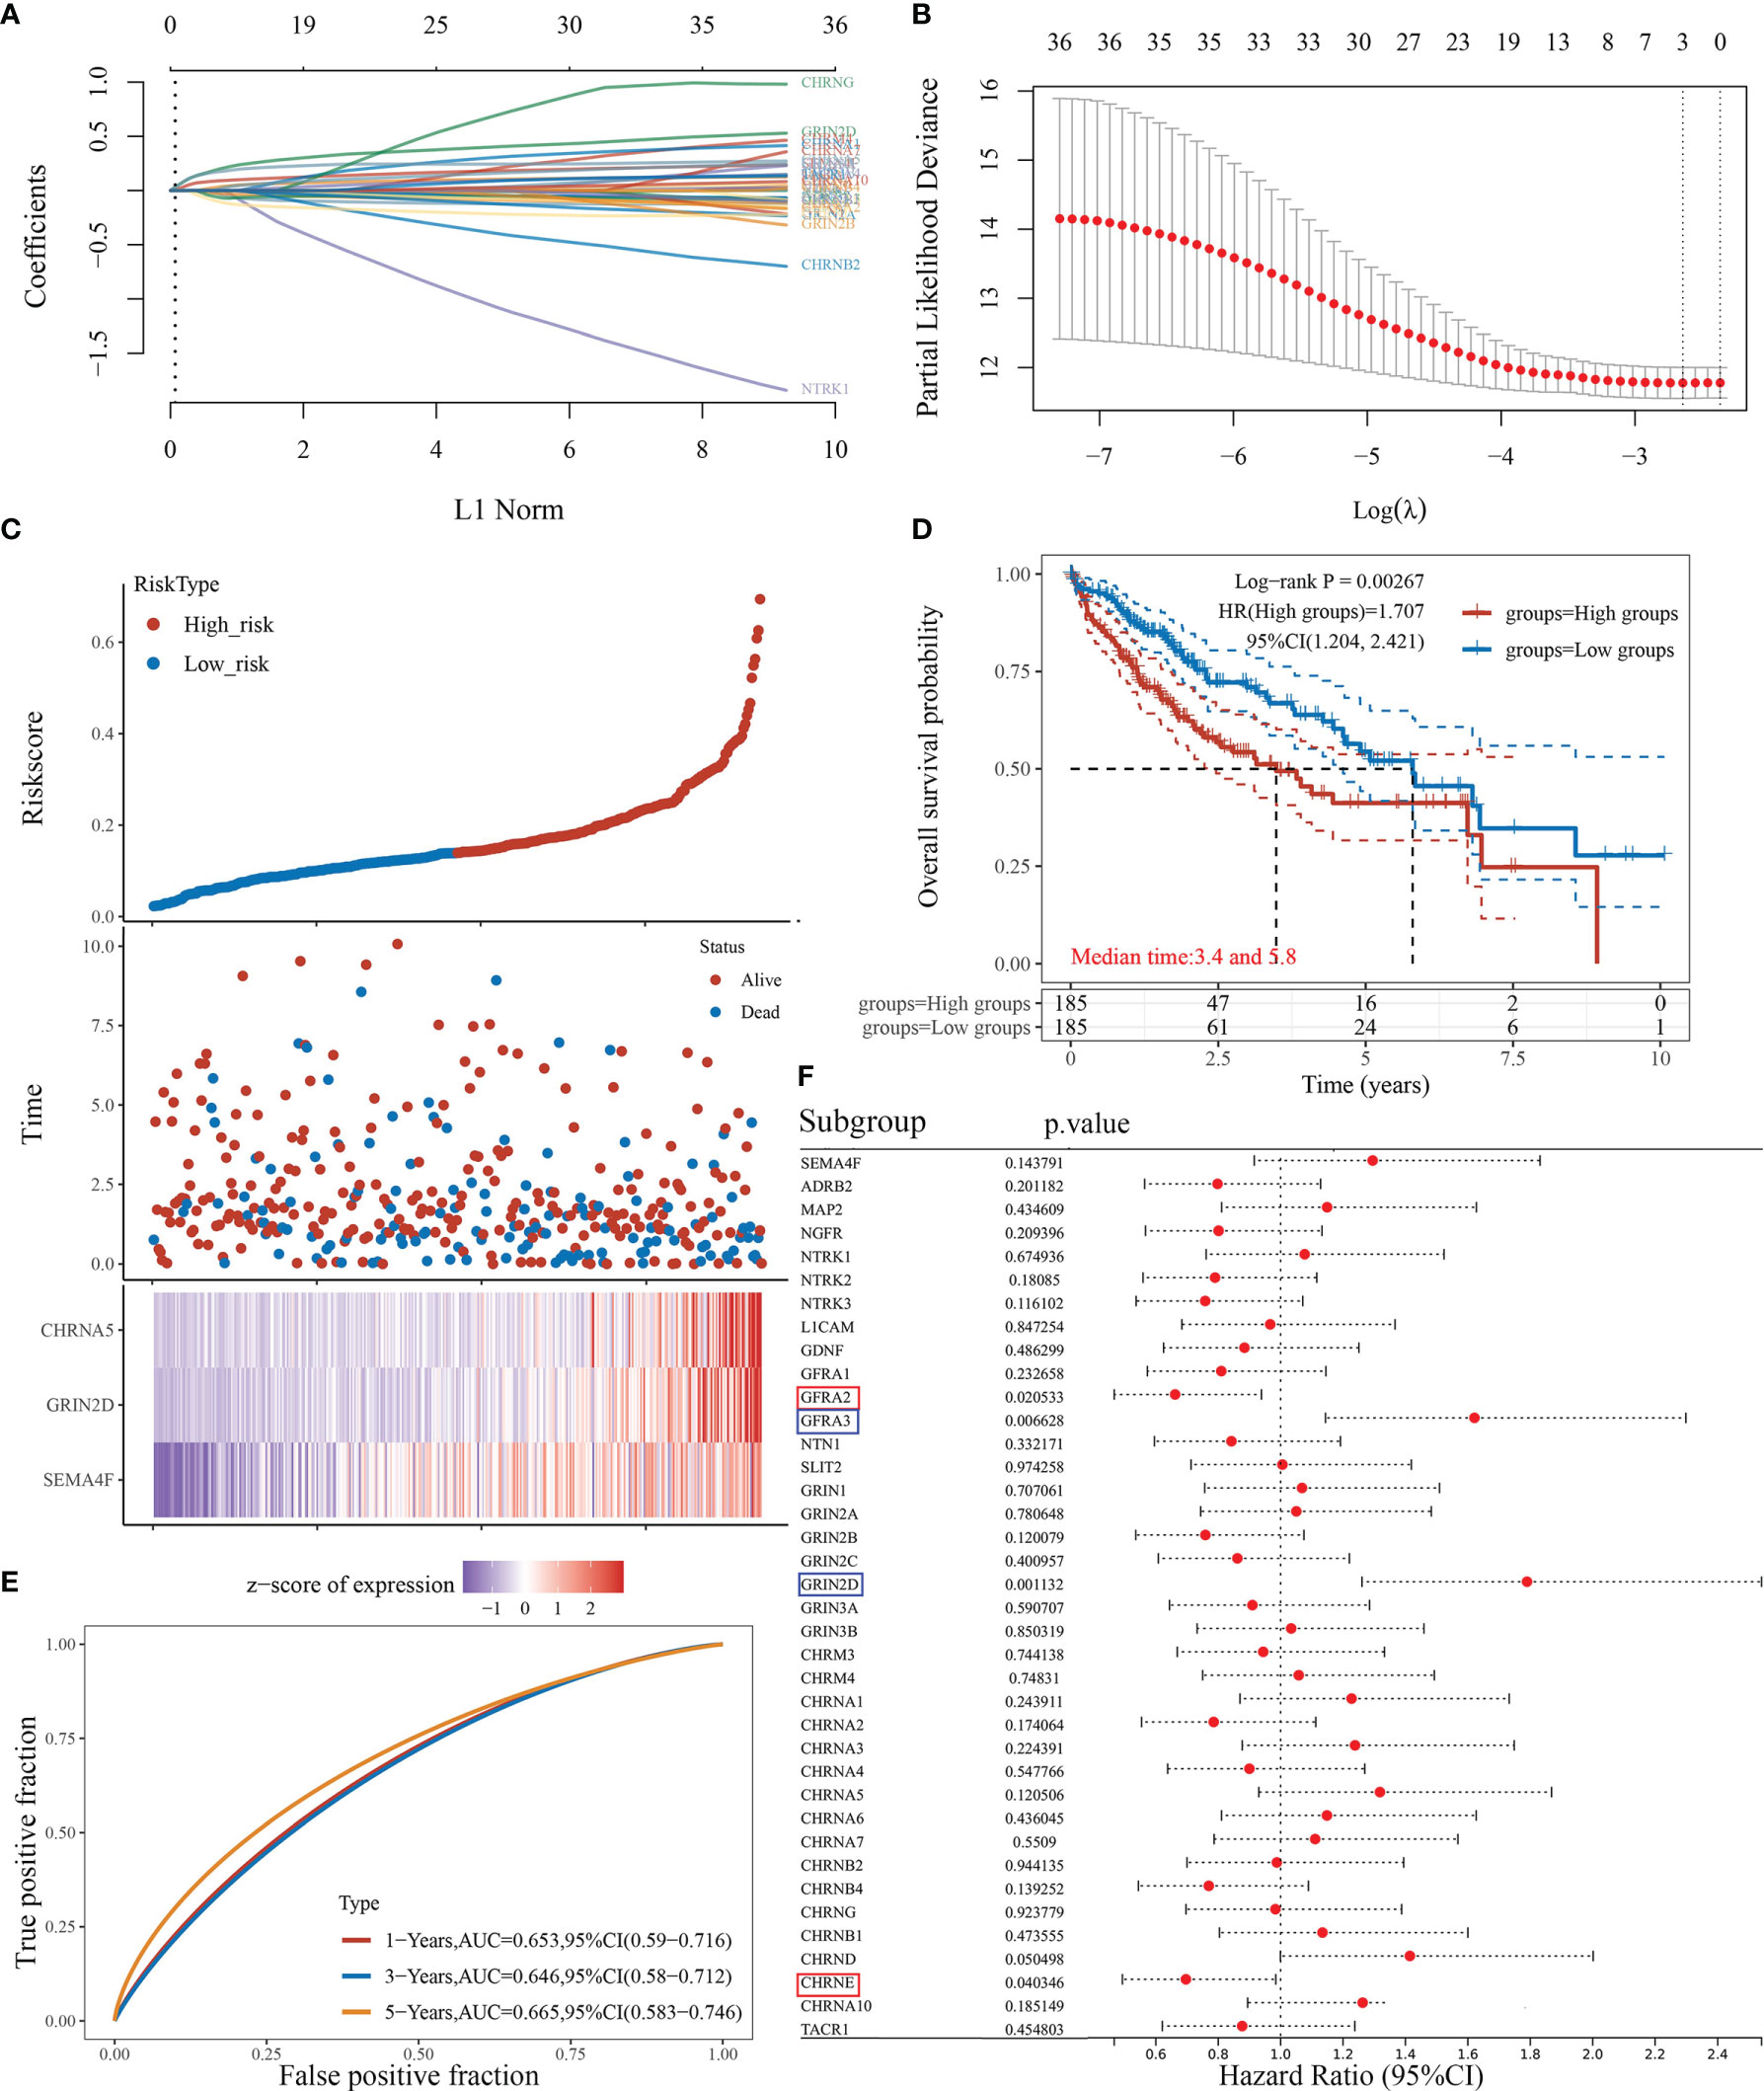
Figure 5 The prognostic model of liver cancer based on 38 neural-related genes. (A) The coefficients of 38 neural-related genes shown by lambda parameter. The vertical axis represents the coefficients of independent variables, and the horizontal axis represents lambda. (B) LASSO COX regression model was used to draw the partial likelihood deviance versus log(λ). (C) The relationship between risk score and living status. The dotted line represents the risk score and divides the patients into high-risk and low-risk groups. A scatter diagram is in the middle, and the heat map of gene expression is down below. (D) KM survival curve of the risk model in TCGA data set. Different groups were tested by log rank and HR (high exp), and represent the risk factors of the high expression group compared with the low expression group. (E) The ROC curve of the risk model and AUC at various timepoints (1 year, 3 years, 5 years). (F) The univariate COX analysis, the p-value of clinical features, and hazard ratio (HR) confidence interval of 38 neural-related gene expressions.
We classified the expression of CHRNE, GFRA2, GFRA3, and GRIN2D into high and low expression groups based on the RNA-sequencing (RNA-seq) and clinical data collected from the TCGA database. A cutoff-high (top 25%) for high expression, while cutoff-low (bottom 25%) for low expression for CHRNE, GFRA2 and GRIN2D was defined. Moreover, a cutoff high (50%) and cutoff low (50%) was used as the expression threshold for GFRA3 due to its relatively low expression. The results showed that high expression of CHRNE was positively correlated with the T category and TNM staging (Figure S3A and Table 2); high expression of GFRA2 was positively correlated with the T category (Figure S3B and Table 3); high expression of GFRA3 was negatively correlated with the T category and pathological grading (Figure S3C and Table 4); high expression of GRIN2D was negatively correlated with the T category, TNM staging, and pathological grading (Figure S3D and Table 5).
The LIHC data was further classified according to the expression levels of the NRGs: CHRNE, GFRA2, GFRA3 and GRIN2D. Furthermore, GO and KEGG analyses were performed for each group. The criterion for low and high expression remains the same as mentioned above.
In LIHC with high CHRNE expression, 150 genes were unregulated and 16 genes were downregulated (FC>2, P<0.05) (Figures 6A, B), while a low expression of CHRNE had an upregulation of genes associated with physiological functions of the liver (e.g., bile secretion, cholesterol metabolism, drug metabolism) and activation processes, such as the regulation of coagulation; downregulation of tumor-promoting pathways, including the PI3K-Akt signaling pathway; and suppression of processes like transition metal ion homeostasis (Figures 6C, D).
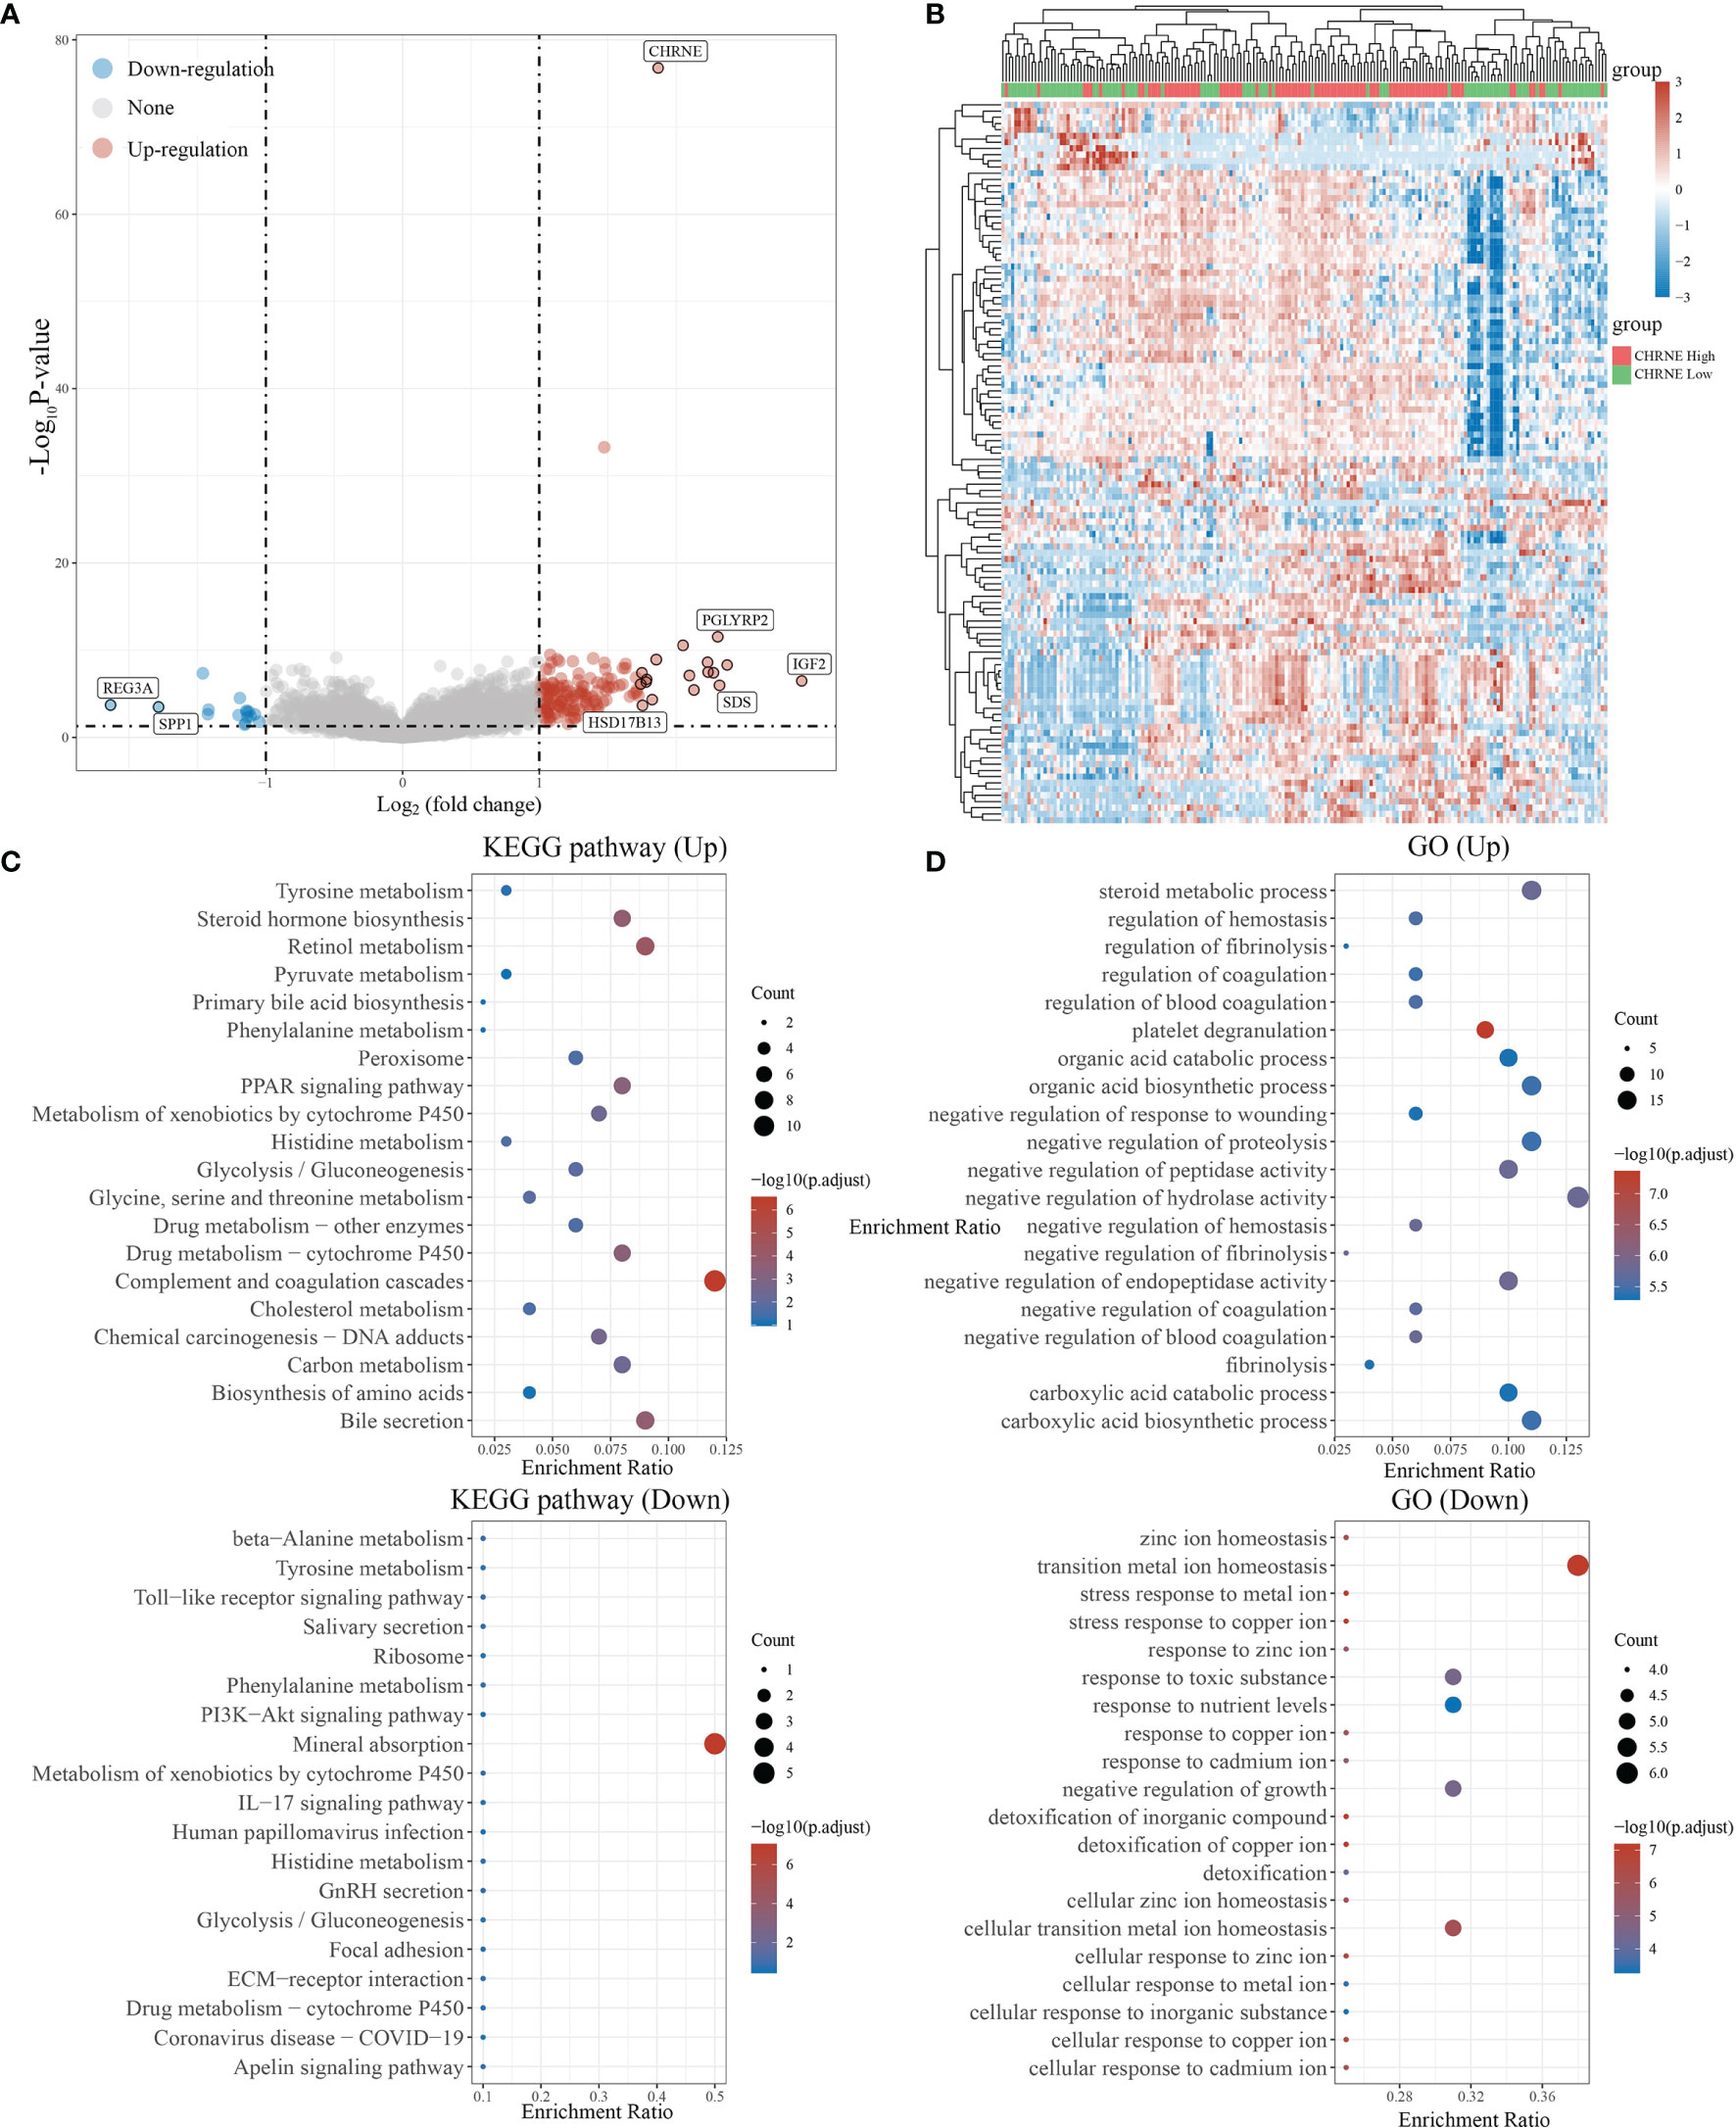
Figure 6 Differential expression and enrichment analysis of high and low CHRNE expression groups. (A) The volcano plot shows the differential gene expression of CHRNE high expression group and CHRNE low expression group was drawn with fold-change values and adjusted P. (B) Differential gene expression showed by heatmap (only 50 genes were displayed because of the large quantity of the genes); (C, D) KEGG and GO analysis showed the upregulated/downregulated pathways of the CHRNE high expression group compared with the low expression group. When P <0.05 or FDR <0.05 is considered to be enriched to a meaningful pathway.
In LIHC with a high GFRA2 expression, 195 genes were upregulated and 19 genes were downregulated (FC>2, P<0.05) (Figures S4A, B), while a low expression of GFRA2 in LIHC-activated cytokine and cytokine receptors, Th1 and Th2 cell differentiation, and Th17 cell differentiation signaling pathways, which are closely related to immune regulation, were observed. Pro-tumor pathways, such as the HIF-1 signaling pathway and p53 signaling pathway, were suppressed in the group with high GFRA2 expression. GO analysis exhibited similar results: activated immune regulation-associated processes like T-cell activation, leukocyte proliferation, regulation of T-cell activation, and inhibited cell maturation (Figures S4C, D).
In LIHC with a high GFRA3 expression, 144 genes were upregulated and 56 genes were downregulated (FC>2, P<0.05) (Figures S5A, B) For the LIHC group with a high GFRA3 expression, widely recognized critical oncogenes in liver cancer, such as AFP, IGF2, and liver cancer-associated pathways (e.g., cell cycle, forkhead box O, signaling pathway, hepatitis B, MAPK signaling pathway, VEGF signaling pathway, and p53 signaling pathway) were unregulated, while the cell proliferation-related processes (e.g., chromosome segregation, mitotic nuclear division, spindle organization) were activated. However, pathways like bile secretion and processes such as alcohol metabolism were inhibited in the high GFRA3 expression group, when compared with the low GFRA3 expression group (Figures S5C, D).
In LIHC with high GRIN2D expression, 1,971 genes were upregulated and 302 genes were downregulated (FC>2, P<0.05) (Figures S6A, B). On the other hand, the high GRIN2D expression group had an upregulation of pathways like proteoglycans in cancer, the PI3K-Akt signaling pathway, cell adhesion molecules, and activation of processes like the positive regulation of cell activation, regulation of leukocyte proliferation, downregulation of bile secretion, cholesterol metabolism, and suppression of processes like the alcohol metabolic process and lipid homeostasis (Figures S6C, D).
These findings suggest that GHRNE and GFRA2 expression in LIHC might be beneficial in maintaining the liver physiological function and suppressing tumor growth and metastasis; the effect of GFRA3 and GRIN2D was antagonistic to GHRNE and GFRA2.
The R software package, immunedeconv, was used to obtain the immune infiltration data of high/low-expression CHRNE, GFRA2, GFRA3, and GRIN2D groups of LIHC. CIBERSORT and EPIC algorithms were used herein. The CIBERSORT algorithm showed that in C1, unlike C2, high CHRNE expression was positively correlated with memory B cell (P<0.05) and mast cell (activated/resting) infiltration (P<0.05), while being negatively correlated with macrophage M0 (P<0.05) (Figure 7A). The EPIC algorithm showed that in C1, compared with C2, high CHRNE expression was positively correlated with B cell (P<0.05) (Figure 7B). In terms of high GFRA2 expression, the CIBERSORT algorithm showed that in C1, compared with C2, it was positively correlated with the CD4+ memory resting T cell (P<0.001), while it was negatively correlated with monocytes (P<0.05), macrophage M0 (P<0.001), eosinophils (P<0.05), and neutrophils (P<0.01) (Figure S7A). The EPIC algorithm showed that high GFRA2 expression was positively correlated with the CD4+ T cell (P<0.001) (Figure S7B). The CIBERSORT algorithm showed that in C1, compared with C2, high GFRA3 expression was positively correlated with the memory resting B cell (P<0.01) and T cell follicular helper (P<0.01), while it was negatively correlated with monocytes (P<0.001) (Figure S8A). The EPIC algorithm showed that low GFRA3 expression was positively correlated with macrophages (P<0.001) (Figure S8B). The CIBERSORT algorithm showed that in C1, compared with C2, high GRIN2D expression was positively correlated with Tregs (P<0.05) and macrophage M0 (P<0.001), while it was negatively correlated with naïve B cells (P<0.01), resting natural killer (NK) cells (P<0.001), monocytes (P<0.001), and activated mast cells (P<0.01) (Figure S9A). The EPIC algorithm also showed that high GRIN2D expression was positively correlated with the CD4+ T cell (P<0.001), but negatively correlated with macrophage (P<0.001) (Figure S9B).
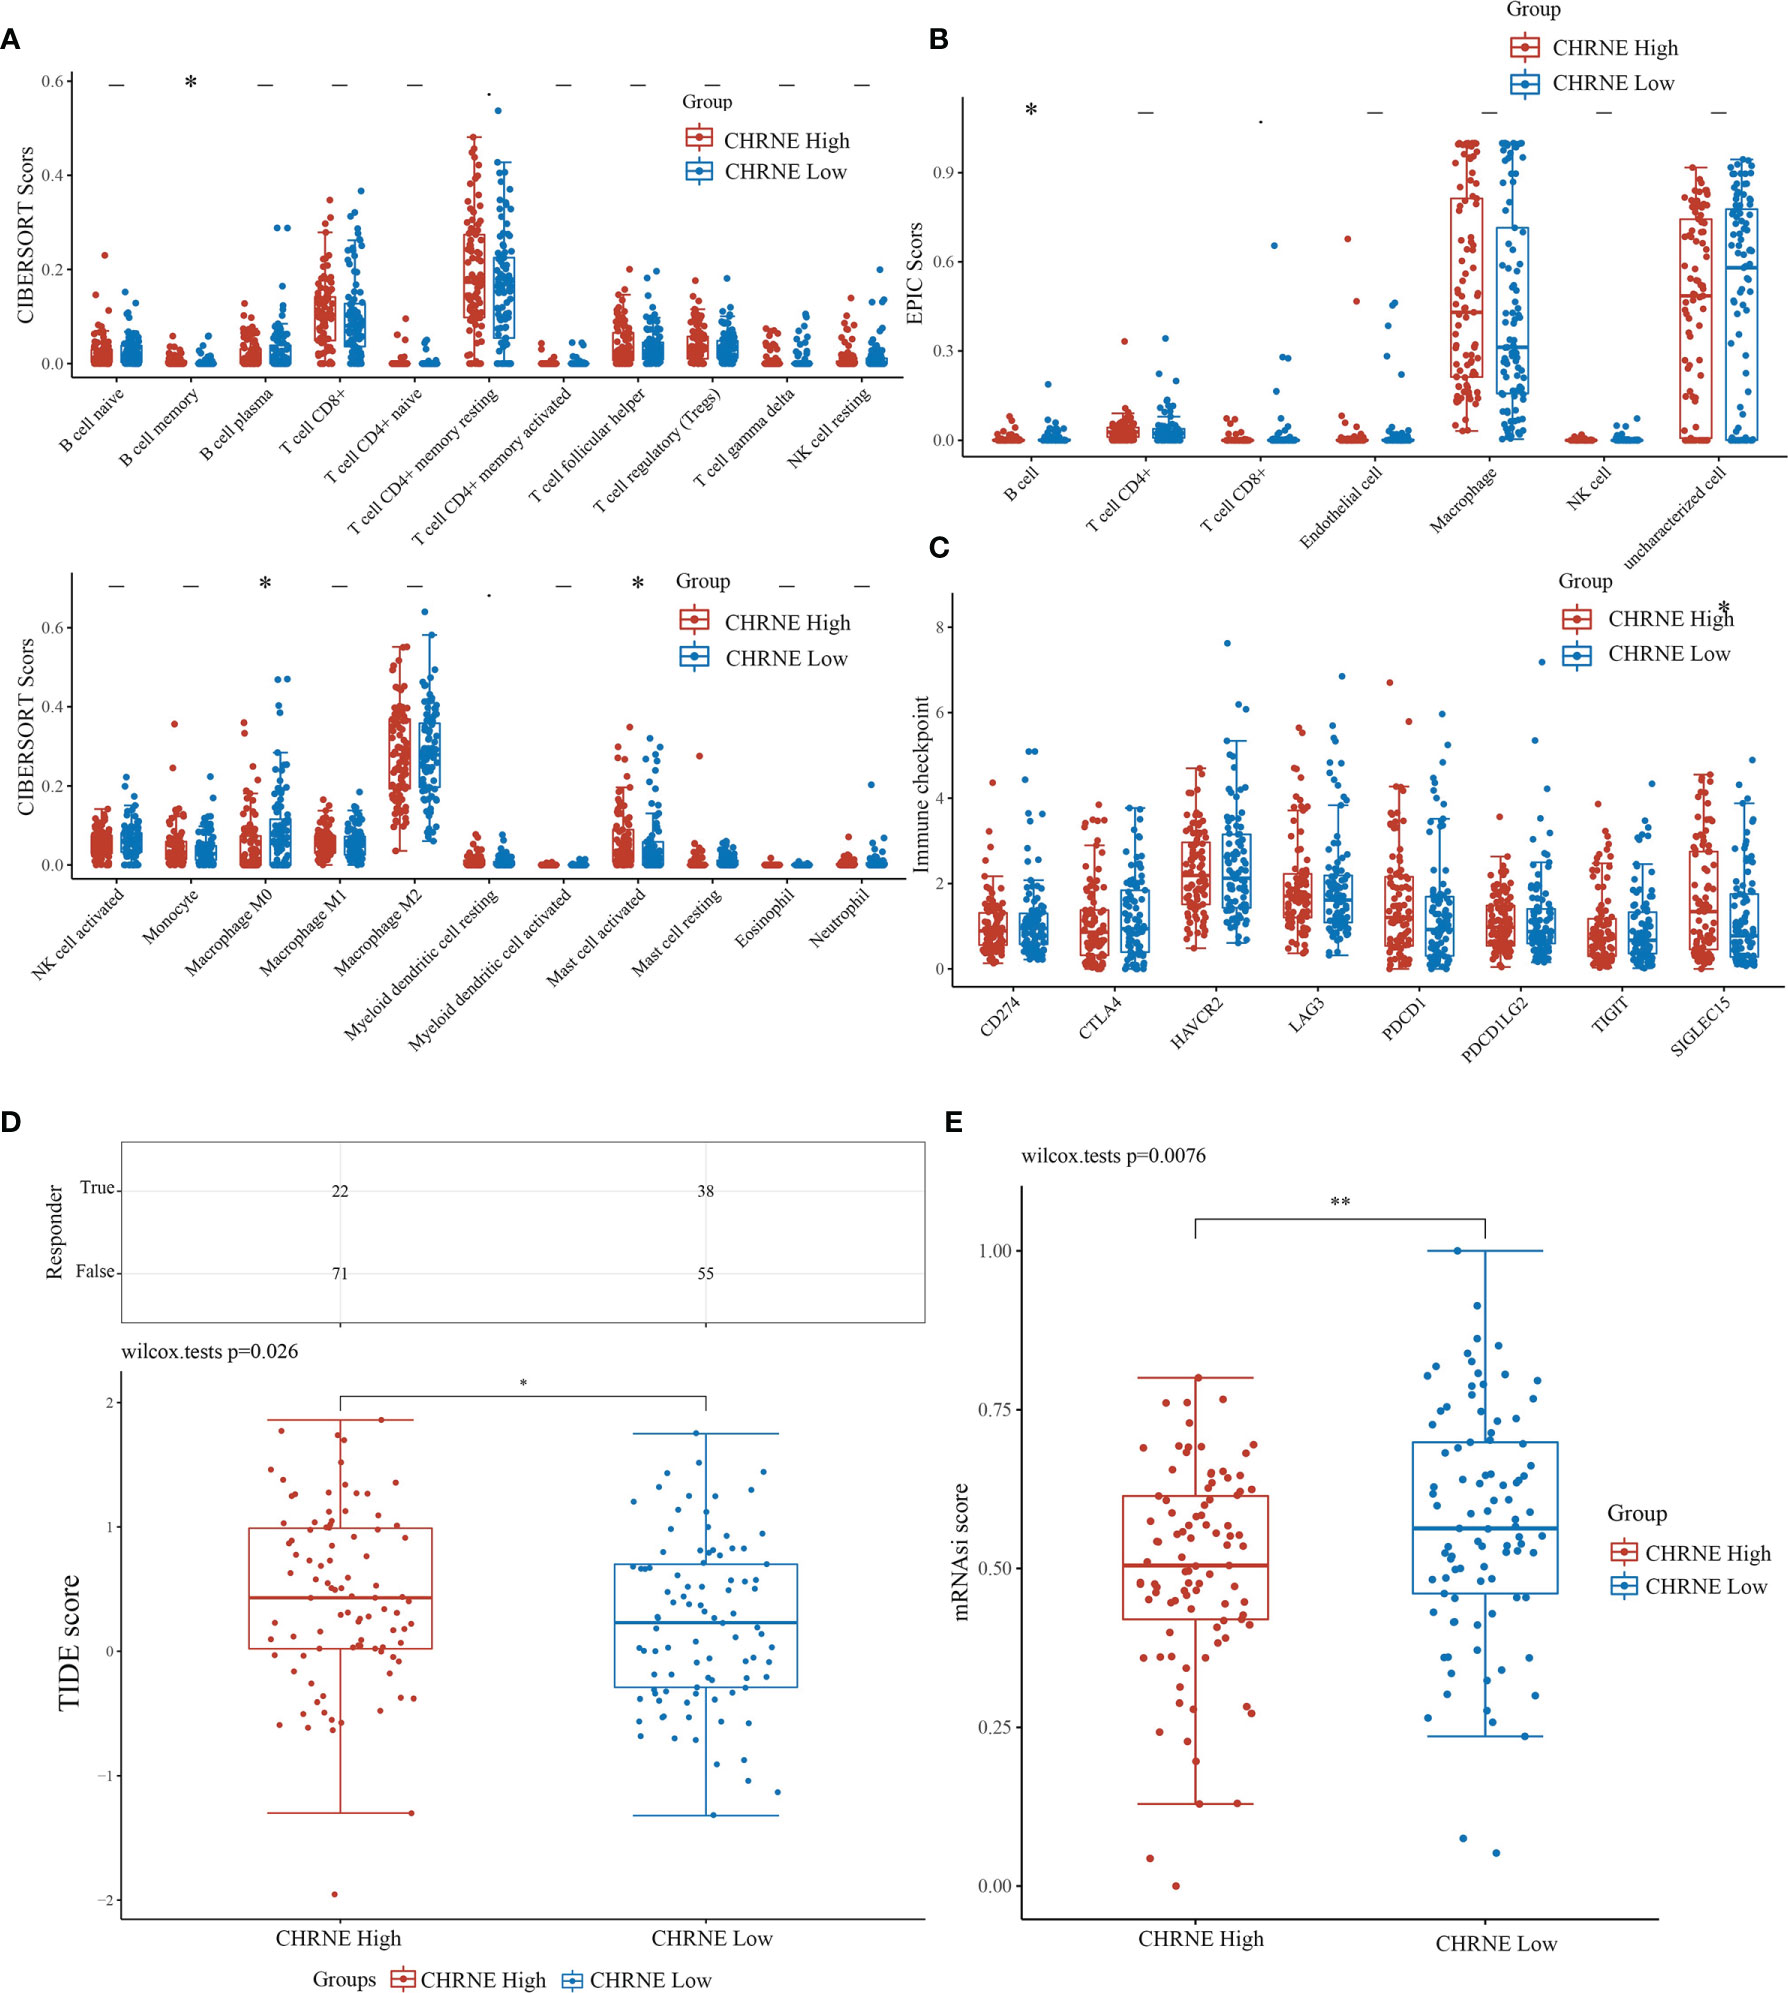
Figure 7 Comparisons of immune status and stemness between CHRNE high expression group and low expression group. (A, B) Comparison of CHRNE high expression group and CHRNE low expression group in immune infiltration obtained with CIBERSORT and EPIC algorithm; The horizontal axis represents different immune cells, the vertical axis represents the immune scores (*P < 0.05, **P < 0.01). (C) Comparison immune checkpoint genes expression in CHRNE high expression group and CHRNE low expression group; The horizontal axis represents different immune checkpoint genes, the vertical axis represents the expression level (*P < 0.05). (D) Statistical table of immune response and the distribution of immune response scores of the different groups in predict results. (*P < 0.05) (E) Comparison of CHRNE high expression group and CHRNE low expression group in stemness was exhibited by mRNAsi score with OCLR algorithm. (**P < 0.01).
In addition, we analyzed the correlations between ICGs and the expression of CHRNE, GFRA2, GFRA3, and GRIN2D. When compared with C2, CHRNE expression in C1 was positively correlated with SIGLEC15 (P<0.05) (Figure 7C); GFRA2 and GRIN2D expression was positively correlated with 7 of 8 IGCs including CD274, CTLA4, HAVCR2, LAG3, PDCD1, PDCD1LC2, and TIGIT with significant difference (P<0.001) (Figures S7C, S9C); GFRA3 was positively correlated with CTLA4 (P<0.001), HAVCR2 (P<0.01), LAG3 (P<0.001), PDCD1 (P<0.001), and TIGIT (P<0.01) (Figure S8C). The TIDE algorithm showed that high expression of CHRNE, GFRA3, and GRIN2D correlated with a poor immune response (Figures 7D, S7D–S9D). According to the Spearman correlation analysis of the OCLR score, the CHRNE (Figure 7E), GFRA2 (Figure S7E), and GRIN2D (Figure S9E) high-expression groups show a lower stemness score than the low-expression groups, whereas GFRA3 (Figure S8E) has an opposite result.
We obtained mutational, transcriptomic, and clinical data of LIHC patients from the TCGA database and performed visualization analysis with R software package maftools (17) and found no significant mutations for CHRNE, GFRA2, GFRA3, and GRIN2D in LIHC (Figure 8).
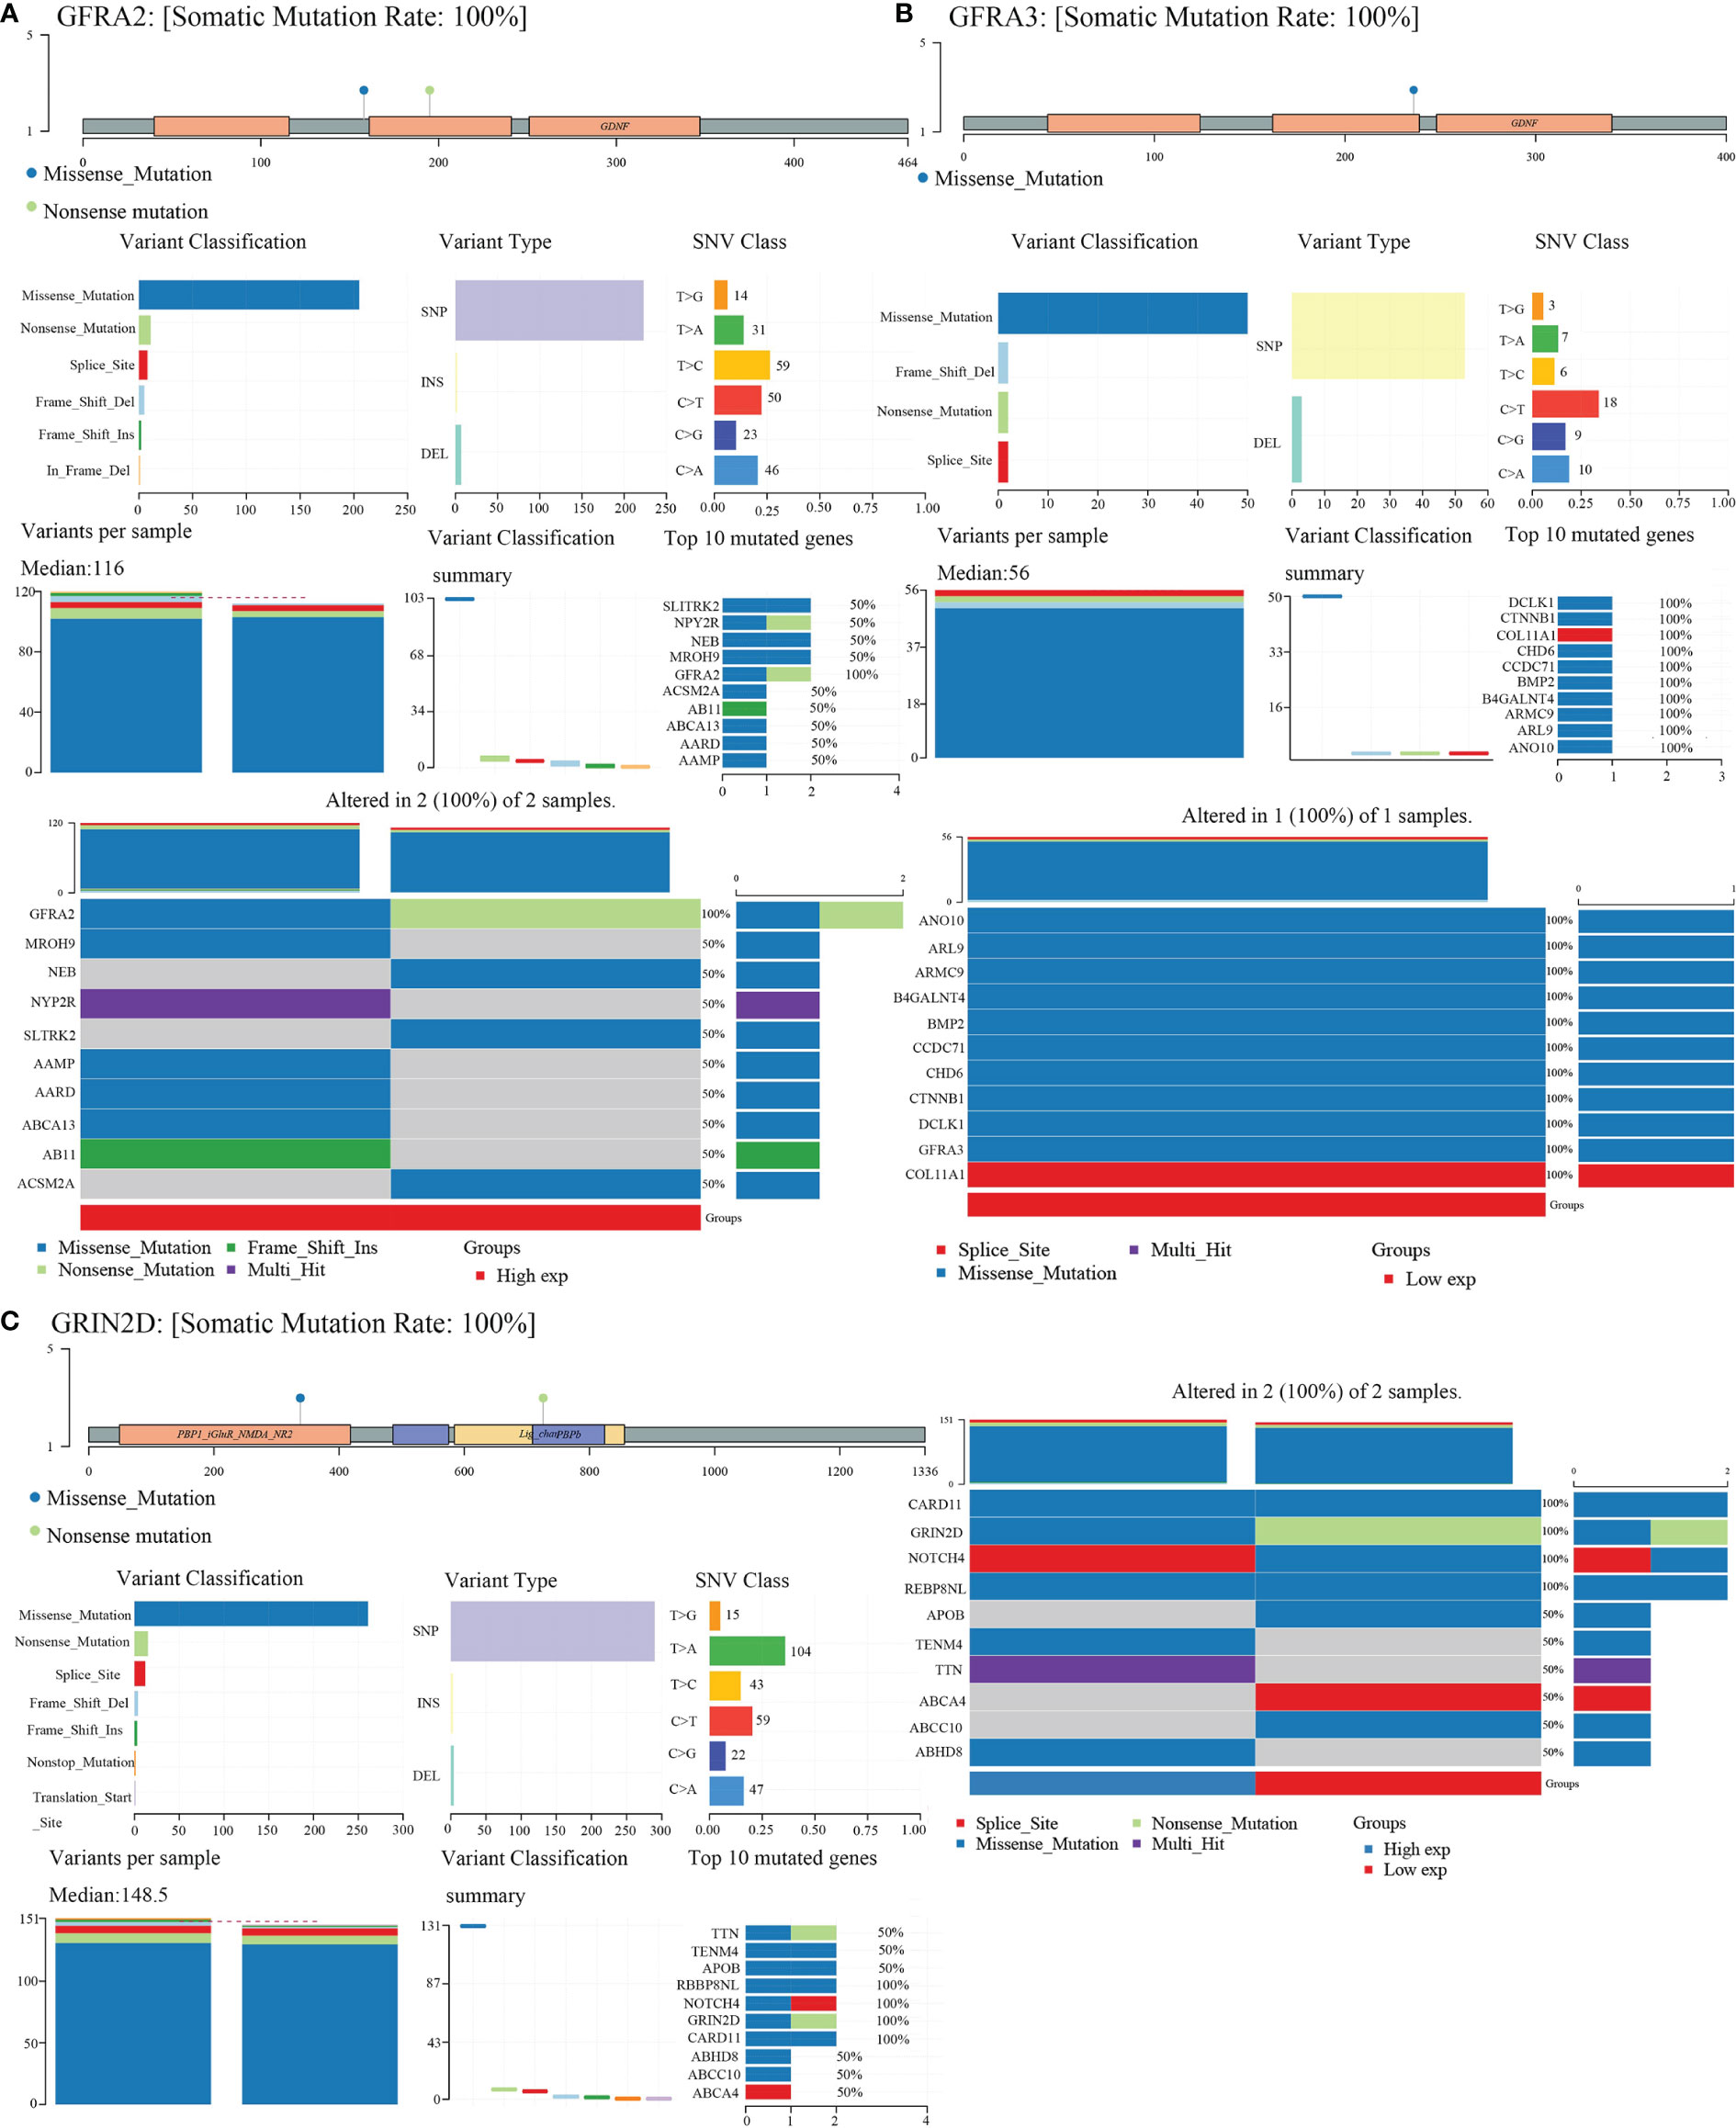
Figure 8 Gene mutation landscape of GFRA2, GFRA3, and GRIN2D. (A) Gene mutation landscape of GFRA2. A lollipop plot, an oncoplot, and cohort summary plot are shown to display the distribution of gene mutation. (B) Gene mutation landscape of GFRA3. (C) Gene mutation landscape of GRIN2D.
Neural infiltration has been viewed as a crucial aspect of the tumor microenvironment, which had also been termed as the innervated niche (7, 18). Together with the hypoxic niche, immune microenvironment, metabolic microenvironment, acidic niche, and mechanical microenvironment, neural infiltration regulates a series of biological processes in cancer cells and non-malignant cells in the microenvironment, which then influence cancer growth and metastasis. However, the complex neuroanatomy and intricate nature of the nervous system largely hinder further studies on nerve–cancer crosstalk.
Precision medicine is the future of cancer diagnosis and treatment, and the establishment of cancer subtypes based on gene expression has been proven to guide clinical practice. A typical example is the classification of breast cancer based on Her2 and estrogen receptor expression. In this study, we classified LIHC into two subtypes, C1 and C2, based on NRGs. C1 and C2 had statistical differences in prognosis as well as a significant difference in unregulated/downregulated signaling pathways and biological processes. Immune infiltration and ICG analysis showed a notable discrepancy between the immune microenvironments of C1 and C2. Furthermore, the TIDE algorithm confirmed the immune response differences between the two subtypes. These findings confirm the close connection between neural infiltration and liver cancer and indicate a reclassification of liver cancer based on NRGs as a promising avenue for translational into a clinical setting.
We also screened out four NRGs (CHRNE, GFRA2, GFRA3, and GRIN2D) in LIHC using a prognostic model. CHRNE is the acetylcholine receptor subunit epsilon (ϵ-AChR) engaged in maintaining the normal function of neuromuscular junction (19–21). Mutations in CHRNE were reported to be associated with the myasthenic syndrome; however, it was never associated with cancer. Our analysis showed that CHRNE was related to cancer-associated signaling pathways, including PI3K-Akt signaling pathways and liver metabolic pathways. Clinical data showed that CHRNE expression was correlated with the T category and LIHC prognosis. We proposed that CHRNE might build a bridge between nerve cells and cells in the tumor microenvironment and influence cancer progression. GFRA2 and GFRA3 were glial cell line-derived neurotrophic factor (GDNF) receptors (22–24), and previous studies have suggested their participation in cancer. GFRA2 interacts with PTEN, activates the PI3K/AKT pathway, and promotes neuroblastoma cell proliferation (22). On the other hand, GFRA3 promoted the proliferation and invasion of pancreatic ductal adenocarcinoma cells (25), and its expression was negatively correlated with urothelial carcinoma prognosis (26). Additionally, genome-wide DNA methylation profiling showed that GFRA3 promoter methylation was negatively correlated with gastric cancer prognosis (27). However, in our analysis, GFRA2 exhibited an anti-tumor effect, while GFRA3 exerted a pro-tumor effect. GRIN2D encoded N-methyl-D-aspartate receptor (NMDAR) subunit ϵ-4, which interacted with NMDA and was involved in developmental and epileptic encephalopathy (28, 29). It was regarded as the biomarker for colorectal cancer angiogenesis (30). Our study suggested that GRIN2D is clinically significant and holds a biological value in liver cancer. Importantly, GRIN2D may serve as a potential biomarker to assess therapeutic responses to ICBs owing to a strong correlation with IGCs (e.g., CD274, CTLA4, LAG3) and immune cell (e.g., B cell, T cell CD4+, NK cell) infiltration. We concluded that GRIN2D exerted an immunomodulatory role on the tumor microenvironment via NMDA targeting and consequently influence cancer proliferation and metastasis. Therefore, the blockade of GRIN2D may help sensitize patients’ immune response.
To summarize, our study attempted to uncover the role of NRGs in LIHC and highlight that their importance in cancer progression demonstrated that NRGs play an important role liver cancer growth and migration, immune infiltration, immune response, and the upregulation or downregulation of clinically significant pathways. Specific NRGs, CHRNE, GFRA2, GFRA3, and GRIN2D, could serve as potential biomarkers for LIHC prognosis. However, basic experiments and clinical trials are both required to verify the inferences drawn from bioinformatics analyses.
Publicly available datasets were analyzed in this study. This data can be found here: https://www.cancer.gov/about-nci/organization/ccg/research/structural-genomics/tcga.
Y-GZ and X-RZ did the analysis. Y-GZ and M-ZJ wrote the paper. X-RZ did the data sorting and charting. W-LJ conceived the paper. All authors contributed to the article and approved the submitted version.
This study was supported by the First Hospital of Lanzhou University for the introduction of high-level talents to start research funding.
The authors declare that the research was conducted in the absence of any commercial or financial relationships that could be construed as a potential conflict of interest.
All claims expressed in this article are solely those of the authors and do not necessarily represent those of their affiliated organizations, or those of the publisher, the editors and the reviewers. Any product that may be evaluated in this article, or claim that may be made by its manufacturer, is not guaranteed or endorsed by the publisher.
The Supplementary Material for this article can be found online at: https://www.frontiersin.org/articles/10.3389/fonc.2022.877657/full#supplementary-material
Supplementary Figure 1 | Comparisons of 38 neural-related gene expression between C1 and C2.
Supplementary Figure 2 | The construction of a prognostic model based on 4 differentially expressed neural-related genes.
Supplementary Figure 3 | Comparisons of clinical characteristics between high and low CHRNE/GFRA2/GFRA3/GRIN2D groups. Comparisons of T category, N category, M category, TNM staging, and pathological grading between (A) CHRNE-high and -low group; (B) GFRA2-high and -low group; (C) GFRA3-high and -low group; (D) GRIN2D-high and -low group.
Supplementary Figure 4 | Differential expression and enrichment analysis of high and low GFRA2 expression groups.
Supplementary Figure 5 | Differential expression and enrichment analysis of high and low GFRA3 expression groups.
Supplementary Figure 6 | Differential expression and enrichment analysis of high and low GRIN2D expression groups.
Supplementary Figure 7 | Comparisons of immune status and stemness between high and low GFRA2 expression groups.
Supplementary Figure 8 | Comparisons of immune status and stemness between high and low GFRA3 expression groups.
Supplementary Figure 9 | Comparisons of immune status and stemness between high and low GRIN2D expression groups.
1. Siegel RL, Miller KD, Fuchs HE, Jemal A. Cancer Statistics, 2021. CA Cancer J Clin (2021) 71(1):7–33. doi: 10.3322/caac.21654
2. Wang GX, Zhao XY, Meng ZX, Kern M, Dietrich A, Chen ZM, et al. The Brown Fat-Enriched Secreted Factor Nrg4 Preserves Metabolic Homeostasis Through Attenuation of Hepatic Lipogenesis. Nat Med (2014) 20(12):1436–43. doi: 10.1038/nm.3713
3. Mizuno K, Haga H, Okumoto K, Hoshikawa K, Katsumi T, Nishina T, et al. Intrahepatic Distribution of Nerve Fibers and Alterations Due to Fibrosis in Diseased Liver. PloS One (2021) 16(4):e0249556. doi: 10.1371/journal.pone.0249556
4. Miller BM, Oderberg IM, Goessling W. Hepatic Nervous System in Development, Regeneration, and Disease. Hepatology (2021) 74(6):3513–22. doi: 10.1002/hep.32055
5. Liu J, Wu Z, Han D, Wei CS, Liang YY, Jiang TC, et al. Mesencephalic Astrocyte-Derived Neurotrophic Factor Inhibits Liver Cancer Through Small Ubiquitin-Related Modifier (SUMO)ylation-Related Suppression of NF-κB/Snail Signaling Pathway and Epithelial-Mesenchymal Transition. Hepatology (2020) 71(4):1262–78. doi: 10.1002/hep.30917
6. Lin H, Huang H, Yu Y, Chen W, Zhang S, Zhang Y. Nerve Growth Factor Regulates Liver Cancer Cell Polarity and Motility. Mol Med Rep (2021) 23(4). doi: 10.3892/mmr.2021.11927
7. Zahalka AH, Frenette PS. Nerves in Cancer. Nat Rev Cancer (2020) 20(3):143–57. doi: 10.1038/s41568-019-0237-2
8. Wilkerson MD, Hayes DN. ConsensusClusterPlus: A Class Discovery Tool With Confidence Assessments and Item Tracking. Bioinformatics (Oxford England) (2010) 26(12):1572–3. doi: 10.1093/bioinformatics/btq170
9. Villanueva RAM, Chen ZJ. Ggplot2: Elegant Graphics for Data Analysis (2nd Ed.). Measurement: Interdiscip Res Perspect (2019) 17(3):160–7. doi: 10.1080/15366367.2019.1565254
10. Ritchie ME, Phipson B, Wu D, Hu YF, Law CW, Shi W, et al. Limma Powers Differential Expression Analyses for RNA-Sequencing and Microarray Studies. Nucleic Acids Res (2015) 43(7):e47. doi: 10.1093/nar/gkv007
11. Yu G, Wang LG, Han Y, He QY. Clusterprofiler: An R Package for Comparing Biological Themes Among Gene Clusters. Omics (2012) 16(5):284–7. doi: 10.1089/omi.2011.0118
12. Ashburner M, Ball CA, Blake JA, Botstein D, Butler H, Cherry JM, et al. Gene Ontology: Tool for the Unification of Biology. The Gene Ontology Consortium. Nat Genet (2000) 25(1):25–9. doi: 10.1038/75556
13. Kanehisa M, Goto S. KEGG: Kyoto Encyclopedia of Genes and Genomes. Nucleic Acids Res (2000) 28(1):27–30. doi: 10.1093/nar/28.1.27
14. Friedman J, Hastie T, Tibshirani R. Regularization Paths for Generalized Linear Models via Coordinate Descent. J Stat Softw (2010) 33(1):1–22. doi: 10.18637/jss.v033.i01
15. Malta TM, Sokolov A, Gentles AJ, Burzykowski T, Poisson L, Weinstein JN, et al. Machine Learning Identifies Stemness Features Associated With Oncogenic Dedifferentiation. Cell (2018) 173(2):338–354.e315. doi: 10.1016/j.cell.2018.03.034
16. Sturm G, Finotello F, Petitprez F, Zhang JD, Baumbach J, Fridman WH, et al. Comprehensive Evaluation of Transcriptome-Based Cell-Type Quantification Methods for Immuno-Oncology. Bioinformatics (2019) 35(14):i436–45. doi: 10.1093/bioinformatics/btz363
17. Mayakonda A, Lin DC, Assenov Y, Plass C, Koeffler HP. Maftools: Efficient and Comprehensive Analysis of Somatic Variants in Cancer. Genome Res (2018) 28(11):1747–56. doi: 10.1101/gr.239244.118
18. Jin MZ, Jin WL. The Updated Landscape of Tumor Microenvironment and Drug Repurposing. Signal Transduct Target Ther (2020) 5(1):166. doi: 10.1038/s41392-020-00280-x
19. Huang K, Luo YB, Bi FF, Yang H. Pharmacological Strategy for Congenital Myasthenic Syndrome With CHRNE Mutations: A Meta-Analysis of Case Reports. Curr Neuropharmacol (2021) 19(5):718–29. doi: 10.2174/1570159X18666200729092332
20. Kraner S, Sieb JP, Thompson PN, Steinlein OK. Congenital Myasthenia in Brahman Calves Caused by Homozygosity for a CHRNE Truncating Mutation. Neurogenetics (2002) 4(2):87–91. doi: 10.1007/s10048-002-0134-8
21. Sieb JP, Kraner S, Rauch M, Steinlein OK. Immature End-Plates and Utrophin Deficiency in Congenital Myasthenic Syndrome Caused by Epsilon-AChR Subunit Truncating Mutations. Hum Genet (2000) 107(2):160–4. doi: 10.1007/s004390000359
22. Li Z, Xie J, Fei Y, Gao PF, Xie QG, Gao WZ, et al. GDNF Family Receptor Alpha 2 Promotes Neuroblastoma Cell Proliferation by Interacting With PTEN. Biochem Biophys Res Commun (2019) 510(3):339–44. doi: 10.1016/j.bbrc.2018.12.169
23. Chernichenko N, Omelchenko T, Deborde S, Bakst RL, He SZ, Chen CH, et al. Cdc42 Mediates Cancer Cell Chemotaxis in Perineural Invasion. Mol Cancer Res (2020) 18(6):913–25. doi: 10.1158/1541-7786.MCR-19-0726
24. Fielder GC, Yang TW, Razdan M, Li Y, Lu J, Perry JK, et al. The GDNF Family: A Role in Cancer? Neoplasia (2018) 20(1):99–117. doi: 10.1016/j.neo.2017.10.010
25. Li TJ, Li H, Zhang WH, Xu SS, Jiang W, Li S, et al. Human Splenic TER Cells: A Relevant Prognostic Factor Acting via the Artemin-Gfrα3-ERK Pathway in Pancreatic Ductal Adenocarcinoma. Int J Cancer (2021) 148(7):1756–67. doi: 10.1002/ijc.33410
26. Yan Y, Li MN, Yang B, Geng J, Zheng JH, Yao XD. Expression of Gfrα3 Correlates With Tumor Progression and Promotes Cell Metastasis in Urothelial Carcinoma. Minerva Urol Nefrol (2018) 70(1):79–86. doi: 10.23736/S0393-249.17.02887-9
27. Eftang LL, Klajic J, Kristensen VN, Tost J, Esbensen QY, Blom GP, et al. GFRA3 Promoter Methylation may be Associated With Decreased Postoperative Survival in Gastric Cancer. BMC Cancer (2016) 16:225. doi: 10.1186/s12885-016-2247-8
28. XiangWei W, Kannan V, Xu Y, Kosobucki GJ, Schulien AJ, Kusumoto H, et al. Heterogeneous Clinical and Functional Features of GRIN2D-Related Developmental and Epileptic Encephalopathy. Brain (2019) 142(10):3009–27. doi: 10.1093/brain/awz232
29. Li D, Yuan H, Ortiz-Gonzalez XR, Marsh ED, Tian LF, McCormick EM, et al. GRIN2D Recurrent De Novo Dominant Mutation Causes a Severe Epileptic Encephalopathy Treatable With NMDA Receptor Channel Blockers. Am J Hum Genet (2016) 99(4):802–16. doi: 10.1016/j.ajhg.2016.07.013
Keywords: neural-related genes (NRGs), liver cancer, nerve-cancer crosstalk, immune infiltration, biomarker
Citation: Zhang Y-G, Jin M-Z, Zhu X-R and Jin W-L (2022) Reclassification of Hepatocellular Cancer With Neural-Related Genes. Front. Oncol. 12:877657. doi: 10.3389/fonc.2022.877657
Received: 17 February 2022; Accepted: 28 March 2022;
Published: 13 May 2022.
Edited by:
Fan Feng, The 302th Hospital of PLA, ChinaReviewed by:
Xudong Gao, Fifth Medical Center of the PLA General Hospital, ChinaCopyright © 2022 Zhang, Jin, Zhu and Jin. This is an open-access article distributed under the terms of the Creative Commons Attribution License (CC BY). The use, distribution or reproduction in other forums is permitted, provided the original author(s) and the copyright owner(s) are credited and that the original publication in this journal is cited, in accordance with accepted academic practice. No use, distribution or reproduction is permitted which does not comply with these terms.
*Correspondence: Wei-Lin Jin, bGR5eV9qaW53bEBsenUuZWR1LmNu; d2VpbGluamluQHlhaG9vLmNvbQ==
†These authors have contributed equally to this work
Disclaimer: All claims expressed in this article are solely those of the authors and do not necessarily represent those of their affiliated organizations, or those of the publisher, the editors and the reviewers. Any product that may be evaluated in this article or claim that may be made by its manufacturer is not guaranteed or endorsed by the publisher.
Research integrity at Frontiers

Learn more about the work of our research integrity team to safeguard the quality of each article we publish.