 Tingting Yuan1
 Yuewei Zhang1
 Xuetao Chen1Maomao Wei1
 Hua Zhu1
 Yuqin Song2
 Zhi Yang1
 Jun Zhu2
 Xuejuan Wang1*
- 1Key Laboratory of Carcinogenesis and Translational Research (Ministry of Education/Beijing), NMPA Key Laboratory for Research and Evaluation of Radiopharmaceuticals (National Medical Products Administration), Department of Nuclear Medicine, Peking University Cancer Hospital and Institute, Beijing, China
- 2Key Laboratory of Carcinogenesis and Translational Research (Ministry of Education), Department of Lymphoma, Peking University Cancer Hospital and Institute, Beijing, China
This study aimed to determine the predictive and prognostic value of baseline metabolic tumor volume (MTV) and the Peking criteria from serial positron emission tomography (PET) scans in diffuse large B-cell lymphoma, including 300 newly diagnosed patients who were prospectively treated with 2–4 cycles of standard first-line treatment (clinicaltrials.gov identifier: NCT02928861). PET/computed tomography (CT) examinations were performed at baseline, after two (PET-2) or four cycles (PET-4). PET during the interim was evaluated using Deauville 5-point scales (5-PS), ΔSUVmax criteria, and the Peking criteria which interpreted based on the maximum standard uptake of the liver (SUVmax-liver). Peking criteria had better accuracy, positive predictive value (PPV), and specificity than other two methods. The MTV and Peking criteria both significantly predicted progression-free survival (PFS) and overall survival (OS). An MTV > 191 cm2 and Peking criteria of PET-2 and PET-4 > 1.6-fold SUVmax-liver was used as the cutoff for a positive result. PET-4 achieved higher accuracy, PPV, and specificity for 2-year PFS (83.3%, 86.7%, and 98.4%, respectively) and OS (92.6%, 73.3%, and 97.2%, respectively) than PET-2. Various prognostic models containing different risk factors were established via Cox regression analysis. The MTV and PET-2/PET-4 results were used to categorized patients into low-risk, intermediate-risk, and high-risk prognostic groups (with 0, 1, and 2 risk factors, respectively) (P < 0.0001). High burden MTV and positive PET-2 and PET-4 (>1.6-fold SUVmax-liver) could identify high-risk patients with 2-year PFS and OS of 0.0% and 26.3% (95% confidence interval [CI]: N/A to 54.3%). When PET-2 and PET-4 were evaluated by 5-PS, the 2-year PFS and OS from high risk patients of three-parameters model achieved 31.4% (95%CI: 6.9%–55.9%) and 42.7% (95%CI: 14.6%–70.7%). In conclusion, combining baseline MTV and any regular response on PET/CT evaluated using the Peking criteria can improve prognostic value. Serial PET/CT from baseline MTV to PET-4 may have relatively greater predictive power for poor prognosis in diffuse large B-cell lymphoma.
Clinical Trial Registration: ClinicalTrials.gov, identifier (NCT02928861).
Introduction
Diffuse large B-cell lymphoma (DLBCL) is the largest subtype of non-Hodgkin lymphoma worldwide. Standard treatment with rituximab, cyclophosphamide, doxorubicin, vincristine, and prednisone (R-CHOP) can cure most cases of DLBCL, but approximately 30% will have treatment failure and a short survival period (1, 2). The most universally used prognostic index of DLBCL in clinical practice is the International Prognostic Index (IPI), which has 5 independent risk factors for survival: age (≤60 vs. >60 years), Ann Arbor stage (I/II vs. III/IV), number of extranodal (EN) sites (0–1 vs. ≥2), performance status (PS; 0–1 vs. ≥2), and serum lactate dehydrogenase (LDH; normal vs. elevated). However, this cannot dynamically evaluate disease status.
Molecular imaging with 18F-fluorodeoxyglucose positron emission tomography/computed tomography (18F-FDG PET/CT) is recommended for staging and assessing treatment efficacy. Metabolic tumor volume (MTV), interim PET, and end-of-treatment PET have been shown to predict outcomes in DLBCL (3–5). Patients with high MTV have a higher risk for disease progression or death than those with a low tumor burden. However, MTV only determines the patients’ risk at baseline, similar to the IPI. Two studies have suggested that PET-based prognostic models, including baseline MTV and PET scan after two cycles (PET-2), can help identify patients who can benefit from treatment adjustments or new treatments (6, 7). Both of those studies focused on the use of baseline and interim PET after two cycles of chemotherapy to predict therapeutic outcomes. However, studies have not yet explored the value of baseline PET combined with PET works after four cycles of therapy or serial PET scans.
Deauville 5-point scales (5-PS) and the change in maximum standardized uptake (ΔSUVmax) method have been widely recognized in PET/CT image interpretation for the prognosis of DLBCL patients (8, 9). Previous studies by our research group suggested that the Peking criteria may be superior to those aforementioned methods (10–12), but those were retrospective studies with relatively small sample sizes. The present study aimed to identify the predictive and prognostic value of the Peking criteria and fully illustrate the clinical role of 18F-FDG PET/CT at baseline until four cycles of treatment.
Methods
Study Design
This was a single-center study. From January 2017 to December 2019, this study prospectively included 300 newly diagnosed DLBCL patients who underwent baseline PET/CT. Patients with a measurable lesion (i.e., minimum SUVmax of 2.5 in PET/CT) were included. All patients received 6–8 cycles of a first-line CHOP-like chemotherapy regimen: cyclophosphamide, 750 mg/m2 intravenous (i.v.) on day 1 (D1); vincristine, 1.4 mg/m2 i.v. on D1; doxorubicin, 50 mg/m2 i.v. on D1; and prednisolone, 60 mg/m2 orally on D1-5. This regimen was taken with or without rituximab (375 mg/m2 i.v. on D1). Treatment will not be changed on the basis of PET-4 scans unless there was definite progression. Patients with secondary malignant disease, serious infection, inflammation (e.g., HIV), or severe hepatic or renal dysfunction were excluded. The study was approved by the institutional review board at Peking University Cancer Hospital (2017KT23) in accordance with the Declaration of Helsinki (clinicaltrials.gov identifier: NCT02928861).
PET Image Acquisitions and Analysis
Patients were administered 3.7 MBq/kg 18F-FDG fast for at least 6 h before injection to ensure that the serum glucose level was less than 10 mmol/L. The PHILIPS EBW workstation was used for the imaging evaluation. Liver uptake was assessed along the largest cross-section. Interim PET scans were always performed before the third or fifth cycle. PET-2 was performed 17 ± 4 days after cycle 2 and PET-4 was about 17 ± 5 days after cycle 4. PET images were review by two blinded experienced nuclear physicians. SUVmax and MTV were measured in 3D mode using vendor-provided software. MTV was calculated by involving 41% SUVmax thresholding of automatically detected regions (SUVmax > 2.5). The total MTV of all lesions was also calculated in the baseline PET/CT scans. In the Peking criteria, an SUVmax greater than 1.6-fold that of the SUVmax of the liver (SUVmax-liver) on PET-2 and PET/CT examination at PET-4 is used to identify patients with worse response and prognosis (10–12). In routine clinical practice, 5-PS score > 3 (18F-FDG uptake higher than in the liver) is considered positive when using the 5-PS to evaluate PET response (13). The percentage change in SUVmax between baseline and PET-2/PET-4 scans was described by ΔSUVmax. In a previous study on DLBCL, the cutoff values of ΔSUVmax for PET-2 and PET-4 were reported to be 66% and 70%, respectively (4, 14).
Survival Analysis and Statistical Analysis
Two-year progression-free survival (PFS) and overall survival (OS) were used as endpoints to evaluate the prognostic significance of interim PET/CT in the prospective cohort. PFS was defined as the time between the date of biopsy results and progression, relapse, or death from any cause. Overall survival (OS) was calculated from the date of biopsy results until death or last follow-up. Receiver operating characteristic (ROC) curve analysis was performed for continuous variables to determine optimal cutoff values for baseline MTV. Survival was analyzed using the Kaplan–Meier method and compared using the log-rank test. The life-table method was used to calculate 2-year PFS and OS rates. The multivariate Cox proportional hazards model was used for univariate and multivariate analyses to identify significant prognostic factors for survival outcomes. All statistical analyses were carried out using the SPSS software (version 25.0) and the survival package in R, version 4.1.2. Two-sided P-values less than 0.05 were considered statistically significant.
Results
Patient Characteristics
We initially enrolled 361 DLBCL patients from January 2017 and December 2019. Then, 61 patients were excluded due to secondary malignant disease (n = 6), no follow-up PET/CT (n = 34), no regular PET/CT examination (n = 12), no CHOP-like treatment (n = 1) and incomplete follow-up (n = 8). There were a total of 300 patients with complete data, who were thus eligible for analysis (Online Supplementary Figure 1). The median age was 57 years, with an Eastern Cooperative Oncology Group scale performance status of 0, 1, 2, 3, and 4 in 76.0% (228/300), 17.0% (51/300), 5.4% (16/300), 1.3% (4/300), and 0.3% (1/300) of patients, respectively. Meanwhile, Ann Arbor stage I, II, III, and IV disease was seen in 31 (10.3%), 109 (36.3%), 35 (11.7%), and 125 (41.7%) patients, respectively. IPI scores of 0–2 and 3–5 were documented in 206 (68.7%) and 94 (31.3%) patients, respectively. The baseline characteristics of DLBCL patients are shown in Table 1. 3.7%(11/300) of patients treated with first-line CHOP-like without rituximab due to elevated hepatitis B virus DNA content (n = 8), high level of hepatitis C virus RNA content (n = 1), and financial reasons (n = 2).
Table 1 Clinical features of patients with diffuse large B-cell lymphoma.
PET/CT Features
All 300 eligible patients underwent initial pretreatment PET/CT. Among them, 252 patients underwent interim PET-2, while 236 were able to undergo PET-4. A total of 211 patients had a complete assessment with baseline scans, interim PET-2 scans, and interim PET-4 scans. A total of 43 patients received the following interventions: involved field radiotherapy for bulky disease (n = 24), high-dose methotrexate for CNS-directed prophylaxis strategies (n = 7), and autologous stem cell transplantation (n = 12).
Lymphoma lesions with an SUVmax higher than 1.6-fold SUVmax-liver on PET-2 and PET-4 were positive when using Peking criteria. A cutoff value of 191 cm3 was found to be optimal for MTV and was highly predictive of outcomes (PFS: P < 0.0001; OS: P < 0.0001). The areas under the ROC curves were 0.69 (P < 0.001) for PFS and 0.73 (P < 0.001) for OS. Three different image interpretation methods (i.e., Peking criteria, 5-PS, ΔSUVmax criteria) were used to assess the predictive and prognostic value of interim (2-year PFS and OS). Consistent with our group previous studies, the Peking criteria had superior accuracy, PPV, and specificity for both PFS and OS in PET-2 and PET-4 compared to the 5-PS and ΔSUVmax criteria (Tables 2, 3). When baseline (i.e., MTV) and interim PET (i.e., PET-2, PET-4) were taken together, PET after treatment was classified as positive with an MTV > 191 cm2 and PET-2 or PET-4 > 1.6-fold SUVmax-liver (i.e., according to the Peking criteria). In this study, defined as consistently positive or negative, the combined strategy had better accuracy, PPV, NPV and specificity than the three image interpretation methods alone, as well as greater sensitivity than the Peking criteria, Deauville 5-point scales, and ΔSUVmax criteria. The combined method was evidently a stronger evaluation tool of DLBCL treatment. The accuracy, PPV and specificity (83.3%, 86.7%, and 98.4%, respectively for 2-year PFS; 92.6%, 73.3%, and 97.2%, respectively for 2-year OS) of MTV (> 191 cm3) combined with PET-4 (> 1.6-fold SUVmax-liver) were higher than those of PET-2 (80.9%, 75.0%, and 95.3%, respectively for 2-year PFS; 89.0%, 50.0% and 92.2%, respectively for 2-year OS; Table 4).
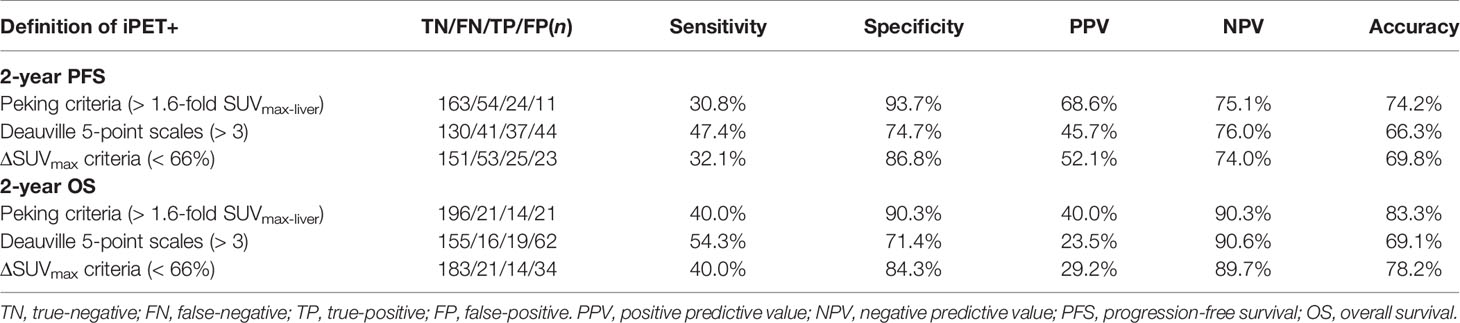
Table 2 Accuracy of interim 18F-FDG PET/CT scan after two cycles of therapy (PET-2) interpreted using different image interpretation methods (n = 252).
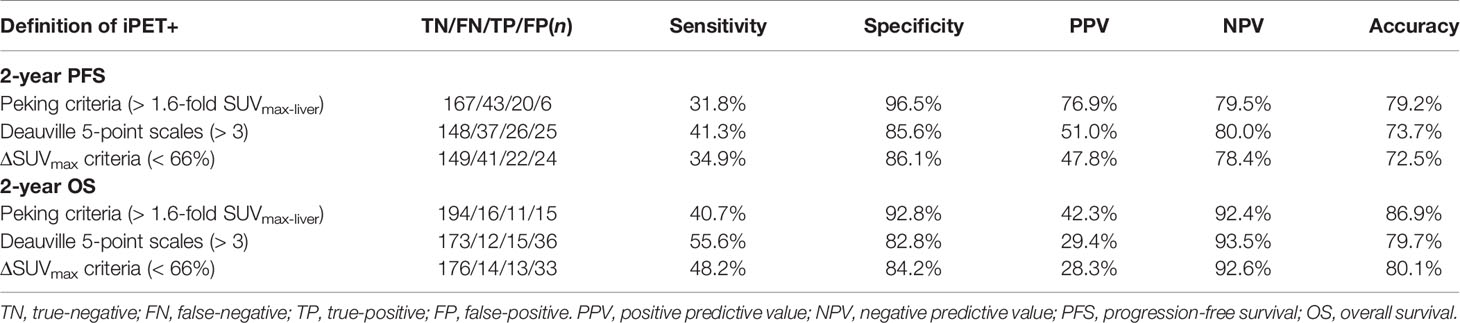
Table 3 Accuracy of interim 18F-FDG PET/CT scan after four cycles of therapy (PET-4) interpreted using different image interpretation methods (n = 236).
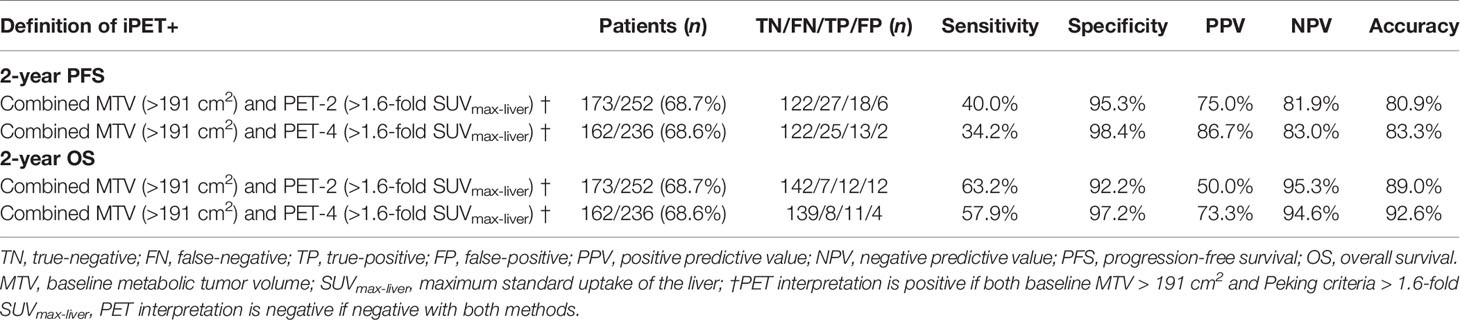
Table 4 Accuracy of 18F-FDG PET/CT interpreted using baseline metabolic tumor volume combined with the Peking criteria.
Treatment Outcome
The median follow-up was 28 months (range, 3-58 months). Kaplan–Meier curves showed that PET-2 and PET-4, as investigated by the 3 image interpretations, were strong prognostic factors for both PFS and OS (Figure 1, all P-values < 0.001). Since the sample size of patients treated with CHOP/CHOP-like without rituximab is rather small, no significant differences were found in survival outcomes when compared with patients treated with R-CHOP/R-CHOP-like (P = 0.749 for PFS, P = 0.203 for OS).
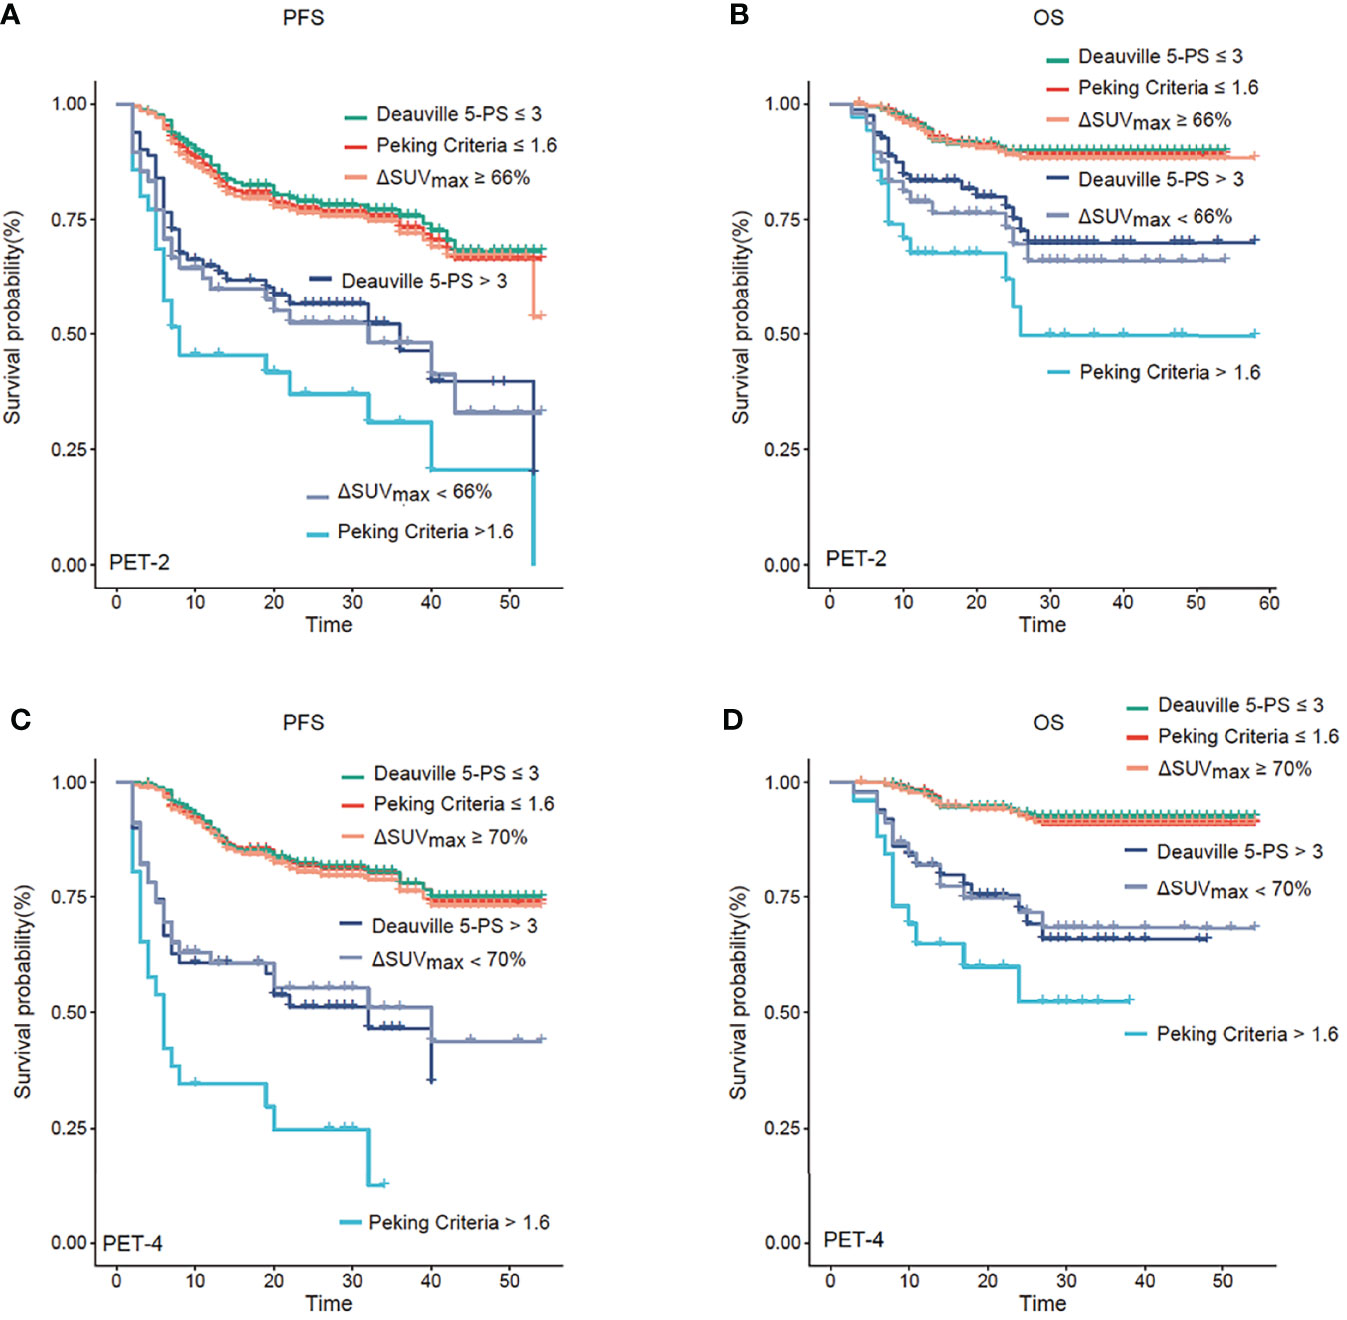
Figure 1 Progression-free survival (PFS) and overall survival (OS) analysis. Kaplan–Meier analysis of PFS and OS according to positron emission tomography (PET) after two cycles of therapy (PET-2) (A, B) and after four cycles of therapy (PET-4) (C, D). PET-2 and PET-4 investigated by the three image interpretations were strong prognostic factors for both PFS and OS (all P < 0.001). The Peking criteria was superior 5-PS and ΔSUVmax criteria in terms of predicting prognosis.
Univariate analysis of the primary cohort suggested that among the features of lymphoma patients, Ann Arbor stage, IPI, LDH, MTV, PET-2, and PET-4 were significant predictors of both PFS and OS (Online Supplementary Table 1). Prognostic model 1 was used to demonstrate that the MTV and PET-2 interpreted using the Peking criteria (since it was found to be superior to other image interpretations) were independent prognostic factors for both PFS (MTV: hazard ratio [HR] = 1.848, P = 0.027; PET-2: HR = 4.001, P < 0.001) and OS (MTV: HR = 3.517, P = 0.005; PET-2: HR = 5.025, P < 0.001) via multivariate analysis (Table 5). This PET/CT-related prognostic index for the DLBCL model was able to efficiently identify 3 categories of patients with different outcomes in the PET-2 group (n = 252; Online Supplementary Figure 2). A total of 149 (59.1%) patients were classified as low-risk (no risk factor), 79 (31.4%) as intermediate-risk (1 risk factor; HR = 2.748 for PFS, HR = 4.803 for OS), and 24 (9.5%) as high-risk (2 risk factors; HR = 27.500, HR = 17.213 for OS) in the interim PET-2 group when using Peking criteria. The 2-year PFS and OS, respectively, according to category were as follows: low-risk: 83.9% (95% CI: 77.5% to 90.4%) and 94.4% (95% CI: 90.3% to 98.4%); intermediate-risk: 52.8% (95% CI: 40.8% to 64.8%) and 74.6% (95% CI: 63.4% to 85.8%); and high-risk: 27.5% (95% CI: 7.0% to 48.0%) and 37.7% (95% CI: 12.4% to 62.9%). As 5-PS was commonly used in clinical practice for PET efficacy assessments of lymphoma (8), risk assessment by combining MTV and PET-2 according to 5-PS was still workable (Online Supplementary Figure 2). The 2-year PFS and OS of low-risk, intermediate-risk, and high-risk were 84.9% vs. 55.6% vs. 45.2% and 95.4% vs. 75.2% vs. 59.3% (P < 0.0001; Online Supplementary Table 2).
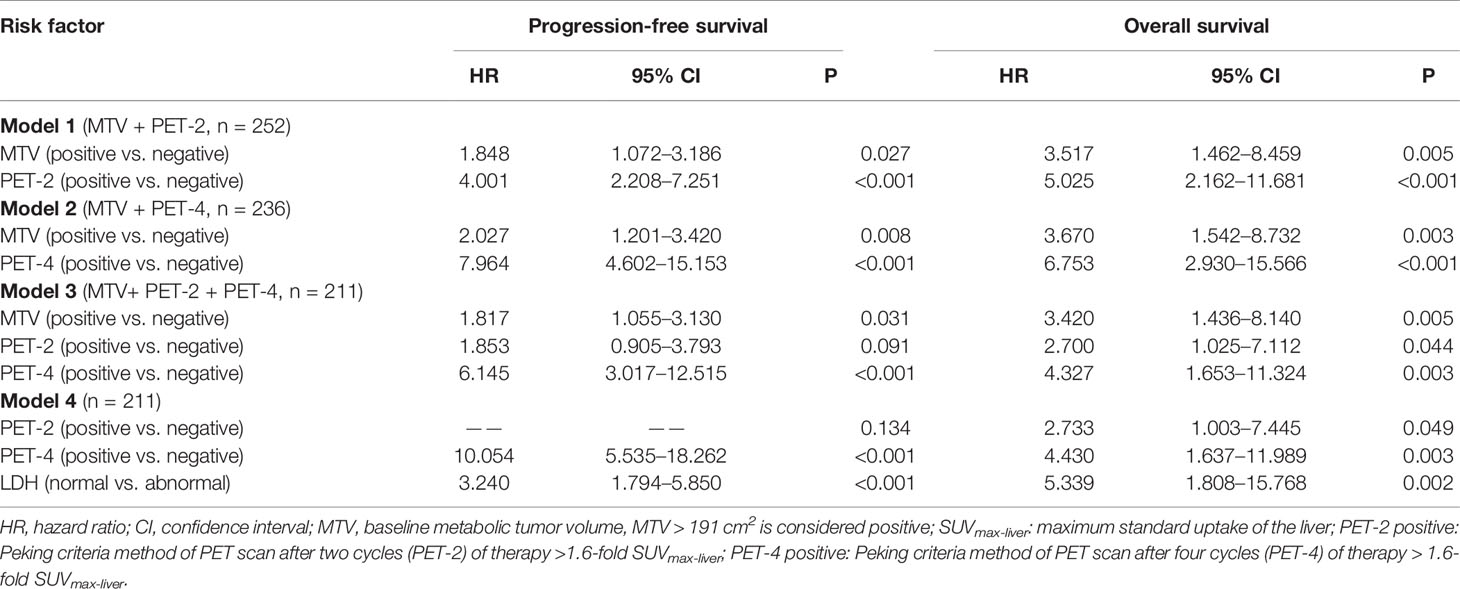
Table 5 Multivariate analysis for survival and disease progression (PET response interpretation: Peking criteria).
Prognostic model 2 tested MTV and PET-4; both of which were found to be independent prognostic factors of PFS and OS (Table 5). Patients with low baseline MTV and good response had favorable prognosis regardless of treatment (2-year PFS of 84.0%; 2-year OS of 93.3%). Meanwhile, patients with either high baseline MTV or positive PET response (according to the Peking criteria) had an intermediate prognosis (2-year PFS of 64.1%; 2-year OS of 79.8%). The interim PET-4 group included 147 (62.3%), 74 (31.3%), and 15 (6.4%) low-risk, intermediate-risk, and high-risk patients, respectively. According to the log-rank test, this model showed that patients with a high baseline tumor burden (MTV > 191 cm3) and poor response (PET-4 > 1.6-fold SUVmax-liver) had significantly poorer prognosis (2-year PFS of 5.8%; 2-year OS of 42.9%; P < 0.0001; Online Supplementary Table 3). Patients with 5-PS > 3 point and high baseline MTV had 2-PFS of 31.3% and 2-year OS of 47.8%, lower than low-risk, intermediate-risk patients (P < 0.0001; Online Supplementary Figure 3).
Prognostic model 3 involved MTV-2, PET-2 and PET-4, which were available for 211 patients. Only PET-2 was not an independent factor for 2-year PFS. Similar to the previous models, patients were again classified into the same three categories of risk (Figure 2). The three-parameter risk-stratification model was able to statistically predict both PFS and OS (both P < 0.001). The 2-year PFS and OS rates of high-risk cases were 0.0% and 26.3% (95% CI: N/A to 54.3%), respectively. When using 5-PS to help to determine high-risk patients, there were 31.4% for 2-year PFS and 42.7% for 2-year OS (P < 0.0001; Figure 2).
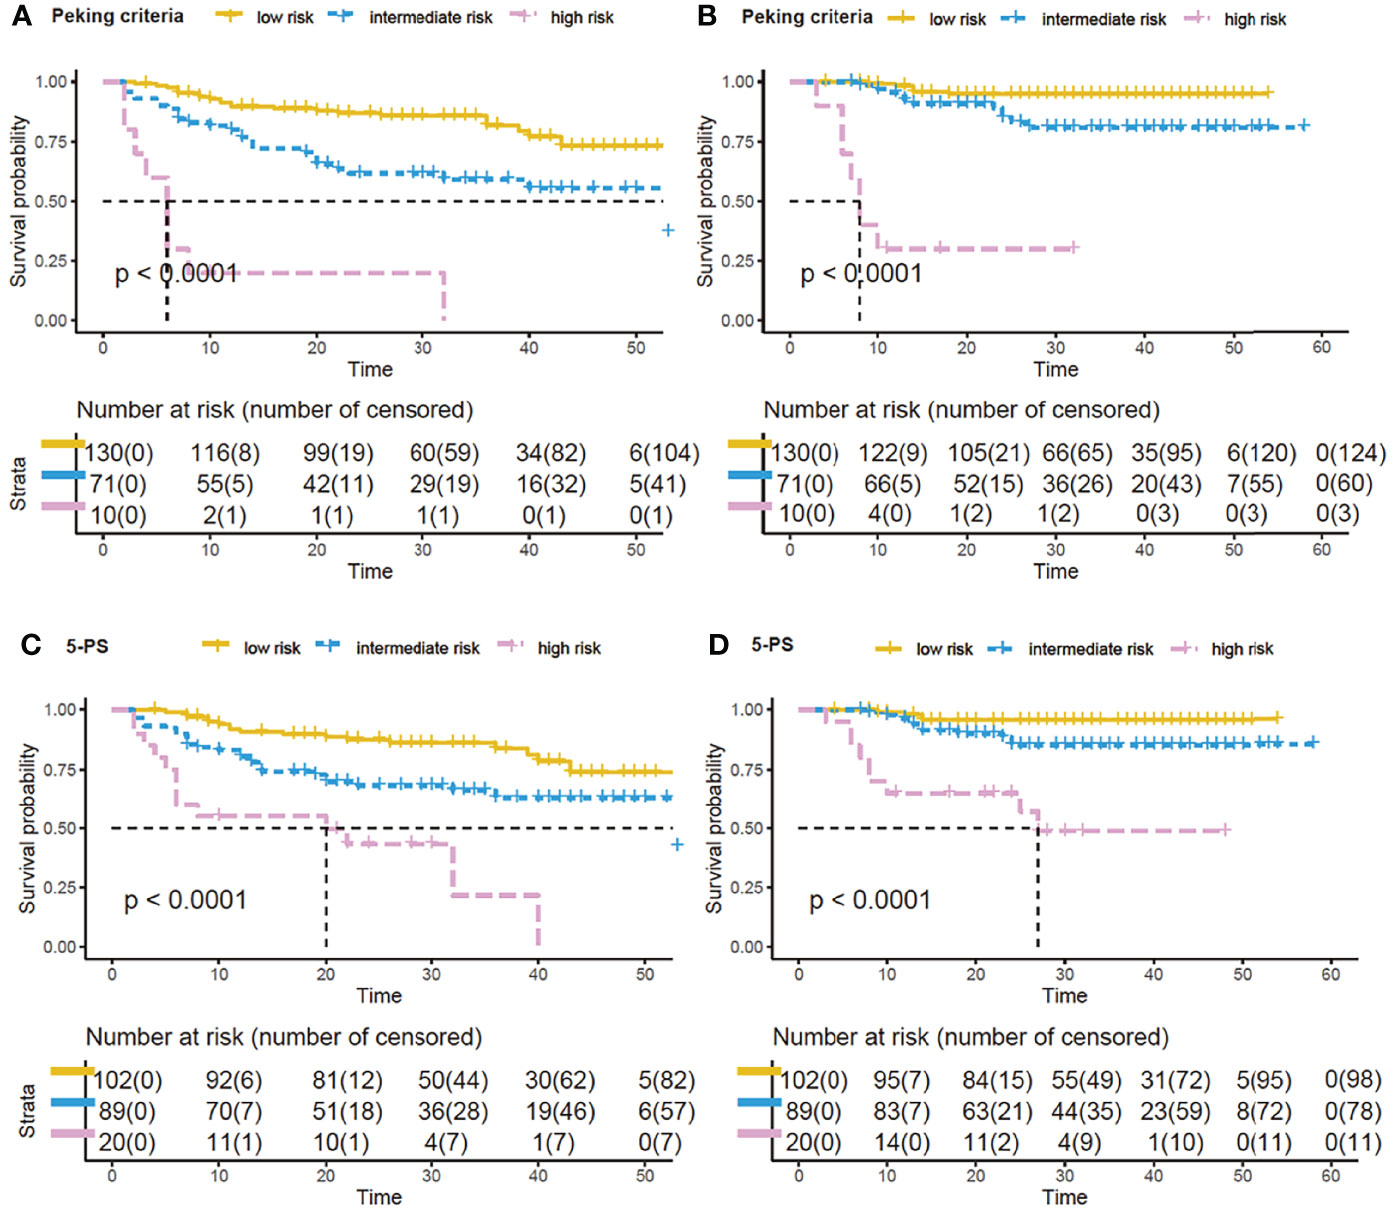
Figure 2 Survival curves by new model of three PET parameters by using Peking criteria or Deauville 5-point scales (5-PS). Kaplan–Meier analysis of progression-free survival (PFS) and overall survival (OS) by the new prognostic model by combining baseline metabolic tumor volume (MTV), PET after two cycles of therapy (PET-2) and PET after four cycles of therapy (PET-4): low-risk, no risk factor; intermediate-risk, 1 or 2 risk factors; high-risk, 3 risk factors. With Peking criteria, the respective 2-year PFS and OS of the 3 groups were 85.3% (95% CI, 79.2%–91.4%) and 94.6% (95% CI, 90.3%–98.8%) for low-risk patients (yellow curve); 58.6% (95% CI, 46.1%–71.0%) and 79.4% (95% CI, 68.2%–90.6%) for intermediate-risk patients (blue curve); and 0.0% and 26.3% (95% CI, N/A to 54.3%) for high-risk patients (purple curve) (A, B). For 5-PS, 2-year probabilities of low-, intermediate-, and high-risk groups were 85.7%, 65.1%, 31.4% for PFS (C), and were 95.5%, 84.1%, 42.7% for OS (D).
Model 4 in Table 5 included all individual factors that were significant on univariate analysis. Only PET-4 and LDH were identified as independent prognostic indicators for PFS and OS (both P < 0.001), whereas PET-2 did not reach statistical significance for PFS (P = 0.134).
Discussion
This study explored the use of serial PET/CT from baseline to the interim treatment response as a tool for risk assessment. The Peking criteria outperformed the 5-PS and ΔSUVmax methods in predicting the prognosis of 2-year PFS and OS. Approximately 30.3% of DLBCL patients experienced disease progression, and 14.3% died at the time of last follow-up.
Mamot et al. reported that interim PET/CT scans could not predict 2-year OS when PET/CT assessments were categorized by using 5-PS (4 and 5 vs. 1–3) in DLBCL patients treated with R-CHOP-14 (15). The positivity rates of PET-2 and PET-4 (60.1% and 43.2%) were significantly higher than those in prior studies when using ΔSUVmax, ranging from 11% to 21.9% (4, 16, 17). In accordance with the evaluation of ΔSUVmax, PET-2 and PET-4 had positivity rates of 13.8% and 11.0%, respectively, when assessed using the Peking criteria. The high positivity rates of R-CHOP-14 therapy may be due to the short time interval (less than 14 days) between chemotherapy administration and the PET/CT scan, with nonspecific FDG uptake, which is caused by treatment-related inflammation and bone remodeling. The interval between last chemotherapy and PET examination was about 16 to 21 days in other studies. The Peking criteria (1.6-fold SUVmax-liver for PET-2 and PET-4) and ΔSUVmax both outperformed 5-PS (1.0-fold SUVmax-liver) in distinguishing false positive lesions (11, 18). There was considerable proportion of PFS patients whose lymphoma residual site SUVmax was between 1.0- to 1.6-fold that of the SUVmax-liver; these cases were deemed to have poor prognosis upon image interpretation via the 5-PS (Figure 3). Kurch et al. also suggested that to screen patients for more aggressive therapies, a cutoff between scores of 4 and 5 on the visual scale (5-PS) may be more beneficial. The qPET method, which is based on a single scan (similar to the 5-PS and the Peking criteria), was found to include essentially the same scan information as ΔSUVmax (9). However, the qPET method is slightly more complicated to calculate than the Peking criteria and 5-PS.
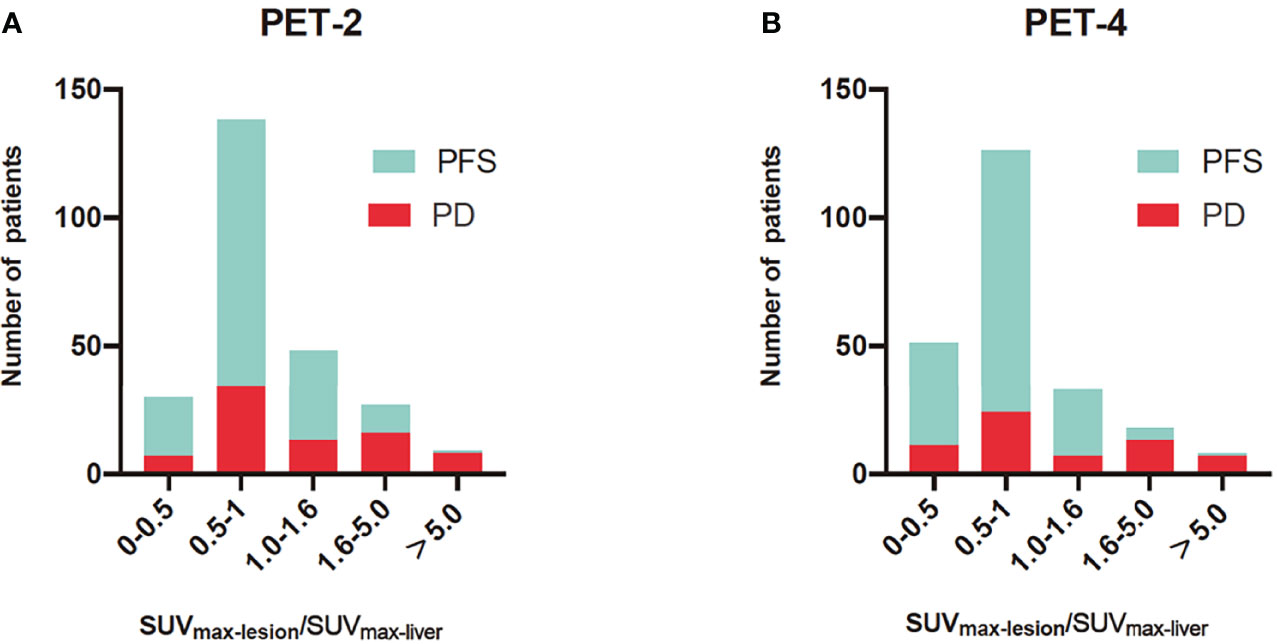
Figure 3 Histograms of SUVmax-lesion/SUVmax-liver for progression-free survival (PFS) and progression disease (PD) in PET after two cycles of therapy (PET-2) (A) and PET after four cycles of therapy (PET-4) (B). The SUVmax-lesion/SUVmax-liver was SUVmax ratio between the tumor and liver. For PET-2 and PET-4, interim PET was evaluated by 1.6-fold of SUVmax-liver in the Peking criteria and 1.0-fold of SUVmax-liver in Deauville 5-point scales. The Peking criteria was better than 5-PS in distinguishing false positive lesions.
In this trial, MTV and PET-2/PET-4 had independent predictive value. A prognostic model was proposed based on these features derived from PET/CT imaging that depict two different aspects of the disease: tumor burden and treatment response. High risk patients identified by Peking criteria had more unfavorable prognosis than groups evaluated by using 5-PS. An interim PET/CT at a later time point (PET-4) might be able to better distinguish between patients with good or poor prognosis than PET-2 (Table 4). Prognostic model 2 combined the Peking criteria (PET-4 > 1.6-fold SUVmax-liver) and MTV (> 191 cm2), and was able to identify high-risk patients with poor prognosis. Regarding survival, 8 out of 15 high-risk patients died within 8 months. Meanwhile, most survivors (6 out of 7) in the high-risk category from the prospective PET-4 groups changed their therapeutic regimen after 4 or 6 cycles of first-line CHOP-like chemotherapy, with the longest overall regimen lasting 38 months. Only one patient received autologous stem cell transplantation. Combining baseline MTV and PET-2/PET-4 evaluated by the Peking criteria, we identified 9 (90.0%) high-risk patients who had disease progression within 32 months, whereas 7 (70%) patients died in less than 11 months.
Previous studies showed that combining MTV and PET-2 can identify patients with poor prognosis and guide clinical treatment (6, 7). Schmitz et al. defined three groups by combining MTV and PET-2 response (cutoff of ΔSUVmax: 66%), with low-risk, intermediate-risk, and high-risk groups having respective 2-year probabilities of 90.9%, 62.5%, 29.9% for PFS and 95.5%, 77.4%, and 37.1% for OS (6), which were similarly to our three-parameter risk-stratification model by combined with the Peking criteria. Our results revealed that the combination of MTV and PET-4 was still effective. In line with this, Yuan et al. found that performing an interim 18F-FDG PET/CT after one cycle of chemotherapy is feasible and yields similar predictive results compared to PET-2 in DLBCL patients (3). Numerous studies have shown that interim PET could predict the prognosis of a different magnitude in patients suffering from DLBCL.
Patients receive PET/CT scans in various stages of cancer therapy for very different reasons. Physicians can take full advantage of interim regular PET/CT scans. We found that the combination of MTV and interim PET was optimal for evaluating prognosis. In the combined assessment, interim PET was considered positive if both the MTV and Peking criteria were positive. Our results suggest that patients with a large tumor burden that are positive on interim PET can be candidates for novel therapeutic approaches, such as immune checkpoint inhibitors and chimeric antigen receptor T cells. Further multicenter studies with a larger sample size are needed to determine the optimal combination of prognostic parameters for use in clinical practice.
In conclusion, serial 18F-FDG PET/CT scans from baseline to interim treatment are practical in evaluating the curative effect and prognosis of DLBCL. When taken together, assessing the MTV and interim response on PET/CT using the Peking criteria enhances the prognostic value of PET, and appears promising to guide therapeutic strategies.
Data Availability Statement
The original contributions presented in the study are included in the article/Supplementary Material. Further inquiries can be directed to the corresponding author.
Ethics Statement
The studies involving human participants were reviewed and approved by Peking University Cancer Hospital. The patients/participants provided their written informed consent to participate in this study.
Author Contributions
Concept and design: TY and XW. Literature search: TY, YZ, and XC. Data acquisition, data analysis: TY, YZ, and XW. Manuscript preparation: TY, YZ, and XW. Manuscript editing: TY, XC, MW, and XW. Manuscript review: YZ, MW, HZ, YS, ZY, JZ, and XW. All authors contributed to the article and approved the submitted version.
Funding
This work was supported by the National Natural Science Foundation of China (grant number.82071957), Beijing Hospitals Authority Clinical Medicine Development of special funding support (grant number XMLX202120) and Capital’s Funds for Health Improvement and Research (grant number 2018-2-1024).
Conflict of Interest
The authors declare that the research was conducted in the absence of any commercial or financial relationships that could be construed as a potential conflict of interest.
Publisher’s Note
All claims expressed in this article are solely those of the authors and do not necessarily represent those of their affiliated organizations, or those of the publisher, the editors and the reviewers. Any product that may be evaluated in this article, or claim that may be made by its manufacturer, is not guaranteed or endorsed by the publisher.
Supplementary Material
The Supplementary Material for this article can be found online at: https://www.frontiersin.org/articles/10.3389/fonc.2022.876581/full#supplementary-material
References
1. Sehn LH, Donaldson J, Chhanabhai M, Fitzgerald C, Gill K, Klasa R, et al. Introduction of Combined CHOP Plus Rituximab Therapy Dramatically Improved Outcome of Diffuse Large B-Cell Lymphoma in British Columbia. J Clin Oncol (2005) 23:5027–33. doi: 10.1200/jco.2005.09.137
2. Younes A, Sehn LH, Johnson P, Zinzani PL, Hong X, Zhu J, et al. Randomized Phase III Trial of Ibrutinib and Rituximab Plus Cyclophosphamide, Doxorubicin, Vincristine, and Prednisone in Non-Germinal Center B-Cell Diffuse Large B-Cell Lymphoma. J Clin Oncol (2019) 37(15):1285–95. doi: 10.1200/jco.18.02403
3. Yuan L, Kreissl MC, Su L, Wu Z, Hacker M, Liu J, et al. Prognostic Analysis of Interim (18)F-FDG PET/CT in Patients With Diffuse Large B Cell Lymphoma After One Cycle Versus Two Cycles of Chemotherapy. Eur J Nucl Med Mol Imaging (2019) 46:478–88. doi: 10.1007/s00259-018-4198-6
4. Schöder H, Polley MC, Knopp MV, Hall N, Kostakoglu L, Zhang J, et al. Prognostic Value of Interim FDG-PET in Diffuse Large Cell Lymphoma: Results From the CALGB 50303 Clinical Trial. Blood (2020) 135:2224–34. doi: 10.1182/blood.2019003277
5. Savani M, Gencturk M, Shanley R, Cayci Z, Wilke C, Warlick ED, et al. Surveillance Imaging After Autologous Hematopoietic Cell Transplantation Predicts Survival in Patients With Diffuse Large B Cell Lymphoma. Biol Blood Marrow Transplant (2020) 26:272–7. doi: 10.1016/j.bbmt.2019.10.013
6. Schmitz C, Hüttmann A, Müller SP, Hanoun M, Boellaard R, Brinkmann M, et al. Dynamic Risk Assessment Based on Positron Emission Tomography Scanning in Diffuse Large B-Cell Lymphoma: Post-Hoc Analysis From the PETAL Trial. Eur J Cancer (2020) 124:25–36. doi: 10.1016/j.ejca.2019.09.027
7. Mikhaeel NG, Smith D, Dunn JT, Phillips M, Møller H, Fields PA, et al. Combination of Baseline Metabolic Tumour Volume and Early Response on PET/CT Improves Progression-Free Survival Prediction in DLBCL. Eur J Nucl Med Mol Imaging (2016) 43:1209–19. doi: 10.1007/s00259-016-3315-7
8. Cheson BD, Fisher RI, Barrington SF, Cavalli F, Schwartz LH, Zucca E, et al. Recommendations for Initial Evaluation, Staging, and Response Assessment of Hodgkin and Non-Hodgkin Lymphoma: The Lugano Classification. J Clin Oncol (2014) 32:3059–68. doi: 10.1200/JCO.2013.54.8800
9. Kurch L, Hüttmann A, Georgi TW, Rekowski J, Sabri O, Schmitz C, et al. Interim PET in Diffuse Large B-Cell Lymphoma. J Nucl Med (2021) 62:1068–74. doi: 10.2967/jnumed.120.255034
10. Fan Y, Zhang Y, Yang Z, Ying Z, Zhou N, Liu C, et al. Evaluating Early Interim Fluorine-18 Fluorodeoxyglucose Positron Emission Tomography/Computed Tomography With the SUVmax-Liver-Based Interpretation for Predicting the Outcome in Diffuse Large B-Cell Lymphoma. Leuk Lymphoma (2017) 58:1–9. doi: 10.1080/10428194.2016.1277384
11. Zhang Y, Fan Y, Ying Z, Song Y, Zhu J, Yang Z, et al. Can the SUVmax-Liver-Based Interpretation Improve Prognostic Accuracy of Interim and Posttreatment (18)F-FDG PET/CT in Patients With Diffuse Large B-Cell Lymphoma? Leuk Lymphoma (2018) 59:660–9. doi: 10.1080/10428194.2017.1357171
12. Meignan M, Cottereau AS. Interim PET in Lymphoma: From Deauville to Peking Criteria. On the road, again. Leuk Lymphoma (2018) 59:523–5. doi: 10.1080/10428194.2017.1368078
13. Barrington SF, Mikhaeel NG, Kostakoglu L, Meignan M, Hutchings M, Mueller SP, et al. Role of Imaging in the Staging and Response Assessment of Lymphoma: Consensus of the International Conference on Malignant Lymphomas Imaging Working Group. J Clin Oncol (2014) 32:3048–58. doi: 10.1200/JCO.2013.53.5229
14. Casasnovas RO, Meignan M, Berriolo-Riedinger A, Bardet S, Julian A, Thieblemont C, et al. SUVmax Reduction Improves Early Prognosis Value of Interim Positron Emission Tomography Scans in Diffuse Large B-Cell Lymphoma. Blood (2011) 118:37–43. doi: 10.1182/blood-2010-12-327767
15. Mamot C, Klingbiel D, Hitz F, Renner C, Pabst T, Driessen C, et al. Final Results of a Prospective Evaluation of the Predictive Value of Interim Positron Emission Tomography in Patients With Diffuse Large B-Cell Lymphoma Treated With R-CHOP-14 (SAKK 38/07). J Clin Oncol (2015) 33:2523–9. doi: 10.1200/jco.2014.58.9846
16. Dührsen U, Müller S, Hertenstein B, Thomssen H, Kotzerke J, Mesters R, et al. Positron Emission Tomography-Guided Therapy of Aggressive Non-Hodgkin Lymphomas (PETAL): A Multicenter, Randomized Phase III Trial. J Clin Oncol (2018) 36:2024–34. doi: 10.1200/jco.2017.76.8093
17. Itti E, Meignan M, Berriolo-Riedinger A, Biggi A, Cashen AF, Véra P, et al. An International Confirmatory Study of the Prognostic Value of Early PET/CT in Diffuse Large B-Cell Lymphoma: Comparison Between Deauville Criteria and Δsuvmax. Eur J Nucl Med Mol Imaging (2013) 40:1312–20. doi: 10.1007/s00259-013-2435-6
Keywords: metabolic tumor volume, Peking criteria, positron emission tomography, diffuse large B-cell lymphoma, risk assessment
Citation: Yuan T, Zhang Y, Chen X, Wei M, Zhu H, Song Y, Yang Z, Zhu J and Wang X (2022) Risk Assessment in Diffuse Large B-Cell Lymphoma by Combining Baseline Metabolic Tumor Volume and Peking Criteria When Evaluating Series 18F-Fluorodeoxyglucose Positron Emission Tomography Scans. Front. Oncol. 12:876581. doi: 10.3389/fonc.2022.876581
Received: 15 February 2022; Accepted: 28 March 2022;
Published: 21 April 2022.
Edited by:
Anna Sureda, Catalan Institute of Oncology, SpainReviewed by:
Monica Balzarotti, Humanitas Research Hospital, ItalyLucien A. Noens, Ghent University Hospital, Belgium
Copyright © 2022 Yuan, Zhang, Chen, Wei, Zhu, Song, Yang, Zhu and Wang. This is an open-access article distributed under the terms of the Creative Commons Attribution License (CC BY). The use, distribution or reproduction in other forums is permitted, provided the original author(s) and the copyright owner(s) are credited and that the original publication in this journal is cited, in accordance with accepted academic practice. No use, distribution or reproduction is permitted which does not comply with these terms.
*Correspondence: Xuejuan Wang, eHVlanVhbl93YW5nQGhvdG1haWwuY29t