 Mourad Assidi1,2*
- 1Center of Excellence in Genomic Medicine Research, King Abdulaziz University, Jeddah, Saudi Arabia
- 2Medical Laboratory Department, Faculty of Applied Medical Sciences, King Abdulaziz University, Jeddah, Saudi Arabia
Ovarian cancer (OC) is among the most lethal cancer among all gynaecological malignancies. Since most OC patients are diagnosed only at advanced stages mainly because of their imperceptible/nonspecific symptoms, survival rates are low. Therefore, more molecular biomarkers are needed to achieve more effective molecular stratification for better prognostic and theranostic outcomes. The cadherin family, particularly N-cadherin (N-CAD; also known as CDH2), is critical for cell-cell adhesion and epithelial- mesenchymal transition (EMT) of cancer. N-CAD protein has also been shown to be overexpressed in many advanced carcinomas. The aim of this study was to investigate the expression patterns of N-CAD protein, determine their correlations with the clinicopathological features of OC patients, and evaluate its prognostic value and involvement in EMT and metastasis. Protein expression of N-CAD was studied in 117 formalin-fixed and paraffin-embedded (FFPE) blocks from patients diagnosed with OC using Tissue Microarray and immunohistochemistry techniques. The N-CAD protein was overexpressed in 58% of our OC cohort. Furthermore, its cytoplasmic overexpression was significantly correlated with tumor grade (p= 0.05), tumor subtype (p= 0.05), tumor necrosis (p= 0.01), and age at menarche (p= 0.002). Interestingly, Kaplan-Meier analysis showed a significant correlation of disease-free survival (DFS) with OC patients with cytoplasmic N-CAD overexpression (p< 0.03, log rank). Patients with high N-CAD expression have approximately twice the recurrence rate at 5-year follow-up. The results of this study demonstrate a poor prognostic role of N-CAD overexpression in OC, which is reflected in higher recurrence and death rates of OC and its molecular contribution to EMT and distant metastasis. Therefore, OC patients with overexpressed N-CAD need to be monitored more frequently and closely. Further studies with larger patient cohorts are needed to validate these findings, demystify the role of N-CAD in OC pathophysiology, and further investigate its role as a potential therapeutic target.
Introduction
Ovarian cancer (OC) is the 7th most common cancer in women and the 3rd deadliest gynaecological cancer worldwide (1). In Saudi Arabia, OC affects more than 3% of Saudi women (2–4). This higher mortality rate of OC worldwide seems to be related to the fact that this malignant disease is asymptomatic, especially at early stages (5). In addition, most OC symptoms are nonspecific, misleading and may be confused with other gastrointestinal, urologic, or other diseases (6). Pelvic or abdominal pain and abdominal distension, increased urinary frequency, and some eating disorders such as early satiety are the common OC symptoms in the early stages, while women with advanced stages have a pelvic mass that extends beyond the adnexa (7). OC is classified according to the cellular origin of the malignancy, i.e., epithelial, stromal, or germinal cells. Of note, the vast majority (90%) of OC is of epithelial origin (8). Standard treatment options for OC depend on the type and stage of OC and include surgery along with platinum-based chemotherapy such as carboplatin and paclitaxel, either adjuvant, neoadjuvant, or sometimes both (9). Although 80% of patients diagnosed at an early stage respond to first-line chemotherapy, efficient early diagnosis of OC is still unattainable.
Since most OC patients are not diagnosed until the stage of metastasis, treatment options are not effective enough and are more diverted towards to alleviating symptoms rather than curing the disease. In fact, the 5-year survival rate for OC patients diagnosed with advanced stage disease is about 30% compared to 93% for early stage counterparts (10). Additionally, most OC patients relapse after completion of first-line treatment and require retreatment, mainly with chemotherapy (11). Despite, standard therapies are widely used in the treatment of OC, the prognosis and survival of OC are still poor. In addition, current management and treatment options are challenged by OC heterogeneity, in which a cluster of multiple cells with different genetic and epigenetic features occurs in the same ovarian malignant mass. Furthermore, individuals at the same stage of OC and treated with the same treatment plan have different outcomes. Taken together, these findings highlight the current challenges in optimizing/personalizing current therapeutic strategies for better outcomes (12, 13) and underscore the urgent need for additional effective biomarkers for earlier detection, better prognosis, and more accurate stratification of patients to achieve better individualized treatment options and survival outcomes.
Carbohydrate antigen 125 (CA125) is the first biomarker discovered for the detection of OC. Its level in serum is elevated in most epithelial OC (14). However, the sensitivity of CA125 in OC early stages remains too low, and its level correlates with other diseases such as endometriosis, pregnancy, ovarian cysts, and inflammatory peritoneal diseases. To improve the specificity of OC detection, other biomarkers such as Human Epididymis Protein 4 (HE4) have been developed. HE4 is more sensitive than CA125 and is found in approximately 100% of serous and endometroid subtypes, but its concentration can be influenced by many factors such as body mass index (BMI) (15), smoking (16), and lower HE4 concentration in patients using oral contraceptives (17). Although the combination of CA125 and HE4 has been shown to provide better diagnostic efficacy for risk prediction of OC (18), they are still not accurate and effective enough. More molecular biomarkers are needed to achieve better prognostic, therapeutic and prediction results. Cadherins are important transmembrane glycoproteins that are critical for cell-cell adhesion, especially in epithelial tissues. They were first described as single-pass transmembrane glycoproteins involved in cell–cell adhesion, and are now considered important players in cell polarity and tissue morphology (19). They are also thought to play a direct role in carcinogenesis and metastasis in many cancers (20, 21). In some cases of epithelial carcinoma, epithelial cells lose cell-cell adhesion and polarity and develop migratory and invasive behavior. This process, termed epithelial-mesenchymal transition (EMT), is critical for the development of metastases in cancer progression. A fundamental event in EMT is the “cadherin switch”, defined as loss of E-cadherin expression and increased expression of N-cadherin during cancer progression (22, 23). N-cadherin, also known as CDH2, is a cell-adhesion molecule mapped to 18q11.2 (24). It is a 135 KDa protein that belongs to the family of transmembrane molecules and mediates calcium- dependent intercellular adhesion. It consists of five extracellular cadherin repeats. The cytoplasmic domain of N-cadherin is anchored to the intercellular actin cytoskeleton by interaction with the β-, α-, and γ-catenin complex. CDH2 is expressed in various tissues, including the nervous system, brain, cardiac and skeletal muscles, blood vessels, and hematopoietic function (25, 26). N-cadherin is mainly expressed in the nervous system and promotes intercellular adhesion of neuronal cells, while its expression is low in normal tissues (25–29). However, it has been reported that overexpressed N-cadherin is associated with cell migration, angiogenesis, aggressiveness, and metastasis in many cancers such as breast, lung, bladder, prostate, and hepatocellular carcinomas (25–29). Moreover, the level of soluble N-cadherin in the serum of cancer patients is much higher than that in healthy individuals. As a result, N-cadherin has been suggested as a potential therapeutic target for tumour invasion and metastasis (30). In OC, the role of N-cadherin expression is unclear and there are few studies that have investigated N-cadherin expression in OC (31), especially in the Arabian peninsula. With this background, this study aimed to evaluate N-CAD protein expression patterns as a potential pro-metastatic molecular biomarker that could help improve OC prognosis and management. The associations between N-CAD protein expression patterns with patients’ clinicopathological parameters and its prognostic value in OC were investigated.
Patients and Methods
Patients
Formalin-fixed, paraffin-embedded (FFPE) tissues from patients diagnosed with OC and treated mainly at the departments of pathology and gynaecology at King Abdulaziz University Hospital (KAUH) between 1995 and 2014 were used for this study after obtaining informed consent. This retrospective study includes 117 primary OC patients classified based on histopathological features, mainly according to Tumor Node Metastasis (TNM) classification system. Patients’ medical records were used to collect all pathological and clinical data after IRB approval from KAUH (IRB number: KAUH-189-14).
Tissue Microarray and Automated Immunostaining
Our group had previously transferred the OC FFPE tissue samples into a tissue microarray (TMA) format. Haematoxylin and Eosin (H&E) from each block (donor block) were used to determine tumor regions. Subsequently, all H&E stained slides from all blocks were reviewed by a pathologist to select the tumour areas to be punched/cored. The details of TMA construction mapping, and validation have been described elsewhere (32, 33).
Immunohistochemistry (IHC) was performed on ovarian cancer TMA slides using an automated staining system (Benchmark XT, Ventana Medical System, Inc. Tucson, Arizona, USA), except for antibodies, which they were applied manually. Reagents were removed from the refrigerator to reach room temperature before starting the run. The slides were labelled with a barcode. The concentrated N-CAD rabbit polyclonal antibody (catalog # ab66025, Abcam, dilution: 1:20) was used. The detailed protocol of the IHC procedure was performed as described elsewhere (32, 34). Briefly, the automated Ventana began the run by deparaffinizing the paraffin-embedded tissue sections with EZ Prep™. They were then pre-treated with Cell Conditioning buffer (CC1) to induce/activate the epitopes of the antigens (antigen retrieval). Then, 50μl of the optimized antibody was applied manually for 30 minutes at room temperature. This was followed by washing steps using the UltraView Universal DAB Detection Kit (Lot. No. E00534) which, contains: Copper, 1.1% hydrogen peroxide solutions, DAB substrate, SA-HRP contains a conjugated streptavidin horseradish peroxidase solution and inhibitor. For counterstaining, staining was completed with hematoxylin II for 8 min. and post-counterstaining by bluing reagent for 4 min.
After completion of the run, the slides were removed from the instrument and rinsed with a mild detergent followed by tap water to remove LCS and buffer residue. Then the slides were immersed in different concentrations of alcohol buffer (70, 95 and 100%) and then cleaned in xylene, for 3 minutes, twice for each solution. Finally, a drop of mounting medium was added to the slide and covered with a glass coverslip. The stained slides were manually scored to check the expression of the biomarkers under the light microscope using the staining patterns.
Scoring and Evaluation of Biomarkers Expression
Evaluation of protein expression of all OC was assessed using a regular Nikon light microscope at ×40 magnification blind to the clinicopathological parameters of the patients. The staining was classified into four groups: 1) negative 2) weak 3) moderate and 4) high expression. The intensity of staining and the percentage of positively stained cells were used to calculate the staining index score according to the following formula
Where (I) is the staining index score and (f0 to f3) are the proportions of cells that have a given staining intensity (from 0 to +3) (33, 35). This I score is useful for the selection of the best IHC expression cut-off/discriminator during statistical analysis.
Statistical Analysis
Statistical analyses were performed using the SPSS® software package (version 22). The frequency tables were analyzed using the chi-square test to assess the significance of the correlation between the categorical variables (age, stage, grade, BMI, lymph node status, recurrence, …).
Univariate survival analysis was performed using the Kaplan-Meier method. Tests with p < 0.05 were considered statistically significant.
Results
Expression Pattern of N-Cadherin Protein Profiles in Ovarian Cancer
Expression of N-cadherin protein was observed in both membrane and cytoplasm, but mainly in cytoplasm. The frequencies of expression patterns of cytoplasmic N-cadherin protein receptors in 117 OC samples evaluated by the IHC technique were: no expression (0, 3%), weak expression (+1, 39%), moderate expression (+2, 44%) and strong expression patterns (+3, 14%), respectively (Figure 1).
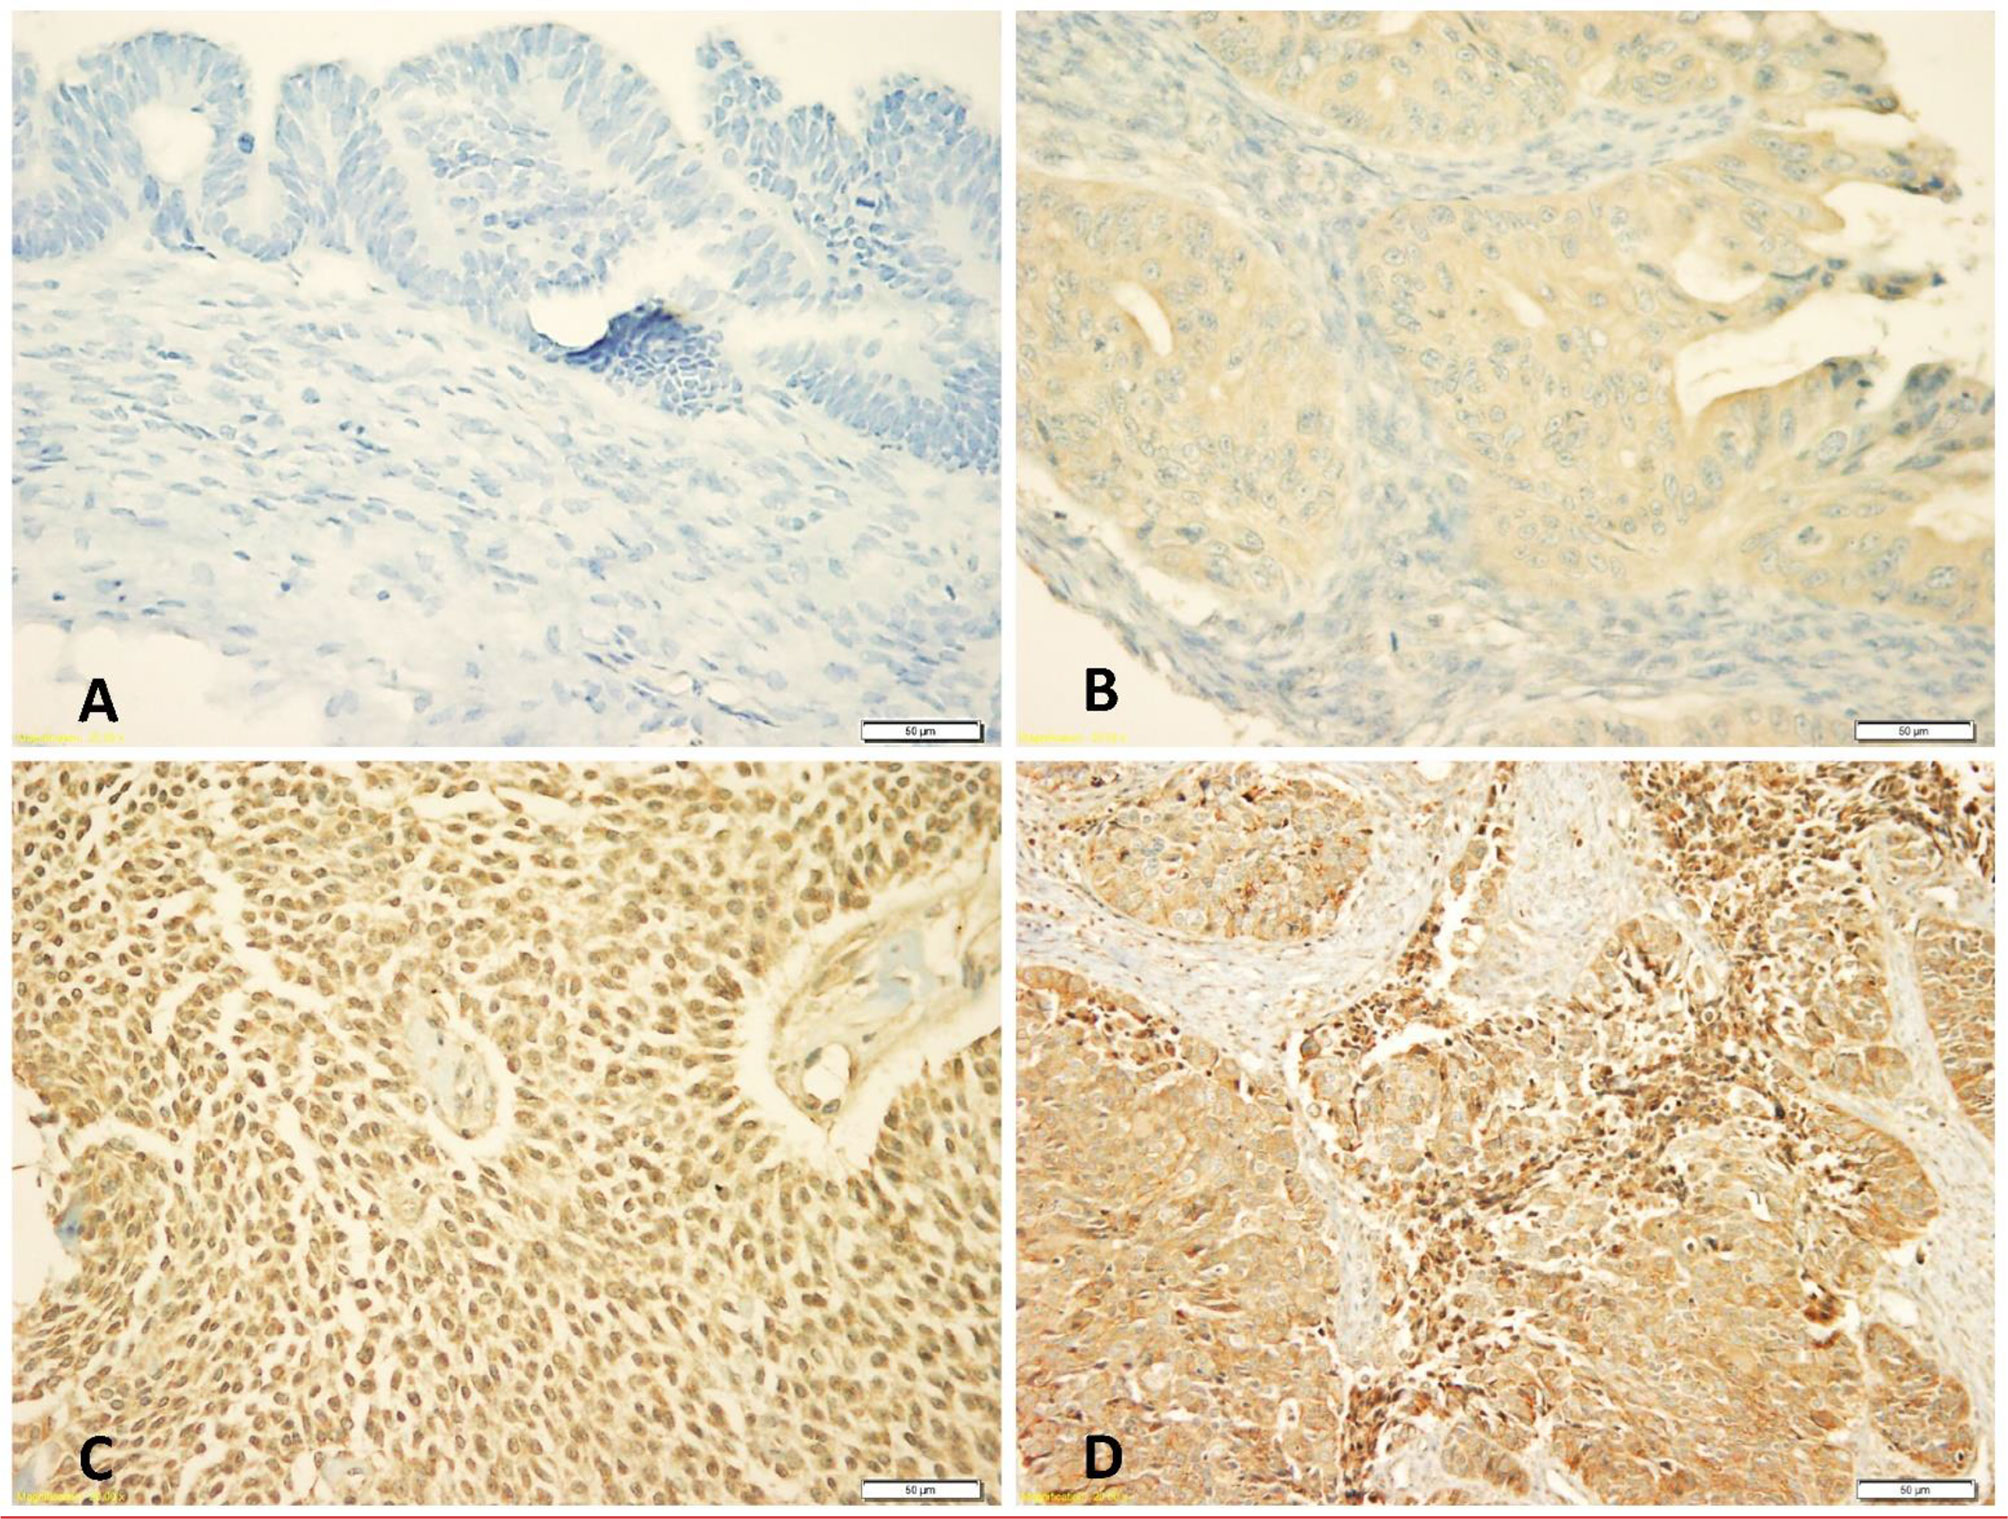
Figure 1 Immunohistochemical staining patterns of cytoplasmic N-cadherin protein expression at 40x magnification: (A) Negative cytoplasmic expression, (B) Weak cytoplasmic expression, (C) Moderate cytoplasmic expression, (D) Strong cytoplasmic expression.
Correlation Of Cytoplasmic N-Cadherin Protein Expression With Clinicopathological Features
Our data showed that cytoplasmic N-cadherin expression was not associated with age, lymph node involvement, and tumor stage. However, significant correlations were found with tumor grade, tumor subtype, tumor necrosis, and age at menarche. In poorly differentiated tumors, expression of N-Cad was low compared to well/intermediately differentiated tumors (p= 0.05). Among histological subtypes, serous tumors showed low N-CAD expression compared to mucinous/other subtypes that showed high expression of N-CAD profile (p= 0.05). On the other hand, OC tissues with tumor necrosis showed high N-cad expression compared to their counterparts (p= 0.01). Interestingly, OC patients with early onset of menarche had tumors with high N-cad expression (p= 0.002) (Table 1).
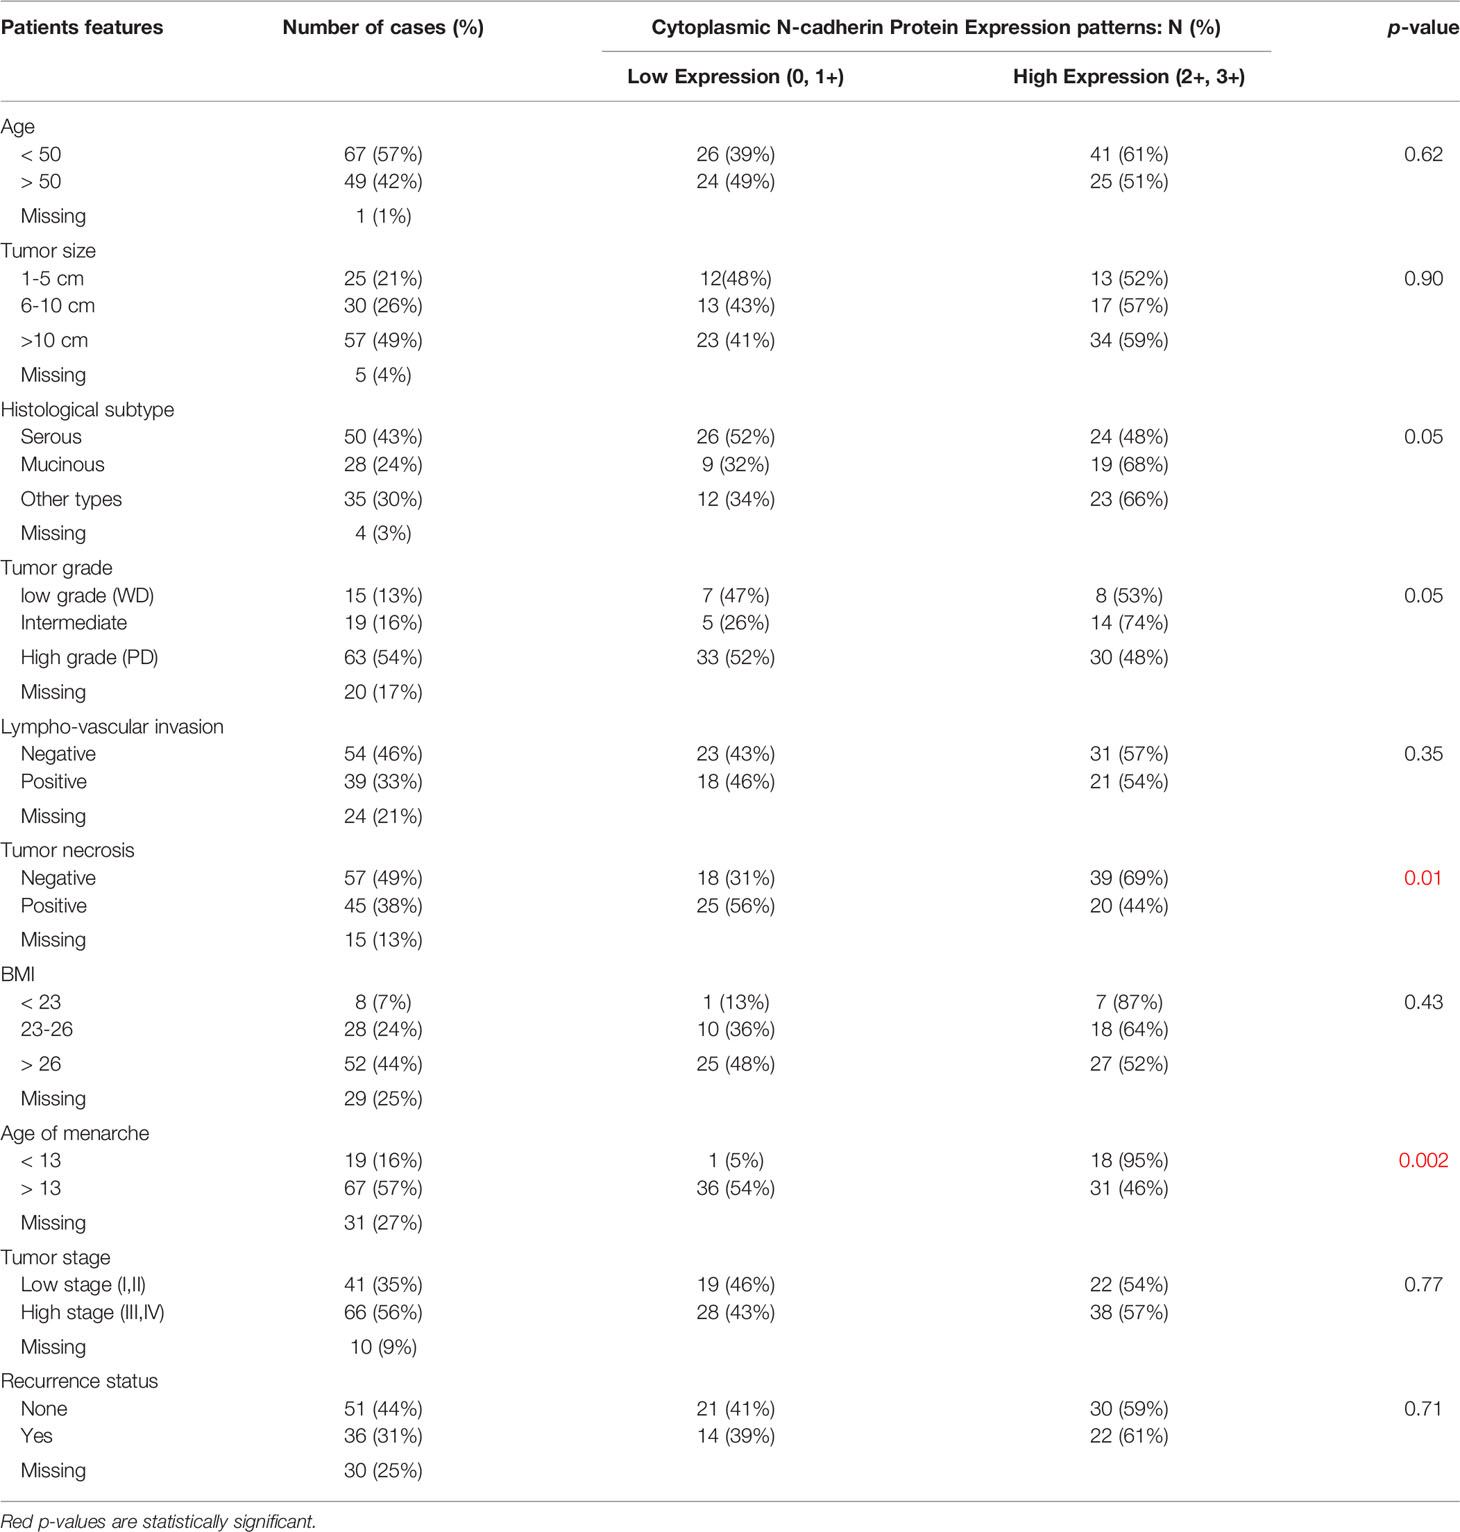
Table 1 Correlation between cytoplasmic N-cadherin protein expression patterns and clinicopathological features of OC.
Correlation Of Cytoplasmic N-Cadherin Protein Expression With Survival Outcome
Throughout the follow-up period, univariate survival analyses with a cut-off point for N-cad expression (low (0, 1+) vs. high expression (2+,3+)) as a discriminator showed the best prognosis. Thus, at 5 years, disease recurrence occurred in 42% of patients whose OC tissues had low N-cad expression compared with approximately 78% of patients whose OC tissues had high N-cad protein expression (p < 0.03, log rank, Figure 2). On the other hand, the same trend was observed with less significance in patients who died from the disease. Using the same cut-off point described above, approximately 22% of patients whose OC tissues had low N-cad expression died compared to approximately 60% of patients who had high N-CAD expression in their OC tissues (p=0.1, log rank, Figure 3). The Kaplan-Meier survival curves clearly show that shorter survival was associated with high N-cad protein expression, while patients with low N-cad expression had a lower recurrence rate and thus longer survival.
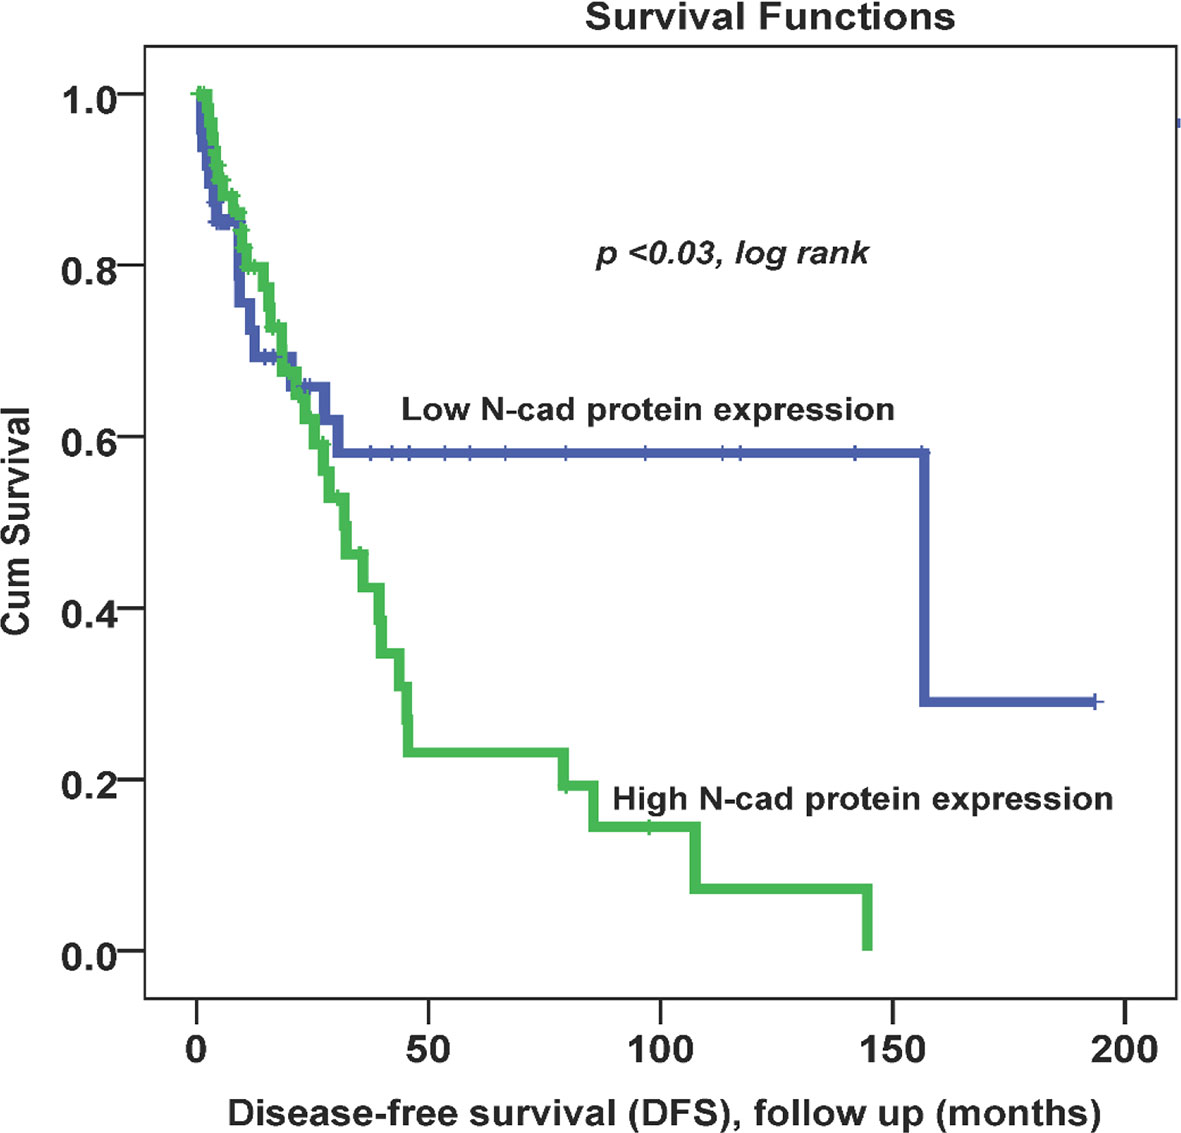
Figure 2 Cytoplasmic N-cadherin expression patterns in OC cohort using the cut-off (low (0, 1+) vs. high (2+, 3+)) as a determinant of disease-free survival (DFS) in univariate (Kaplan-Meier) analysis (p < 0.03, log-rank).
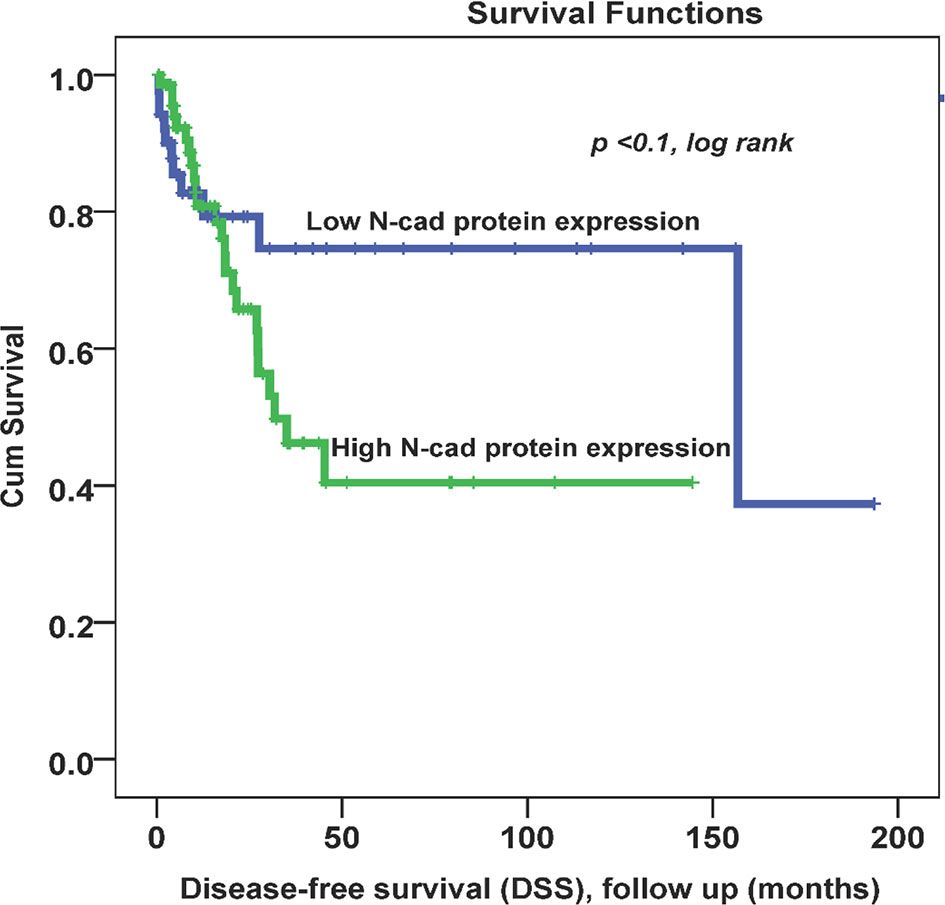
Figure 3 Cytoplasmic N-cadherin expression patterns in OC cohort using the cut-off (low (0, 1+) vs. high (2+, 3+)) as a determinant of disease -specific survival (DSS) in univariate (Kaplan-Meier) analysis (p < 0.1, log-rank).
Discussions
In 2021, more than 21,000 new cases were diagnosed with OC worldwide, and about 13,770 patients have died from this deadly disease (36). Several factors are believed to contribute to this increasing incidence and higher mortality rates. Apart from the difficulty of detecting the disease at early stages, the OC treatment options are not very effective at advanced stages, mainly because of the heterogeneity and complexity of this malignant disease. The higher complexity of OC is the result of various intertwined genetic and epigenetic factors that lead to aberrant gene expression and inconsistent treatment outcomes (37). In conjunction with clinicopathological factors such as age, grade, stage, and lymph node invasion, OMICs tools have provided an unprecedented understanding of the molecular complexity and disease progression of the diseases. In particular for OC, many genes have been reported as mutated, including BRCA1, BRCA2, BRIP1, RAD51C, RAD51D, MSH2, MLH1, PMS2, and MSH6. These and other candidate genes have been associated with a higher risk of OC (38, 39). Despite numerous efforts to identify reliable OC biomarkers, early detection strategies still rely mainly on CA125 and HE4, which have not been shown to be specific and sensitive enough (40, 41). Therefore, additional efforts are needed to develop new theranostic tools that can alleviate the suffering of OC patients and improve the treatment of the disease. Currently, the focus is on identifying more effective and clinically useful prognostic markers at the genomic and proteomic levels to detect OC at an early, curable stage and potentially support therapeutic decision making. In this regard, N-CAD has been reported to be expressed in several cancer types and has been associated with several clinicopathological parameters as well as survival outcomes. However, the clinical and prognostic significance of N-CAD in OC has not been well studied, especially in the Arabic Peninsula. Therefore, we conducted this study to investigate the N-CAD expression patterns and evaluate its prognostic value in our cohort of OC patients.
Our study showed that the protein N-CAD was expressed mainly in the cytoplasm of 58% of our patients’ tumor cells, with a recorded expression also in the cell membrane. Similarly, Quattrocchi et al. reported that 99% (158 cases) of their OC cohort expressed N-CAD protein in the cytoplasm (42). However, other studies reported membranous N-CAD expression in 32% of their cohort (43). These discrepancies could be due to cohort size, ethnicity, proportion of histological subtypes, and the complicated molecular heterogeneity of OC within each subtype (44).
The results of this study showed also that the expression of N-CAD protein was significantly associated with some clinicopathological characteristics including histological subtype, grade, tumor necrosis and age of menarche (p< 0.05) (Table 1). These findings are consistent with many studies that reported significant correlations of N-CAD expression in OC with histologic subtypes (45, 46) and grade (45). On the other hand, they found a significant association between N-CAD protein expression and tumor stage, which is not confirmed by our results. Furthermore, and in agreement with our results, other studies on OC reported no significant correlation between the expression of N-CAD and other clinicopathological parameters such as tumor stage, patient’s age, BMI, and tumor size (43, 47). Our results showed that 57% of our patients’ cohort were below 50 years (Table 1). There is a noticeable early onset of OC in the Saudi population compared to the United Kingdom for example where, according to Cancer Research UK, 53% of OC cases were diagnosed at 65 and over. Possible reasons associated to genomic, environmental and lifestyle factors deserve to be investigated to explain this early onset phenomenon.
In Kaplan-Meier survival analysis, N-CAD protein expression was significantly associated with DFS (p=0.03). In fact, patients with higher N-CAD expression have approximately twice the recurrence rate at 5-year follow-up time (42% vs. 78% recurrence at 60 months; p < 0.03, log rank, Figure 2). A similar trend was also observed with lower significance for DSS, in which patients with higher N-CAD expression who died more rapidly from the disease compared with their counterparts with low N-CAD expression (Figure 3). In general, the Kaplan-Meier survival curves clearly show that shorter survival and higher recurrence rates were associated with overexpression of the N-CAD protein. These results are consistent with those of Quattrocchi et al., who reported that all patients in their cohort with N-CAD overexpression relapsed by the first year of follow-up time. In the same study, patients with higher E-CAD expression survived shorter than their counterparts with lower N-CAD expression (42). Two important meta-analysis studies using all published data and freely available sources about N-Cadherin showed similar survival outcomes as our results. In fact, they confirmed that N-CAD overexpression is a negative prognosticator of OC (48, 49). When we assessed the freely available KM plotter analysis of TCGA database (https://kmplot.com/analysis/), it appears that this platform did not cover the N-Cadherin protein expression (CDH2) in OC. However, the mRNA data showed that CDH2 gene expression is a good prognosticator of OC (50) (http://kmplot.com/analysis/index.php?p=service). For the protein Atlas database (https://www.proteinatlas.org), the CDH2 protein was not a significant prognosticator in OC possibly due to the heterogeneity of the cohort (51) (https://www.proteinatlas.org/ENSG00000170558-CDH2/pathology).
The survival data indicated that poor disease progression associated with high N-CAD protein expression appears to be either a marker of OC aggressiveness or actively involved in the pathophysiology of disease progression, recurrence, and metastasis. Similar studies in other cancers (breast, lung, bladder, prostate, …) confirmed that overexpression of N-CAD protein was associated with poor treatment outcomes, cell migration, angiogenesis, disease aggressiveness, and metastasis (25–29). Thus, overexpression of N-cadherin in colorectal cancer was significantly associated with poor disease-specific survival and disease-free survival, as well as with many clinicopathological characteristics such as tumor size, lymph node, stage, and grade (52). Similarly, high expression of N-cadherin in bladder cancer was shown to be associated with grade, tumor stage, and poorer recurrence- free survival (53).
Taken together, these results seem to be related to the role of N-CAD in the mesenchymal phenotype, which promotes cell mobility and invasion (31, 54). In fact, several reports have shown that when epithelial tumor cells switch from expressing E-CAD to expressing N-CAD (cadherin switch phenomenon), they acquire the ability to activate Fibroblast Growth Factor Receptor (FGFR) pathways. Our results together with our previous study about E-Cad expression in the same cohort confirmed the cadherin switch (32). In fact, while the E-CAD expression was decreasing at the advanced stages (starting from the EMT and marked by cancer invasion and migration), the N-CAD expression was increasing; and both markers were prognosticators of poor survival outcomes (32). In fact, once N-CAD is overexpressed, it has been shown to affect tumor cell polarity and behavior through its direct interaction with the FGFR, which regulates cancer cell motility and invasion (55, 56). Also, N-CAD was reported to interact with other receptors on tumor cells to promote motility and migration such as Platelet Derived Growth Factor Receptor (PDGFR). This mechanism occurs when the NHERF protein binds the N-CAD with the ß-catenin to the PDGFR to form a complex that drives tumor cells to migrate and motility (56) (Figure 4). These molecular mechanisms of N- CAD protein overexpression, summarized in Figure 4, played a key role in the phenotypic changes of tumor cells that were actively involved in migration to distant metastases. This pro-metastatic role of N-CAD was also confirmed in vitro with epithelial cells engineered to overexpress N-CAD. These cells have been shown to alter their morphology and behavior, adopting a motile phenotype similar to that observed in cells undergoing EMT (57, 58). This pro-metastatic phenotype depends also on the expression of other interacting proteins in addition to N- CAD, as mentioned previously and summarized in Figure 4 (58, 59).
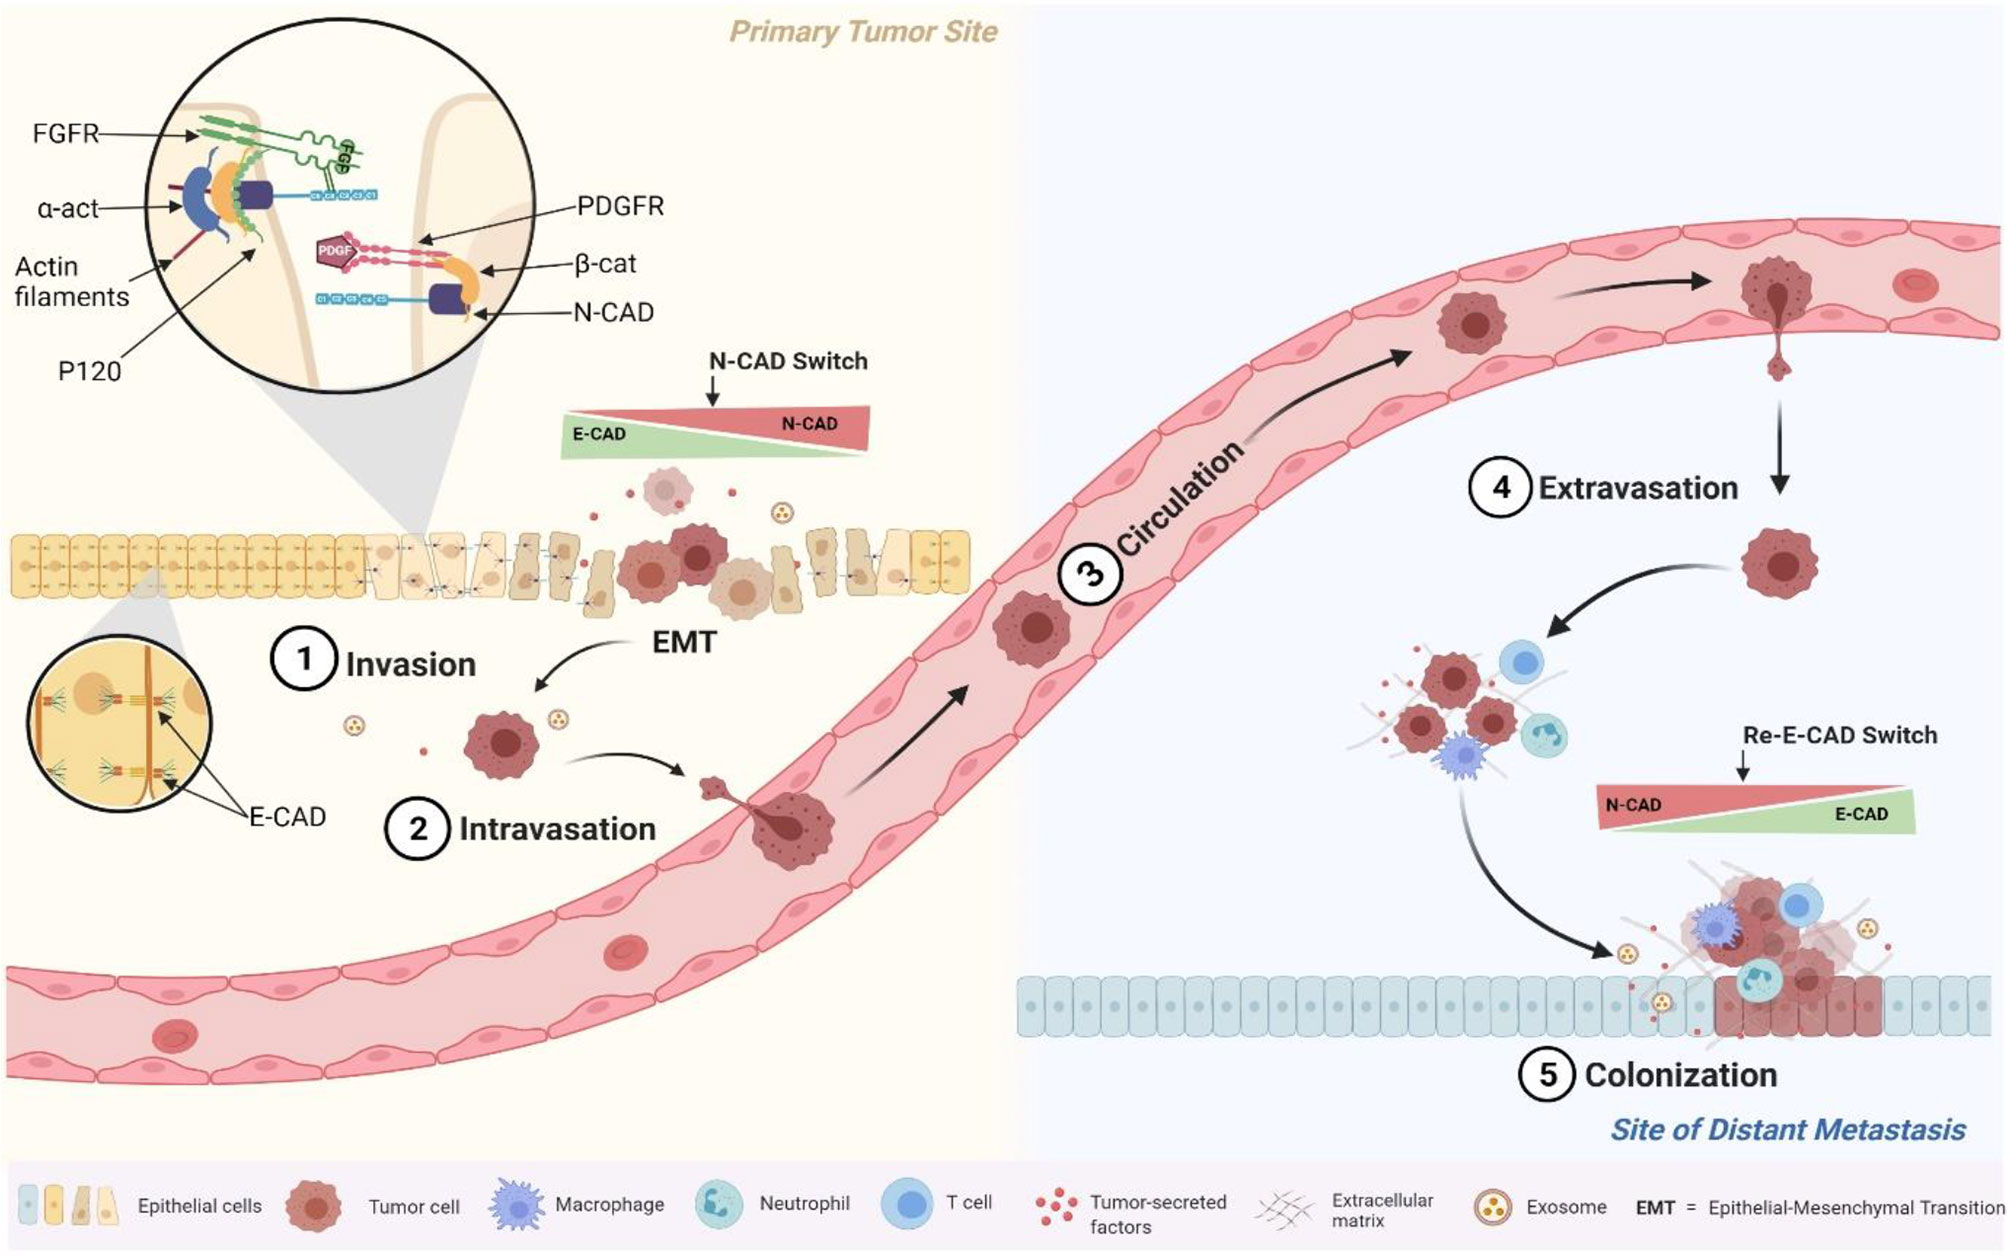
Figure 4 Schematic illustration of the molecular and cellular events triggered by the N-cadherin switch at EMT. Overexpressed N-cadherin binds and stabilizes FGFR on the cell surface to initiate cell signalling cascades, and to PDGFR to increase cell motility through interactions with ß-catenin.
This study demonstrated a prognostic role of N-CAD in OC, the first to be reported in the Arabic Peninsula. OC patients overexpressing the N-CAD protein had a poor prognosis, as evidenced by higher rates of both OC recurrence and death, as well as its molecular contribution in EMT and distant metastasis; and thus required more frequent and closer follow-up. Further studies with larger patient cohorts are needed to validate these findings, investigate further the role of N-CAD in OC pathophysiology, and explore its role as a potential therapeutic target.
Data Availability Statement
The original contributions presented in the study are included in the article/supplementary material. Further inquiries can be directed to the corresponding author.
Ethics Statement
The study was approved by the Institutional Ethical Review Board of King Abdulaziz University Hospital, Jeddah, Saudi Arabia (Ref. number: KAUH-189-14). The patients/participants provided their written informed consent to participate in this study.
Author Contributions
The author confirms being the sole contributor of this work and has approved it for publication.
Funding
This work was funded by the Deanship of Scientific Research (DSR), King Abdulaziz University, Jeddah, under grant No. (D-545-117-1443). The author, therefore, gratefully acknowledges the DSR technical and financial support.
Conflict of Interest
The author declares that the research was conducted in the absence of any commercial or financial relationships that could be construed as a potential conflict of interest.
Publisher’s Note
All claims expressed in this article are solely those of the authors and do not necessarily represent those of their affiliated organizations, or those of the publisher, the editors and the reviewers. Any product that may be evaluated in this article, or claim that may be made by its manufacturer, is not guaranteed or endorsed by the publisher.
Acknowledgments
The author is grateful to Prof. Abdelbaset Buhmeida, MD., PhD. for validating the IHC scoring, and for F. Yahya and Dr. P. N. Pushparaj for exporting Figure 4 using Biorender.com.
References
1. Momenimovahed Z, Tiznobaik A, Taheri S, Salehiniya H. Ovarian Cancer in the World: Epidemiology and Risk Factors. Int J women Health (2019) 11:287–99. doi: 10.2147/IJWH.S197604
2. Ferlay J, Ervik M, Lam F, Colombet M, Mery L, Piñeros M, et al. Saudi Arabia Fact Sheets. Lyon, France: International Agency for Research on Cancer (IARC). (2018).
3. Al-Zahrani AS, Al-Mutlaq HM, Radwi AN, Bazarbashi SM. Cancer Incidence Report Saudi Arabia 2013 Riyadh, Saudi Arabia: National Health Information Center. (2016).
4. Althubiti MA, Nour Eldein MM. Trends in the Incidence and Mortality of Cancer in Saudi Arabia. Saudi Med J (2018) 39(12):1259–62. doi: 10.15537/smj.2018.12.23348
5. Shabir S, Gill PK. Global Scenario on Ovarian Cancer – Its Dynamics, Relative Survival, Treatment, and Epidemiology. Adesh Univ J Med Sci Res (2020) 2:17–25. doi: 10.25259/aujmsr_16_2019
6. Olson SH, Mignone L, Nakraseive C, Caputo TA, Barakat RR, Harlap S. Symptoms of Ovarian Cancer. Obstet Gynecol (2001) 98(2):212–7. doi: 10.1016/s0029-7844(01)014570
7. Goff B. Symptoms Associated With Ovarian Cancer. Clin Obstet Gynecol (2012) 55(1):36–42. doi: 10.1097/GRF.0b013e3182480523
8. Holschneider CH, Berek JS. Ovarian Cancer: Epidemiology, Biology, and Prognostic Factors. Semin Surg Oncol (2000) 19(1):3–10. doi: 10.1002/1098-2388(200007/08)19:1<3
9. Colombo N, Sessa C, du Bois A, Ledermann J, McCluggage WG, McNeish I, et al. Esmo-Esgo Consensus Conference Recommendations on Ovarian Cancer: Pathology and Molecular Biology, Early and Advanced Stages, Borderline Tumours and Recurrent Disease†. Ann Oncol (2019) 30(5):672–705. doi: 10.1093/annonc/mdz062
10. Siegel RL, Miller KD, Jemal A. Cancer Statistics, 2020. CA Cancer J Clin (2020) 70(1):7–30. doi: 10.3322/caac.21590
11. Pujade-Lauraine E, Wagner U, Aavall-Lundqvist E, Gebski V, Heywood M, Vasey PA, et al. Pegylated Liposomal Doxorubicin and Carboplatin Compared With Paclitaxel and Carboplatin for Patients With Platinum-Sensitive Ovarian Cancer in Late Relapse. J Clin Oncol (2010) 28(20):3323–9. doi: 10.1200/jco.2009.25.7519
12. Minlikeeva AN, Freudenheim JL, Cannioto RA, Eng KH, Szender JB, Mayor P, et al. History of Thyroid Disease and Survival of Ovarian Cancer Patients: Results From the Ovarian Cancer Association Consortium, a Brief Report. Br J Cancer (2017) 117(7):1063–9. doi: 10.1038/bjc.2017.267
13. Testa U, Petrucci E, Pasquini L, Castelli G, Pelosi E. Ovarian Cancers: Genetic Abnormalities, Tumor Heterogeneity and Progression, Clonal Evolution and Cancer Stem Cells. Medicines (2018) 5(1):16. doi: 10.3390/medicines5010016
14. Cannistra SA. Cancer of the Ovary. N Engl J Med (2004) 351(24):2519–29. doi: 10.1056/NEJMra041842
15. Bolstad N, Øijordsbakken M, Nustad K, Bjerner J. Human Epididymis Protein 4 Reference Limits and Natural Variation in a Nordic Reference Population. Tumour Biol (2012) 33(1):141–8. doi: 10.1007/s13277-011-0256-4
16. Fortner RT, Vitonis AF, Schock H, Hüsing A, Johnson T, Fichorova RN, et al. Correlates of Circulating Ovarian Cancer Early Detection Markers and Their Contribution to Discrimination of Early Detection Models: Results From the Epic Cohort. J Ovarian Res (2017) 10(1):20–. doi: 10.1186/s13048-017-0315-6
17. Ferraro S, Schiumarini D, Panteghini M. Human Epididymis Protein 4: Factors of Variation. Clinic Chim Acta (2015) 438:171–7. doi: 10.1016/j.cca.2014.08.020
18. Dochez V, Caillon H, Vaucel E, Dimet J, Winer N, Ducarme G. Biomarkers and Algorithms for Diagnosis of Ovarian Cancer: Ca125, He4, Rmi and Roma, a Review. J Ovarian Res (2019) 12(1):28. doi: 10.1186/s13048-019-0503-7
19. Hajra KM, Fearon ER. Cadherin and Catenin Alterations in Human Cancer. Gene Chromosomes Cancer (2002) 34(3):255–68. doi: 10.1002/gcc.10083
20. Colás-Algora N, Millán J. How Many Cadherins Do Human Endothelial Cells Express? Cell Mol Life Sci (2019) 76(7):1299–317. doi: 10.1007/s00018-018-2991-9
21. Oda H, Takeichi M. Evolution: Structural and Functional Diversity of Cadherin at the Adherens Junction. J Cell Biol (2011) 193(7):1137–46. doi: 10.1083/jcb.201008173
22. Kalluri R, Weinberg RA. The Basics of Epithelial-Mesenchymal Transition. J Clin Invest (2009) 119(6):1420–8. doi: 10.1172/jci39104
23. Hazan RB, Qiao R, Keren R, Badano I, Suyama K. Cadherin Switch in Tumor Progression. Ann N Y Acad Sci (2004) 1014:155–63. doi: 10.1196/annals.1294.016
24. Velázquez-Fernández D, Laurell C, Geli J, Höög A, Odeberg J, Kjellman M, et al. Expression Profiling of Adrenocortical Neoplasms Suggests a Molecular Signature of Malignancy. Surgery (2005) 138(6):1087–94. doi: 10.1016/j.surg.2005.09.031
25. Drivalos A, Chrisofos M, Efstathiou E, Kapranou A, Kollaitis G, Koutlis G, et al. Expression of A5-Integrin, A7-Integrin, E-Cadherin, and N-Cadherin in Localized Prostate Cancer. Urology Oncol (2016) 34(4):165. doi: 10.1016/j.urolonc.2015.10.016
26. Saadatmand S, de Kruijf EM, Sajet A, Dekker-Ensink NG, van Nes JGH, Putter H, et al. Expression of Cell Adhesion Molecules and Prognosis in Breast Cancer. Br J Surg (2012) 100(2):252–60. doi: 10.1002/bjs.8980
27. Seo DD, Lee HC, Kim HJ, Min HJ, Kim KM, Lim YS, et al. Neural Cadherin Overexpression Is a Predictive Marker for Early Postoperative Recurrence in Hepatocellular Carcinoma Patients. J Gastroenterol Hepatol (2008) 23(7Pt1):1112–8. doi: 10.1111/j.1440-1746.2007.05182.x
28. Muramaki M, Miyake H, Terakawa T, Kusuda Y, Fujisawa M. Expression Profile of E-Cadherin and N-Cadherin in Urothelial Carcinoma of the Upper Urinary Tract Is Associated With Disease Recurrence in Patients Undergoing Nephroureterectomy. Urology (2011) 78(6):1443.e7–.e12. doi: 10.1016/j.urology.2011.07.1388
29. Hui L, Zhang S, Dong X, Tian D, Cui Z, Qiu X. Prognostic Significance of Twist and N-Cadherin Expression in Nsclc. PloS One (2013) 8(4):e62171. doi: 10.1371/journal.pone.0062171
30. Cao Z-Q, Wang Z, Leng P. Aberrant N-Cadherin Expression in Cancer. Biomed Pharmacoth (2019) 118:109320. doi: 10.1016/j.biopha.2019.109320
31. Hudson LG, Zeineldin R, Stack MS. Phenotypic Plasticity of Neoplastic Ovarian Epithelium: Unique Cadherin Profiles in Tumor Progression. Clin Exp Meta (2008) 25(6):643–55. doi: 10.1007/s10585-008-9171-5
32. Assidi M, Jafri MA, Abu-Elmagd M, NP P, Saddick S, Messaoudi S, et al. Prognostic Value of E-Cadherin and Its Tumor Suppressor Role in Saudi Women With Advanced Epithelial Ovarian Cancer. Libya J Med (2021) 16(1):1994741. doi: 10.1080/19932820.2021.1994741
33. Assidi M, Yahya FM, Al-Zahrani MH, Elkhatib R, Zari A, Elaimi A, et al. Leptin Protein Expression and Promoter Methylation in Ovarian Cancer: A Strong Prognostic Value With Theranostic Promises. Int J Mol Sci (2021) 22(23):12872. doi: 10.3390/ijms222312872
34. Assidi M, Gomaa W, Jafri M, Hanbazazh M, Al-Ahwal M, Pushparaj P, et al. Prognostic Value of Osteopontin (Spp1) in Colorectal Carcinoma Requires a Personalized Molecular Approach. Tumour Biol (2019) 41(9):1010428319863627. doi: 10.1177/1010428319863627
35. Buhmeida A, Dallol A, Merdad A, Al-Maghrabi J, Gari MA, Abu-Elmagd MM, et al. High Fibroblast Growth Factor 19 (Fgf19) Expression Predicts Worse Prognosis in Invasive Ductal Carcinoma of Breast. Tumour Biol (2014) 35(3):2817–24. doi: 10.1007/s13277-013-1374-y
36. Siegel RL, Miller KD, Fuchs HE, Jemal A. Cancer Statistics, 2021. CA: Cancer J Clin (2021) 71(1):7–33. doi: 10.3322/caac.21654
37. Bast RC Jr, Hennessy B, Mills GB. The Biology of Ovarian Cancer: New Opportunities for Translation. Nat Rev (2009) 9(6):415–28. doi: 10.1038/nrc2644
38. Suszynska M, Ratajska M, Kozlowski P. Brip1, Rad51c, and Rad51d Mutations Are Associated With High Susceptibility to Ovarian Cancer: Mutation Prevalence and Precise Risk Estimates Based on a Pooled Analysis of ~30,000 Cases. J Ovarian Res (2020) 13(1):50. doi: 10.1186/s13048-020-00654-3
39. Norquist BM, Harrell MI, Brady MF, Walsh T, Lee MK, Gulsuner S, et al. Inherited Mutations in Women With Ovarian Carcinoma. JAMA Oncol (2016) 2(4):482–90. doi: 10.1001/jamaoncol.2015.5495
40. Yurkovetsky ZR, Linkov FY, Malehorn DE, Lokshin AE. Multiple Biomarker Panels for Early Detection of Ovarian Cancer. Future Oncol (2006) 2(6):733–41. doi: 10.2217/14796694.2.6.733
41. Bandiera E, Zanotti L, Fabricio AS, Bucca E, Squarcina E, Romani C, et al. Cancer Antigen 125, Human Epididymis 4, Kallikrein 6, Osteopontin and Soluble Mesothelin-Related Peptide Immunocomplexed With Immunoglobulin M in Epithelial Ovarian Cancer Diagnosis. Clin Chem Lab Med (2013) 51(9):1815–24. doi: 10.1515/cclm-2013-0151
42. Quattrocchi L, Green AR, Martin S, Durrant L, Deen S. The Cadherin Switch in Ovarian High-Grade Serous Carcinoma Is Associated With Disease Progression. Virchow Arch (2011) 459(1):21–9. doi: 10.1007/s00428-011-1082-1
43. Dochiţ CM, Stepan AE, Mărgăritescu C, Florescu MM, Simionescu CE. Immunoexpression of E-, P-And N-Cadherins in Ovarian Serous Malignant Tumors. Roman J Morpholog Embryolog (2019) 60(4):1215–9.
44. Peralta Soler A, Knudsen KA, Tecson-Miguel A, McBrearty FX, Han AC, Salazar H. Expression of E-Cadherin and N-Cadherin in Surface Epithelial-Stromal Tumors of the Ovary Distinguishes Mucinous From Serous and Endometrioid Tumors. Hum Pathol (1997) 28(6):734–9. doi: 10.1016/s0046-8177(97)90184-2
45. Marques FR, Fonsechi-Carvasan GA, De Angelo Andrade LAL, Böttcher-Luiz F. Immunohistochemical Patterns for A and B-Catenin, E- and N-Cadherin Expression in Ovarian Epithelial Tumors. Gynecol Oncol (2004) 94(1):16–24. doi: 10.1016/j.ygyno.2004.03.037
46. Patel IS, Madan P, Getsios S, Bertrand MA, MacCalman CD. Cadherin Switching in Ovarian Cancer Progression. Int J Cancer (2003) 106(2):172–7. doi: 10.1002/ijc.11086
47. Adham SA, Al Harrasi I, Al Haddabi I, Al Rashdi A, Al Sinawi S, Al Maniri A, et al. Immunohistological Insight Into the Correlation Between Neuropilin-1 and Epithelial-Mesenchymal Transition Markers in Epithelial Ovarian Cancer. J Histochem Cytochem (2014) 62(9):619–31. doi: 10.1369/0022155414538821
48. Luo Y, Yu T, Zhang Q, Fu Q, Hu Y, Xiang M, et al. Upregulated N-Cadherin Expression Is Associated With Poor Prognosis in Epithelial-Derived Solid Tumours: A Meta-Analysis. Eur J Clin Invest (2018) 48(4):e12903. doi: 10.1111/eci.12903
49. Mrozik KM, Blaschuk OW, Cheong CM, Zannettino ACW, Vandyke K. N-Cadherin in Cancer Metastasis, Its Emerging Role in Haematological Malignancies and Potential as a Therapeutic Target in Cancer. BMC Cancer (2018) 18(1):939. doi: 10.1186/s12885-018-4845-0
50. Gyorffy B, Lánczky A, Szállási Z. Implementing an Online Tool for Genome-Wide Validation of Survival-Associated Biomarkers in Ovarian-Cancer Using Microarray Data From 1287 Patients. Endoc-Relate Cancer (2012) 19(2):197–208. doi: 10.1530/erc-11-0329
51. Uhlén M, Fagerberg L, Hallström BM, Lindskog C, Oksvold P, Mardinoglu A, et al. Tissue-Based Map of the Human Proteome. Science (2015) 347(6220):1260419. doi: 10.1126/science.1260419
52. Yan X, Yan L, Liu S, Shan Z, Tian Y, Jin Z. N-Cadherin, a Novel Prognostic Biomarker, Drives Malignant Progression of Colorectal Cancer. Mol Med Rep (2015) 12(2):2999–3006. doi: 10.3892/mmr.2015.3687
53. Abufaraj M, Shariat SF, Haitel A, Moschini M, Foerster B, Chłosta P, et al. Prognostic Role of N-Cadherin Expression in Patients With Non–Muscle-Invasive Bladder Cancer. Urolog Oncol (2017) 35(5):264–71. doi: 10.1016/j.urolonc.2017.01.012
54. Hazan RB, Phillips GR, Qiao RF, Norton L, Aaronson SA. Exogenous Expression of N-Cadherin in Breast Cancer Cells Induces Cell Migration, Invasion, and Metastasis. J Cell Biol (2000) 148(4):779–90. doi: 10.1083/jcb.148.4.779
55. Wheelock MJ, Johnson KR. Cadherin-Mediated Cellular Signaling. Curr Opin Cell Biol (2003) 15(5):509–14. doi: 10.1016/S0955-0674(03)00101-7
56. Williams E-J, Williams G, Howell FV, Skaper SD, Walsh FS, Doherty P. Identification of an N-Cadherin Motif That Can Interact With the Fibroblast Growth Factor Receptor and Is Required for Axonal Growth. J Biol Chem (2001) 276(47):43879–86. doi: 10.1074/jbc.M105876200
57. Tran NL, Nagle RB, Cress AE, Heimark RL. N-Cadherin Expression in Human Prostate Carcinoma Cell Lines: An Epithelial-Mesenchymal Transformation Mediating Adhesion With Stromal Cells. Am J Pathol (1999) 155(3):787–98. doi: 10.1016/S0002-9440(10)65177-2
58. Dongre A, Weinberg RA. New Insights Into the Mechanisms of Epithelial-Mesenchymal Transition and Implications for Cancer. Nat Rev Mol Cell Biol (2019) 20(2):69–84. doi: 10.1038/s41580-018-0080-4
Keywords: N-Cadherin, ovarian cancer, immunohistochemistry, prognosis, EMT, tissue microarray, survival
Citation: Assidi M (2022) High N-Cadherin Protein Expression in Ovarian Cancer Predicts Poor Survival and Triggers Cell Invasion. Front. Oncol. 12:870820. doi: 10.3389/fonc.2022.870820
Received: 07 February 2022; Accepted: 04 April 2022;
Published: 28 April 2022.
Edited by:
Essa M. Saied, Humboldt University of Berlin, GermanyReviewed by:
Andrew Lindsay, University College Cork, IrelandEvangeli S. Lampri, University of Ioannina, Greece
Cristiana Simionescu, University of Medicine and Pharmacy of Craiova, Romania
Copyright © 2022 Assidi. This is an open-access article distributed under the terms of the Creative Commons Attribution License (CC BY). The use, distribution or reproduction in other forums is permitted, provided the original author(s) and the copyright owner(s) are credited and that the original publication in this journal is cited, in accordance with accepted academic practice. No use, distribution or reproduction is permitted which does not comply with these terms.
*Correspondence: Mourad Assidi, bW91cmFkLmFzc2lkaUBnbWFpbC5jb20=