- 1Stroke Center, The First Affiliated Hospital, Jinan University, Guangzhou, China
- 2The Biomedical Translational Research Institute, Faculty of Medical Science, Jinan University, Guangzhou, China
- 3College of Life Science and Technology, Jinan University, Guangzhou, China
- 4Department of Anesthesiology, The First Affiliated Hospital, Jinan University, Guangzhou, China
- 5Department of Gastroenterological Surgery and Clinical Oncology, Toho University Graduate School of Medicine, Tokyo, Japan
- 6Department of Biochemistry and Genetics, Graduate School of Medicine, Chiba University, Chiba, Japan
- 7Department of Neurology, Dongzhimen Hospital, Beijing University of Chinese Medicine, Beijing, China
- 8Department of Radiology, Medical Imaging Center, The First Affiliated Hospital, Jinan University, Guangzhou, China
Atherosclerosis (AS) and cancers are major global causes of mortality and morbidity. They also share common modifiable pathogenesis risk factors. As the same strategies used to predict AS could also detect certain cancers, we sought novel serum antibody biomarkers of cancers in atherosclerotic sera sampled by liquid biopsy. Using serological antigen identification by cDNA expression cloning (SEREX) and western blot, we screened and detected the antigens BRCA1-Associated ATM Activator 1 (BRAT1) and WD Repeat Domain 1 (WDR1) in the sera of patients with transient ischemic attacks (TIA). Amplified luminescence proximity homogeneous assay-linked immunosorbent assay (AlphaLISA) established the upregulation of serum BRAT1 antibody (BRAT1-Abs) and WDR1 antibody (WDR1-Abs) in patients with AS-related diseases compared with healthy subjects. ROC and Spearman’s correlation analyses showed that BRAT1-Abs and WDR1-Abs could detect AS-related diseases. Thus, serum BRAT1-Abs and WDR1-Abs are potential AS biomarkers. We used online databases and AlphaLISA detection to compare relative antigen and serum antibody expression and found high BRAT1 and BRAT1-Abs expression in patients with GI cancers. Significant increases (> 0.6) in the AUC for BRAT1-Ab vs. esophageal squamous cell carcinoma (ESCC), gastric cancer, and colorectal cancer suggested that BRAT1-Ab exhibited better predictive potential for GI cancers than WDR1-Ab. There was no significant difference in overall survival (OS) between BRAT1-Ab groups (P = 0.12). Nevertheless, a log-rank test disclosed that the highest serum BRAT1-Ab levels were associated with poor ESCC prognosis at 5–60 weeks post-surgery. We validated the foregoing conclusions by comparing serum BRAT1-Ab and WDR1-Ab levels based on the clinicopathological characteristics of the patients with ESCC. Multiple statistical approaches established a correlation between serum BRAT1-Ab levels and platelet counts. BRAT1-Ab upregulation may enable early detection of AS and GI cancers and facilitate the delay of disease progression. Thus, BRAT1-Ab is a potential antibody biomarker for the diagnosis of AS and GI cancers and strongly supports the routine clinical application of liquid biopsy in chronic disease detection and diagnosis.
Introduction
Atherosclerosis (AS) and cancers account for the majority of global morbidity and mortality (1). AS is a major cause of coronary artery diseases such as acute myocardial infarction (AMI) and ischemic cerebrovascular diseases such as transient ischemic attacks (TIA), cerebral infarction (CI), and peripheral vascular disease. Its major risk factors include tobacco smoking, obesity, diabetes mellitus (DM), hypertension, and hypercholesterolemia (2, 3). Gastrointestinal cancers [esophageal (EC), gastric (GC), liver (LC), colorectal (CRC), and pancreatic (PC)] account for 26% of all cancer incidences and 35% of all cancer-related deaths worldwide (4, 5). Therefore, biomarkers that accurately predict AS-related diseases and GI cancers, provide early diagnosis, improve prophylactic and therapeutic strategies, and reduce disease burdens are urgently needed (6).
Several studies have suggested that AS may be correlated with GI cancers. AS might affect GI cancer progression and vice-versa. They share several common risk factors including tobacco smoking, obesity, and DM (7). Certain common molecular pathways, metabolic disorders, hereditary alterations, and lifestyle practices are also correlated with AS and cancer development (6). Some anti-atherosclerotic agents also have efficacy against GI cancers (8). These drugs include metformin (9), aspirin (10), and statins (11). Another study identified the human gut microbiome as a putative common therapeutic target for AS and cancer (8). It has been extensively demonstrated that patients with AS are at risk of certain cancers. A multi-ethnic study on AS reported that coronary artery calcification is correlated with elevated risks of lung cancer and CRC (12). The prevalence of colorectal adenoma was relatively higher in patients with significant coronary artery disease or low-grade coronary AS (13). Increased urogenital or gastrointestinal bleeding was associated with new cancer diagnoses in subjects with AS undergoing antithrombotic therapy (14). Another study explored the application of strategies that could simultaneous prevent atherosclerotic vascular disease and certain cancers (6). The results of the foregoing studies suggest that risk markers related to AS diseases may also predict cancer occurrence and prognosis.
Liquid biopsy is used to examine biomarkers in body fluids (15). Compared with tissue biopsy and imaging, liquid biopsy is minimally invasive, facilitates sample collection, tracks the entire disease course, and is cost-effective. Liquid biopsy analyses are performed on different body fluids to sample circulating tumor cells (CTCs), circulating tumor DNA (ctDNA), proteins such as serum autoantibodies, cell-free RNAs (mRNAs and microRNAs), metabolites, and so on (16).
AS is a chronic inflammatory disease associated with autoimmunity. Hence, the plaques it deposits contain autoantibodies (17, 18). Serological antigen identification by cDNA expression cloning (SEREX) is a liquid biopsy method and an effective technique for screening antigen and antibody markers (19, 20). SEREX screens antigens related to tumors and autoimmune diseases including GI cancers [EC (21, 22), GC (23), LC (24), and CRC (25) and PC (26)], multiple sclerosis (MS) (27), systemic sclerosis (SSc) (28), systemic lupus erythematosus (SLE) (29), rheumatoid arthritis (RA) (30), and others. In earlier studies, we successfully applied SEREX to AS-related diseases and identified antibodies against CPSF2, DIDO1, FOXJ2, MMP1, CBX1, CBX5, and LAMP1 in TIA and CI (31–33). We also identified antibodies against TUBB2C in the sera of DM patients (34). Our laboratory previously found that antibodies against LRPAP1 (35) and ASXL2 (36) were upregulated in patients with AS-related diseases and GI cancers. Hence, LRPAP1-Ab and ASXL2-Ab may be biomarkers common to all these disorders. However, we hope to use AS markers to predict GI cancer occurrence and prognosis and explore other markers common to both types of conditions.
In the present study, SEREX revealed that BRAT1-Ab and WDR1-Ab are AS disease biomarkers. Subsequent exploration of a cancer database showed that BRAT1 was upregulated in GI cancers. Serological verification disclosed that BRAT1-Ab was also a GI cancer biomarker. These discoveries suggest that BRAT1 is a common biomarker of AS diseases and GI cancers and these disorders are correlated. Moreover, the foregoing results indicate that liquid biopsy could achieve early AS and cancer diagnosis in clinical practice and help forecast the outcomes of these conditions.
Materials and Methods
Sera from Patients and Healthy Donors
Nineteen TIA patients from Chiba Rosai Hospital were randomly selected for SEREX immunoscreening. To compare antibody levels, sera were acquired from 92 patients with TIA, 464 patients with acute cerebral infarction (aCI), and 65 patients with old cerebral infarction (oCI) at Chiba Prefectural Sawara, Chiba Rosai, and Chiba Aoba Municipal Hospitals. Sera were also acquired from 128 DM and 128 AMI patients at Chiba and Kyoto University Hospitals, respectively. Sera were acquired from 192 patients with ESCC, 96 patients with GC, and 191 patients with CRC at Toho University Omori Hospital. All subjects with ESCC were followed up until January 2020 or their death. Sera of healthy donors (HDs) were provided by Port Square Kashiwado Clinic, Chiba Prefectural Sawara Hospital, and Toho University Omori Hospital. These subjects had no aberrant cranial resonance imaging. The sera were centrifuged at 3,000 × g for 10 min and the supernatants were stored at -80°C until use. Sample freeze-thaw was avoided.
Immunological Screening by SEREX
An improved version of the aforementioned method was used to screen clones that were immunoreactive to the sera of patients with TIA (31). A human aortic endothelial cell cDNA expression library (Uni-ZAP XR Premade Library, Stratagene, La Jolla, CA, USA) was transfected into Escherichia coli (E. coli) XL1−Blue MRF′ (Stratagene). The resident cDNA clones were transferred onto nitrocellulose (NC) membranes pretreated with 10 mM isopropyl-β-D-thiogalactoside (IPTG; Wako Pure Chemicals Industries Ltd., Osaka, Japan) for 30 min. Membranes with bacterial proteins were washed thrice with TBS-T (20 mM Tris-HCl (pH 7.5), 0.15 M NaCl, and 0.05% (w/v) Tween 20). Then the membranes were incubated for 1 h in 1% (w/v) protease-free bovine serum albumin (BSA; Nacalai Tesque, Inc., Kyoto, Japan) in TBS-T to block nonspecific binding. The membranes were then incubated overnight with diluted sera (1:2,000) from the TIA patients. The membranes were washed thrice in TBS−T and incubated for 1 h in alkaline phosphatase−conjugated goat anti−human IgG (1:5,000; Jackson Immuno Research Laboratories, West Grove, PA, USA). Positive responses were identified by cultivating the membranes in a color development solution (100 mM Tris-HCl (pH 9.5), 100 mM NaCl, and 5 mM MgCl2) containing 0.15 mg/mL 5-bromo-4-chloro-3-indolyl phosphate (Wako Pure Chemicals Industries Ltd.) and 0.3 mg/mL nitroblue tetrazolium (Wako Pure Chemicals Industries Ltd.). Cloning was performed twice on the positives until monoclonality.
Sequence Analysis of Identified Antigens
ExAssist helper phage (Stratagene) and in vitro excision were used to convert the monoclonalized phage cDNA clones into pBluescript phagemids. Plasmid DNA was extracted from the E. coli SOLR strains transformed by the phagemids. The infused cDNAs were sequenced for homology using the public database provided by the National Center for Biotechnology Information (http://www.ncbi.nlm.nih.gov/Blast.cgi/).
Expression Vector Construction
To construct the glutathione-S-transferase (GST)-fused protein expression plasmids, the cDNA sequences were recombined into the pGEX-4T vector (GE Healthcare Life Sciences, Pittsburgh, PA, USA) as previously described (32, 35, 37). The pBluescript plasmids associated with the cDNA inserts were digested with the restriction endonucleases EcoRI and XhoI and detached by agarose gel electrophoresis. GenElute Minus EtBr spin columns (Sigma-Aldrich Corp., St. Louis, MO, USA) were used to isolate the cDNA fragments which were ligated in frame to EcoRI- and XhoI-digested pGEX-4T-3 linearized vectors with ligation convenience kits (Nippon Gene, Toyama, Japan). The ligation mixtures were used to transform ECOS-competent E. coli BL-21 cells (Nippon Gene). Successful recombination was confirmed by DNA sequencing and protein expression analysis.
Recombinant Candidate Protein Purification
Escherichia coli BL-21 cells transformed with the pGEX-4T clone were cultured in 200 mL Luria-Bertani (LB) broth and treated with 1 mM IPTG for 3 h. The cells were collected in bacterial solution and lysed by sonication in BugBuster Master Mix (Novagen, San Diego, CA, USA). The lysates were then centrifuged at 13,000 × g and 4°C for 10 min. GST-tagged BRAT1 and GST-tagged WDR1 proteins were purified by glutathione-Sepharose column chromatography (GE Healthcare Life Sciences) and dialyzed as previously described (32, 36, 38).
Western Blotting
Purified GST, GST-BRAT1, and GST-WDR1 proteins (0.3 μg) were separated by SDS-PAGE. After transfer and blocking, anti-GST (Rockland, Gilbertsville, PA, USA) or serum (1:5,000) from patients with TIA (#297) was used as a source of primary antibodies. The proteins were then incubated with HRP-conjugated secondary antibody (donkey anti-goat or anti-human IgG; Santa Cruz Biotechnology, Dallas, TX, USA) and detected as previously described (32, 39).
AlphaLISA of Antibody Biomarkers and Conventional Serum Marker Measurement
AlphaLISA was used to quantify the serum antibodies against the purified proteins. The α-luminescent photon counts represent the serum antibody levels (35, 40). The AlphaLISA assay was performed in 384-well microtiter plates (white opaque OptiPlate; PerkinElmer, Waltham, MA, USA). Each well contained 2.5 μL serum (1:100 dilution) and 2.5 μL GST or GST fusion protein (10 μg/mL) in AlphaLISA buffer (25 mM HEPES [pH 7.4], 0.1% (w/v) casein, 0.5% (w/v) Triton X-100, 1 mg/mL Dextran-500, and 0.05% (w/v) Proclin-300). The mixture was then incubated at 25°C for 8 h. Then 2.5 μL of 40 μg/mL anti-human IgG-conjugated acceptor beads and 2.5 μL of 40 μg/mL glutathione-conjugated donor beads were added and the mixture was incubated in the dark at 25°C for 7–21 d. Chemical emission was measured in an EnSpire Alpha microplate reader (PerkinElmer) as previously described. The reactions were calculated by subtracting the Alpha counts for the GST control from those for the GST fusion proteins.
The levels of serum squamous cell carcinoma antigen (SCC-Ag) (41) and p53 antibody (p53-Abs) (42) were evaluated as previously described. The serum SCC-Ag and p53-Abs cutoff values were 1.5 ng/mL and 1.3 IU/mL, respectively.
BRAT1 Expression Analysis
Tumor Immune Estimation Resource (TIMER2.0, http://timer.cistrome.org/) estimates the immune invasion levels of numerous cancers. The “Gene_DE” module permits users to compare gene expression levels between normal tissues and those of tumors associated with all 32 types of cancer listed in The Cancer Genome Atlas (TCGA) cohort (43, 44). C7orf27 (BRAT1) or WDR1 were inserted into the “Gene_DE” module of TIMER2.0 Web to analyze the differences in BRAT1 expression between normal tissues and the tumors listed in the TCGA cohort.
Gene Expression Profiling Interactive Analysis (GEPIA, http://gepia2.cancer-pku.cn/) analyzes gene expression in tumor and normal samples from the TCGA and Genotype-Tissue Expression (GTEx) databases (45, 46). GEPIA was used to analyze BRAT1 expression in various tumors in the TCGA cohort. Matching normal TCGA data served as the control.
The TNMplot (http://www.tnmplot.com) database contains 56,938 samples of normal, tumor, and metastatic tissues from gene chip studies, TCGA, Therapeutically Applicable Research to Generate Effective Treatments (TARGET), and GTEx (47). TNMplot was used to determine BRAT1 expression levels in different tumor tissues and compare them against the BRAT1 expression profiles of normal tissues.
UALCAN (http://ualcan.path.uab.edu) is an interactive web portal containing TCGA clinical data for 31 cancer types and RNA-seq. UALCAN has been used for in-depth TCGA gene expression data analysis (48). UALCAN can also analyze protein expression using data from the Clinical Proteomic Tumor Analysis Consortium (CPTAC, http://ualcan.path.uab.edu/analysis-prot.html). Here, UALCAN was used to analyze protein expression.
Statistical Analyses
Student’s t-test and Mann-Whitney U test were used to analyze differences between group pairs. Correlations among Alpha values and clinical data were calculated by multivariate logistic regression and Spearman’s correlation analyses. Differences in the distributions of two variables were calculated by Fisher’s exact test. The predictive values of the disease markers were assessed by ROC analysis. The antibody level cutoff values were set to maximize the sensitivity and specificity sums. Survival curves were plotted by the Kaplan-Meier method. Comparisons were made via the log-rank test. The Cox proportional hazards model was used to evaluate significant predictors. All tests were two-tailed. P < 0.05 was considered statistically significant. GraphPad Prism 6 (GraphPad Software, La Jolla, CA, USA) was used to perform all statistical analyses.
Results
Autoantibodies Against Purified BRAT1 and WDR1 Proteins are Present in Sera of Patients with TIA
AS biomarkers were screened with SEREX (Figures 1A–C). Sera from the 19 patients in the TIA group were used for immunological screening. We identified certain clones and some of them were previously reported (32, 39). We focused on the antibody markers BRAT1 (accession No. NM_152743) and WDR1 (accession No. NM_017491). Full-length BRAT1 and WDR1 cDNAs were recombined into pGEX-4T-3 expression vectors. GST-labeled recombinant proteins were expressed in E. coli and purified by affinity chromatography with glutathione-Sepharose. Antigenic proteins were then purified from the precipitate fraction. The arrows in Figure 1 indicate that the GST-fusion proteins could be detected in equal amounts in the total extracts, precipitates (Ppts), dialysates, and flow-through, purified, and concentrated samples but not in the supernatant (Figure 1D, middle).
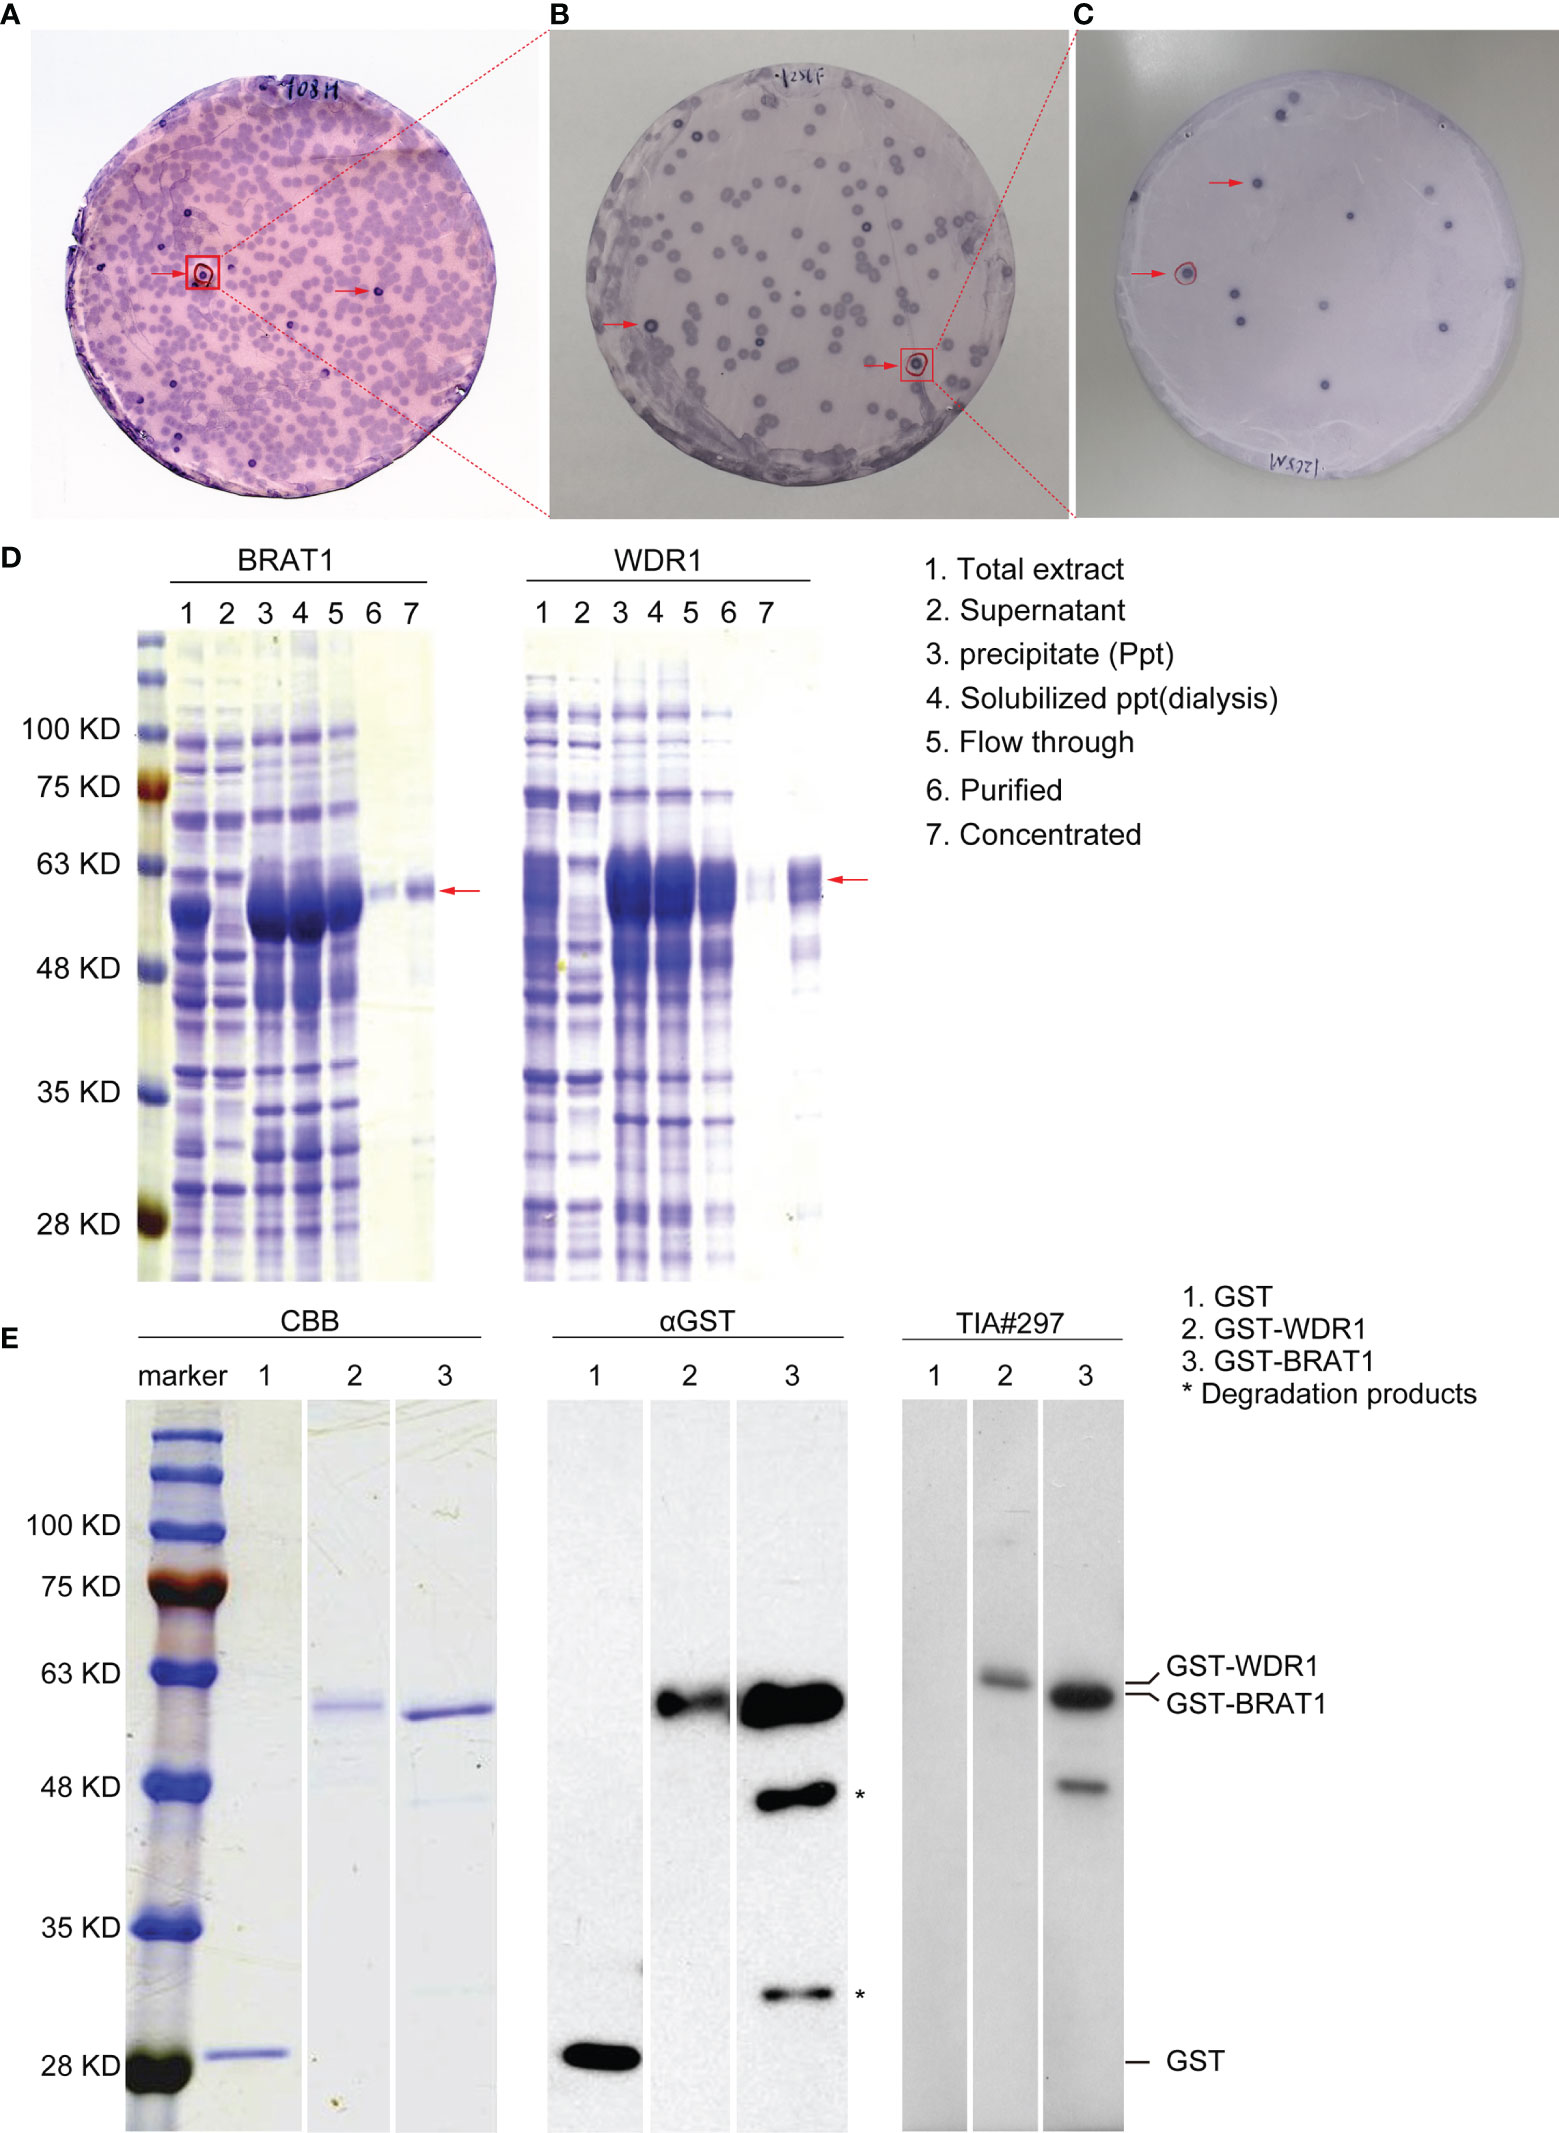
Figure 1 Recognition and identification of BRAT1 and WDR1 using serum of TIA patients. (A) Recombinant expression cloning proteins were detected by SEREX in sera from TIA patients. positive phage clones were marked by red arrows. (B) Positive clones obtained from above were rescreened to obtain monoclonality. (C) Positive clones from B were recloned to obtain monoclonality. (D) Antigenic proteins BRAT1 and WDR1 were succeeded in purification from precipitate fraction. (E) GST-BRAT1, GST-WDR1 and GST proteins were electrophoresed through SDS-polyacrylamide gels followed by staining with Coomassie Brilliant Blue (CBB), Western blotting using anti-GST (αGST), or sera of TIA patient [TIA#297]. The degradation products of GST-BRAT1 were marked by asterisks (*).
Western blotting revealed antibodies against BRAT1 and WDR1 in the sera of patients with TIA. GST-BRAT1, GST-WDR1, and GST were recognized by anti-GST (αGST) antibody and detected as 58-kD, 59-kD, and 28-kD proteins, respectively (Figure 1E). The degradation products were marked with asterisks in Figure 1E. GST-BRAT1 and GST-WDR1 were recognized by serum IgG antibodies from a patient with TIA (TIA#297). There was no apparent reactivity against the serum IgG antibodies from the patients in the GST protein group (Figure 1E, right).
Antibody Markers Against BRAT1 and WDR1 Are Predictors of TIA, aCI, and oCI Onset
We used AlphaLISA to measure serum BRAT1-Ab and WDR1-Ab in the HDs and patients with TIA, aCI, and oCI. Serum BRAT1-Abs and WDR1-Abs levels were significantly higher in the patients than the HDs (Figures 2A, B). Table 1A shows that there were 285, 92, 464, and 65 HDs and patients with TIA, aCI, and oCI, respectively. The distributions of men and women in these sample groups were 188/97, 55/37, 271/193, and 48/17, respectively. The average ages (± SD) in these treatment groups were 52.3 ± 11.7, 70.2 ± 11.6, 75.5 ± 11.5, and 73.3 ± 9.2 y, respectively. At the cutoff value, the positivity rates for BRAT1-Abs were 5.3, 14.1, 17.2, and 18.5% for the HDs and the patients with TIA, aCI, and oCI, respectively. The positivity rates for WDR1-Abs were 5.6, 14.1, 16.6, and 13.8% for the HDs and the patients with TIA, aCI, and oCI, respectively (Table 1B).
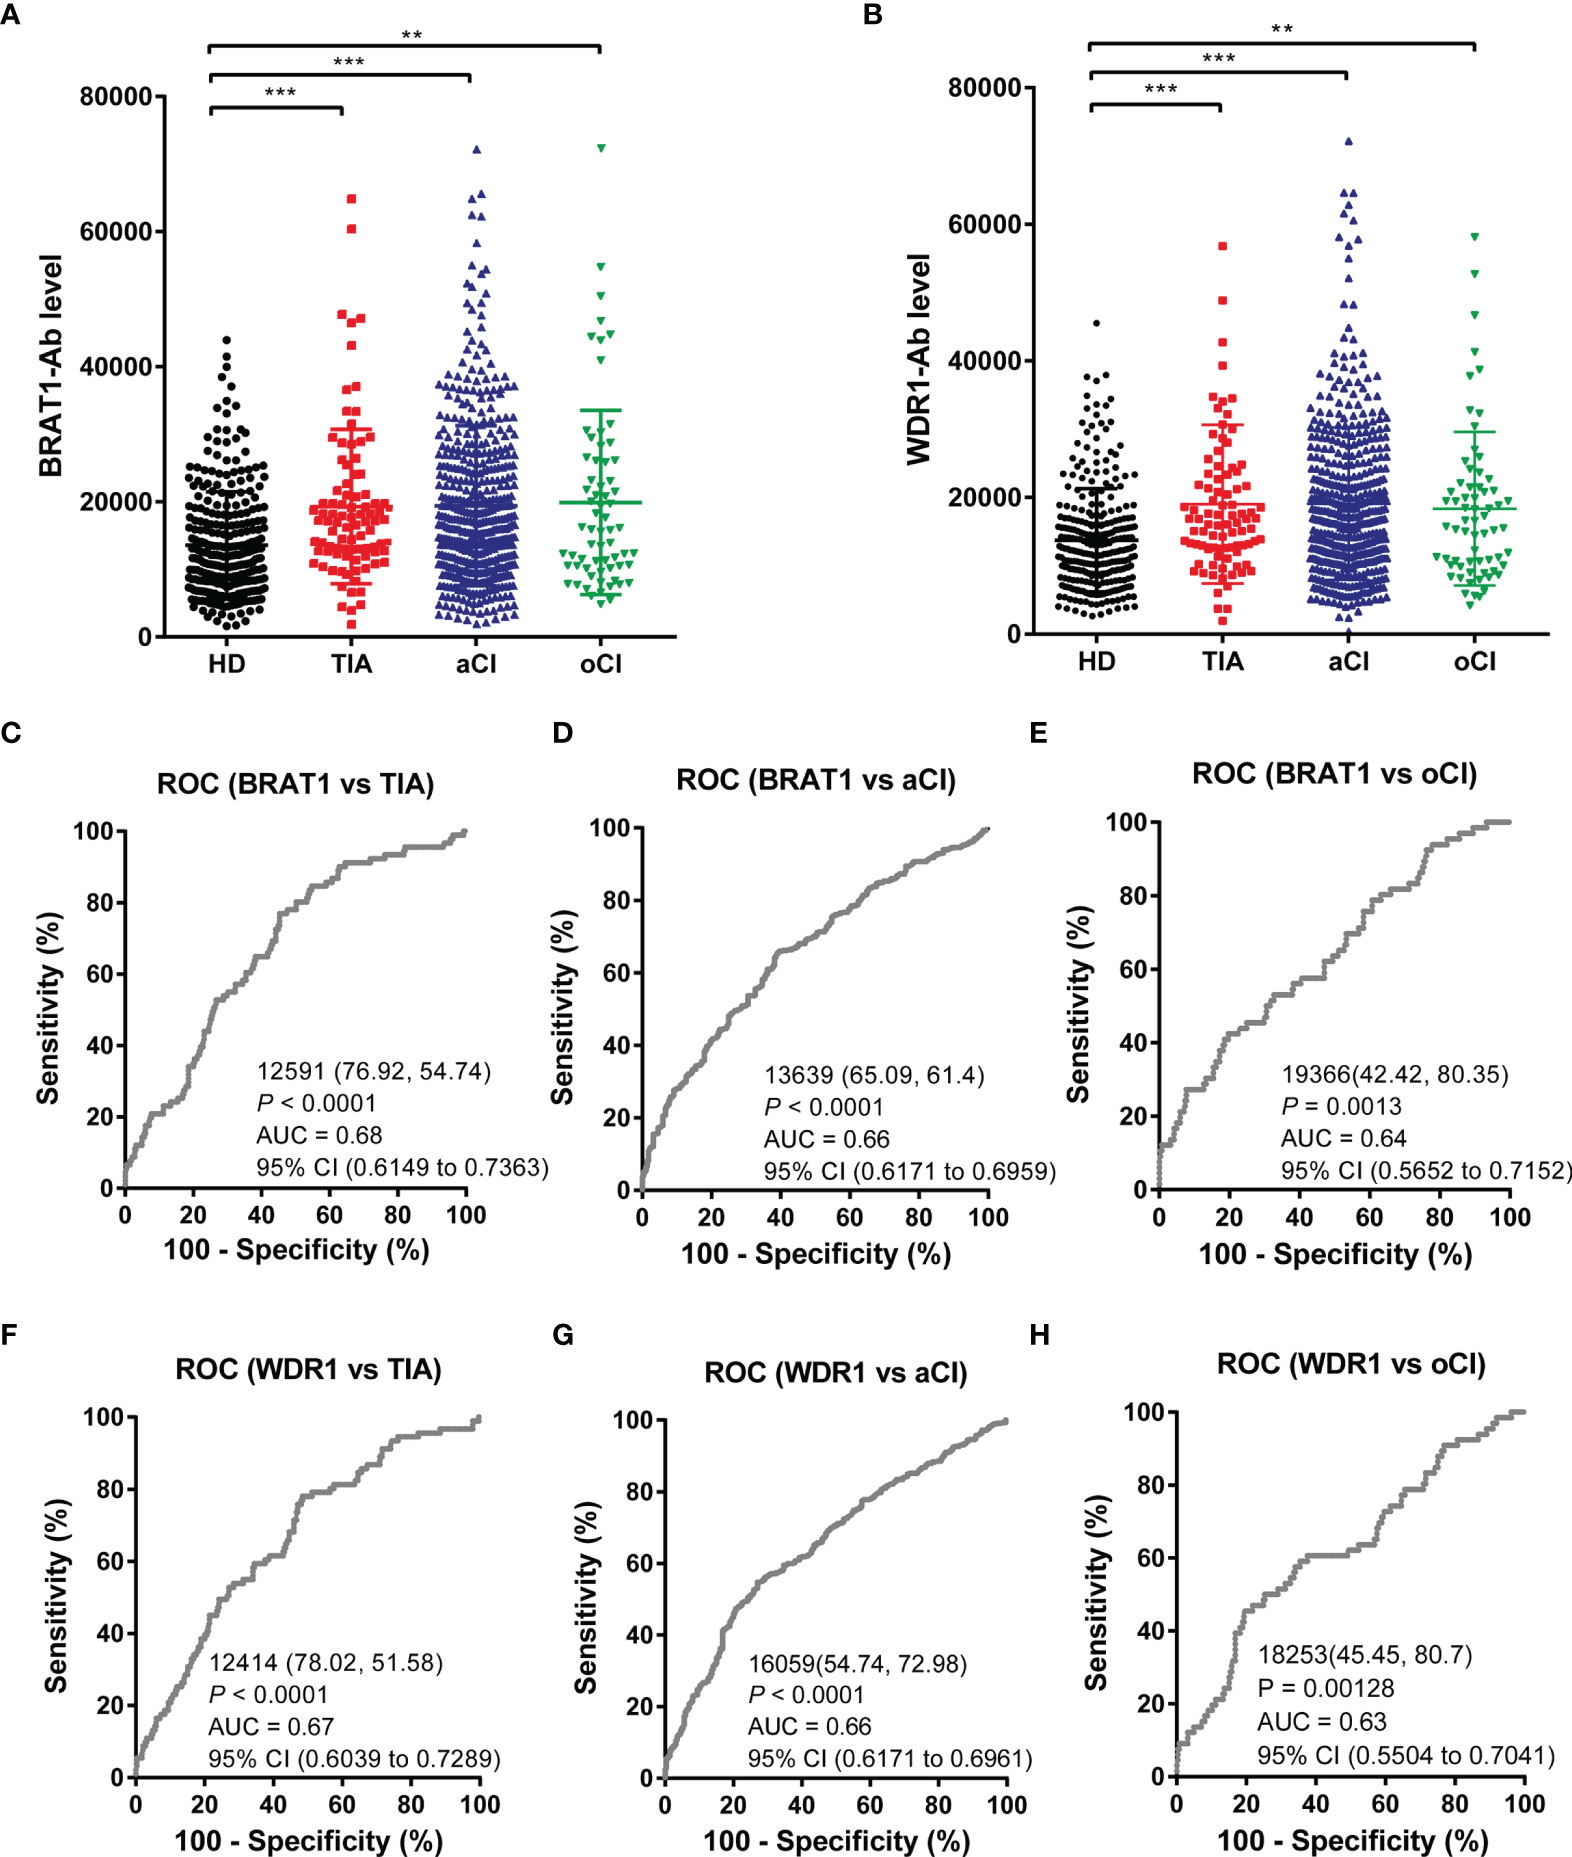
Figure 2 Comparison of serum anti-BRAT1 antibody (BRAT1-Abs) and anti-WDR1 antibody (WDR1-Abs) levels between healthy donors (HDs) and patients with TIA, aCI, or oCI. Serum antibody levels against BRAT1-GST (A) or WDR1-GST (B) were determined by AlphaLISA. The bars represent the median. P values were calculated by the Kruskal–Wallis test. **P < 0.01; ***P < 0.001. The serum numbers of HDs, TIA, aCI and oCI were 285, 91, 464 and 66, respectively. ROC analysis of BRAT1 and WDR1 for the prediction of TIA (C, F), aCI (D, G) and oCI (E, H). The numbers in the figures indicate the cutoff values for marker levels, and the numbers in parentheses indicate the sensitivity (left) and specificity (right).
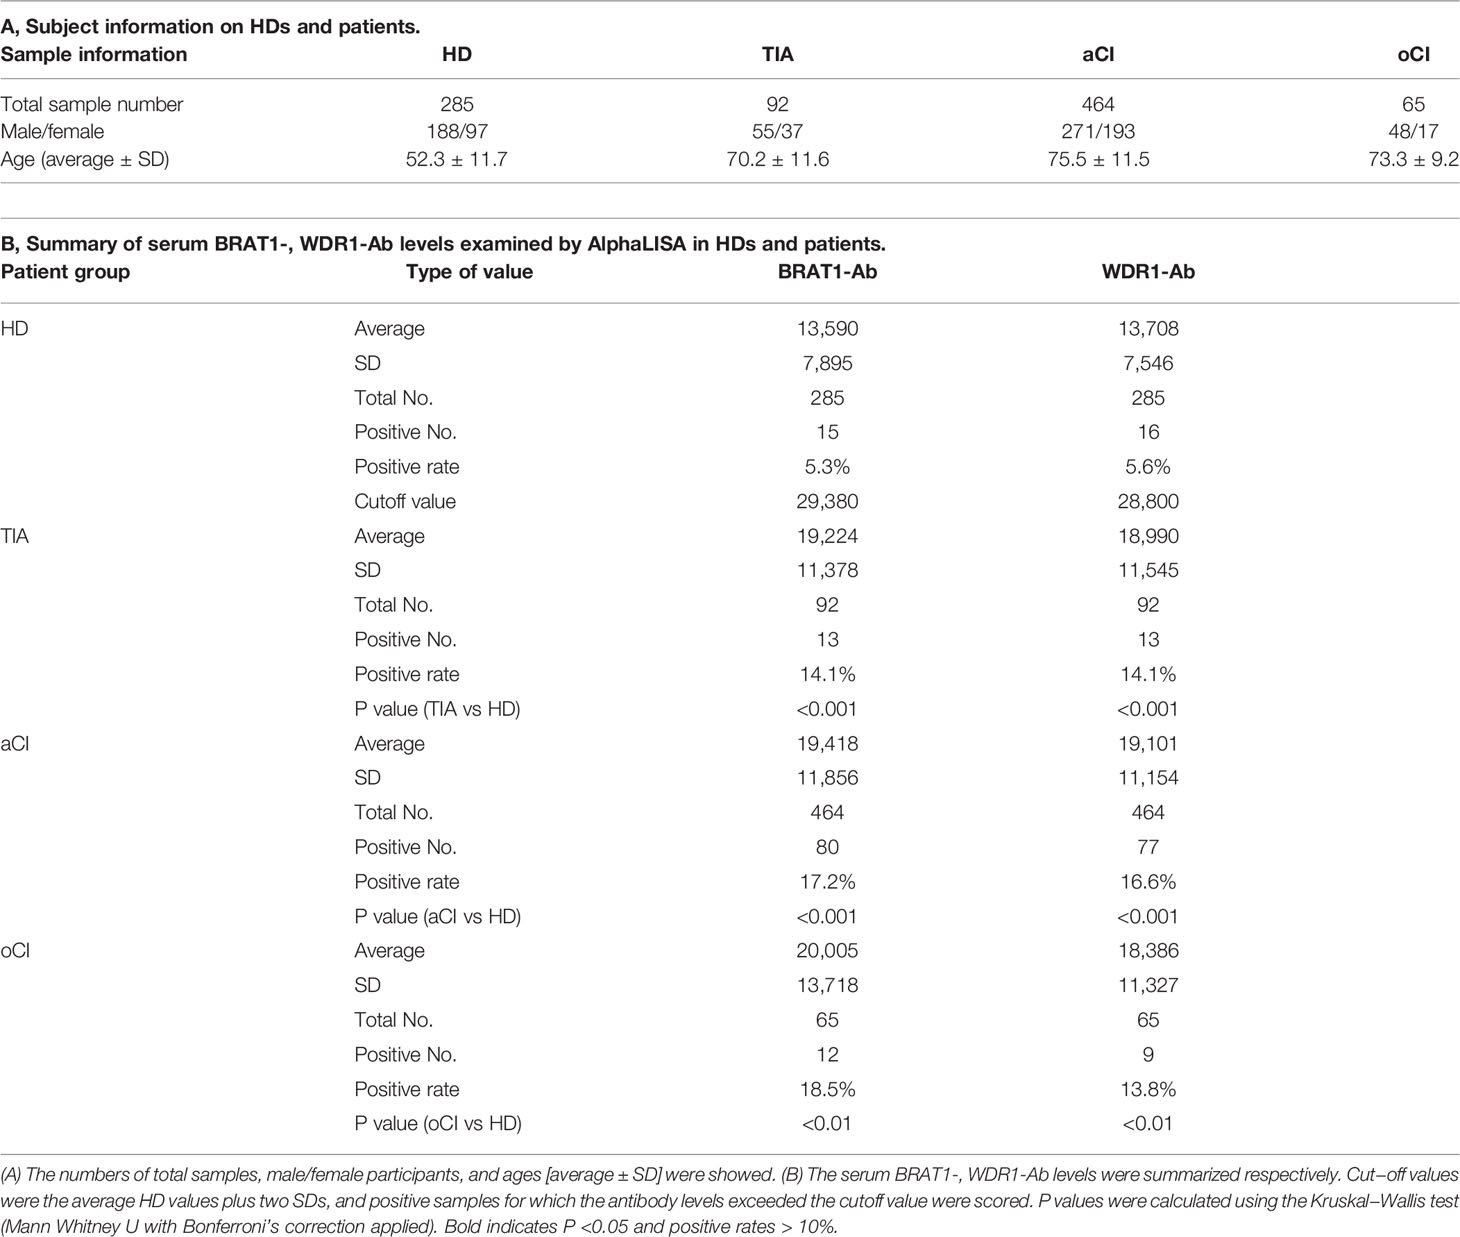
Table 1 Comparison of serum BRAT1-, and WDR1-Ab levels between HDs and patients with TIA, aCI or oCI examined by AlphaLISA.
The abilities of BRAT1-Ab and WDR1-Ab to detect TIA, aCI, and oCI were evaluated by ROC analysis. In this manner, the efficacy of these markers at predicting TIA-related cardiovascular disease (CVD) was determined. The graphs in Figures 2C–H show the area under the curve (AUC), cutoff value, 95% CI, sensitivity, specificity, and P-value. The discriminant ability increases as the AUC value approaches unity (49). The BRAT1-Abs AUCs for TIA, aCI, and oCI were 0.68, 0.66, and 0.64, respectively (Figures 2C–E). Hence, BRAT1-Ab had good predictive efficacy for these diseases. The ROC analysis also disclosed that the WDR1-Abs AUCs were 0.67, 0.66, and 0.63 for TIA, aCI, and oCI, respectively (Figures 2F–H). Thus, BRAT1-Ab could effectively predict these conditions.
Spearman’s correlation analysis was performed to investigate the associations among the serum BRAT1-Ab and WDR1-Ab levels and the indices for the HDs and TIA, aCI, and oCI patients (Table 2). Both BRAT1-Ab and WDR1-Ab were correlated with age (r = 0.2165, P < 0.0001; r = 0.2263, P< 0.0001), HT (r = 0.1298, P < 0.0001; r = 0.1279, P < 0.0001), IMT (r) (r = 0.1986, P < 0.0001; r = 0.1928, P < 0.0001), ALP (r = 0.1348, P < 0.0001; r = 0.09273, P = 0.007), CRP (r = 0.175, P < 0.0001; r = 0.1547, P < 0.0001), IMT (l) (r = 0.2032, P < 0.0001; r = 0.1996, P < 0.0001), and IMTmax (r = 0.2068, P < 0.0001; r = 0.2059, P < 0.0001). BRAT1-Ab and WDR1-Ab were also correlated with height, weight, AST, LDH, WBC, RDW, BP, and smoking but not with alcohol consumption. In contrast, the antibody levels were negatively correlated with A/G, CHE, ALB, T-CHO, and RBC. The AS-associated parameter TG was negatively associated with the level of WDR1-Ab but not that of BRAT1-Ab. The BRAT1-Ab and WDR1-Ab levels were not significantly elevated in patients with DM (P = 0.213 and 0.079, respectively). There was no apparent positive correlation between the antibody levels and HbA1c (r = 0.01993, P = 0.6547; r = -0.00131, P = 0.9766).
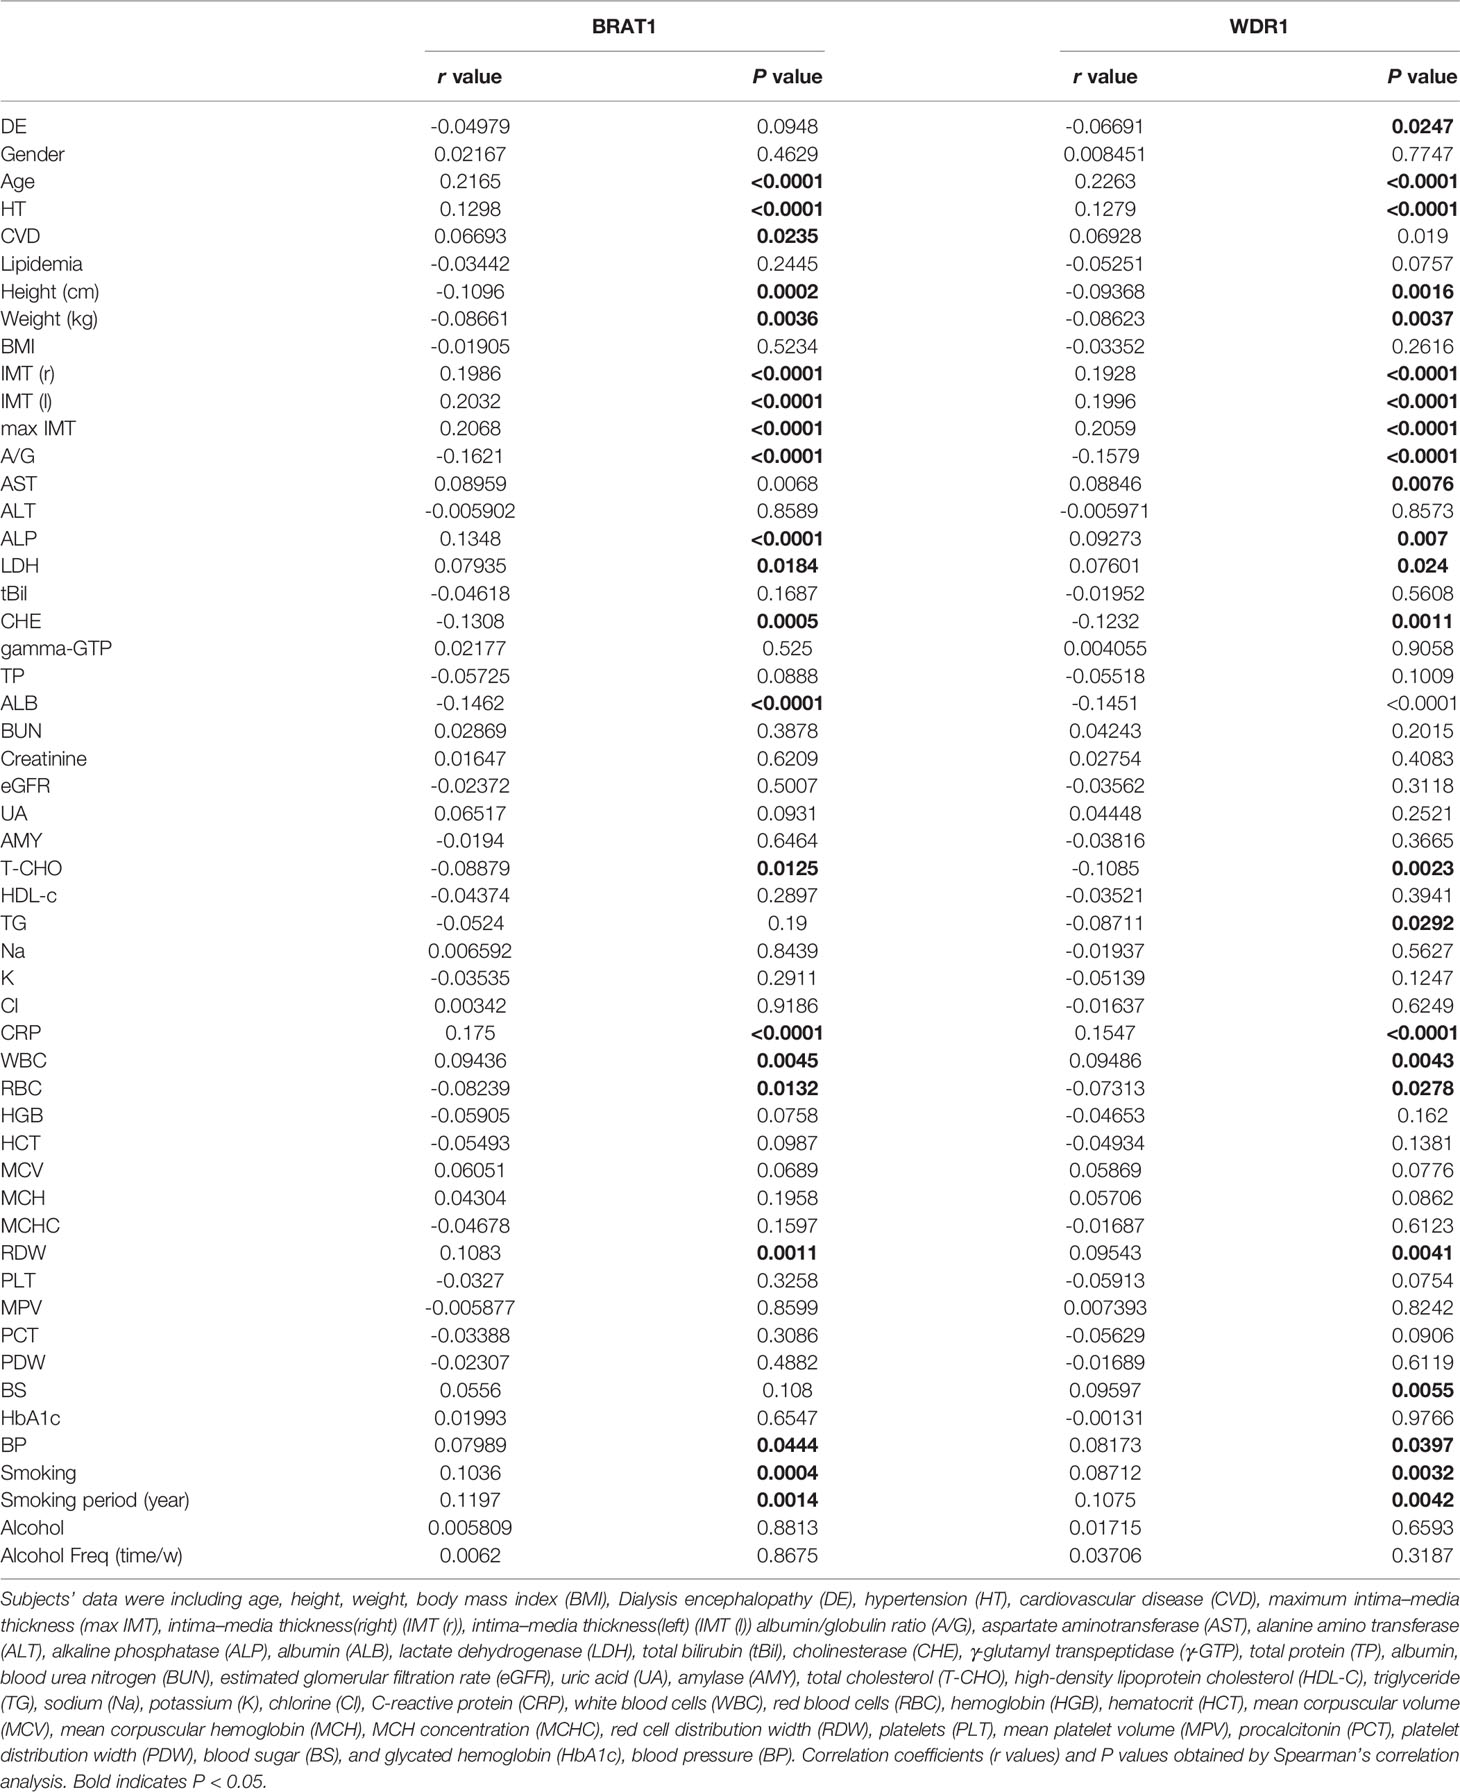
Table 2 Correlation analysis between serum BRAT1-, and WDR1-Ab levels and the indices in HDs, TIA, aCI or oCI patients.
The foregoing results suggest associations among the BRAT1-Ab and WDR1-Ab levels and CVD including TIA, aCI and oCI. Moreover, BRAT1-Ab and WDR1-Ab are potential molecular markers for TIA, aCI, and oCI onset.
Serum BRAT1 and WDR1 Antibody Levels Are Elevated in Patients With Atherosclerotic AMI
The serum antibody levels in the HDs and the AMI and DM patients were detected with AlphaLISA to verify the ability of BRAT1-Ab and WDR1-Ab to detect AS-associated diseases. Serum BRAT1-Ab and WDR1-Ab levels were significantly higher in AMI patients than HDs but not DM patients (Figures 3A, B). At the cutoff value, the BRAT1-Ab positivity rates were 3.1%, 10.2%, and 8.6% for the HDs, AMI, and DM, respectively. For WDR1-Ab, the positivity rates were 1.6%, 16.4% and 14.1% for the HDs, AMI, and DM, respectively (Table 3). Hence, serum BRAT1-Ab and WDR1-Ab more effectively predict CVD than DM.
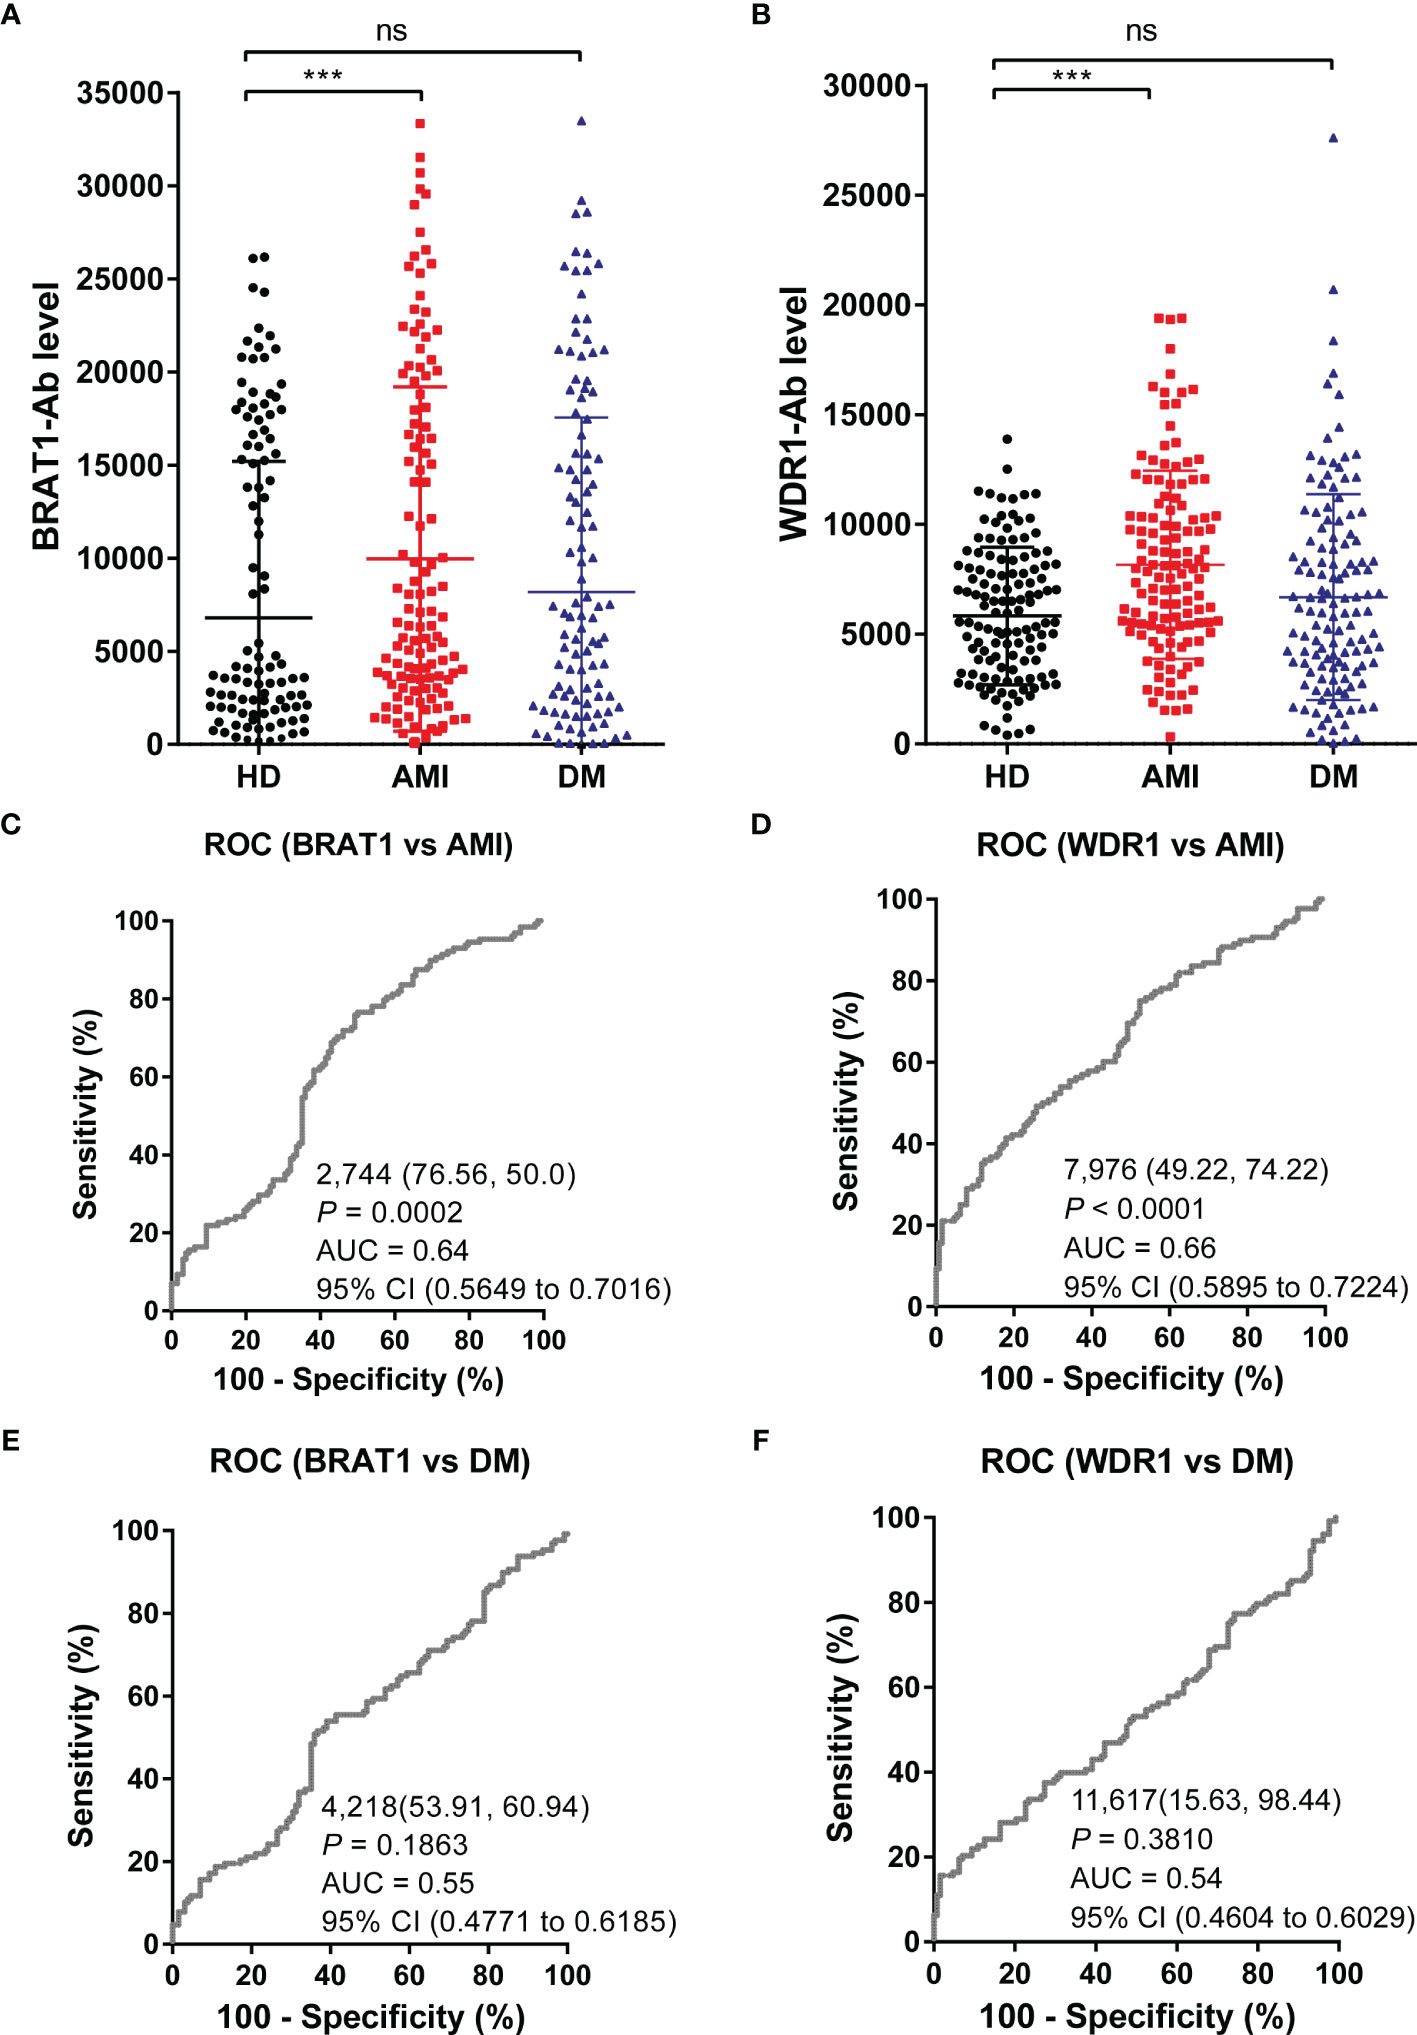
Figure 3 Comparison of serum BRAT1-Abs and WDR1-Abs levels between HDs and patients with AMI or DM. Serum antibody levels against BRAT1-GST (A) or WDR1-GST (B) were detected by AlphaLISA. The bars represent the median. P values were calculated by the Kruskal–Wallis test. ***P < 0.001. ns, not significant. The serum number of HDs, AMI, and DM was 128. ROC analysis of BRAT1 and WDR1 for the prediction of AMI (C, D) and DM (E, F). The numbers in the figures indicate the cutoff values for marker levels, and the numbers in parentheses indicate the sensitivity (left) and specificity (right).
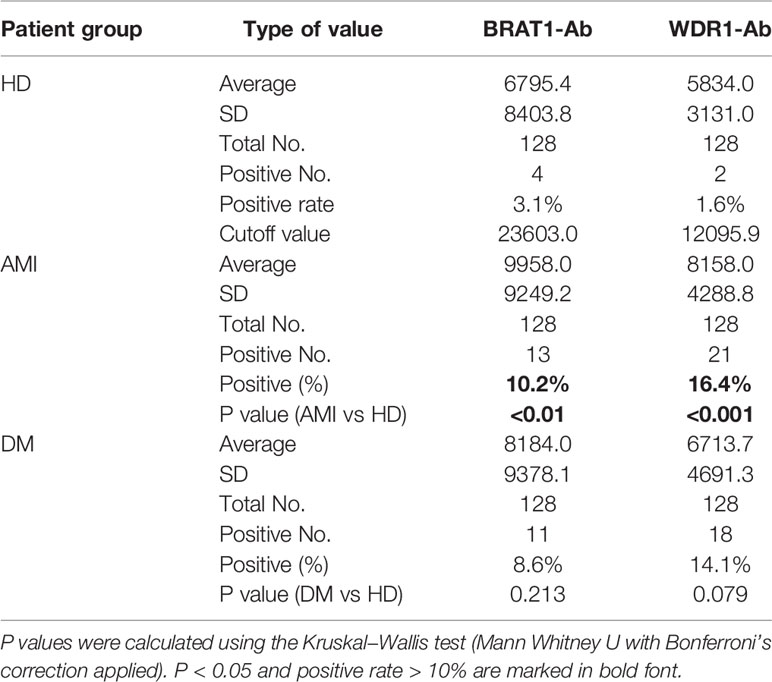
Table 3 Comparison of serum BRAT1-, and WDR1-Ab levels between HDs and patients with AMI or DM tested by AlphaLISA.
The ROC analysis parameters including AUC, 95% CI, cutoff value, sensitivity, specificity, and P value are shown in Figures 3C–F. The AUCs of BRAT1-Ab and WDR1-Ab for AMI were 0.64 (95% CI = 0.5649–0.7013) and 0.66 (95% CI = 0.5895–0.7224), respectively. The AUCs of BRAT1-Ab and WDR1-Ab for DM did not significantly increase to > 0.6 and were only 0.55 (95% CI = 0.4771–0.6185) and 0.54 (95% CI = 0.4604–0.6029), respectively.
The foregoing results indicate that serum BRAT1-Ab and WDR1-Ab effectively predict the onset of atherosclerosis-related diseases.
BRAT1 Expression Levels Were Significantly Elevated in GI Cancer Tissues
AS-associated diseases and cancers are major global causes of mortality and morbidity. They share common modifiable pathogenesis risk factors. Thus, the prophylactic strategies used against atherosclerotic vascular disease may also be efficacious against cancers (6, 50). We used the TIMER2.0 database to analyze the mRNA expression levels across all TCGA tumors and identify the differences in BRAT1 and WDR1 expression between tumors and adjacent normal tissues. Figure 4A shows that relative to adjacent normal, healthy tissues, BRAT1 was significantly upregulated in BLCA (bladder urothelial carcinoma), BRCA (breast invasive carcinoma), CHOL (cholangiocarcinoma), COAD (colon adenocarcinoma), ESCA (esophageal carcinoma), GBM (glioblastoma multiforme), HNSC (head and neck squamous cell carcinoma), KICH (kidney chromophobe), KIRC (kidney renal clear cell carcinoma), KIRP (kidney renal papillary cell carcinoma), LIHC (liver hepatocellular carcinoma), LUAD (lung adenocarcinoma), LUSC (lung squamous cell), PRAD (prostate adenocarcinoma), READ (rectum adenocarcinoma), STAD (stomach adenocarcinoma), and UCEC (uterine corpus endometrial carcinoma). BRAT1 was significantly upregulated in all five types of GI cancer (COAD, ESCA, LIHC, READ, and STAD). Contrastingly, WDR1 was significantly upregulated only in LIHC (Figure 4B). Therefore, the expression of BRAT1 but not WDR1 was positively correlated with GI cancers. As the statistical strategies and sample sizes differed between the TIMER2.0 and GEPIA databases, the latter was used to confirm BRAT1 upregulation in ESCA, STAD, READ, LIHC, PAAD, and COAD and their adjacent normal tissues. Matched TCGA normal data were used as controls. (Figure 4C). RNA-seq data generated by the TNMplot online tool showed that BRAT1 was upregulated in six different GI cancers compared with normal tissues (Figure 4D). We also measured BRAT1 protein expression in normal and LIHC, PAAD, and COAD tissues using Clinical Proteomic Tumor Analysis data (Figure 4E).
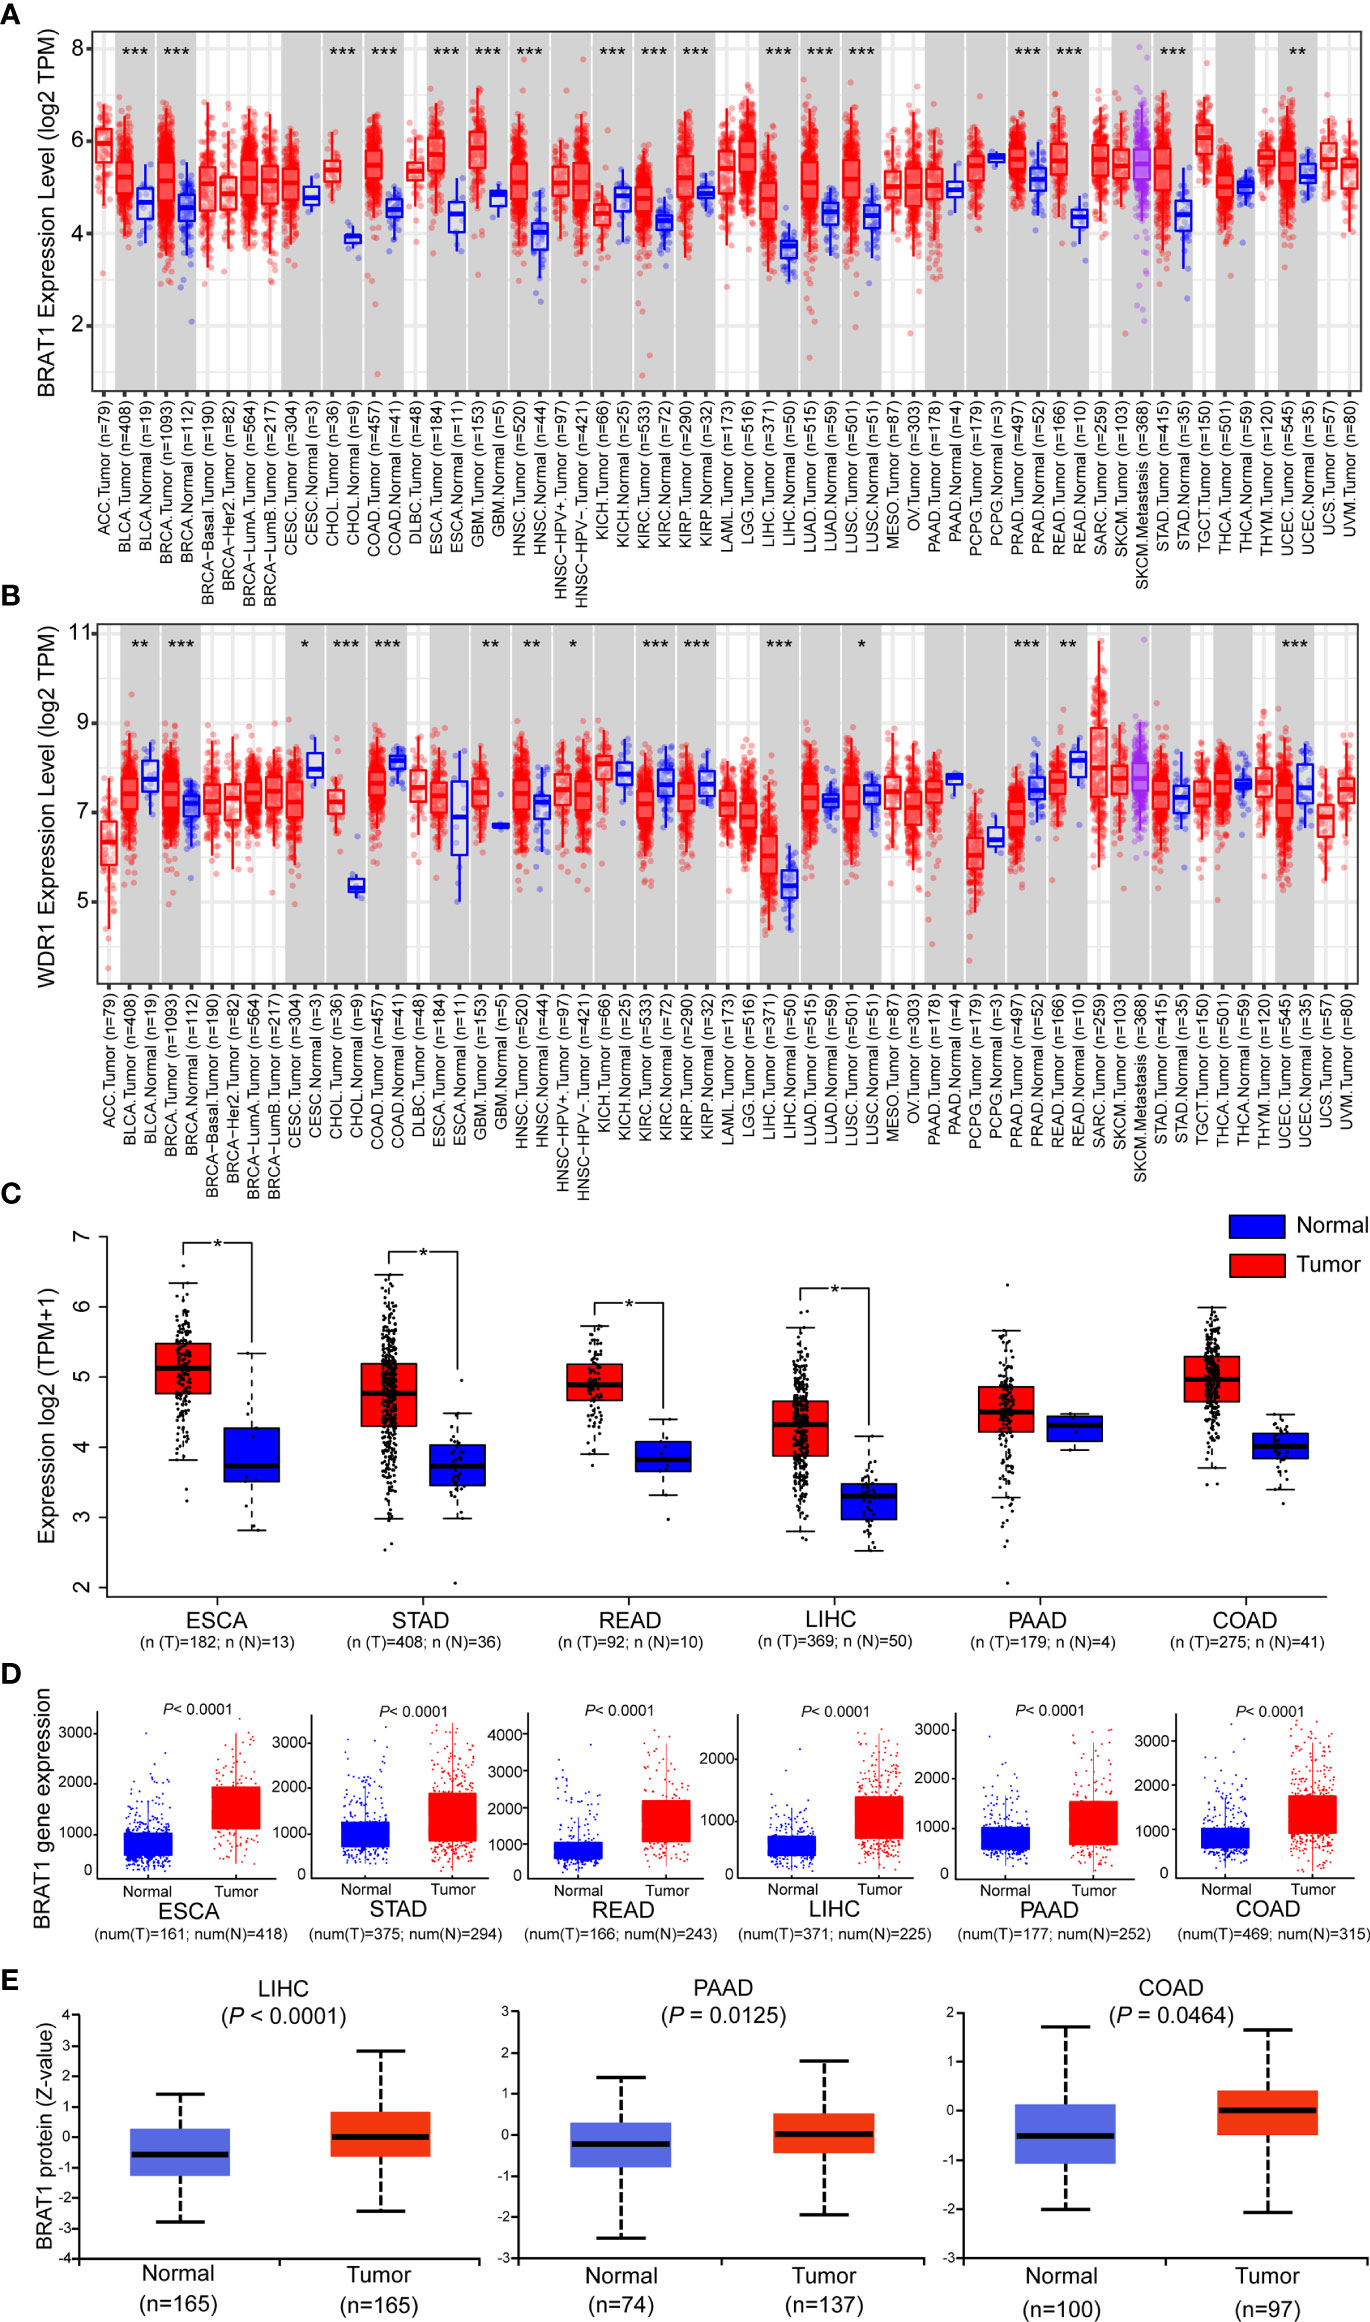
Figure 4 Comparison of BRAT1 levels between normal and gastrointestinal cancer tissues. (A, B) The expression levels of human BRAT1 and WDR1 in different cancer types were obtained from TCGA data in TIMER. (C) For the main type of gastrointestinal cancer, including ESCA, STAD, READ, LIHC, PAAD and COAD in the TCGA project, the normal tissues of the TCGA normal data were as controls. The box plot data were obtained from GEPIA web-based tool. (D) Plots of BRAT1 expression in normal and gastrointestinal cancer tissues of based on gene chip data of TNMplot. (E) BRAT1 proteomic expression profile in gastrointestinal cancers, LIHC, PAAD and COAD from CPTAC samples. Standard deviations from the median across samples for the given cancer types were represented by Z values. n represents the number of samples. *P < 0.05, **P < 0.01, ***P < 0.001.
The preceding results acquired from multiple online databases indicated high BRAT1 expression in GI cancers and suggested that BRAT1 might play a crucial role in serum detection of these diseases.
Serum BRAT1-Ab Levels Are Potential Predictors of GI Cancers
AlphaLISA analysis was performed on HDs and patients with ESCC, GC, and CRC to establish whether serum BRAT1-Ab is a novel serum biomarker of these GI cancers (Figure 5A and Table 4). Serum BRAT1-Abs levels were significantly higher for patients with ESCC, GC, and CRC than the HDs. Serum WDR1-Abs levels were markedly elevated in patients with ESCC and GC but not in those with CRC (Supplementary Figure 1A; Supplementary Table 1). At a cutoff value of the mean HD value plus 2 SD, the BRAT1-Abs positivity rates for the HDs and patients with ESCC, GC, and CRC were 6.3%, 17.9%, 15.6%, and 11.5%, respectively (Table 4). The WDR1-Abs positivity rates for the HDs and patients with ESCC, GC, and CRC were 4.3%, 27.7%, 17.4%, and 16.0%, respectively (Supplementary Table 1).
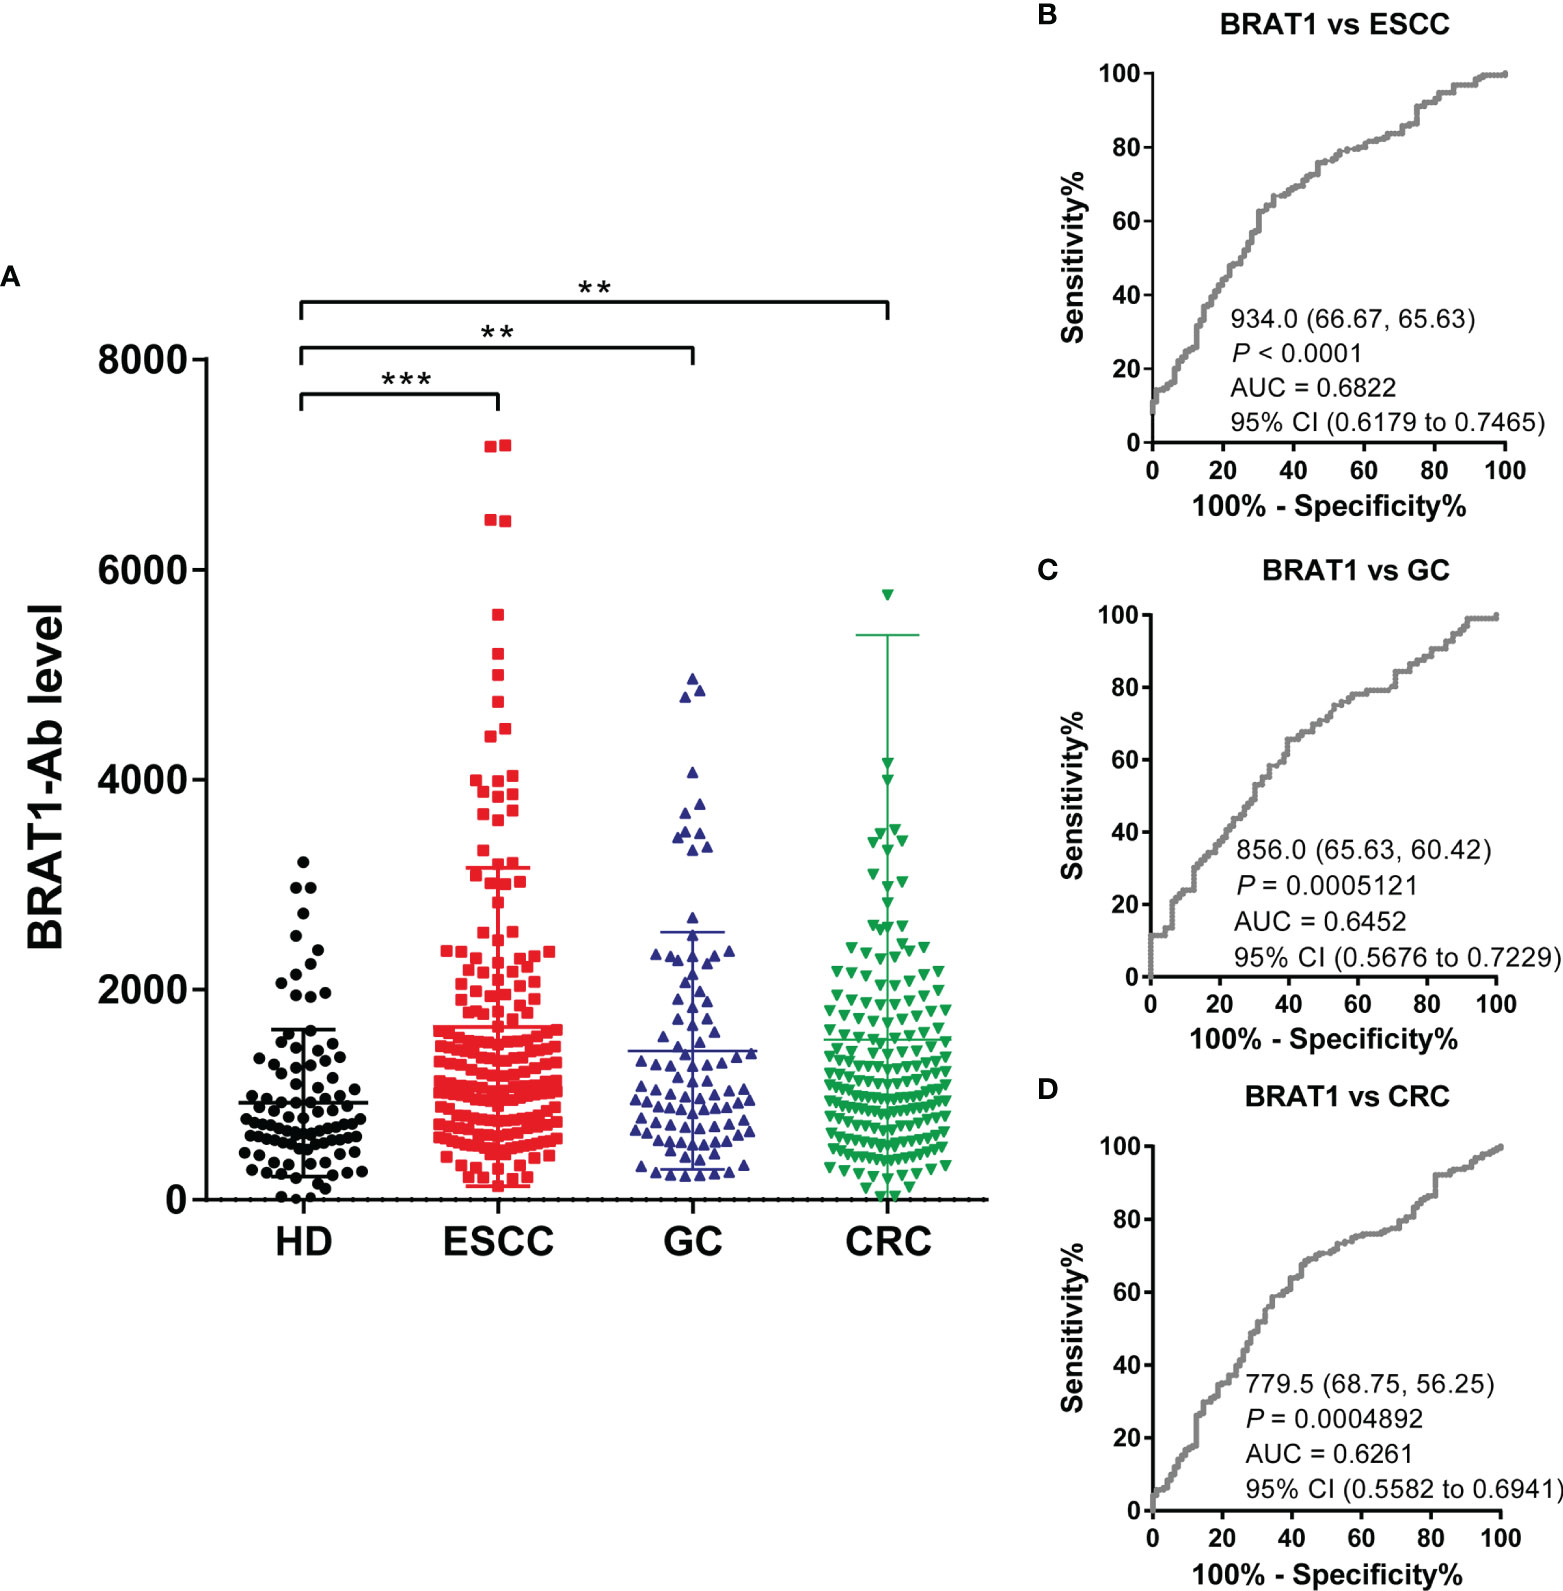
Figure 5 Comparison of serum BRAT1-Abs levels between HDs and patients with gastrointestinal cancers. (A) Serum antibody levels against BRAT1-GST were determined by AlphaLISA. The bars represent the median. The Kruskal–Wallis test was used for calculating P values. The serum number of HDs, ESCC, GC and CRC were 96, 192, 96 and 192, respectively. sensitivity and specificity of BRAT1 between ESCC (B), GC (C), CRC (D) were evaluated by ROC analysis. Numbers in the figure represent cutoff level, specificity and sensitivity. **P < 0.01, ***P < 0.001.
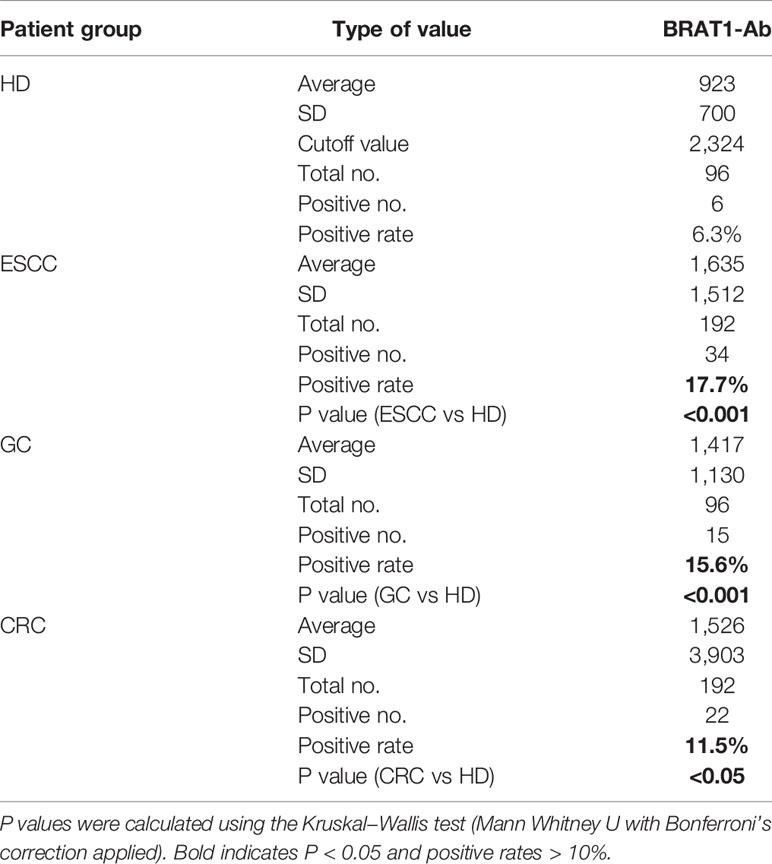
Table 4 Comparison of serum BRAT1-Ab levels between HDs and patients with ESCC, GC or CRC examined by AlphaLISA.
We then used ROC analysis to assess the abilities of these markers to detect GI cancers. Figures 5B–D show that the AUCs of BRAT1-Abs for ESCC, GC, and CRC were 0.68 (95% CI = 0.6203–0.7489), 0.64 (95% CI = 0.5676–0.7229), and 0.62 (95% CI = 0.5560–0.6924), respectively. The AUCs of WDR1-Abs for ESCC, GC, and CRC were 0.68 (95% CI = 0.6233–0.7479), 0.68 (95% CI = 0.6131–0.7651), and 0.59 (95% CI = 0.5306–0.6646), respectively (Supplementary Figures 1B–D). The cutoff value, sensitivity, specificity, and P value are shown under the curves. Significant increases > 0.6 were only observed for the AUCs of BRAT1-Ab vs. ESCC, GC, and CRC. In contrast, the AUC of WDR1-Ab vs. CRC was < 0.6.
The foregoing findings revealed that relative to WDR1-Ab, BRAT1-Ab is a superior predictor of GI cancers and the AS-associated biomarker BRAT1-Ab is a potential predictor of the onset of ESCC, GC, and CRC.
Serum BRAT1−Ab Levels Are Positively Correlated with Overall Survival
The AUC values were highest for ESCC (Figure 6). Thus, 98 surgical ESCC cases were analyzed and used to validate the correlations between BRAT1-Ab and overall survival. We divided the BRAT1−Ab levels for ESCC into quartiles Q1 (n = 25), Q2 (n = 24), Q3 (n = 24), and Q4 (n = 25). There were no statistically significant differences in OS among groups (Figure 6A) according to a log-rank test (P = 0.12) (Table 5, left panel). However, the Q4 group presented with poor ESCC prognosis at 5–60 wks post-surgery (Figure 6B). The foregoing results show that the highest serum BRAT1-Ab levels (Q4) were associated with poor ESCC prognosis.

Figure 6 Comparison of overall survivals of the patients with ESCC according to BRAT1-Abs levels. Kaplan-Meier plots are shown. The number of patients was shown in parentheses. (A) The BRAT1-Abs levels were classified into every one-fourth quartiles according to antigen level (Q1, Q2, Q3 and Q4). (B) The BRAT1-Abs levels were classified into two groups (Q1+Q1+Q3 vs. Q4). The p value at 60 months after surgery was 0.12. Log-Rank test was performed to compare the difference between two groups.
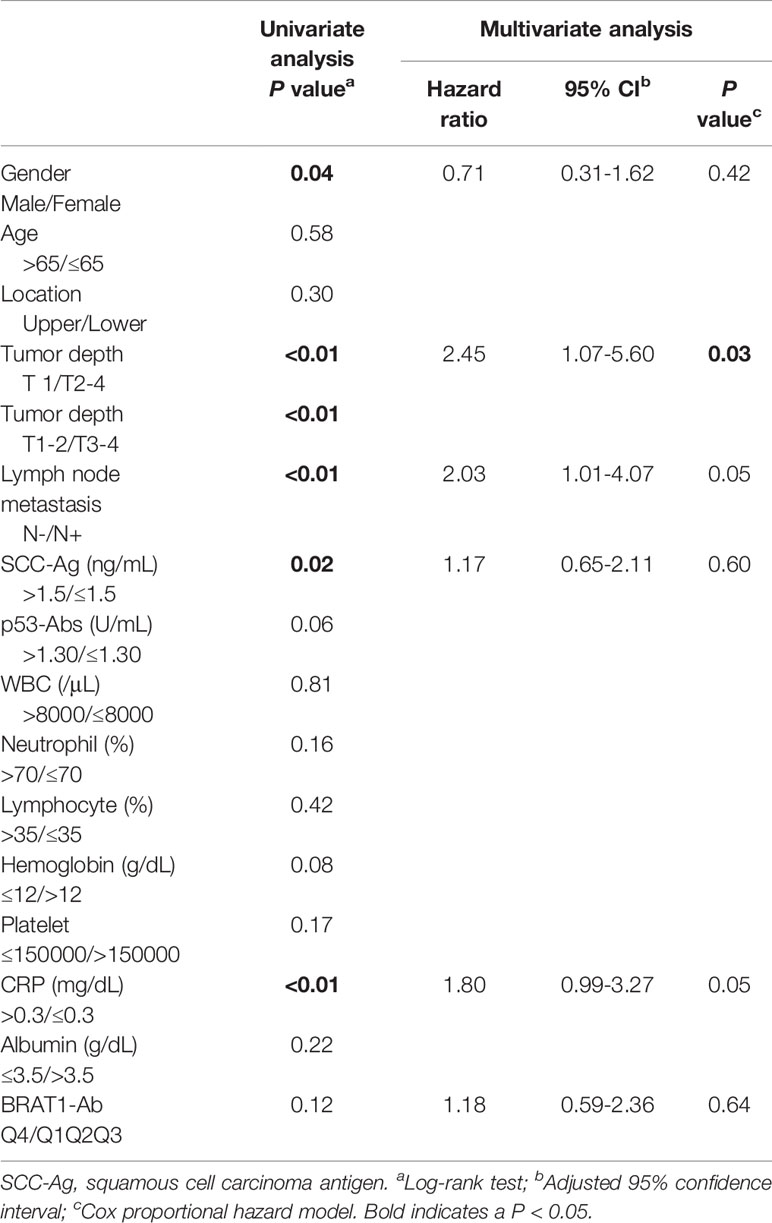
Table 5 Univariate and multivariate analysis of risk factors for overall survival in the patients with ESCC.
High Serum BRAT1-Ab Levels Are Correlated With Clinicopathological Factors
We applied various statistical methods to investigate the correlations among the serum BRAT1-Ab levels and the clinicopathological factors. In a Cox proportional hazards regression analysis, tumor depth, SCC-Ag, and BRAT1-Ab were the explanatory variables and gender, age, location, lymph node metastasis, p53-Abs level, WBC, neutrophils, lymphocytes, hemoglobin, platelets, CRP, and albumin were tested (Table 5). A multivariate survival analysis only disclosed statistically significant correlations between the serum BRAT1-Ab levels and lymph node metastasis (P = 0.05), CRP level (P = 0.05), and tumor depth (P = 0.03). Hence, these parameters were designated as independent prognostic factors (Table 5, right panel).
Fisher’s exact probability test showed that the BRAT1-Ab levels were not associated with the aforementioned factors (Table 6, left panel). A logistic regression analysis demonstrated that platelet count was significantly correlated with high serum BRAT1-Ab levels (Table 6, right panel). A Mann-Whitney U test returned similar results for the associations between the foregoing clinicopathological factors and the median BRAT1−Ab levels in ESCC. Only platelet count and high serum BRAT1-Ab level were significantly correlated (Table 7).
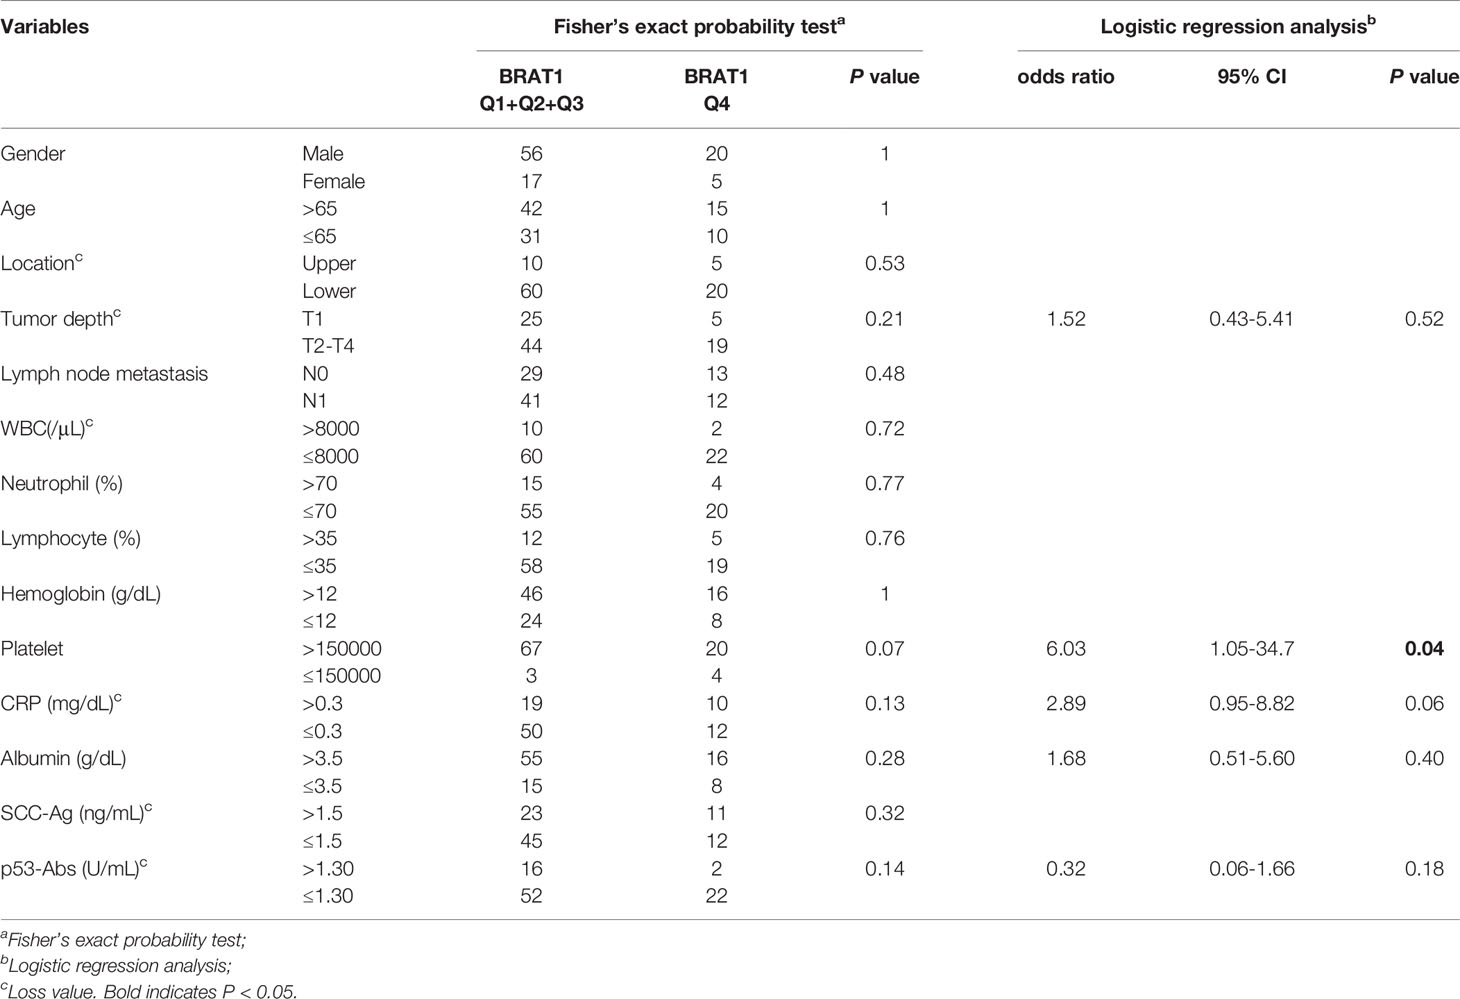
Table 6 Comparison of serum BRAT1-Abs levels quartiles according to clinicopathological characters of the patients with ESCC.
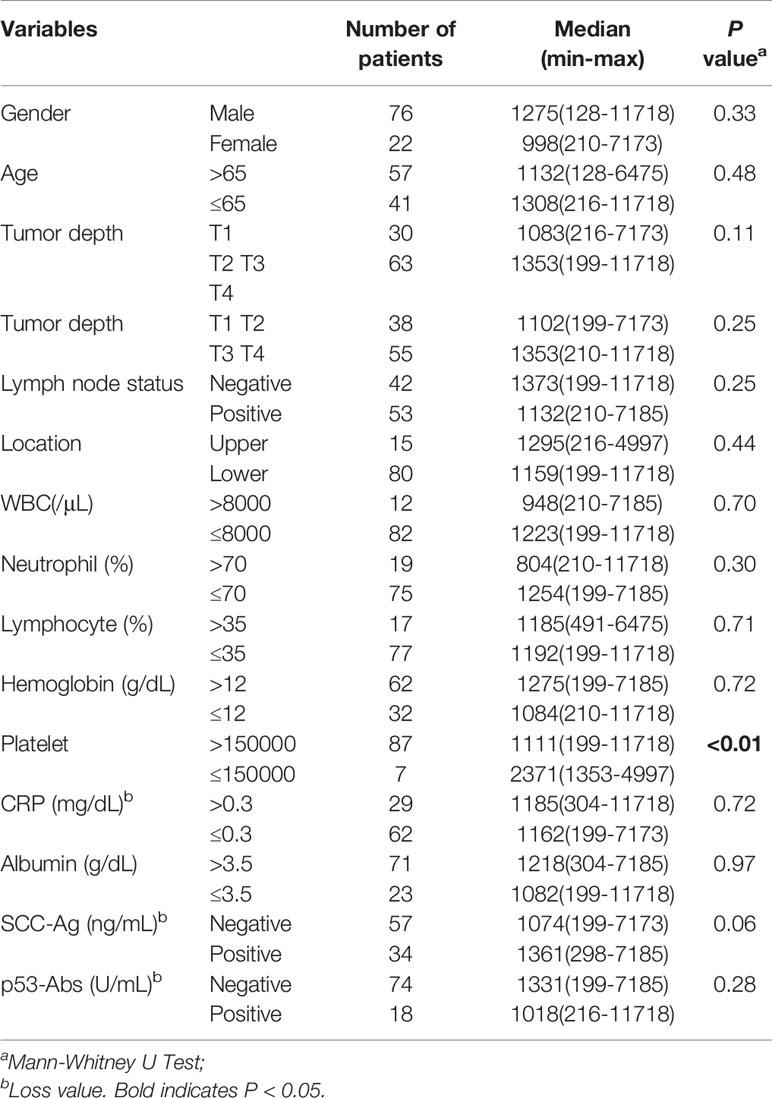
Table 7 Comparison of serum BRAT1-Ab levels median according to clinicopathological characters of the patients with ESCC.
Discussion
As cancers and AS-associated disease pathogenesis share common modifiable risk factors, predictive strategies of atherosclerotic vascular disease could also conceivably be used to detect cancers (50–52). We applied western blot on the sera of patients with TIA, used SEREX screening, and identified the antigens BRAT1 and WDR1 (Figure 1). Subsequent analyses established elevated serum BRAT1-Abs and WDR1-Abs in patients with TIA, aCI, oCI, and AMI but not in those with DM compared with HDs (Tables 1, 3; Figures 2A, B, 3A, B). ROC and Spearman’s correlation analyses showed that BRAT1-Abs and WDR1-Abs could detect atherosclerotic vascular diseases (Figures 2 and 3). For this reason, serum BRAT1-Abs and WDR1-Abs are potential AS biomarkers. We used online databases and AlphaLISA detection to compare protein (Figure 4) and serum antibody (Figure 5A) expression levels and found BRAT1 and BRAT1-Abs upregulation in patients with GI cancers. Significant increases > 0.6 were always observed for the AUCs of BRAT1-Ab vs. the GI cancers ESCC, GC, and CRC (Figures 5B–D; Supplementary Figures 1B–D). Thus, BRAT1-Ab more effectively predicts GI cancers than WDR1-Ab. A log-rank test revealed no significant differences in OS among the Q1+Q2+Q3 and Q4 groups (P = 0.12) (Table 5, left panel). Nevertheless, the highest serum BRAT1-Ab levels (Q4 group) were associated with poor prognosis at 5–60 wks after ESCC surgery (Figure 6). We verified the foregoing conclusion by comparing serum BRAT1-Ab levels among ESCC patients according to their clinicopathological characteristics. Multiple statistical strategies demonstrated and confirmed a correlation between the BRAT1-Ab level and the platelet count (Tables 5–7). To the best of our knowledge, this study is the first to determine by AlphaLISA detection that serum BRAT1-Ab and WDR1-Ab are elevated in patients with atherosclerotic diseases and can be used as predictors for them. Furthermore, the AS-related biomarker BRAT1-Ab could serve as a predictive risk marker for GI cancers.
As obesity and insulin resistance have become epidemic, there is growing evidence that hypertriglyceridemia is a risk factor for AS (53). Spearman’s correlation analysis was performed to examine the associations among the serum BRAT1-Ab and WDR1-Ab levels and the indices for HDs and TIA, aCI, and oCI patients (Table 2). The levels of both BRAT1-Ab and WDR1-Ab were correlated with most atherosclerotic parameters. In contrast, TG was negatively associated with the WDR1-Ab level. Therefore, the WDR1-Ab levels may not directly reflect AS. Rather, they might indirectly reflect the lesions caused by AS. Moreover, BRAT1-Ab may be a better predictor of atherosclerotic diseases than WDR1-Ab.
Platelets regulate thrombosis and hemostasis. Nevertheless, a few studies suggested that crosstalk between tumor cells and platelets facilitates cancer progression and metastasis (54, 55). Tumorigenesis is accompanied by thrombosis and thromboembolism. Hence, platelet-tumor aggregates regulate platelet function by and altering their cancer-mediated and releasing platelet granules (56, 57). Platelets also activate endothelial cells, recruit immunocytes, and facilitate tumor cell spread (58). Platelets enhance tumor growth, invasion, and metastasis by promoting proliferation, antiapoptosis, pro-angiogenic signals, and the invasive tumor cell epithelial-mesenchymal transition (EMT) phenotype (59–62). Activated platelets also secrete transforming growth factor β (TGF-β) into the tumor microenvironment (TME), suppress tumor immunity, and favor cancer cell evasion of the host immune system (63). As there is complex, bidirectional communication between platelets and cancer cells, platelet count elevation is an important cancer marker in primary care. Even a marginal increase in platelet count is correlated with a clinically relevant increase in cancer risk (64). In GI cancers, the upregulation of platelet-dependent signaling and tyrosine phosphatase facilitates changes in aggressive cancer phenotypes (65). Platelet count elevation indicates poor OS and is a predictive biomarker of digestive malignant tumors (66). Platelet activation is correlated with locally advanced ESCC and predicts long-term OS especially in nodal-positive patients (67, 68). Here, logistic regression analysis (Table 6) and Mann-Whitney U tests (Table 7) revealed that the BRAT1-Ab levels were significantly correlated with the platelet counts in ESCC. There is no direct evidence for any correlation between the BRAT1 levels and the platelet counts. Nevertheless, the foregoing results demonstrate that BRAT1 plays a crucial role in GI cancers such as ESCC.
A previous study reported a progressive linear relationship between increased platelet count and EC stage. While patients in the more advanced stages presented with thrombocytosis, those in the earlier stages did not (81.81% in stage III and 100% in stage IV). Patients with thrombocytosis also had pathological lymph node metastases (69). Platelet counts were significantly elevated in patients with deep and large tumors. High platelet counts were associated with tumor progression and low survival rates in patients with EC (70, 71). Contrastingly, platelet counts were significantly reduced in patients undergoing neoadjuvant chemoradiotherapy (CRT). Hence, platelet counts could help estimate the response of patients with EC to CRT (72). Patients with EC who are undergoing concurrent chemoradiotherapy usually present with thrombocytopenia (73). Contrastingly, platelets are key growth factor sources and could promote tumor angiogenesis and invasion. Hence, EC development may rely on platelet-mediated growth factor signal transduction (72, 74). Therefore, EC treatment might benefit patients by reducing platelet counts (74). In conclusion, platelet count is associated with tumor progression in EC, helps predict therapeutic outcomes, and could be utilized in multimodal treatment regimens to provide precise personalized cancer treatment (75).
BRAT1 is a binding partner of BRCA1 and participates in mitochondrial homeostasis, DNA damage response, and cell growth apoptosis (76). In BRAT1 knockout (KO) cancer cell lines, the ROS levels were increased and mitochondrial membrane potential and ATP production decreased. Therefore, BRAT1 plays key roles in cancer cell mitochondrial function (77). Moreover, BRAT1 protein is oncogenic in several different cancers (78). In vitro and in vivo cell proliferation and tumorigenicity were significantly reduced in BRAT1 KO cancer cell lines (77). Curcusone D promoted DNA repair and inhibited cancer cell migration by downregulating BRAT1 (78). Mitochondrial function plays important roles in AS diseases and cancers. In fact, mitochondrial dysfunction has been observed in both conditions (79–81). No correlation between BRAT1 and AS has been reported. However, BRAT1 may play vital roles in AS and cancer by influencing mitochondrial function.
Oxidative stress-induced DNA damage is associated with both AS and cancer pathogenesis and promotes their progression (51, 82, 83). The stress-induced DNA double-strand breaks upregulate endogenous BRAT1, which, in turn, increases cell survival by regulating ATM phosphorylation (84). BRAT1 overexpression may stimulate an autoimmune response and induce AS- and GI cancer-associated BRAT1 autoantibodies. This mechanism might explain why serum BRAT1-Abs levels are elevated in patients with AS and GI cancers (Figures 2, 5; Table 2).
The immune system participates in pathophysiological processes and promotes increase in the levels of certain autoantibodies (85). Possible mechanisms causing elevated autoantibody levels in tumors include host immune responses to tumor-associated antigens (TAAs), pathological immune dysregulation, and antigenic stimulation induced by malignant cell destruction (86). AS is associated with chronic inflammation, has characteristics resembling those of autoimmune diseases, and is always accompanied by the formation of various antigens such as oxidized low-density lipoproteins (LDL) and heat shock proteins (HSP) related to autoimmunity (17). The levels of autoantibodies against LDL and HSP increase in the sera of patients with atherosclerotic diseases (87).
Autoantibodies are highly stable (half-life ≤ 30 d) and durable in serum samples (88). The immune system amplifies certain autoantibodies in response to a single autoantigen. Repeated exposure of immunocytes to even small amounts of antigen induces abundant antibody production and may raise serum autoantibody levels. Antibody biomarkers increase detectable signals of their corresponding antigens, are more sensitive than antigen markers, and are, therefore, potential diagnostic markers (85, 89). Tumor-associated autoantibodies are produced early during tumorigenesis, can be measured before clinical symptoms appear (90), are early indicators of abnormal cellular processes during tumorigenesis, and are associated with malignant transformations (91). The early stages of AS are sometimes accompanied by low levels of tissue destruction, protein leakage from disrupted cells, and elevated autoantibody expression (92). AS autoantibodies are the driving factors of inflammation, risk factors of AS-related diseases, and protective (anti-AS) factors. Hence, they are closely related to AS occurrence and development (93) and could be used in early disease screening and to monitor disease progression (94).
Here, BRAT1-Ab was screened by liquid biopsy SEREX analysis and identified in patients with TIA which is a prodromal AS symptom. BRAT1-Ab was consistently upregulated in AS-related diseases and GI cancers. Serum BRAT1-Ab is a potential diagnostic biomarker of TIA, aCI, oCI, AMI, ESCC, GC, and CRC. BRAT1-Ab upregulation may predict the early onset of AS and GI cancers. Furthermore, early BRAT1-Ab detection could help prevent disease onset and support the application of liquid biopsy in AS and GI cancers.
Data Availability Statement
The original contributions presented in the study are included in the article/Supplementary Material. Further inquiries can be directed to the corresponding authors.
Ethics Statement
This study involving human participants was reviewed and approved by the Local Ethical Review Board of the Graduate School of Medicine, Chiba University (No. 2012–438, No. 2014–44, No. 2016–86, No. 2017–251, No. 2018–320, No. 2020–1129) and Jinan University (JNUKY-2021-045), and Ethics Committee of Toho University, Graduate School of Medicine (nos. A19033), as well as the cooperating Chiba Prefectural Sawara Hospital, Chiba Rosai Hospital, Chiba Aoba Municipal Hospital, and Port Square Kashiwado Clinic (Japan). Recombinant DNA studies were performed with the official permission of the Graduate School of Medicine (Chiba University, Japan) and Jinan University (China), and conducted in conformity with the rules of the Japanese and Chinese government. The patients/participants provided their written informed consent to participate in this study.
Author Contributions
All authors contributed to the article and approved the submitted version. LH, JYL, HW, and SS contributed to the project development and research, manuscript writing. QZ, JSL, and KS edited the manuscript. TH, HW, KS, HS, and MI collected the serum sample. TH, HW, LH, HS, and MI contributed toward the statistical analysis of this work. LH, JYL interpreted the data.
Funding
This study was funded by National Science Foundation, China (Grant No. 82071340); Natural Science Foundation of Guangdong Province, China (Grant No. 2018A0303131003); Medical Science and Technology Research Fund of Guangdong Province, China (Grant No. A2019550).
Conflict of Interest
The authors declare that the research was conducted in the absence of any commercial or financial relationships that could be construed as a potential conflict of interest.
Publisher’s Note
All claims expressed in this article are solely those of the authors and do not necessarily represent those of their affiliated organizations, or those of the publisher, the editors and the reviewers. Any product that may be evaluated in this article, or claim that may be made by its manufacturer, is not guaranteed or endorsed by the publisher.
Acknowledgments
We thank all the members for participating in this study. We would like to thank Editage (www.editage.cn) for English language editing.
Supplementary Material
The Supplementary Material for this article can be found online at: https://www.frontiersin.org/articles/10.3389/fonc.2022.870086/full#supplementary-material
References
1. Charo IF, Taub R. Anti-Inflammatory Therapeutics for the Treatment of Atherosclerosis. Nat Rev Drug Discov (2011) 10:365–76. doi: 10.1038/nrd3444
2. Libby P. The Changing Landscape of Atherosclerosis. Nature (2021) 592:524–33. doi: 10.1038/s41586-021-03392-8
3. Herrington W, Lacey B, Sherliker P, Armitage J, Lewington S. Epidemiology of Atherosclerosis and the Potential to Reduce the Global Burden of Atherothrombotic Disease. Circ Res (2016) 118:535–46. doi: 10.1161/CIRCRESAHA.115.307611
4. Sung H, Ferlay J, Siegel RL, Laversanne M, Soerjomataram I, Jemal A, et al. Global Cancer Statistics 2020: GLOBOCAN Estimates of Incidence and Mortality Worldwide for 36 Cancers in 185 Countries. CA Cancer J Clin (2021) 71:209–49. doi: 10.3322/caac.21660
5. Arnold M, Abnet CC, Neale RE, Vignat J, Giovannucci EL, McGlynn KA, et al. Global Burden of 5 Major Types of Gastrointestinal Cancer. Gastroenterology (2020) 159:335–349.e15. doi: 10.1053/j.gastro.2020.02.068
6. Masoudkabir F, Sarrafzadegan N, Gotay C, Ignaszewski A, Krahn AD, Davis MK, et al. Cardiovascular Disease and Cancer: Evidence for Shared Disease Pathways and Pharmacologic Prevention. Atherosclerosis (2017) 263:343–51. doi: 10.1016/j.atherosclerosis.2017.06.001
7. Leiva O, AbdelHameid D, Connors JM, Cannon CP, Bhatt DL. Common Pathophysiology in Cancer, Atrial Fibrillation, Atherosclerosis, and Thrombosis: JACC: CardioOncology State-Of-the-Art Review. JACC Cardio Oncol (2021) 3:619–34. doi: 10.1016/j.jaccao.2021.08.011
8. Wu WK, Ivanova EA, Orekhov AN. Gut Microbiome: A Possible Common Therapeutic Target for Treatment of Atherosclerosis and Cancer. Semin Cancer Biol (2021) 70:85–97. doi: 10.1016/j.semcancer.2020.06.017
9. Zi F, Zi H, Li Y, He J, Shi Q, Cai Z. Metformin and Cancer: An Existing Drug Q27 for Cancer Prevention and Therapy. Oncol Lett (2018) 15:683–90. doi: 10.3892/ol.2017.7412
10. Chan AT, McNeil J. Aspirin and Cancer Prevention in the Elderly: Where Do We Go From Here? Gastroenterology (2019) 156:534–8. doi: 10.1053/j.gastro.2018.11.063
11. Jeong GH, Lee KH, Kim JY, Eisenhut M, Kronbichler A, van derVliet HJ, et al. Statin and Cancer Mortality and Survival: An Umbrella Systematic Review and Meta-Analysis. J Clin Med (2020) 9:326–45. doi: 10.3390/jcm9020326
12. Dzaye O, Berning P, Dardari ZA, Mortensen MB, Marshall CH, Nasir K, et al. Coronary Artery Calcium is Associated With Increased Risk for Lung and Colorectal Cancer in Men and Women: The Multi-Ethnic Study of Atherosclerosis (MESA). Eur Heart J Cardiovasc Imaging (2021) 23:708–16. doi: 10.1093/ehjci/jeab099
13. Yang SY, Kim YS, Chung SJ, Song JH, Choi SY, Park MJ, et al. Association Between Colorectal Adenoma and Coronary Atherosclerosis Detected by CT Coronary Angiography in Korean Men; a Cross-Sectional Study. J Gastroenterol Hepatol (2010) 25:1795–9. doi: 10.1111/j.1440-1746.2010.06330.x
14. Eikelboom JW, Connolly SJ, Bosch J, Shestakovska O, Aboyans V, Alings M, et al. Bleeding and New Cancer Diagnosis in Patients With Atherosclerosis. Circulation (2019) 140:1451–9. doi: 10.1161/CIRCULATIONAHA.119.041949
15. Rolfo C, Russo A. Liquid Biopsy for Early Stage Lung Cancer Moves Ever Closer. Nat Rev Clin Oncol (2020) 17:523–4. doi: 10.1038/s41571-020-0393-z
16. Ignatiadis M, Sledge GW, Jeffrey SS. Liquid Biopsy Enters the Clinic - Implementation Issues and Future Challenges. Nat Rev Clin Oncol (2021) 18:297–312. doi: 10.1038/s41571-020-00457-x
17. Kobiyama K, Ley K. Atherosclerosis. Circ Res (2018) 123:1118–20. doi: 10.1161/CIRCRESAHA.118.313816
18. Lorenzo C, Delgado P, Busse CE, Sanz-Bravo A, Martos-Folgado I, Bonzon-Kulichenko E, et al. ALDH4A1 is an Atherosclerosis Auto-Antigen Targeted by Protective Antibodies. Nature (2021) 589:287–92. doi: 10.1038/s41586-020-2993-2
19. Sahin U, Türeci O, Schmitt H, Cochlovius B, Johannes T, Schmits R, et al. Human Neoplasms Elicit Multiple Specific Immune Responses in the Autologous Host. Proc Natl Acad Sci USA (1995) 92:11810–3. doi: 10.1073/pnas.92.25.11810
20. Shimada H, Kuboshima M, Shiratori T, Nabeya Y, Takeuchi A, Takagi H, et al. Serum Anti-Myomegalin Antibodies in Patients With Esophageal Squamous Cell Carcinoma. Int J Oncol (2007) 30:97–103. doi: 10.3892/ijo.30.1.97
21. Shimada H, Kagaya A, Shiratori T, Nomura F, Takiguchi M, Matsubara H, et al. Detection of Anti-CUEC-23 Antibodies in Serum of Patients With Esophageal Squamous Cell Carcinoma: A Possible New Serum Marker for Esophageal Cancer. J Gastroenterol (2009) 44:691–6. doi: 10.1007/s00535-009-0060-8
22. Ito M, Hiwasa T, Oshima Y, Yajima S, Suzuki T, Nanami T, et al. Identification of Serum Anti−Striatin 4 Antibodies as a Common Marker for Esophageal Cancer and Other Solid Cancers. Mol Clin Oncol (2021) 15:237–45. doi: 10.3892/mco.2021.2399
23. Kobayashi S, Hiwasa T, Ishige T, Kano M, Hoshino T, Rahmutulla B, et al. Anti-FirΔexon2 Autoantibody as a Novel Indicator for Better Overall Survival in Gastric Cancer. Cancer Sci (2021) 112:847–58. doi: 10.1111/cas.14767
24. Wang K, Xu X, Nie Y, Dai L, Wang P, Zhang J. Identification of Tumor-Associated Antigens by Using SEREX in Hepatocellular Carcinoma. Cancer Lett (2009) 281:144–50. doi: 10.1016/j.canlet.2009.02.037
25. Gerhardt A, Usener D, Keese M, Sturm J, Schadendorf D, Eichmüller S. Tissue Expression and Sero-Reactivity of Tumor-Specific Antigens in Colorectal Cancer. Cancer Lett (2004) 208:197–206. doi: 10.1016/j.canlet.2003.11.021
26. Heller A, Zörnig I, Müller T, Giorgadze K, Frei C, Giese T, et al. Immunogenicity of SEREX-Identified Antigens and Disease Outcome in Pancreatic Cancer. Cancer Immunol Immunother (2010) 59:1389–400. doi: 10.1007/s00262-010-0870-9
27. Muto M, Mori M, Hiwasa T, Takiguchi M, Iwadate Y, Uzawa A, et al. Novel Serum Autoantibodies Against Talin1 in Multiple Sclerosis: Possible Pathogenetic Roles of the Antibodies. J Neuroimmunol (2015) 284:30–6. doi: 10.1016/j.jneuroim.2015.05.005
28. Jeoung DI, Bong Lee E, Lee S, Lim Y, Lee DY, Kim J, et al. Autoantibody to DNA Binding Protein B as a Novel Serologic Marker in Systemic Sclerosis. Biochem Biophys Res Commun (2002) 299:549–54. doi: 10.1016/S0006-291X(02)02685-2
29. Jeoung D, Lim Y, Lee EB, Lee S, Kim HY, Lee H, et al. Identification of Autoantibody Against Poly (ADP-Ribose) Polymerase (PARP) Fragment as a Serological Marker in Systemic Lupus Erythematosus. J Autoimmun (2004) 22:87–94. doi: 10.1016/j.jaut.2003.10.009
30. Maciejewska-Rodrigues H, Al-Shamisi M, Hemmatazad H, Ospelt C, Bouton MC, Jäger D, et al. Functional Autoantibodies Against Serpin E2 in Rheumatoid Arthritis. Arthritis Rheum (2010) 62:93–104. doi: 10.1002/art.25038
31. Hiwasa T, Wang H, Goto KI, Mine S, Machida T, Kobayashi E, et al. Serum Anti-DIDO1, Anti-CPSF2, and Anti-FOXJ2 Antibodies as Predictive Risk Markers for Acute Ischemic Stroke. BMC Med (2021) 19:131. doi: 10.1186/s12916-021-02001-9
32. Wang H, Zhang XM, Tomiyoshi G, Nakamura R, Shinmen N, Kuroda H, et al. Association of Serum Levels of Antibodies Against MMP1, CBX1, and CBX5 With Transient Ischemic Attack and Cerebral Infarction. Oncotarget (2018) 9:5600–13. doi: 10.18632/oncotarget.23789
33. Lu H, Mai M, Guan M, Sugimoto K, Wu S, Wang F, et al. Cross Correlation Statistical Study of Biomarker for Cerebral Infarction. J Med Imaging Health Inf (2019) 9:1272–7. doi: 10.1166/jmihi.2019.2714
34. Hiwasa T, Zhang X-M, Kimura R, Machida T, Kitamura K, Yamazoe R, et al. Association of Serum Antibody Levels Against TUBB2C With Diabetes and Cerebral Infarction. Gratis J BioMed Sci (2015) 1:49–63. doi: 10.18314/gjbs.v1i2.27
35. Sumazaki M, Shimada H, Ito M, Shiratori F, Kobayashi E, Yoshida Y, et al. Serum Anti-LRPAP1 is a Common Biomarker for Digestive Organ Cancers and Atherosclerotic Diseases. Cancer Sci (2020) 111:4453–64. doi: 10.1111/cas.14652
36. Li SY, Yoshida Y, Kobayashi E, Adachi A, Hirono S, Matsutani T, et al. Association Between Serum Anti—ASXL2 Antibody Levels and Acute Ischemic Stroke, Acute Myocardial Infarction, Diabetes Mellitus, Chronic Kidney Disease and Digestive Organ Cancer, and Their Possible Association With Atherosclerosis and Hypertension. Int J Mol Med (2020) 46:1274–88. doi: 10.3892/ijmm.2020.4690
37. Ito M, Hiwasa T, Oshima Y, Yajima S, Suzuki T, Nanami T, et al. Association of Serum Anti-PCSK9 Antibody Levels With Favorable Postoperative Prognosis in Esophageal Cancer. Front Oncol (2021) 11:708039. doi: 10.3389/fonc.2021.708039
38. Kobayashi S, Hiwasa T, Arasawa T, Kagaya A, Ishii S, Shimada H, et al. Identification of Specific and Common Diagnostic Antibody Markers for Gastrointestinal Cancers by SEREX Screening Using Testis cDNA Phage Library. Oncotarget (2018) 9:18559–69. doi: 10.18632/oncotarget.24963
39. Wang H, Lu H, Zhang XM, Goto KI, Kobayashi E, Yoshida Y, et al. Association of Serum Levels of Antibodies Against ALDOA and FH4 With Transient Ischemic Attack and Cerebral Infarction. BMC Neurol (2021) 21:274. doi: 10.1186/s12883-021-02301-w
40. Beaudet L, Rodriguez-Suarez R, Venne M-H, Caron M, Bédard J, Brechler V, et al. AlphaLISA Immunoassays: The No-Wash Alternative to ELISAs for Research and Drug Discovery. Nat Methods (2008) 5:an8–9. doi: 10.1038/nmeth.f.230
41. Shimada H, Nabeya Y, Okazumi S, Matsubara H, Shiratori T, Gunji Y, et al. Prediction of Survival With Squamous Cell Carcinoma Antigen in Patients With Resectable Esophageal Squamous Cell Carcinoma. Surgery (2003) 133:486–94. doi: 10.1067/msy.2003.139
42. Shimada H, Ochiai T, Nomura F. Titration of Serum P53 Antibodies in 1,085 Patients With Various Types of Malignant Tumors: A Multiinstitutional Analysis by the Japan P53 Antibody Research Group. Cancer (2003) 97:682–9. doi: 10.1002/cncr.11092
43. Li T, Fan J, Wang B, Traugh N, Chen Q, Liu JS, et al. TIMER: A Web Server for Comprehensive Analysis of Tumor-Infiltrating Immune Cells. Cancer Res (2017) 77:e108–10. doi: 10.1158/0008-5472.CAN-17-0307
44. Li T, Fu J, Zeng Z, Cohen D, Li J, Chen Q, et al. TIMER2.0 for Analysis of Tumor-Infiltrating Immune Cells. Nucleic Acids Res (2020) 48:W509–14. doi: 10.1093/nar/gkaa407
45. Tang Z, Kang B, Li C, Chen T, Zhang Z. GEPIA2: An Enhanced Web Server for Large-Scale Expression Profiling and Interactive Analysis. Nucleic Acids Res (2019) 47:W556–60. doi: 10.1093/nar/gkz430
46. Tang Z, Li C, Kang B, Gao G, Li C, Zhang Z. GEPIA: A Web Server for Cancer and Normal Gene Expression Profiling and Interactive Analyses. Nucleic Acids Res (2017) 45:W98–102. doi: 10.1093/nar/gkx247
47. Bartha Á, Győrffy B. TNMplot.com: A Web Tool for the Comparison of Gene Expression in Normal, Tumor and Metastatic Tissues. Int J Mol Sci (2021) 22:2622–33. doi: 10.3390/ijms22052622
48. Chandrashekar DS, Bashel B, Balasubramanya SAH, Creighton CJ, Ponce-Rodriguez I, Chakravarthi B, et al. UALCAN: A Portal for Facilitating Tumor Subgroup Gene Expression and Survival Analyses. Neoplasia (2017) 19:649–58. doi: 10.1016/j.neo.2017.05.002
49. Hajian-Tilaki K. Receiver Operating Characteristic (ROC) Curve Analysis for Medical Diagnostic Test Evaluation. Caspian J Intern Med (2013) 4:627–35. https://pubmed.ncbi.nlm.nih.gov/24009950/
50. Raposeiras Roubín S, Cordero A. The Two-Way Relationship Between Cancer and Atherosclerosis. Rev Esp Cardiol (Engl Ed) (2019) 72:487–94. doi: 10.1016/j.rec.2018.12.010
51. Balzan S, Lubrano V. LOX-1 Receptor: A Potential Link in Atherosclerosis and Cancer. Life Sci (2018) 198:79–86. doi: 10.1016/j.lfs.2018.02.024
52. Tapia-Vieyra JV, Delgado-Coello B, Mas-Oliva J. Atherosclerosis and Cancer; A Resemblance With Far-Reaching Implications. Arch Med Res (2017) 48:12–26. doi: 10.1016/j.arcmed.2017.03.005
53. Talayero BG, Sacks FM. The Role of Triglycerides in Atherosclerosis. Curr Cardiol Rep (2011) 13:544–52. doi: 10.1007/s11886-011-0220-3
54. Braun A, Anders H-J, Gudermann T, Mammadova-Bach E. Platelet-Cancer Interplay: Molecular Mechanisms and New Therapeutic Avenues. Front Oncol (2021) 11:665534. doi: 10.3389/fonc.2021.665534
55. Geranpayehvaghei M, Dabirmanesh B, Khaledi M, Atabakhshi-Kashi M, Gao C, Taleb M, et al. Cancer-Associated-Platelet-Inspired Nanomedicines for Cancer Therapy. Wiley Interdiscip Rev Nanomed Nanobiotechnol (2021) 13:e1702–24. doi: 10.1002/wnan.1702
56. Haemmerle M, Stone RL, Menter DG, Afshar-Kharghan V, Sood AK. The Platelet Lifeline to Cancer: Challenges and Opportunities. Cancer Cell (2018) 33:965–83. doi: 10.1016/j.ccell.2018.03.002
57. Xu XR, Yousef GM, Ni H. Cancer and Platelet Crosstalk: Opportunities and Challenges for Aspirin and Other Antiplatelet Agents. Blood (2018) 131:1777–89. doi: 10.1182/blood-2017-05-743187
58. Schlesinger M. Role of Platelets and Platelet Receptors in Cancer Metastasis. J Hematol Oncol (2018) 11:1–15. doi: 10.1186/s13045-018-0669-2
59. Patel S, Nanavati P, Sharma J, Chavda V, Savjani J. Functional Role of Novel Indomethacin Derivatives for the Treatment of Hepatocellular Carcinoma Through Inhibition of Platelet-Derived Growth Factor. Arch Med Res (2021) 52:483–93. doi: 10.1016/j.arcmed.2021.01.005
60. Deuster E, Hysenaj I, Kahaly M, Schmoeckel E, Mayr D, Beyer S, et al. The Platelet-Activating Factor Receptor's Association With the Outcome of Ovarian Cancer Patients and its Experimental Inhibition by Rupatadine. Cells (2021) 10:2337–50. doi: 10.21203/rs.3.rs-589677/v1
61. Saha B, Mathur T, Tronolone JJ, Chokshi M, Lokhande GK, Selahi A, et al. Human Tumor Microenvironment Chip Evaluates the Consequences of Platelet Extravasation and Combinatorial Antitumor-Antiplatelet Therapy in Ovarian Cancer. Sci Adv (2021) 7:eabg5283. doi: 10.1126/sciadv.abg5283
62. Liu Y, Zhang Y, Ding Y, Zhuang R. Platelet-Mediated Tumor Metastasis Mechanism and the Role of Cell Adhesion Molecules. Crit Rev Oncol Hematol (2021) 167:103502. doi: 10.1016/j.critrevonc.2021.103502
63. Neuzillet C, Tijeras-Raballand A, Cohen R, Cros J, Faivre S, Raymond E, et al. Targeting the Tgfb Pathway for Cancer Therapy. Pharmacol Ther (2015) 147:22–31. doi: 10.1016/j.pharmthera.2014.11.001
64. Mounce LT, Hamilton W, Bailey SE. Cancer Incidence Following a High-Normal Platelet Count: Cohort Study Using Electronic Healthcare Records From English Primary Care. Br J Gen Pract (2020) 70:e622–8. doi: 10.3399/bjgp20X710957
65. Faria AVS, Yu B, Mommersteeg M, de Souza-Oliveira PF, Andrade SS, Spaander MCW, et al. Platelet-Dependent Signaling and Low Molecular Weight Protein Tyrosine Phosphatase Expression Promote Aggressive Phenotypic Changes in Gastrointestinal Cancer Cells. Biochim Biophys Acta Mol Basis Dis (2022) 1868:166280. doi: 10.1016/j.bbadis.2021.166280
66. Chen Y, Yang W, Ye L, Lin S, Shu K, Yang X, et al. Economical and Easily Detectable Markers of Digestive Tumors: Platelet Parameters. Biomark Med (2021) 15:157–66. doi: 10.2217/bmm-2020-0203
67. Feng JF, Huang Y, Lu WS, Chen QX. Preoperative Platelet Count in Esophageal Squamous Cell Carcinoma: Is it a Prognostic Factor? Langenbecks Arch Surg (2013) 398:1115–22. doi: 10.1007/s00423-013-1111-4
68. Sun SY, Zhao BQ, Wang J, Mo ZX, Zhao YN, Wang Y, et al. The Clinical Implications of Mean Platelet Volume and Mean Platelet Volume/Platelet Count Ratio in Locally Advanced Esophageal Squamous Cell Carcinoma. Dis Esophagus (2018) 31:1–6. doi: 10.1093/dote/dox125
69. Verma GR, Thiagarajan S, Gupta R, Kaman L, Das R, Kochhar R, et al. Thrombocytosis and Raised CRP Levels Predicts Advanced Stage in Esophageal Carcinoma. J Gastrointest Cancer (2015) 46:350–5. doi: 10.1007/s12029-015-9750-z
70. Shimada H, Oohira G, Okazumi S, Matsubara H, Nabeya Y, Hayashi H, et al. Thrombocytosis Associated With Poor Prognosis in Patients With Esophageal Carcinoma. J Am Coll Surg (2004) 198:737–41. doi: 10.1016/j.jamcollsurg.2004.01.022
71. Agoston AT, Srivastava A, Zheng Y, Bueno R, Odze RD, Szallasi Z. Paraneoplastic Thrombocytosis is Associated With Increased Mortality and Increased Rate of Lymph Node Metastasis in Oesophageal Adenocarcinoma. Pathology (2017) 49:471–5. doi: 10.1016/j.pathol.2017.04.001
72. Wu Y, Chen J, Zhao L, Li Q, Zhu J, Yang H, et al. Prediction of Pathologic Response to Neoadjuvant Chemoradiotherapy in Patients With Esophageal Squamous Cell Carcinoma Incorporating Hematological Biomarkers. Cancer Res Treat (2021) 53:172–83. doi: 10.4143/crt.2020.594
73. Huang YM, Wang CH, Huang JS, Tsai CS, Yeh KY, Lan YJ, et al. Treatment-Associated Severe Thrombocytopenia Affects Survival Rate in Esophageal Cancer Patients Undergoing Concurrent Chemoradiotherapy. Indian J Cancer (2015) 52:454–60. doi: 10.4103/0019-509X.176708
74. Ilhan-Mutlu A, Starlinger P, Perkmann T, Schoppmann SF, Preusser M, Birner P. Plasma Fibrinogen and Blood Platelet Counts are Associated With Response to Neoadjuvant Therapy in Esophageal Cancer. biomark Med (2015) 9:327–35. doi: 10.2217/bmm.14.111
75. Jagadesham VP, Lagarde SM, Immanuel A, Griffin SM. Systemic Inflammatory Markers and Outcome in Patients With Locally Advanced Adenocarcinoma of the Oesophagus and Gastro-Oesophageal Junction. Br J Surg (2017) 104:401–7. doi: 10.1002/bjs.10425
76. Scheffer IE, Boysen KE, Schneider AL, Myers CT, Mehaffey MG, Rochtus AM, et al. BRAT1 Encephalopathy: A Recessive Cause of Epilepsy of Infancy With Migrating Focal Seizures. Dev Med Child Neurol (2020) 62:1096–9. doi: 10.1111/dmcn.14428
77. So EY, Ouchi T. BRAT1 Deficiency Causes Increased Glucose Metabolism and Mitochondrial Malfunction. BMC Cancer (2014) 14:548. doi: 10.1186/1471-2407-14-548
78. Cui C, Dwyer BG, Liu C, Abegg D, Cai ZJ, Hoch DG, et al. Total Synthesis and Target Identification of the Curcusone Diterpenes. J Am Chem Soc (2021) 143:4379–86. doi: 10.1021/jacs.1c00557
79. Markin AM, Khotina VA, Zabudskaya XG, Bogatyreva AI, Starodubova AV, Ivanova E, et al. Disturbance of Mitochondrial Dynamics and Mitochondrial Therapies in Atherosclerosis. Life (Basel) (2021) 11:165–83. doi: 10.3390/life11020165
80. Vilne B, Skogsberg J, Foroughi Asl H, Talukdar HA, Kessler T, Björkegren JLM, et al. Network Analysis Reveals a Causal Role of Mitochondrial Gene Activity in Atherosclerotic Lesion Formation. Atherosclerosis (2017) 267:39–48. doi: 10.1016/j.atherosclerosis.2017.10.019
81. Manolis AS, Manolis AA, Manolis TA, Apostolaki NE, Apostolopoulos EJ, Melita H, et al. Mitochondrial Dysfunction in Cardiovascular Disease: Current Status of Translational Research/Clinical and Therapeutic Implications. Med Res Rev (2021) 41:275–313. doi: 10.1002/med.21732
82. Liontos M, Pateras IS, Evangelou K, Gorgoulis VG. The Tumor Suppressor Gene ARF as a Sensor of Oxidative Stress. Curr Mol Med (2012) 12:704–15. doi: 10.2174/156652412800792633
83. Gray K, Bennett M. Role of DNA Damage in Atherosclerosis–Bystander or Participant? Biochem Pharmacol (2011) 82:693–700. doi: 10.1016/j.bcp.2011.06.025
84. Ouchi M, Ouchi T. Regulation of ATM/DNA-PKcs Phosphorylation by BRCA1-Associated Baat1. Genes Cancer (2010) 1:1211–4. doi: 10.1177/1947601911404222
85. Yoshida Y, Hiwasa T, Machida T, Kobayashi E, Mine S, Matsushima J, et al. Elevation of Autoantibody in Patients With Ischemic Stroke. Neurol Med Chir (Tokyo) (2018) 58:303–10. doi: 10.2176/nmc.ra.2018-0022
86. Caron M, Choquet-Kastylevsky G, Joubert-Caron R. Cancer Immunomics Using Autoantibody Signatures for Biomarker Discovery. Mol Cell Proteomics (2007) 6:1115–22. doi: 10.1074/mcp.R600016-MCP200
87. Kubota M, Yoshida Y, Kobayashi E, Matsutani T, Li SY, Zhang BS, et al. Serum Anti-SERPINE1 Antibody as a Potential Biomarker of Acute Cerebral Infarction. Sci Rep (2021) 11:21772. doi: 10.1038/s41598-021-01176-8
88. Anderson KS, LaBaer J. The Sentinel Within: Exploiting the Immune System for Cancer Biomarkers. J Proteome Res (2005) 4:1123–33. doi: 10.1021/pr0500814
89. Yadav S, Kashaninejad N, Masud MK, Yamauchi Y, Nguyen NT, Shiddiky MJA. Autoantibodies as Diagnostic and Prognostic Cancer Biomarker: Detection Techniques and Approaches. Biosens Bioelectron (2019) 139:111315. doi: 10.1016/j.bios.2019.111315
90. Trivers GE, De Benedetti VM, Cawley HL, Caron G, Harrington AM, Bennett WP, et al. Anti-P53 Antibodies in Sera From Patients With Chronic Obstructive Pulmonary Disease can Predate a Diagnosis of Cancer. Clin Cancer Res (1996) 2:1767–75.
91. Tan HT, Low J, Lim SG, Chung MC. Serum Autoantibodies as Biomarkers for Early Cancer Detection. FEBS J (2009) 276:6880–904. doi: 10.1111/j.1742-4658.2009.07396.x
92. Li SY, Yoshida Y, Kobayashi E, Kubota M, Matsutani T, Mine S, et al. Serum Anti-AP3D1 Antibodies are Risk Factors for Acute Ischemic Stroke Related With Atherosclerosis. Sci Rep (2021) 11:13450. doi: 10.1038/s41598-021-92786-9
93. Iseme RA, McEvoy M, Kelly B, Agnew L, Walker FR, Handley T, et al. A Role for Autoantibodies in Atherogenesis. Cardiovasc Res (2017) 113:1102–12. doi: 10.1093/cvr/cvx112
Keywords: antibody biomarker, atherosclerosis, BRAT1, gastrointestinal cancer, liquid biopsy
Citation: Hu L, Liu J, Shimada H, Ito M, Sugimoto K, Hiwasa T, Zhou Q, Li J, Shen S and Wang H (2022) Serum Anti-BRAT1 is a Common Molecular Biomarker for Gastrointestinal Cancers and Atherosclerosis. Front. Oncol. 12:870086. doi: 10.3389/fonc.2022.870086
Received: 05 February 2022; Accepted: 05 April 2022;
Published: 17 May 2022.
Edited by:
Claudia Cardone, G. Pascale National Cancer Institute Foundation (IRCCS), ItalyReviewed by:
Roberto Giovannoni, University of Pisa, ItalyHussein H. Khachfe, University of Pittsburgh Medical Center, United States
Copyright © 2022 Hu, Liu, Shimada, Ito, Sugimoto, Hiwasa, Zhou, Li, Shen and Wang. This is an open-access article distributed under the terms of the Creative Commons Attribution License (CC BY). The use, distribution or reproduction in other forums is permitted, provided the original author(s) and the copyright owner(s) are credited and that the original publication in this journal is cited, in accordance with accepted academic practice. No use, distribution or reproduction is permitted which does not comply with these terms.
*Correspondence: Hao Wang, aGFvd2FuZ0BqbnUuZWR1LmNu; Si Shen, Y2VjaWx5c2hlbkAxMjYuY29t
†These authors have contributed equally to this work
 Liubing Hu
 Jiyue Liu
 Hideaki Shimada5
 Kazuo Sugimoto
 Takaki Hiwasa
 Qinghua Zhou
 Jianshuang Li
 Si Shen
 Hao Wang