 Azza M. Kamel
 Nahla M. Elsharkawy1
- 1Department of Clinical Pathology, National Cancer Institute, Cairo University, Cairo, Egypt
- 2Department of Medical Oncology, National Cancer Institute, Cairo University, Cairo, Egypt
Acute myeloid leukemia (AML) is a heterogenous disease in which the initiation and maintenance of the malignant clone is blamed on a rare population of leukemia stem cells (LSCs). The persistence of such a malignant population is referred to as measurable/minimal residual disease (MRD). Evaluation of MRD is the gold standard for follow-up of therapy and constitutes an independent prognostic parameter. As LSCs are the main contributor to the persistence of MRD, then MRD should correlate with the bulk of LSCs at the individual case level. MRD is measured at defined time points during therapy. However, LSCs can be evaluated at diagnosis, which ensures the advantage of early prediction of high-risk patients and allows for early therapeutic decisions. Using two simple four-color monoclonal antibody combinations (CD38/CD123/CD34/CD45 and CD90/CD133/CD45/CD33) and the prism function of the Coulter Navios flow cytometer, the frequency of LSC subsets was evaluated in 84 newly diagnosed adult AML patients. For each panel, 16 possible combinations were detected. Our results showed that there was extreme variability in the percentage of the LSC fraction between different cases, as well as at the individual case level. For each LSC subset, the median value was used to divide cases into low and high expressors. LSC subsets that showed an impact on overall survival (OS) and disease-free survival (DFS) included CD123+, CD 123+/CD34-, CD34-/CD38+/CD123+, CD34+/CD38-/CD123+, CD133+, and CD133+/CD33-. On multivariate analysis, only CD123 (p ≤ 0.001, SE = 0.266, HR = 2.8, 95% CI = 1.74.7) and CD133+/CD33- (p = 0.017, SE = 0.263, HR = 1.9, 95% CI = 1.1–3.1) retained their significance for OS. Likewise, only CD34+/CD38-/CD123+ (p ≤ 0.001, HR 2.3, SE: 0.499, 95% CI: 2.4–17.4) and CD133 (p = 0.015, HR 2.3, SE 0.34, 95% CI: 1.2–4.4) retained their statistical significance for DFS. The LSC frequency at diagnosis showed a moderate to strong correlation with MRD status at day 14 and day 28. In conclusion, the level of LSCs at diagnosis correlated with MRD status at day 14 and day 28 in AML patients and had a deleterious impact on OS and DFS. It may be used as an early marker for high-risk patients allowing for early therapeutic decisions.
1 Introduction
Acute myeloid leukemia (AML) is an extremely heterogeneous hematological malignant disease. Classification of AML integrates morphological, cytochemical, immunophenotypic, and molecular genetic characteristics; all these parameters are used to define prognostic subgroups to determine the line of therapy and predict prognosis (WHO, 2016).
However, among all prognostic factors, the most important is the response to therapy as indicated by minimal residual disease (1) currently called measurable residual disease (MRD). MRD is the single most important prognostic factor in both pediatric (2, 3) and adult acute lymphoblastic leukemia (4–6) as well as in AML (7, 8). The impact of MRD status on survival in all types of acute leukemia is well established, and it helps in determining the line of therapy including the decision of stem cell transplantation (5, 9). Targeting MRD to prevent relapse is one of the major challenges in treatment of acute leukemia (10).
However, the impact of MRD status on therapeutic outcome is not absolute; that is, some patients with an MRD-negative status may still suffer from relapse (11).
The methodology of MRD whether molecular or by flow cytometry relies on detecting residual leukemic cells at defined time points during therapy (12, 13). Flow cytometry, the most popular and practical methodology for detection of MRD, has two limitations. First, not all the cases express a leukemia-associated immune phenotype (LAIP) that can be used for follow-up. Second, not all leukemia cells equally contribute to the proliferative status responsible for maintaining the malignant population, ultimately leading to refractoriness or relapse. Malignant cells are extremely heterogeneous (14, 15) with only a fraction, of variable size in different patients, that is responsible for initiating (16) and maintaining the leukemic population as well as resistance to therapy and later to relapse (10, 17, 18). This population is now recognized as leukemia stem cells (LSCs); it has been suggested that detection of LSCs would reduce false-negative MRD results (19).
Leukemia is now considered to be a stem cell disease with its characteristic refractory nature being blamed on a rare population of CD34+/CD38- LSCs. Furthermore, LSCs are resistant to most current therapeutic measures, which make them an important area of research as a possible target to weaken acute leukemia’s ability to relapse and remain refractory to treatment.
Many studies have documented the impact of LSC frequency at diagnosis on the therapeutic outcome and survival in acute myeloid leukemia (17–21). So, we hypothesized that LSC frequency at diagnosis may be used as a surrogate marker for MRD status on follow-up. This will give an upfront prognostic indicator that might help early planning of an appropriate therapeutic strategy.
2 Material and Methods
2.1 Patients
This study comprised 84 newly diagnosed adult AML patients including 51 men (60.7%) and 33 women (39.3%) with an age range of 18–70 with a mean of 33.4 ± 11.9 and a median of 30 years. All patients presented to the Medical Oncology outpatient department, NCI, Cairo University. The study was approved by the IRB of NCI, Cairo University, and written informed consent was obtained from all patients. The study was performed according to the requirements of the Helsinki declaration and its amendments for studies involving human beings.
All patients, except M3, received the 3 + 7 protocol.
2.2 Methods
Patients were diagnosed according to standard parameters including the following:
● Full history and clinical examination;
● Complete blood picture;
● Bone marrow examination;
● Cytochemistry as relevant;
● The common fusion genes for AML including t(15;17), t(8;21), and inv (16) as well as FLT-3 ITD.
2.3 Flow Cytometric Studies
Monoclonal antibodies (Mo Ab) with different specificities as well as the corresponding isotype controls were used. Monoclonal antibodies were obtained from BD, Franklin Lakes, New Jersey, USA; Beckman Coulter, Miami, USA; and Miltenyi Biotec, Bergisch Gladbach, Germany. Acquisition and analysis were performed on a flow cytometer (Navios Cytometer, Beckman Coulter, Miami, USA).
2.3.1 Detection of Surface Markers by Direct Staining
The whole blood staining method was performed (22). In short, 10 µl of labeled Mo Ab was added to a 100-µl BM sample, incubated in the dark for 20 min, hemolyzed with a hemolyzing solution containing NH4CL, and washed with PBS then analyzed.
2.3.2 Detection of Intracellular Markers
One hundred µl of whole blood was lysed using a lysis solution for 10 min. Cells were washed once and resuspended in 1 ml of PBS. A mixture of 500 µl of 4% paraformaldehyde as fixative, 500 µl of PBS, and 5 µl of Tween 20 as detergent was added to the cells and incubated for 10 min. The cells were washed and 10 µl of Mo Ab added and incubated for 30 min at 4°C. Cells were washed, resuspended in 500 µl of PBS, and analyzed. Any antigen was considered positive when ≥20% of blast cells were stained above the negative control, except for CD34, CD10, and MPO where ≥10% was considered positive (22).
2.3.3 Minimal/Measurable Residual Disease Detection
A flow cytometric detection of MRD was done on EDTA bone marrow at day 14 and day 28.
After initial immunophenotyping at diagnosis, Mo Ab combinations were used to define leukemia-associated phenotypes (expressed on ≥50% of the cells). This step served to define a leukemia phenotypic fingerprint to be used in follow-up samples. At least 2 Ab combinations were used to minimize pitfalls due to phenotypic switches.
MRD studies were performed on erythrocyte-lysed whole BM. Six-color labeling was performed, and life gate analysis was used.
2.4 AML MRD Combination Panels
⊳ CD7/CD34/CD45/CD13/CD33/CD19
⊳ CD34/NG2/CD45/CD33/CD135/CD2
⊳ TDT/CD117/CD45/CD33/CD13/CD56
⊳ CD64/CD135/CD45/CD33/CyCD13/CyCD22
⊳ Any aberrant T-cell, B-cell, or NK marker could be included in the MRD panel at the individual case level.
Two panels were selected for each case according to the antigen expression pattern at diagnosis. The selected panels were run at diagnosis, day 14, and day 28.
2.5 Gating Strategy for IPT and Detection of MRD Panels
The sequential Boolean gating strategy was adopted. In AML cases, the cell population with primitive marker expression lies in a gate with low side scatter (SS) and dim CD45. Subsequently, the gated cells were analyzed for detection of various markers for initial IPT as well as for leukemia-associated immunophenotypes (LAIP). The rationale for MRD detection was to use a sequential gating strategy. Leukemic events were defined with a dot plot in a predetermined region; 500,000 CD 45+ events were acquired. At least 50 events should be present to be considered a cluster for MRD detection; back-gating was used to confirm their position in the forward scatter (Figure S1).
2.5.1 LSC Detection
Two four-color panels were used: CD38/CD123/CD34/CD45 and CD90/CD133/CD45/CD33.
The light-scattering characteristic of AML cells was examined as forward scatter (FS) vs. side scatter (SS) in the first histogram; 50,000 CD45+ events were acquired. The cell population with primitive marker expression lay in a gate with low SS and dim CD45 in the second histogram.
Analysis of the first panel was as follows: (CD38 FITC/CD123PE/CD34ECD/CD45PE-PC5): the gated cells were analyzed for CD34 vs. CD38 in the third and CD123 vs. CD45 in the fourth histogram (showing dim expression of CD123). The following populations were further calculated: total CD123, CD123+/CD34-, CD34+/CD38-/CD123+, CD34+/CD38-/CD123-, CD34+/CD38+/CD123+, CD34+/CD38+/CD123-, CD34-/CD38+/CD123+, CD34-/CD38+/123-, and CD34-/CD38-/CD D123+.
Analysis of the second panel was as follows (CD90 FITC/CD133PE/CD45ECD/CD33PE-PC5): the gated cells were analyzed for CD90 vs. CD133 in the third and CD45 vs. CD33 in the fourth histogram. The following populations were further calculated: total CD133, CD133+/CD33-, total CD90, CD90+/CD33-, CD90+/CD133-/CD33-, CD133+/CD90-/CD33-, and CD90+/CD133+/CD33-.
In all, both CD45+ and CD45-ve populations were included.
The analysis, for both panels, was done at the time of diagnosis, day 14, and day 28.
The prism function of the software was used to estimate the percentage of cell populations expressing different antigen combinations. The number of potential combinations equaled the square of the number of Mo Abs in the panel. The prism processor represents data from 1, 2, 3, and 4 Ab combinations presented as evenly spaced peaks in a single-parameter graph with 16 possible combinations. Each peak represents an Ab combination or phenotype. The first peak represents negative cells, the second peak represents cells that are positive for the first parameter and negative for all other parameters, and so on, with the last peak representing cells positive for the four Abs. The height of the peak is proportional to the number of events belonging to the phenotype represented by the peak.
An example of prism analysis of both panels is shown in Figures S2 and S3.
2.6 Statistical Methods
Statistical analysis was performed using SPSS version 21. The mean and standard deviation or the median and range were used for numerical data. Categorical data were summarized as percentages. Pearson’s correlation test was used for numerical data. Overall survival (OS) and disease-free survival (DFS) were analyzed by Kaplan–Meier curves and compared by log-rank tests. The Cox proportional hazard model was used for significant variables. All p-values are two-sided. p-values < 0.05 were considered significant.
3 Results
3.1 Patients’ Characteristics
In the current study, we evaluated LSC frequency at diagnosis in 84 newly diagnosed AML patients including 51 men (60.7%) and 33 women (39.3%) with an age range of 18–70 with a mean of 33.4 ± 11.9 and a median of 30 years. Hematological parameters are presented in Table 1. Normal cytogenetics were present in 61 cases (72.6%), t (8;21) in 14 (16.6%), inv 16 in 7 (8.4%), and t(15;17) in 4 (4.8%). Wild-type FLT3 was encountered in 63 and ITD in 21 cases. According to ELN risk stratification, 25 cases were in the favorable and 59 in the intermediate genetic category. Cases with t(15;17) were excluded from survival studies.
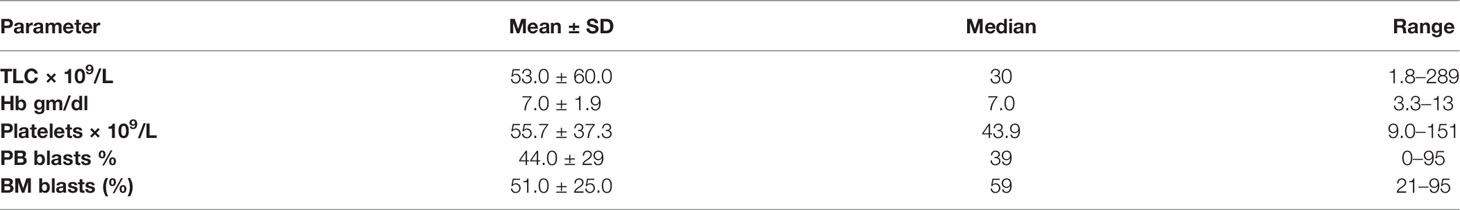
Table 1 Hematological parameters in 84 newly diagnosed acute myeloid leukemia cases.
3.2 Leukemia Stem Cell Frequency at Diagnosis
Using two simple four-color panels, we used the spike function of the software to determine the various patterns of expression of LSC marker combinations.
The leukemia stem cell subset frequency at diagnosis showed a marked variability according to different-marker(s) expression and for each marker within individual cases (Table 2).
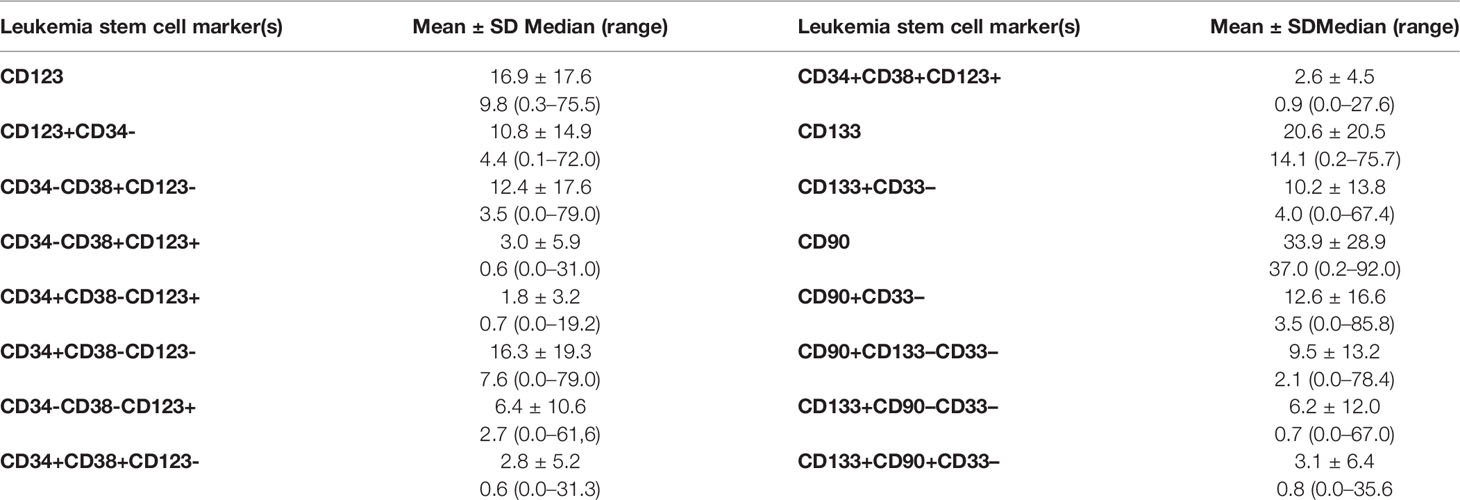
Table 2 Leukemia stem cell frequency at diagnosis in 84 acute myeloid leukemia patients.
No correlation was encountered between LSC frequency at diagnosis and any of the hematological parameters except for the correlation between both PB and BM blasts for CD133 (r = 0.27, p = 0.01; r = 0.36, p=0.001), CD133+/CD33- (r = 0.257, p = 0.019; r = 0.378, p = 0.001), and CD133+/CD90-/CD33- (r = .257, p = 0.019); r = 0.373, p = 0.001) respectively and the correlation of PB blasts with CD34+/CD38-/CD123+ (r = 0.315, p = 0.005) and CD34+/CD38-/CD123- (r = 0.338, p = 0.002).
3.3 Impact of LSC Frequency at Diagnosis on Overall Survival
The OS time for the whole group showed a mean ± SE of 6.7 ± 0.8 (CI: 5.1–8.2) and a median of 3.5 months. There was no impact of clinical or hematological parameters at diagnosis on OS in 80 adult acute myeloid leukemia patients.
According to the median value of different markers, cases were classified into high and low expressers. Markers that showed significant impact on overall survival are presented in Table 3 and Figures 1, 2. On multivariate analysis, only CD123 (p ≤ 0.001, SE = 0.266, HR = 2.8, 95% CI = 1.74.7) and CD133+/CD33- (p = 0.017, SE = 0.263, HR = 1.9, 95% CI = 1.1–3.1) retained statistical significance.
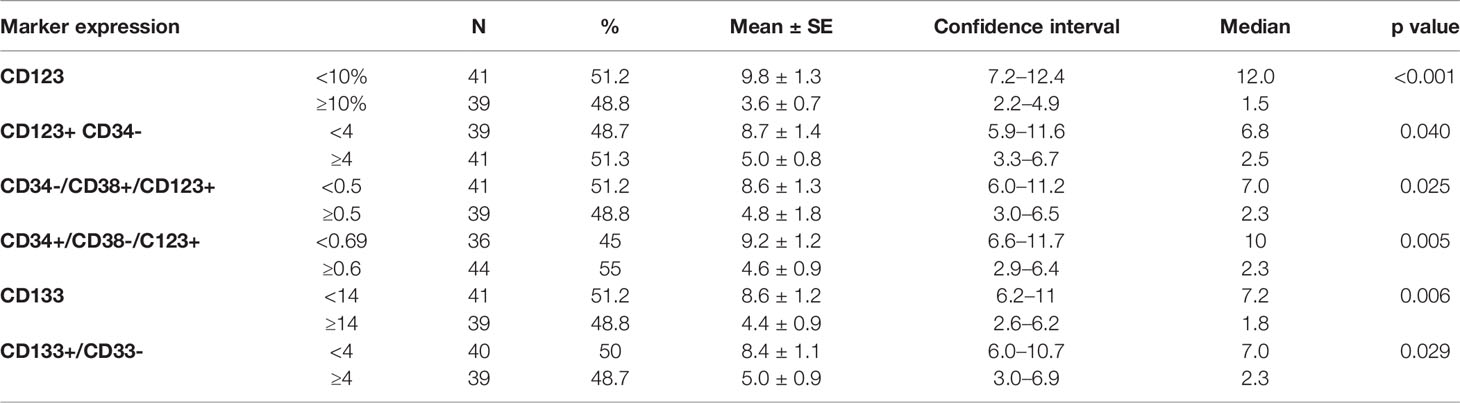
Table 3 Impact of leukemia stem cell frequency (CD34/CD38/CD123) at diagnosis on overall survival in 80 acute myeloid patients.
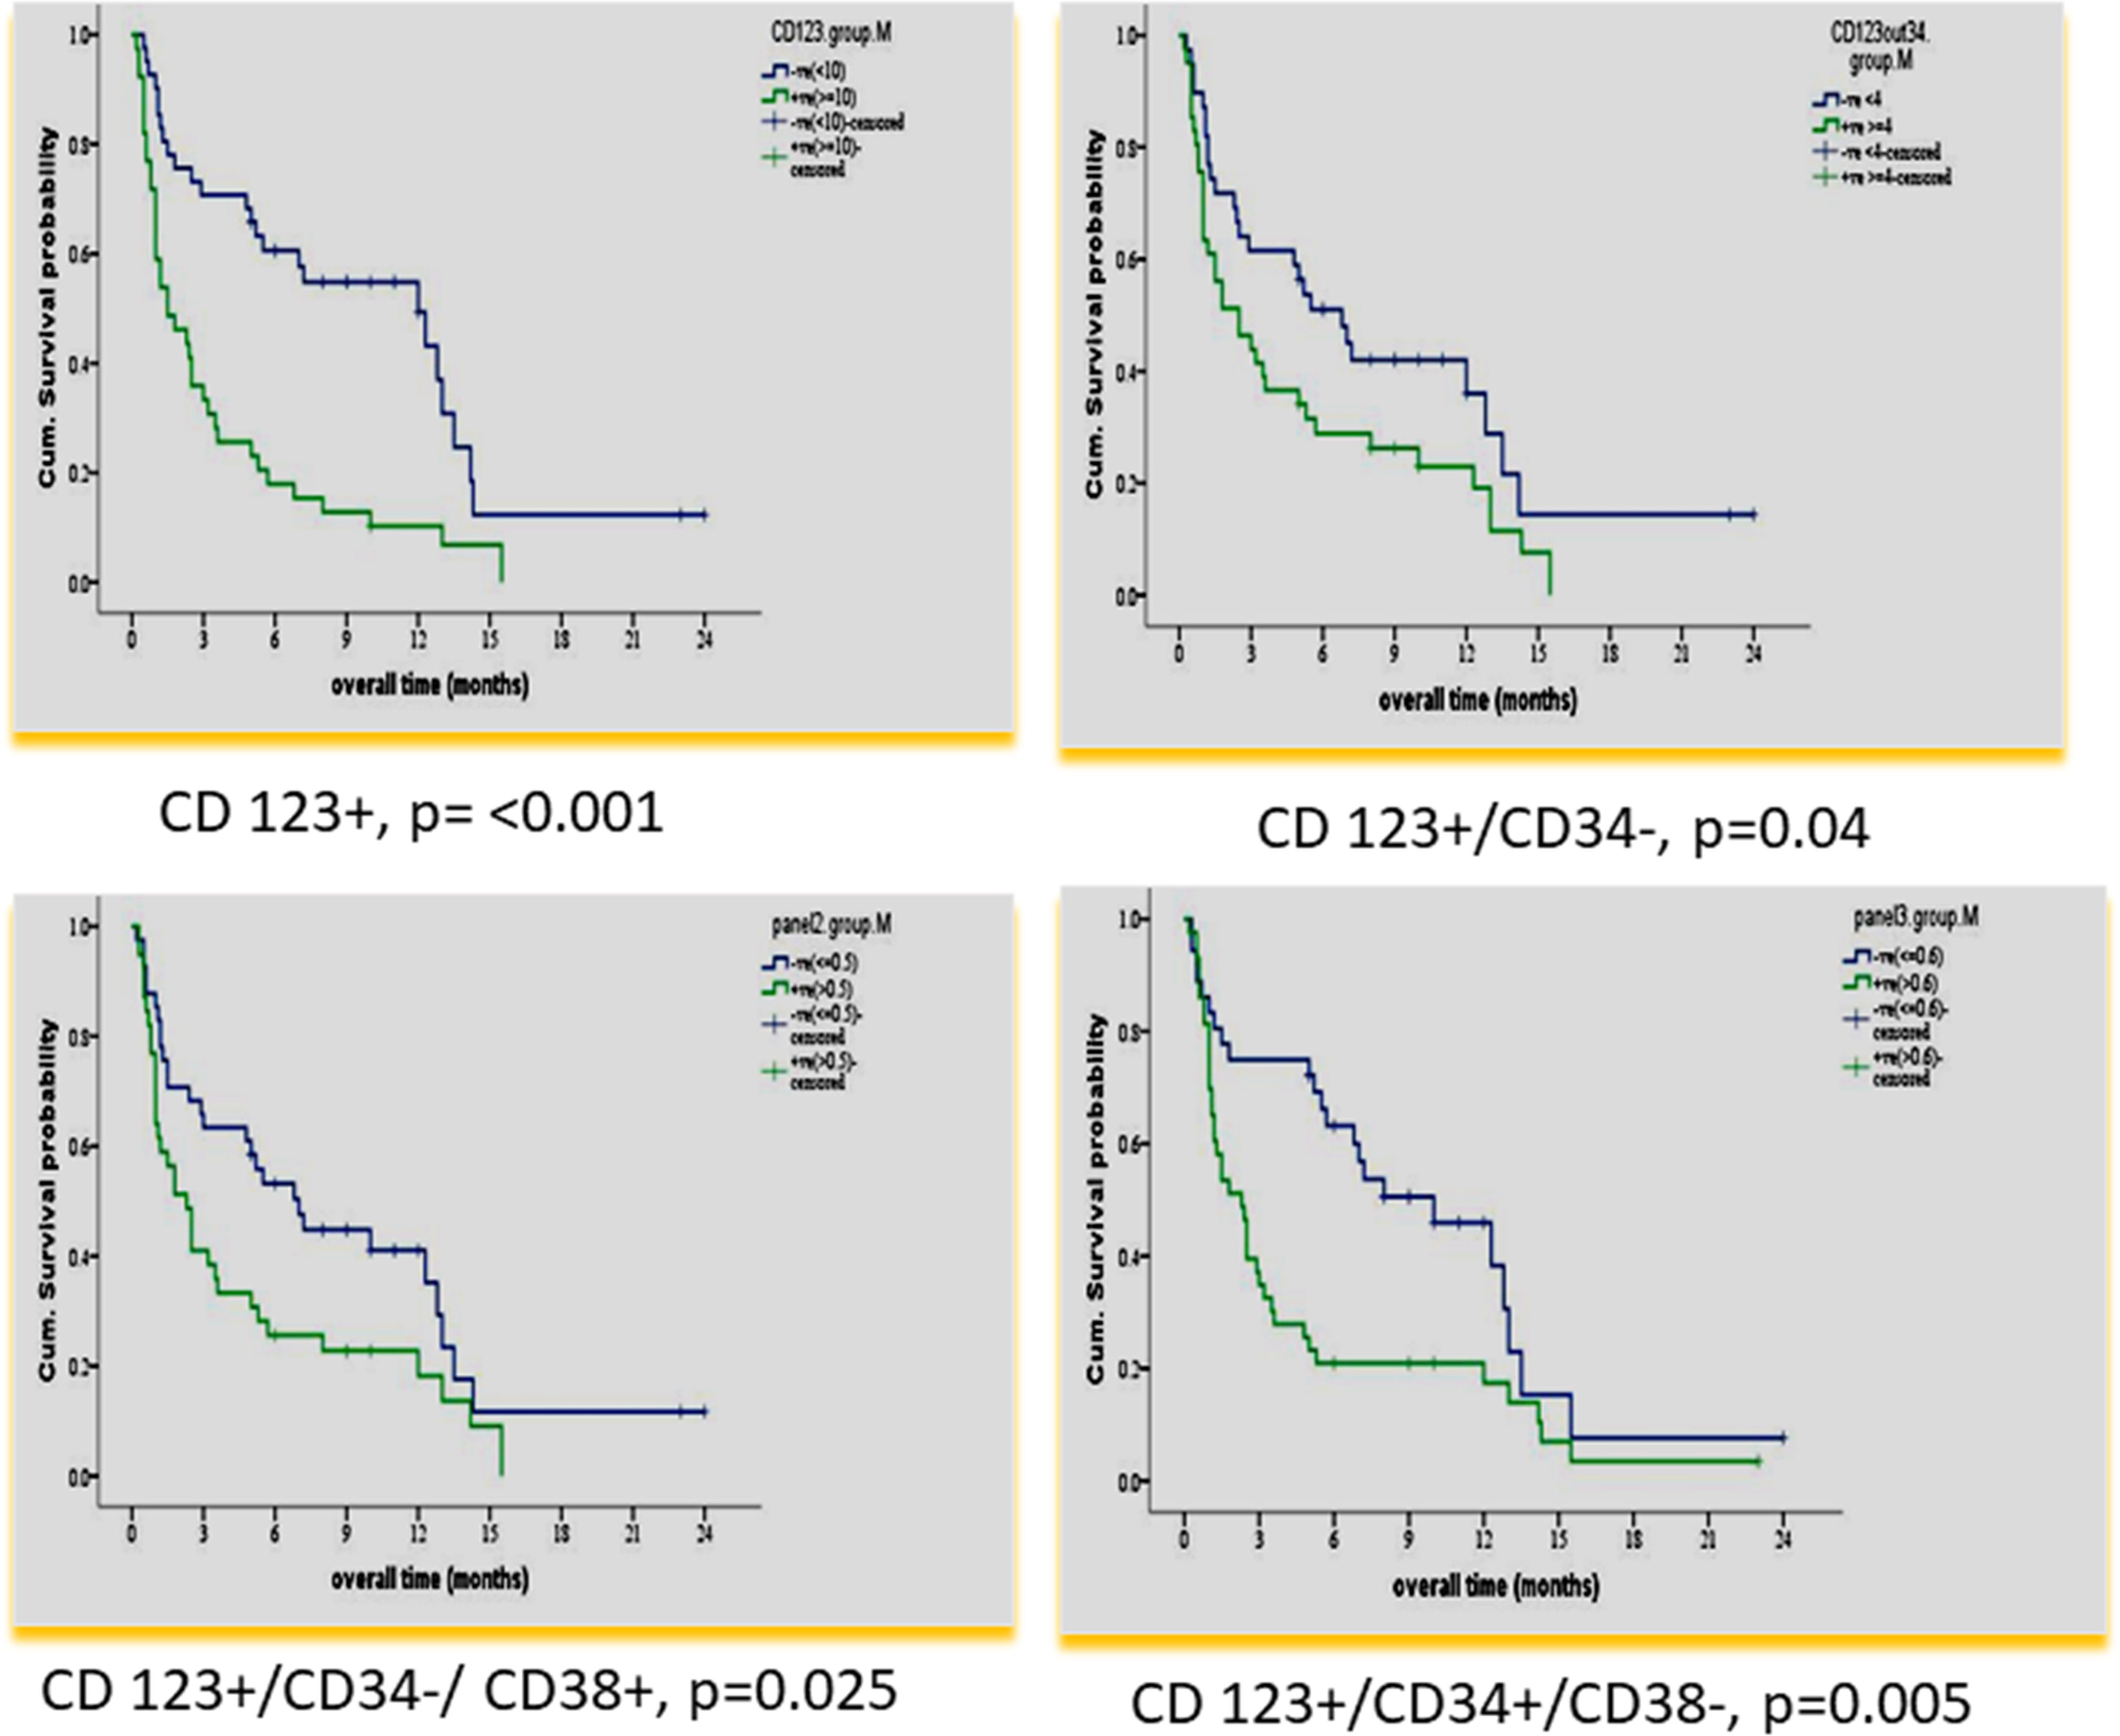
Figure 1 Impact of leukemia stem cell marker(s) at diagnosis on overall survival in 80 adult acute myeloid leukemia patients by using panel CD38 FITC/CD123PE/CD34ECD/CD45PE-PC5.
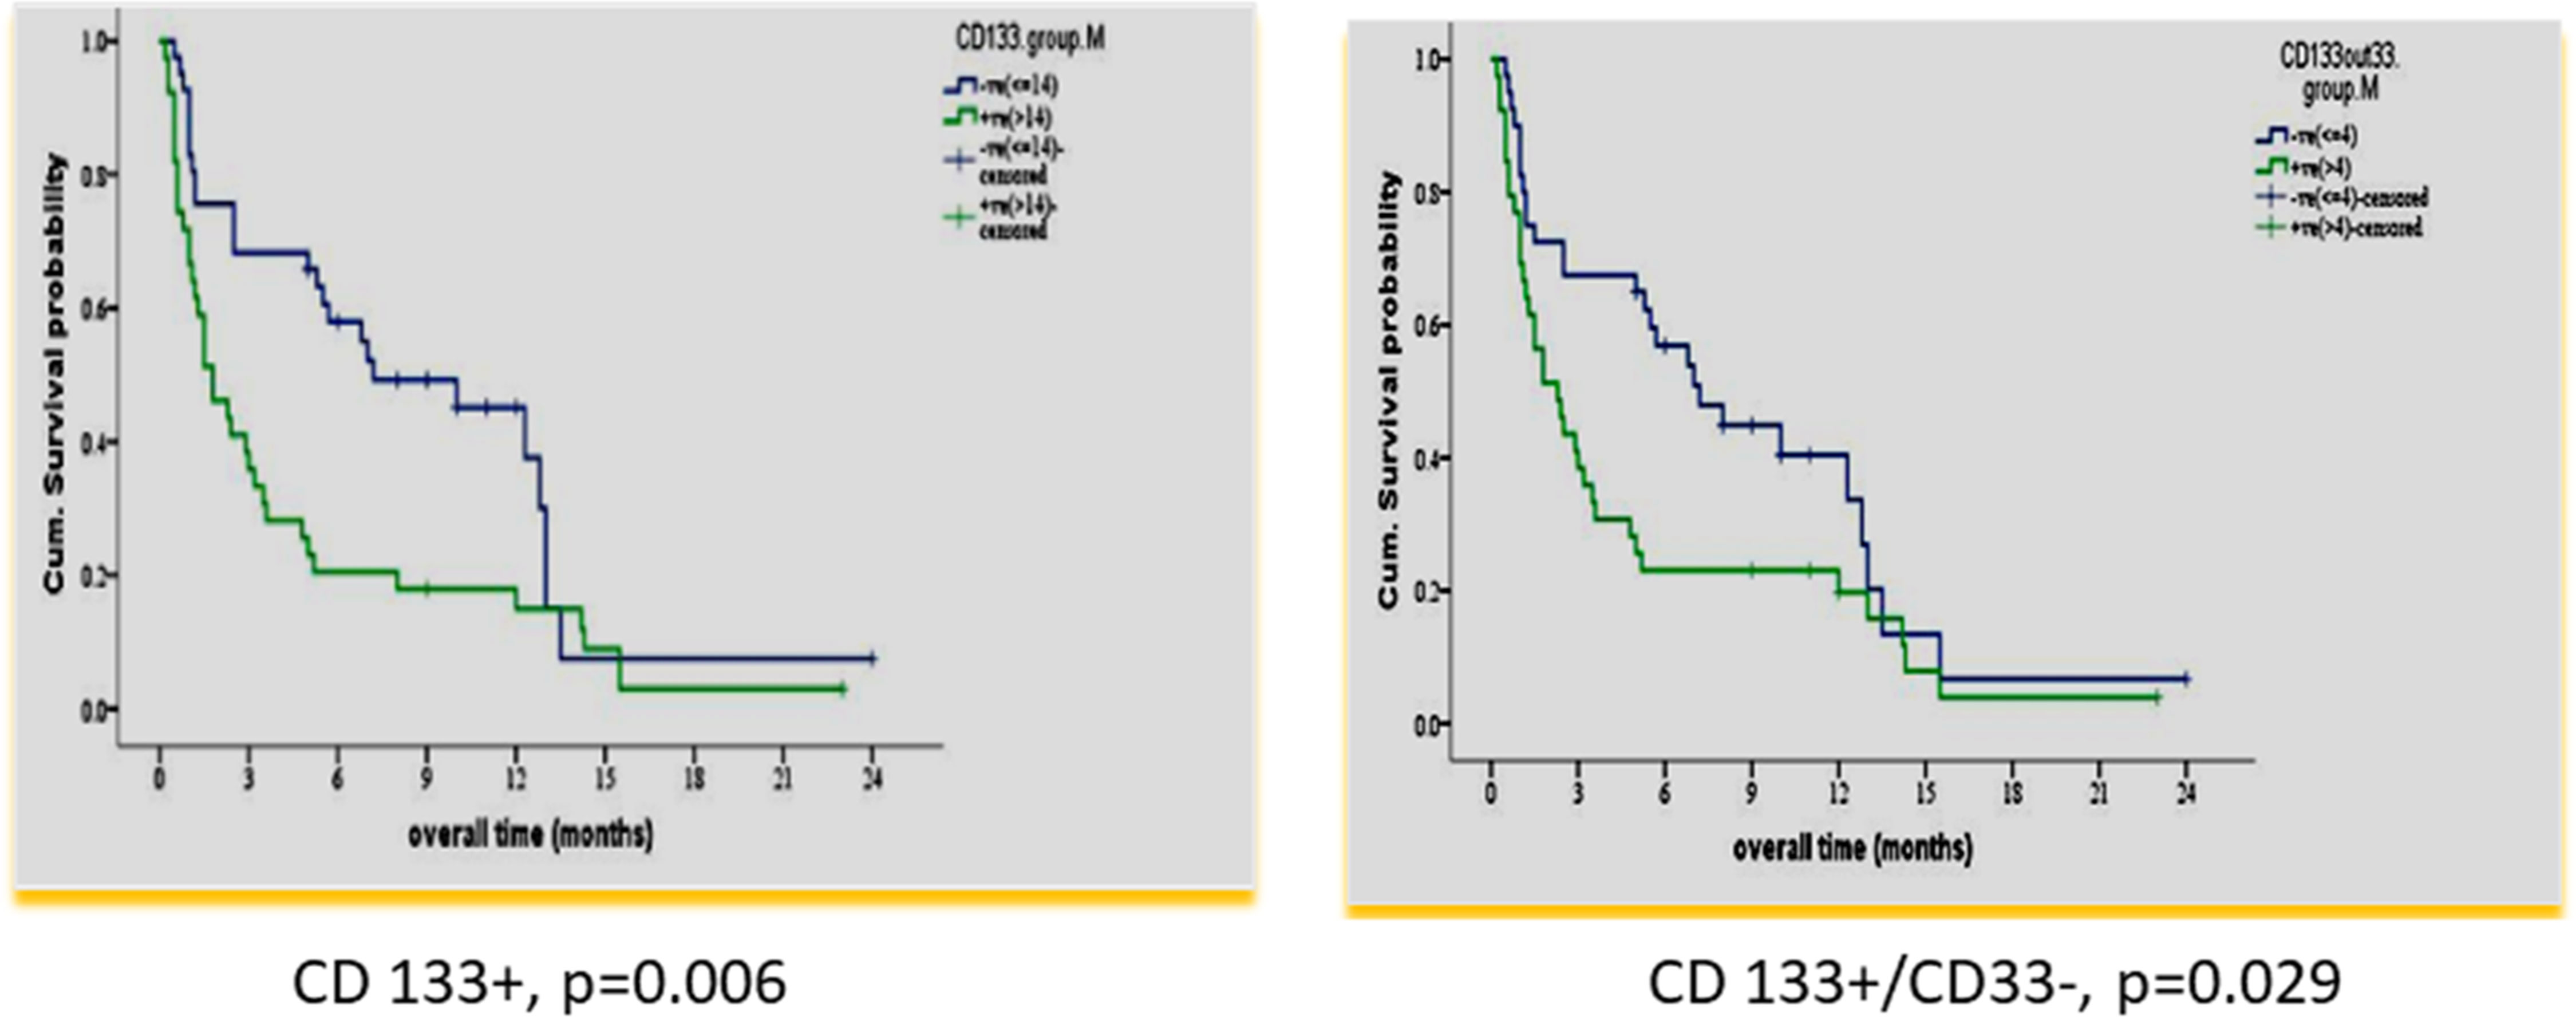
Figure 2 Impact of leukemia stem marker(s) on overall survival in 80 adult acute myeloid leukemia patients at diagnosis by using panel CD90 FITC/CD133PE/CD45ECD/CD33PE-PC5.
3.4 Impact of LSC Frequency at Diagnosis on Disease-Free Survival
The DFS time for the whole group showed a mean ± SE of 5.9 ± 0.8 (CI: 4.3–7.6) and a median of 2.3 months.
There was no impact of clinical or hematological parameters at diagnosis on DFS in 80 adult acute myeloid patients. According to the median value of different markers, cases were classified into high and low expressers. Markers that showed significant impact on DFS are presented in Table 4 and Figures 3, 4. On multivariate analysis, only CD34+/CD38-/CD123+ (p ≤ 0.001, HR 2.3, SE: 0.499, 95% CI: 2.4–17.4) and CD133 (p = 0.015, HR 2.3, SE 0.34, 95% CI: 1.2–4.4) retained statistical significance.
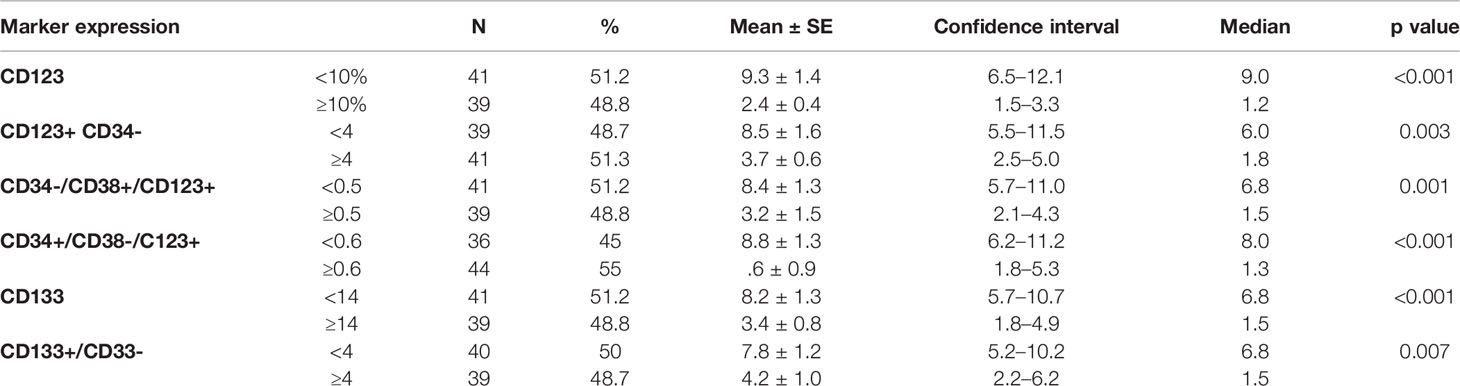
Table 4 Impact of leukemia stem cell frequency at diagnosis on disease-free survival in 80 adult acute myeloid leukemia patients.
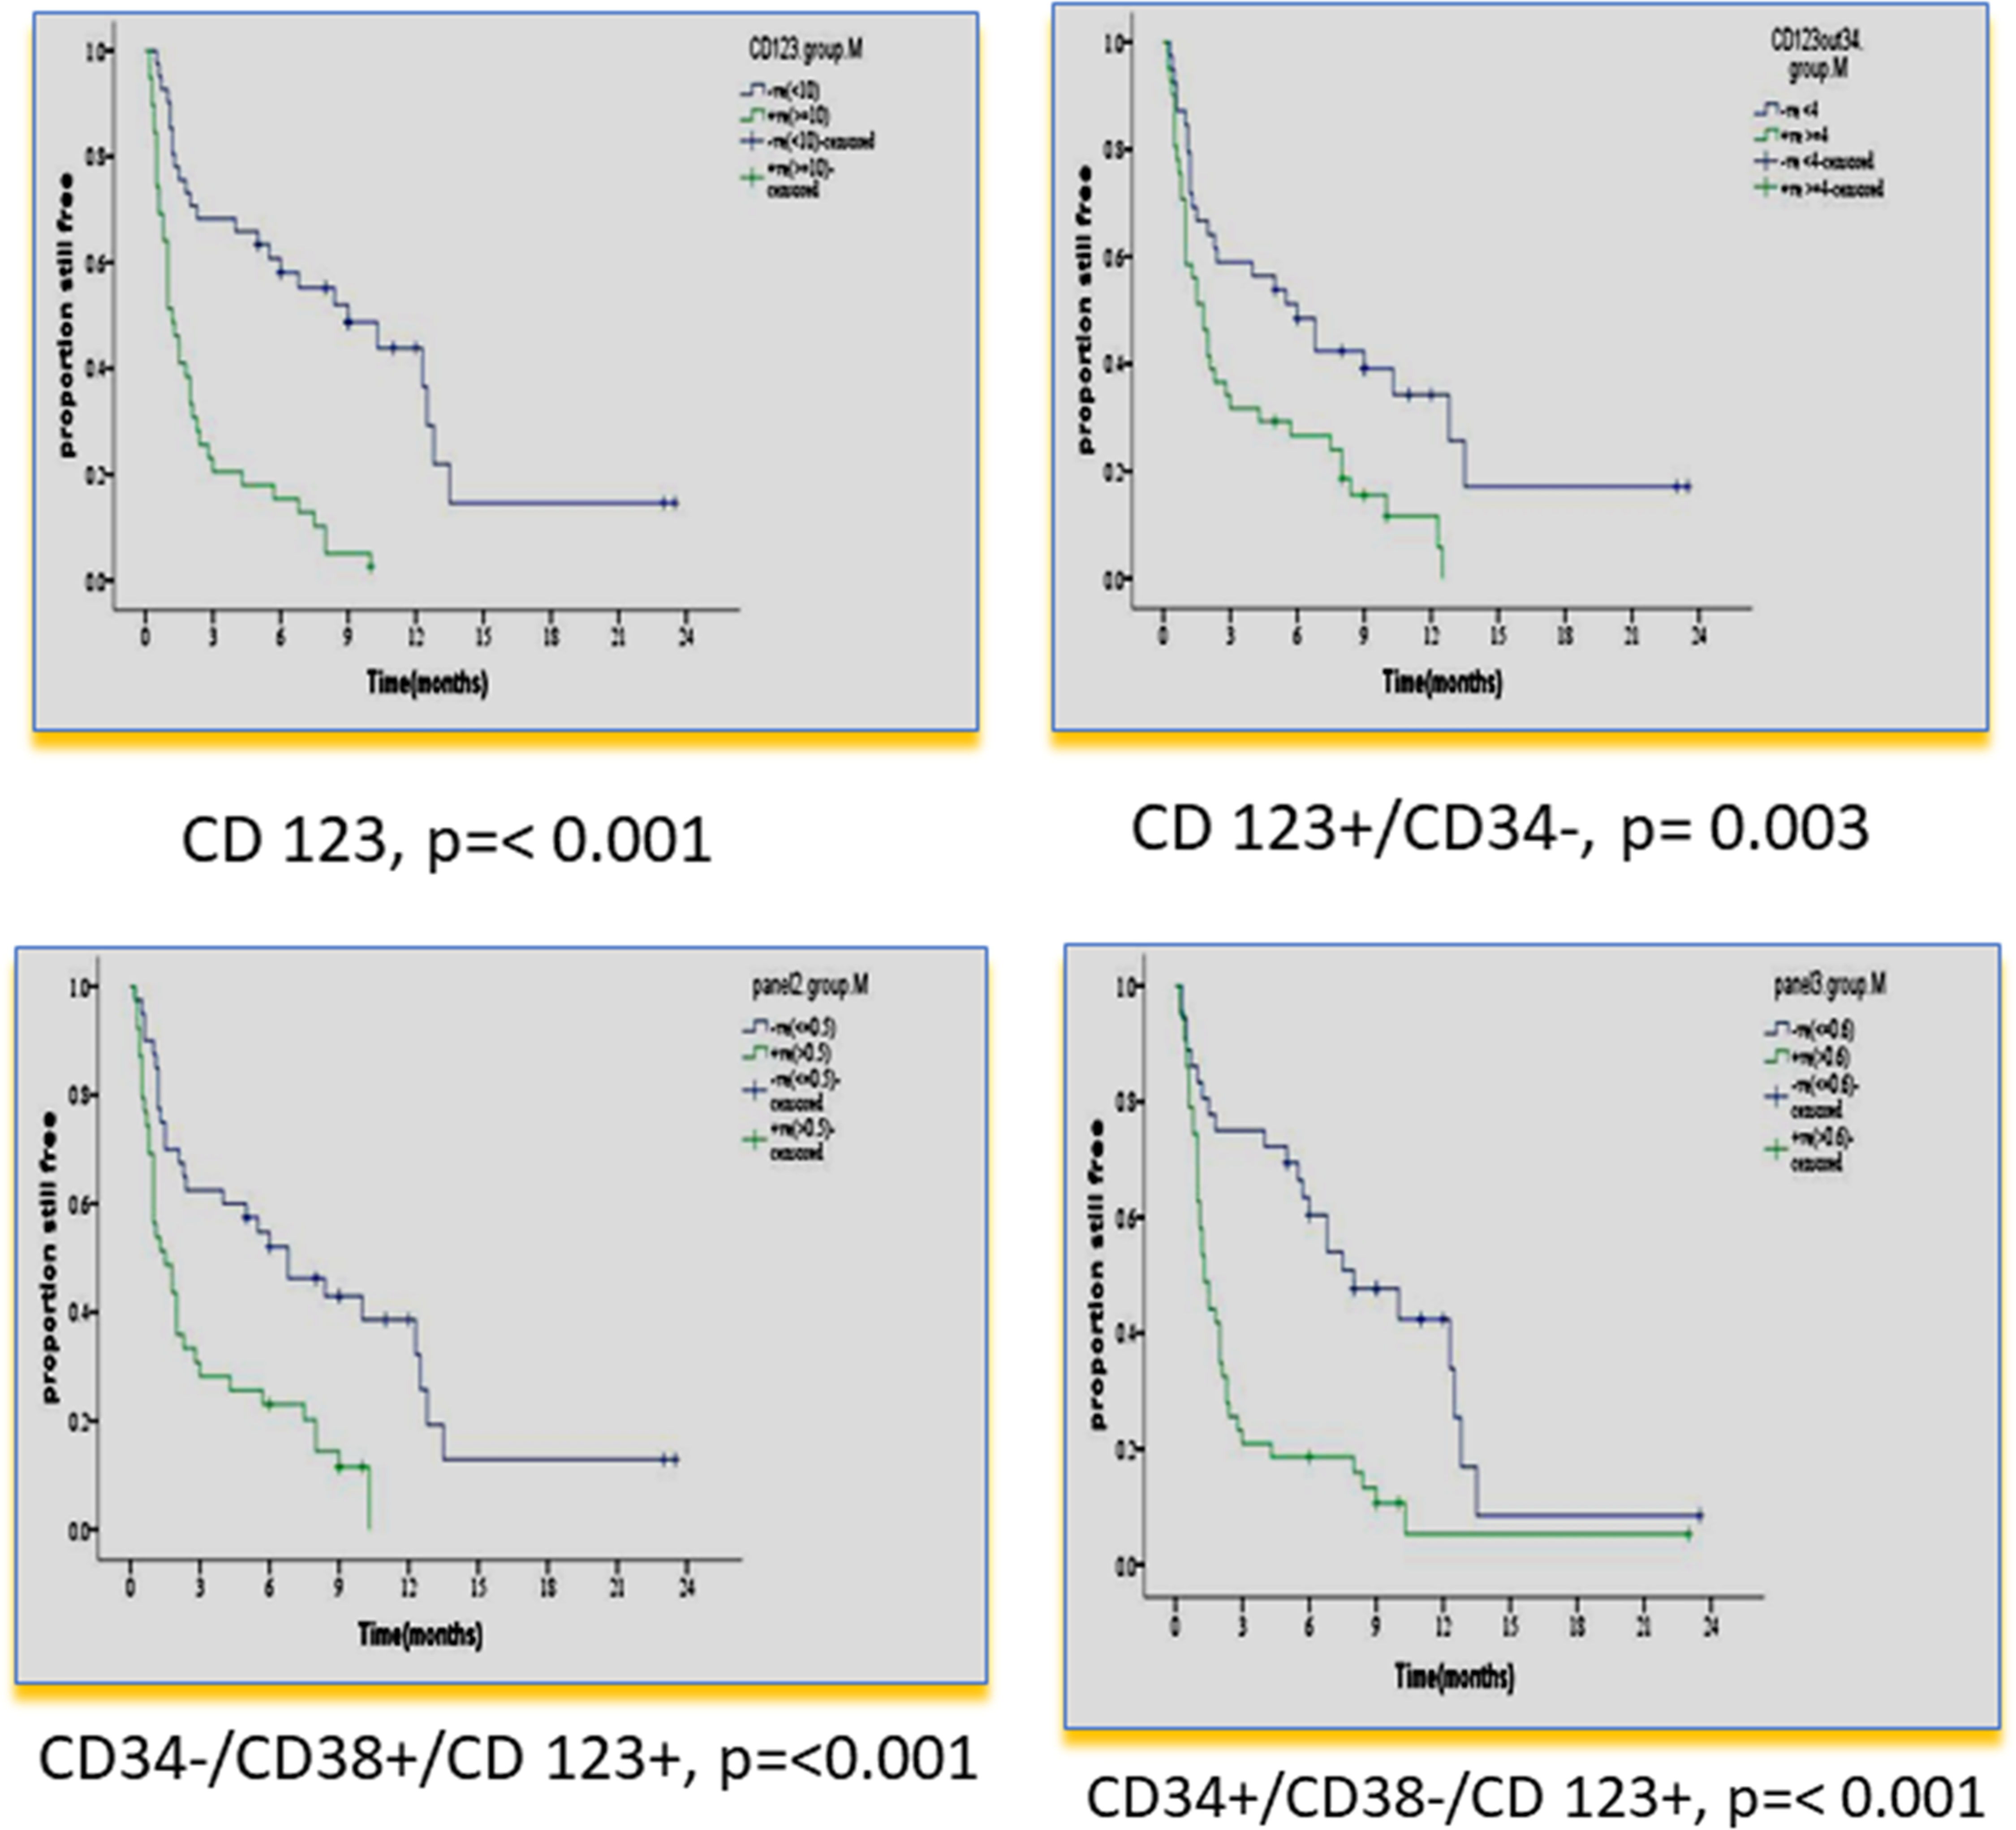
Figure 3 Impact of leukemia stem cell marker(s) at diagnosis on disease-free survival in 80 adult acute myeloid leukemia patients by using panel CD38 FITC/CD123PE/CD34ECD/CD45PE-PC5.
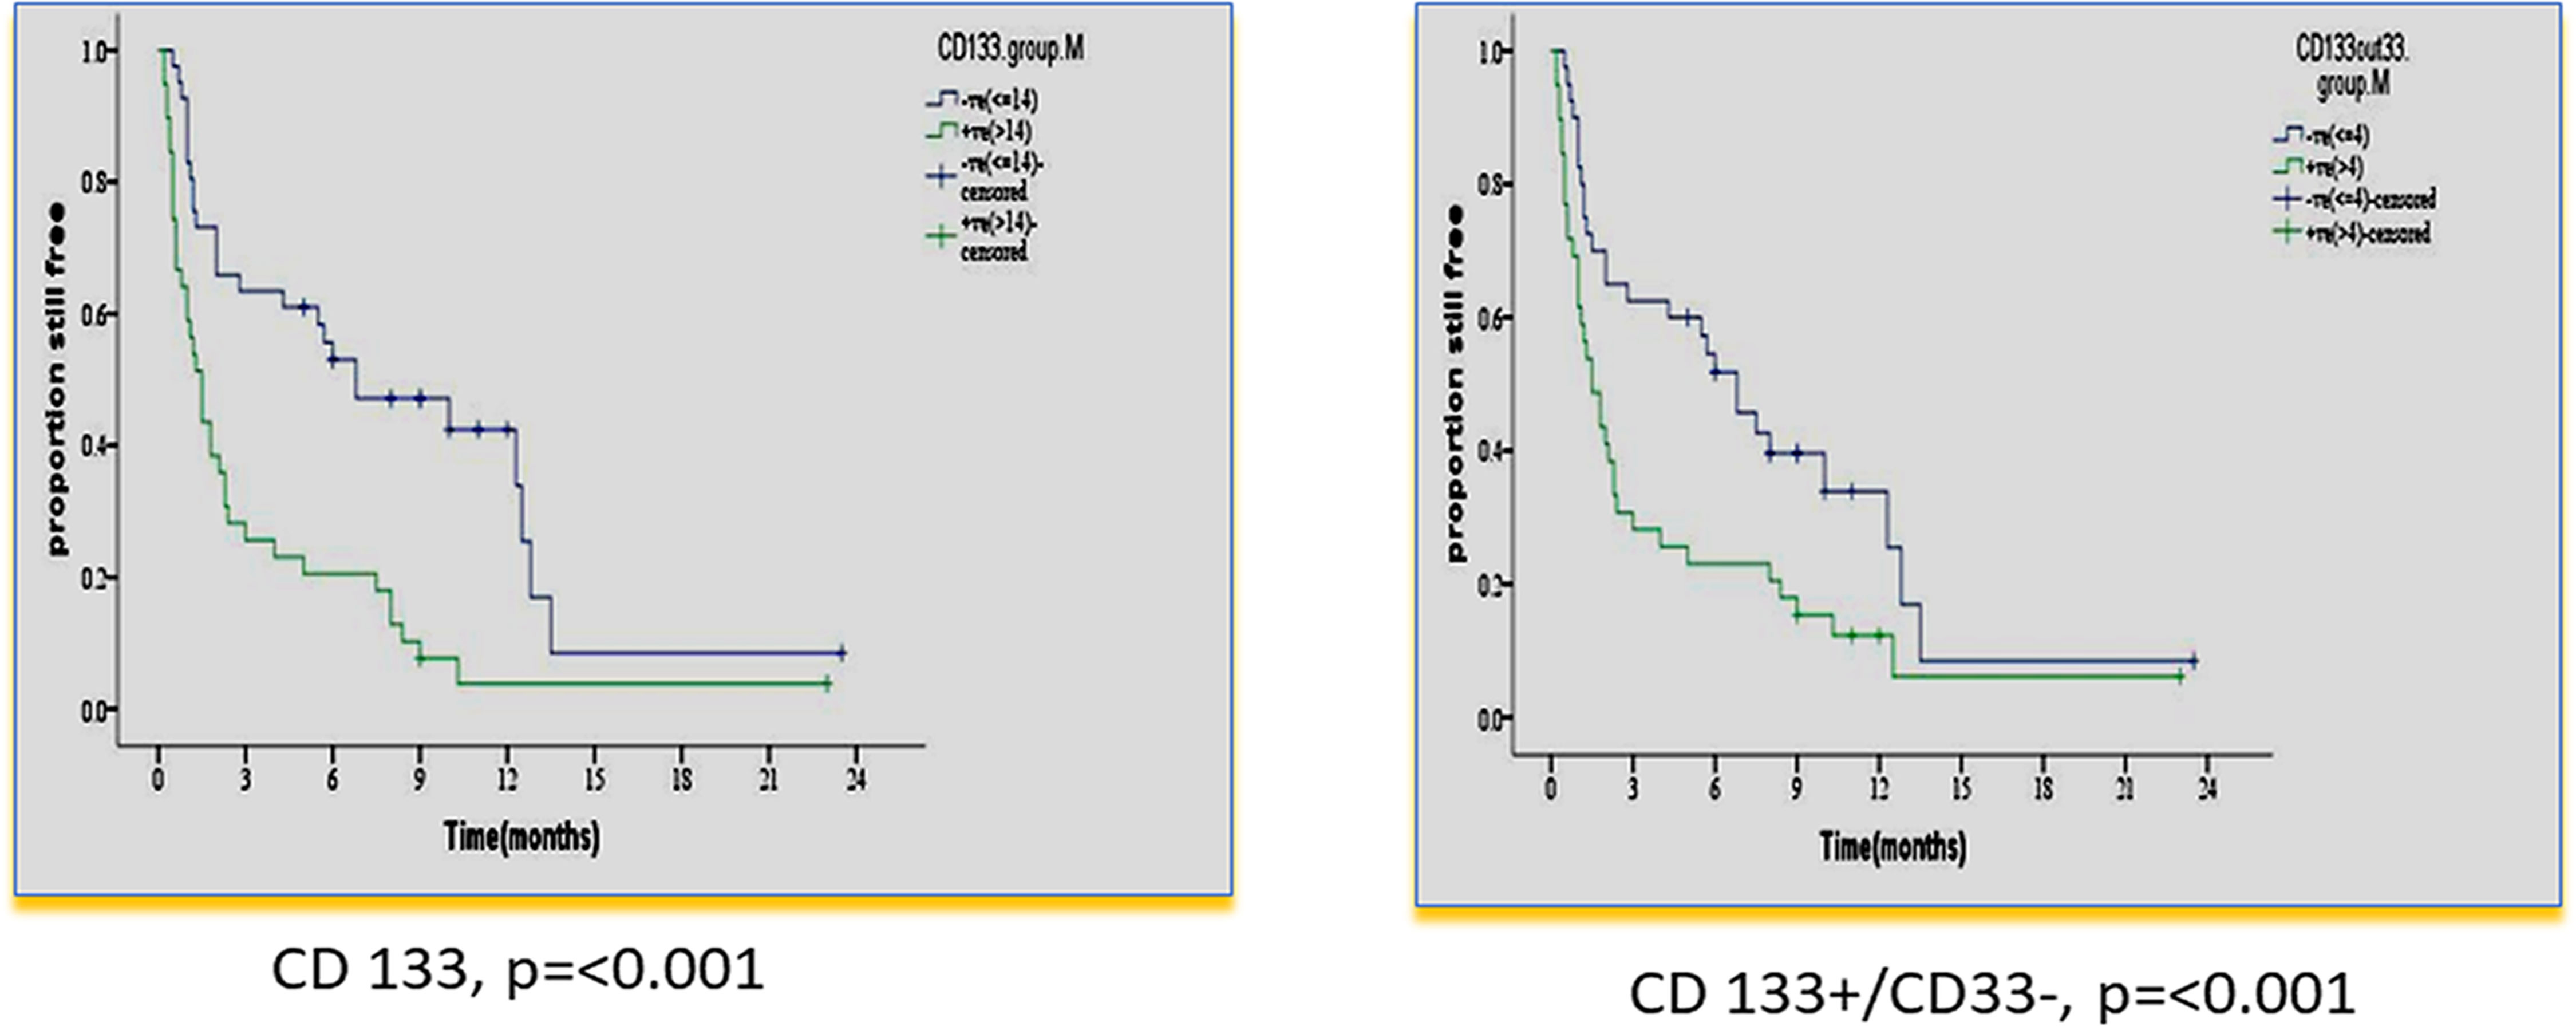
Figure 4 Impact of leukemia stem cell marker(s) at diagnosis on disease-free survival in 80 adult acute myeloid leukemia patients by using panel CD90 FITC/CD133PE/CD45ECD/CD33PE-PC5.
3.5 Correlation Between LSC Frequency at Diagnosis and MRD
A moderate to strong positive correlation between LSC frequency at diagnosis and MRD at day 14 and day 28 was obtained for the majority of LSC markers (Table 5).
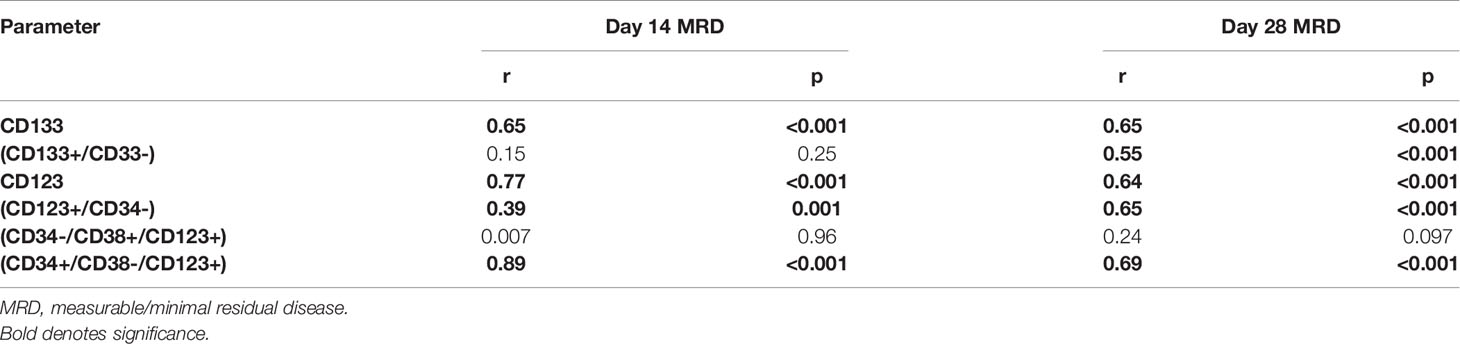
Table 5 Correlation between leukemia stem cell frequency at diagnosis in 75 adult acute myeloid leukemia patients and measurable/minimal residual disease at day 14 and day 28.
4 Discussion
4.1 LSC Frequency at Diagnosis
AML, like other forms of leukemia, originates from a stem cell. The lack of durable response in a high percentage of AML patients suggests that current treatments do not effectively target LSCs (23). Since it has been hypothesized that the subpopulation of chemotherapy-resistant LSCs is responsible for relapse, LSC frequency, like MRD frequency, should have a direct prognostic impact (17). New early prognostic tools based on biological analyses need to be developed.
Currently, MRD is considered an important prognostic parameter regardless of the original risk stratification at diagnosis (1–3). LSCs can also be used to monitor response to therapy (17–19). However, MRD is performed at different time points after initiating therapy while LSCs can be evaluated, as well, at diagnosis, allowing an early prognostic marker with comparable validity to MRD.
In the current work, we studied the impact of LSC frequency at diagnosis on OS and DFS and its correlation with MRD. We wanted to test the potential of LSC frequency at diagnosis to be used as a surrogate marker for MRD status allowing an early decision on the correct line of therapy. We used two simple four-color combinations. With the prism function of Coulter Navios, each gave 16 possible combinations of marker expression.
Our results showed extreme variability in the frequency of LSC subsets with expression of various markers not only between different cases but also at the individual-case level. Heterogeneity of LSCs is well documented (14, 15). This characteristic is important when LSC eradication is pursued in targeted therapy; a combination of monoclonals might be more effective than one monospecific agent.
Most previous studies used one or a few markers for LSC characterization, e.g., CD123 (24–27), CD123+/CD34+, or CD123-/CD34+% (28).
4.2 Correlation of LSC Frequency at Diagnosis With Hematological Parameters
In the current study, the LSC frequency at diagnosis showed no correlation with any of the hematological parameters except for blast cell percentage in both PB and BM. This is in harmony with the fact that LSCs are the initiating cells for proliferation and production of the malignant blast population (16). However, two previous studies failed to demonstrate such a correlation (29, 30). The difference may be attributed to their small sample size (29 and 30 AML patients, respectively).
4.3 Impact of LSC Frequency at Diagnosis on Survival
In our study, CD 123% at diagnosis had an adverse impact on OS and DFS (< p = 0.001). This result is consistent with many previous studies (24–27, 31, 32), and in agreement with a recent study, it also retained significance in multivariate analysis (33).
In our study, a higher CD 123+/CD34-% at diagnosis had a significantly adverse impact on OS and DFS (p = 0.040 and p = 0.003, respectively). To the best of our knowledge, no previous studies dealt with this population. Other studies analyzed the impact of combinations CD123+/CD34+ or CD123-/CD34+% on OS and DFS. Han et al. (28) reported a significant correlation of higher frequencies of CD34+/CD123+ blasts with shorter time to relapse in the univariate Cox proportional hazard model (p = 0.037).
In our study, the CD34+/CD38- population was dissected according to CD123 expression. Only the CD123+ subpopulation was significantly associated with adverse impacts on OS and DFS (p = 0.005 and p ≤ 0.001), respectively. This emphasizes the prognostic value of CD123 expression. Vergez et al. (26) reported that a cutoff of 1% CD34+CD38low/-CD123+ cells negatively affected disease-free survival and was strongly associated with early relapse.
Using variable cutoffs of 5%, 10%, and 20%, Das et al. (34) reported the expression of CD123 in 75.6%, 66.2%, and 50% of AML. They also reported that CD123 expression at diagnosis was associated with post-induction MRD-positive status (p = .001). Lamble et al. (33, 35) reported the association of high CD123 expression with significantly higher RR (53% vs. 39%, p < 0.001), lower EFS (49% vs. 69%, p < 0.001), and lower OS (32% vs. 50%, p < 0.001). They also reported that CD123 expression was independently associated with worse OS (HR 1.54, 95% CI 1.21–1.96, p < 0.001).
In our study, there was a significant association of the higher expression of leukemia stem cell markers: CD 133 and CD133+/CD33-% at diagnosis, with shorter OS and DFS (p = 0.006 and p ≤ 0.001 and p = 0.029 and p = 0.007). These results are consistent with some previous studies (25, 36). However, this could not be detected in other studies (37, 38). The difference may be attributed to different protocols of therapy in their study.
In our study, multivariate analysis established LSC markers CD123 (HR 2.8 and p ≤ 0.001) and CD133% (HR 1.9 and p = 0.017) at diagnosis as independent prognostic parameters for OS and DFS. This is consistent with other studies for CD123 (39) and CD 133 (25, 40).
4.4 Correlation of LSC Frequency at Diagnosis With MRD
Our data did show that a high level of LSC markers CD123, CD123+/CD34-, CD34-/CD38+/CD123+, CD34+/CD38-/CD123+, CD133, and/or CD133+/CD33-% at diagnosis was predictive of an increased risk of positive MRD. This finding may have important implications for early therapeutic intervention because this phenotype can be routinely established within 1 day. Hence, the assessment of the level of LSC markers at diagnosis could help clinicians to quickly identify high-risk patients and thereby improve the response rate by using different therapeutic strategies.
In this study, a moderate to strong positive correlation between LSC frequency at diagnosis and MRD at day 14 and day 28 was obtained for the majority of LSC markers (Table 5). Several studies used LSC markers in parallel with standard MRD panels in a follow-up of AML (8, 19, 33, 41–43). Two previous studies addressed the association of LSC frequency at diagnosis with MRD (28, 34). However, they only tested one population (CD123+/CD34+ and CD123+, respectively). To the best of our knowledge, this is the first study addressing the potential of LSC frequency at diagnosis for prediction of MRD status on follow-up by using several-marker combinations. Thus, apart from being associated with OS and DFS, the LSC frequency at diagnosis can also predict, upfront, which patients will have an MRD+ status on follow-up. Taking into consideration the prognostic value of MRD and that of LSC frequency at diagnosis, we have a strong prognostic parameter at diagnosis that would allow for an early decision on the appropriate therapeutic approach.
5 Conclusion
AML cases show a marked variability in the number and phenotype of LSCs, which have to be taken into consideration when designing targeted therapy. Our work further established the prognostic value of LSC frequency at diagnosis and emphasized the independent prognostic role of some LSC markers, namely, CD123 and CD133. We report the value of LSC frequency at diagnosis, detected by several-marker combinations, to predict the MRD status on follow-up; this further potentiates the value of the LSC frequency at diagnosis as an early prognostic parameter allowing early therapeutic decisions, which might help to improve the outcome in AML.
Data Availability Statement
The original contributions presented in the study are included in the article/Supplementary Material. Further inquiries can be directed to the corresponding author.
Ethics Statement
The studies involving human participants were reviewed and approved by the NCI, Cairo University Institutional Review Board. The patients/participants provided their written informed consent to participate in this study.
Author Contributions
AK conceived of and designed the study, analyzed the data, and wrote the manuscript. NE conceived of and designed the study and supervised the practical work. EK designed the study, designed the experiments, analyzed the data, and edited the manuscript. MH and RO performed the research, analyzed the data, and edited the manuscript. MS was responsible for the clinical data and follow-up of patients. All authors contributed to the article and approved the submitted version.
Funding
This work was funded by Cairo University.
Conflict of Interest
The authors declare that the research was conducted in the absence of any commercial or financial relationships that could be construed as a potential conflict of interest.
Publisher’s Note
All claims expressed in this article are solely those of the authors and do not necessarily represent those of their affiliated organizations, or those of the publisher, the editors and the reviewers. Any product that may be evaluated in this article, or claim that may be made by its manufacturer, is not guaranteed or endorsed by the publisher.
Supplementary Material
The Supplementary Material for this article can be found online at: https://www.frontiersin.org/articles/10.3389/fonc.2022.867684/full#supplementary-material
References
1. Matthes TH, Hauwel M. Minimal Residual Disease Monitoring: The New Standard for Treatment Evaluation of Haematological Malignancies? Swiss Flow Cytometry School, Haematology Service and Clinical P Athology Service, Geneva University Hospital, Switzerland. Swiss Med Wkly (2014) 144:w13907. doi: 10.4414/smw.2014.13907
2. van Dongen JJ, van der Velden VH, Brüggemann M, Orfao A. Minimal Residual Disease Diagnostics in Acute Lymphoblastic Leukemia: Need for Sensitive, Fast, and Standardized Technologies. Blood (2015) 125:3996–4009. doi: 10.1182/blood-2015-03-580027
3. Athale UH, Gibson PJ, Bradley NM, Malkin DM, Hitzler J, POGO MRD Working Group. Minimal Residual Disease and Childhood Leukemia: Standard of Care Recommendations From the Pediatric Oncology Group of Ontario MRD Working Group. Pediatr Blood Cancer (2016) 63:973–82. doi: 10.1002/pbc.25939
4. Ravandi F, Jorgensen JL, O’Brien SM, Jabbour E, Thomas DA, Borthakur G, et al. Minimal Residual Disease Assessed by Multi-Parameter Flow Cytometry is Highly Prognostic in Adult Patients With Acute Lymphoblastic Leukaemia. Br J Haematol (2016) 172:392–400. doi: 10.1111/bjh.13834
5. Brüggemann M, Kotrova M. Minimal Residual Disease in Adult ALL: Technical Aspects and Implications for Correct Clinical Interpretation. Hematol Am Soc Hematol Educ Program (2017) 2017:13–21. doi: 10.1182/asheducation-2017.1.13
6. Samra MA, Mahmoud HK, Abdelhamid TM, El Sharkawy NM, Elnahass YH, Elgammal M, et al. The Prognostic Significance of Minimal Residual Disease in Adult Egyptian Patients With Precursor Acute Lymphoblastic Leukemia. J Egypt Natl Canc Inst (2013) 25:135–42. doi: 10.1016/j.jnci.2013.05.004
7. Romero D. Haematological Cancer: MRD Assessment - Guiding Decisions for Patients With AML. Nat Rev Clin Oncol (2016) 13:136. doi: 10.1038/nrclinonc.2016.16
8. Buccisano F, Maurillo L, Del Principe MI, Di Veroli A, De Bellis E, Biagi A, et al. Minimal Residual Disease as a Biomarker for Outcome Prediction and Therapy Optimization in Acute Myeloid Leukemia. Expert Rev Hematol (2018) 11:307–13. doi: 10.1080/17474086.2018.1447378
9. Araki D, Wood BL, Othus M, Radich P, Halpern AB, Zhou Y, et al. Allogeneic Hematopoietic Cell Transplantation for Acute Myeloid Leukemia: Time to Move Toward a Minimal Residual Disease-Based Definition of Complete Remission? J Clin Oncol (2016) 34:329–36. doi: 10.1200/JCO.2015.63.3826
10. Schneider V, Zhang L, Bullinger L, Rojewski M, Hofmann S, Wiesneth M, et al. Leukemic Stem Cells of Acute Myeloid Leukemia Patients Carrying NPM1 Mutation are Candidates for Targeted Immunotherapy. Leukemia (2014) 28:1759–62. doi: 10.1038/leu.2014.116
11. Short NJ, Rafei H, Daver N, Hwang H, Ning J, Jorgensen JL, et al. Prognostic Impact of Complete Remission With MRD Negativity in Patients With Relapsed or Refractory AML. Blood Adv (2020) 4(24):6117–26. doi: 10.1182/bloodadvances.2020002811
12. Yao J, Wang RH, Li B, Wang Y, Zhu P, Li XJ, et al. Significance of Detecting IgH and Tcrγ Gene Rearrangements in Patients With Hemopoietic Maligancies by Real-Time Quantitative PCR. Genet Mol Res (2015) 14:12168–77. doi: 10.1182/bloodadvances.2020002811
13. Dowling AK, Liptrot SD, O’Brien D, Vandenberghe E. Optimization and Validation of an 8-Color Single-Tube Assay for the Sensitive Detection of Minimal Residual Disease in B-Cell Chronic Lymphocytic Leukemia Detected via Flow Cytometry. Lab Med (2016) 47:103–11. doi: 10.1093/labmed/lmw006
14. Karantanos T, Jones RJ. Acute Myeloid Leukemia Cell Heterogeneity and Its Clinical Relevance. Adv Exp Med Biol (2019) 1139:153–69. doi: 10.1007/978-3-030-14366-4_9
15. Arnone M, Konantz M, Hanns P, Paczulla Stanger AM, Bertels S, Godavarthy PS, et al. Acute Myeloid Leukemia Stem Cells: The Challenges of Phenotypic Heterogeneity. Cancers (2020) . 12:3742. doi: 10.3390/cancers12123742
16. Zhang B, Li L, Ho Y, Li M, Marcucci G, Tong W, et al. Heterogeneity of Leukemia-Initiating Capacity of Chronic Myelogenous Leukemia Stem Cells. J Clin Invest (2016) 126:975–91. doi: 10.1172/JCI79196
17. Van Rhenen A, Feller N, Kelder A, Westra AH, Rombouts E, Zweegman S, et al. High Stem Cell Frequency in Acute Myeloid Leukemia at Diagnosis Predicts High Minimal Residual Disease and Poor Survival. Clin Cancer Res (2005) 11:6520–7. doi: 10.1158/1078-0432.CCR-05-0468
18. DU W, Hu Y, Lu C, Li J, Liu W, He Y, et al. Cluster of Differentiation 96 as a Leukemia Stem Cell-Specific Marker and a Factor for Prognosis Evaluation in Leukemia. Mol Clin Oncol (2015) 3:833–8. doi: 10.3892/mco.2015.552
19. Terwijn M, Zeijlemaker W, Kelder A, Rutten AP, Snel AN, Scholten WJ, et al. Leukemic Stem Cell Frequency: A Strong Biomarker for Clinical Outcome in Acute Myeloid Leukemia. PloS One (2014) 9:e107587. doi: 10.1371/journal.pone.0107587
20. Ebinger M, Witte KE, Ahlers J, Schäfer I, André M, Kerst G, et al. High Frequency of Immature Cells at Diagnosis Predicts High Minimal Residual Disease Level in Childhood Acute Lymphoblastic Leukemia. Leuk Res (2010) 34:11391142. doi: 10.1016/j.leukres.2010.03.023
21. Witte KE, Ahlers J, Schäfer I, André M, Kerst G, Scheel-Walter HG, et al. High Proportion of Leukemic Stem Cells at Diagnosis is Correlated With Unfavorable Prognosis in Childhood Acute Myeloid Leukemia. Pediatr Hematol Oncol (2011) 28:9199. doi: 10.3109/08880018.2010.528171
22. Menon V, Thomas R, Ghale AR, Reinhard C, Pruszak J. Flow Cytometry Protocols for Surface and Intracellular Antigen Analyses of Neural Cell Types. J Vis Exp (2014) 94):52241. doi: 10.3791/52241
23. Zhi L, Wang M, Rao Q, Yu F, Mi Y. And Wang J Enrichment of N-Cadherin and Tie2-Bearing CD34+/CD38-/CD123+ Leukemic Stem Cells by Chemotherapy-Resistance. Cancer Lett (2010) 296:65–73. doi: 10.1016/j.canlet.2010.03.021
24. François V, Alexa SG, Jerome T, Jean-Emmanuel S, Baptiste G, Pascale CL, et al. High Levels of CD34+CD38low/-CD123+ Blasts are Predictive of an Adverse Outcome in Acute Myeloid Leukemia: A Groupe Ouest-Est Des Leucemies Aigues Et Maladies Du Sang (GOELAMS) Study. Haematologica (2011) 96:1792–8. doi: 10.3324/haematol.2011.047894
25. Zhao M, Zhu H, Sajin R and Xiao X. Clinical Significance of Leukemia Stem Cells Immunophenotype Expression in Patients With Acute Leukemia. Life Sci J (2013) 10:2543–8.
26. Vergez F, Green AS, Tamburini J, Sarry JE, Gaillard B, Cornillet-Lefebvre P, et al. High Levels of CD34+CD38low/-CD123+ Blasts are Predictive of an Adverse Outcome in Acute Myeloid Leukemia: A Groupe Ouest-Est Des Leucémies Aiguës Et Maladies Du Sang (GOELAMS) Study). Haematoloica (2011) 96:1792–98. doi: 10.3324/haematol.2011.047894
27. Jin L, Lee EM, Ramshaw HS, Busfield SJ, Peoppl AG, Wilkinson L, et al. Monoclonal Antibody-Mediated Targeting of CD123, IL-3 Receptor Alpha Chain, Eliminates Human Acute Myeloid Leukemic Stem Cells. Cell Stem Cell (2009) 5:31–42. doi: 10.1016/j.stem.2009.04.018
28. Han L, Jorgensen JL, Wang SA, Huang X, Nogueras González GM, Brooks CH, et al. Leukemia Stem Cell Marker CD123 (IL-3R Alpha) Predicts Minimal Residual Disease and Relapse, Providing a Valid Target For SL-101 In Acute Myeloid Leukemia With FLT3-ITD Mutations. Blood (2013) 122:359. doi: 10.1182/blood.V122.21.359.359
29. Wang W, Wang HY, Zhao HX, Cui ZG, Li GL. Expression of CD133 in Bone Marrow Cells of Patients With Leukemia and Myelodysplastic Syndrome. Zhongguo Shi Yan Xue Ye Xue Za Zhi (2007) 15:470–3.
30. Tolba FM, Foda ME. Kamal HM and Elshabrawy DA Expression of CD133 in Acute Leukemia. Med Oncol (2013) 30:527. doi: 10.1007/s12032-013-0527-6
31. Scadden DT. The Stem Cell Niche in Health and Leukemic Disease. Best Pract Res Clin Haematol (2007) 20:19–27. doi: 10.1016/j.beha.2006.11.001
32. Hwang K, Park CJ, Jang S, Chi HS, Kim DY, Lee JH, et al. Flow Cytometric Quantification and Immunophenotyping of Leukemic Stem Cells in Acute Myeloid Leukemia. Ann Hematol (2012) 91:1541–6. doi: 10.1007/s00277-012-1501-7
33. Lamble AJ, Eidenschink Brodersen L, Alonzo TA, Wang J, Gerbing RB, Pardo L, et al. Correlation of CD123 Expression Level With Disease Characteristics and Outcomes in Pediatric Acute Myeloid Leukemia: A Report From the Children’s Oncology Group. Blood (2019) 134(Supplement_1):459. doi: 10.1182/blood-2019-124587
34. Das N, Gupta R, Gupta SK, Bakhshi S, Malhotra A, Rai S, et al. A Real-World Perspective of CD123 Expression in Acute Leukemia as Promising Biomarker to Predict Treatment Outcome in B-ALL and AML. Clin Lymphoma Myeloma Leuk (2020) 20(10):e673–84. doi: 10.1016/j.clml.2020.05.004
35. Lamble AJ, Eidenschink Brodersen L, Alonzo TA, Wang J, Pardo L, Sung L, et al. CD123 Expression is Associated With High-Risk Disease Characteristics in Childhood Acute Myeloid Leukemia: A Report From the Children’s Oncology Group. J Clin Oncol (2022) 40(3):252–61. doi: 10.1200/JCO.21.01595
36. Galizia G, Gemei M, Vecchio LD, Zamboli A, Noto RD, Mirabelli P, et al. Combined CD133/CD44 Expression as a Prognostic Indicator of Disease-Free Survival in Patients With Acute Myeloid Leukemia. Arch Surg (2012) 147:18–24. doi: 10.1001/archsurg.2011.795
37. Vercauteren SM, Sutherland HJ. CD133 (AC133) Expression on AML Cells and Progenitors. Cytotherapy (2001) 3:449–59. doi: 10.1080/146532401317248054
38. Lichtman MA, Liesveld JL. Acute Myelogenous Leukemia. In: Lichtman MA, Kipps TJ, Kaushansky K, Beutler E, Seligsohn U, Prchal J, editors. William,s Hematology, 7th Edition. USA: McGraw-Hill companies (2006). p. 1183.
39. Roug AS, Larsen HO, Nedeiby L, Just T, Brown G, Nyvold C, et al. hMICL and CD123 in Combination With a CD45/CD34/CD117 Backbone – a Universal Marker Combination for the Detection of Minimal Residual Disease in Acute Myeloid Leukemia. Brit J Haematol (2014) 164:212–22. doi: 10.1111/bjh.12614
40. Bachas C, Schuurhuis GJ, Assaraf YG, Kwidama ZJ, Kelder A, Wouters F, et al. The Role of Minor Subpopulations Within the Leukemic Blast Compartment of AML Patients at Initial Diagnosis in the Development of Relapse. Leukemia (2012) 26:1313–20. doi: 10.1038/leu.2011.383
41. Kandeel EZ, Sharkawy NE, Hanafi M, Samra M, Kamel AM. Tracing Leukemia Stem Cells and its Influence on Clinical Course of Adult Acute Myeloid Leukemia. Clin Lymphoma Myeloma Leukemia (2020) 20:383–93. doi: 10.1016/j.clml.2019.11.018
42. Ran D, Schubert M, Taubert I, Eckstein V, Bellos F, Jauch A, et al. Heterogeneity of Leukemia Stem Cell Candidates at Diagnosis of Acute Myeloid Leukemia and Their Clinical Significance. Exp Hematol (2012) 40:155–65. doi: 10.1016/j.exphem.2011.10.005
43. Solly F, Rigollet L, Pascale Flandrin-Gresta P, Augeul-Meunier K, TavernierTardy E, Nadal N, et al. CD133 Acute Myeloid Leukemia Cells Exhibit Higher Clonogenic Capacity and Higher Levels of Pakt and Bci-2 Protins Than Negative Counterpart. In: Blood; Abstract: 35th ASH Annual Meeting and Exposition (2011).
Keywords: AML, LSC, MRD, CD123, CD133
Citation: Kamel AM, Elsharkawy NM, Kandeel EZ, Hanafi M, Samra M and Osman RA (2022) Leukemia Stem Cell Frequency at Diagnosis Correlates With Measurable/Minimal Residual Disease and Impacts Survival in Adult Acute Myeloid Leukemia. Front. Oncol. 12:867684. doi: 10.3389/fonc.2022.867684
Received: 01 February 2022; Accepted: 03 March 2022;
Published: 08 April 2022.
Edited by:
Fabio Guolo, San Martino Hospital (IRCCS), ItalyReviewed by:
Josep Nomdedeu, Hospital de la Santa Creu i Sant Pau, SpainXiao-Dong Mo, Peking University People’s Hospital, China
Copyright © 2022 Kamel, Elsharkawy, Kandeel, Hanafi, Samra and Osman. This is an open-access article distributed under the terms of the Creative Commons Attribution License (CC BY). The use, distribution or reproduction in other forums is permitted, provided the original author(s) and the copyright owner(s) are credited and that the original publication in this journal is cited, in accordance with accepted academic practice. No use, distribution or reproduction is permitted which does not comply with these terms.
*Correspondence: Azza M. Kamel, YXp6YS5rYW1lbEBuY2kuY3UuZWR1LmVn