 Hyunjong Lee
 Joon Young Choi
 Je-Gun Joung
 Jae-Won Joh4
 Jong Man Kim
 Seung Hyup Hyun
95% of researchers rate our articles as excellent or good
Learn more about the work of our research integrity team to safeguard the quality of each article we publish.
Find out more
ORIGINAL RESEARCH article
Front. Oncol. , 31 January 2022
Sec. Gastrointestinal Cancers: Hepato Pancreatic Biliary Cancers
Volume 12 - 2022 | https://doi.org/10.3389/fonc.2022.845900
This article is part of the Research Topic Identification of Novel Biomarkers for Pancreatic and Hepatocellular Cancers View all 20 articles
Introduction: The prognostic value of F-18 fluorodeoxyglucose positron emission tomography/computed tomography (FDG PET/CT) in hepatocellular carcinoma (HCC) was established in previous reports. However, there is no evidence suggesting the prognostic value of transcriptomes associated with tumor FDG uptake in HCC. It was aimed to elucidate metabolic genes and functions associated with FDG uptake, followed by assessment of those prognostic value.
Methods: Sixty HCC patients with Edmondson–Steiner grade II were included. FDG PET/CT scans were performed before any treatment. RNA sequencing data were obtained from tumor and normal liver tissue. Associations between each metabolism-associated gene and tumor FDG uptake were investigated by Pearson correlation analyses. A novel score between glucose and lipid metabolism-associated gene expression was calculated. In The Cancer Genome Atlas Liver Hepatocellular Carcinoma dataset, the prognostic power of selected metabolism-associated genes and a novel score was evaluated for external validation.
Results: Nine genes related to glycolysis and the HIF-1 signaling pathway showed positive correlations with tumor FDG uptake; 21 genes related to fatty acid metabolism and the PPAR signaling pathway demonstrated negative correlations. Seven potential biomarker genes, PFKFB4, ALDOA, EGLN3, EHHADH, GAPDH, HMGCS2, and ENO2 were identified. A metabolic gene expression balance score according to the dominance between glucose and lipid metabolism demonstrated good prognostic value in HCC.
Conclusions: The transcriptomic evidence of this study strongly supports the prognostic power of FDG PET/CT and indicates the potential usefulness of FDG PET/CT imaging biomarkers to select appropriate patients for metabolism-targeted therapy in HCC.
Hepatocellular carcinoma (HCC) is the most representative malignancy in the liver and the fourth leading cause of cancer death worldwide (1). Hepatectomy, liver transplantation, and trans-arterial chemoembolization are conventional treatment options for HCC (2). Recently, targeted agents such as sorafenib and nivolumab are used in patients with advanced HCC as palliative treatment (3, 4). There have been many previous studies to explore predictive factors for the prognosis and treatment response of HCC. The concentration of alpha-fetoprotein, prothrombin induced by vitamin K absence or antagonist II, and histological grade are the most well-known prognostic factors (5–7).
F-18 fluorodeoxyglucose positron emission tomography/computed tomography (FDG PET/CT) is a robust imaging modality used to diagnose malignancy (8). CT or magnetic resonance imaging (MRI) is especially useful in the diagnosis of HCC due to its specific finding of HCC, early enhancement in arterial phase, and delayed washout in portal phase (9). The diagnostic performance of FDG PET/CT is inferior to CT and MRI as there are tumors with low FDG uptake or isometabolic uptake, which are difficult to discriminate from normal liver tissue (10, 11). Nevertheless, the prognostic value of FDG PET/CT in HCC has been revealed to be highly significant in many previous studies (12–15).
Prior research has suggested possible key proteins that affect tumor FDG uptake in HCC. Lee et al. showed that hexokinase II (HK2) is expressed in HCC in contrast to glucose transporter 1 (GLUT1), which is expressed in cholangiocarcinoma (16). They also reported genes related to cell survival to be associated with high FDG uptake (17). Recently, Xia et al. found that hypoxia-induced glucose transporters may contribute to FDG uptake in HCC based on radiogenomics results (18). However, previous studies recruited less than 20 patients. In addition, there are no previous reports suggesting the prognostic value of transcriptomes associated with FDG uptake in HCC tumors. It is expected that exploring metabolic genes or functions associated with FDG uptake and evaluating their prognostic value can strongly support not only the prognostic value of FDG PET/CT but also reveal molecular functions affecting FDG uptake in HCC.
In this study, we aimed to elucidate significant metabolic genes and functions associated with FDG uptake in HCC transcriptomes as an RNA-sequencing dataset. Subsequently, the prognostic value of the genes and gene set expression scores were assessed. Ultimately, transcriptomic evidence highlighted the prognostic power of FDG PET/CT in HCC.
Between May 2009 and August 2015, patients who underwent curative surgery for HCC and pretreatment FDG PET/CT were enrolled. We identified 120 eligible samples (60 tumor tissues and 60 paired normal liver tissues) in 60 patients (49 males and 11 females; mean age, 58.1 ± 8.8 years) from the Samsung Medical Center Biobank. A single nodule of HCC was present in all patients. Samples were obtained after surgical resection prior to radiation or chemotherapy and were stored in liquid nitrogen. In all tumor samples, the pathological diagnosis and Edmondson–Steiner grade were verified by a pathologist. Only tumor samples with Edmondson–Steiner grade II were included in the study cohort, and the other samples of other grades were excluded, as there is a high variation of FDG avidity depending on the cell differentiation grade. Samples were collected in accordance with the guidelines issued by the ethics committee of our institution, and written informed consent was obtained from all patients. Our institutional review board approved this retrospective study (IRB #2017-04-022). Demographic and clinical characteristics and survival data were obtained from electronic medical records.
All patients fasted for at least 6 hours and had blood glucose levels of less than 200 mg/dL at the time of FDG PET/CT. Whole-body PET and CT images from the basal skull to mid-thigh were acquired 60 minutes after 5.0 MBq/kg FDG injection without intravenous or oral contrast on a dedicated PET/CT scanner (Discovery STE, GE Healthcare, Milwaukee, WI). Continuous spiral CT was performed with a 16-slice helical CT (140 keV, 30–170 mA). An emission scan was then obtained from head to thigh for 2.5 minutes per frame in 3-dimensional mode. PET images were reconstructed using CT, and attenuation correction was performed using the ordered-subsets expectation-maximization algorithm with 20 subsets and 2 iterations (matrix size, 128×128; voxel size, 3.9×3.9×3.3 mm).
All images were reviewed by a board-certified nuclear medicine physician using volume viewer software on a GE Advantage Workstation, version 4.7. The maximum standardized uptake value (SUVmax) of the primary tumor was measured using a spherical volume of interest over the primary tumor. The mean SUV (SUVmean) of the normal liver was obtained by taking the average of the three 2-cm-diameter spherical VOIs (two in the right lobe and one in the left lobe). Tumor FDG avidity was measured by tumor-to-normal liver SUV ratio (TLR), calculated with the following equation: TLR = SUVmax of the tumor/SUVmean of the normal liver.
Frozen sections from each tissue sample were homogenized in TRIZOL reagent (Invitrogen, Carlsbad, CA, USA). Total RNA was extracted using a standard chloroform protocol followed by purification with the Qiagen RNeasy Mini Kit (QIAGEN Inc, Valencia, CA. USA). RNA integrity was evaluated using RNA 6000 Nano LabChips on an Agilent 2100 Bioanalyzer (Agilent Technologies, Foster City, CA, USA). RNA purity was assessed by the ratio of spectrophotometric absorbance at 260 and 280 nm (A260/280 nm) using NanoDrop ND-1000 (NanoDrop Inc, Wilmington, DE, USA). Library construction for RNA sequencing was performed using a Truseq RNA Sample Preparation v2 Kit (Illumina). Isolated total RNA was used in a reverse transcription reaction with poly (dT) primers using SuperScriptTM II Reverse Transcriptase (Invitrogen) according to the manufacturer’s protocol. Briefly, an RNA sequencing library was prepared by cDNA amplification, end-repair, 3’ end adenylation, and adapter ligation. Library quality and quantity were measured using the Agilent 2100 Bioanalyzer and Qubit. Sequencing of the RNA library was carried out using the 100 bp paired-end mode of the TruSeq Rapid PE Cluster Kit and the TruSeq Rapid SBS Kit (Illumina). Reads from the FASTQ files were mapped to the hg19 human reference genome using TopHat version 2.0.6 (http://tophat.cbcb.umd.edu/). Raw read counts mapped to genes were measured using the BAM format file by HTSeq, version 0.6.1 (https://htseq.readthedocs.io). Read counts were normalized using the TMM (Trimmed Mean of M-values normalization) method. The expression of genes in tumor tissue was divided by that in normal liver tissue to calculate the fold change of gene expression. The fold changes were normalized by log2 transformation.
Metabolism-associated genes encoding proteins involved in glucose and lipid metabolism were selected from the Molecular Signature Database (mSigDB). A set of 404 genes was manually curated for further transcriptomic analysis. Pearson correlation analyses were performed between the expression of metabolism-associated genes and TLRs. All genes with positive or negative correlations (p < 0.05) were defined as metabolism-associated genes related to tumor FDG uptake. In each gene set, REACTOME and KEGG enrichment analysis was conducted to investigate the molecular pathways associated with tumor FDG uptake using the “signatureSearch” package in R/Bioconductor (19). In each metabolism-associated gene set, a gene expression signature score (GESS) was defined as the mean z-score of each gene expression. We calculated a novel balance score between glucose and lipid metabolism-associated gene expression in HCC (metabolic balance score) by subtracting the GESS of lipid metabolism from the GESS of glucose metabolism. The concept of subtracting the average of z-score of each gene set was already applied in a previous study to evaluate a value of epithelial-mesenchymal transition score in lung cancer (20).
Among the investigated metabolism-associated genes, those with significant correlation with TLR were selected as subject genes for further analysis. Prognostic validation of metabolism-associated genes was performed in The Cancer Genome Atlas Liver Hepatocellular Carcinoma (TCGA-LIHC) dataset. Clinical and gene expression data of TCGA-LIHC patients were obtained from cBioPortal using “cgdsr” and “TCGAbiolinks” packages in R/Bioconductor. Among the whole dataset, 325 patients with disease-free survival (DFS) data and 376 patients with overall survival (OS) data were included in this study. As previously described, the GESS of glucose metabolism, the GESS of lipid metabolism, and the metabolic balance score between them were calculated. A zero for metabolic balance score was used as a cutoff to classify subjects into two risk stratification groups.
Regarding multivariable Cox regression analysis, variables with a p-value less than 0.1 in univariable analyses were included. Variables with collinearity were excluded. Metabolism-associated genes with univariable p-values less than 0.1 for both DFS and OS were selected as potential components of the biomarker gene set. The prognostic index (PI) was developed using Cox proportional hazards regression model to validate risk stratification with the biomarker gene set. Risk stratification groups were divided by a median value of PI. The expression of each potential biomarker gene was compared between each group using independent t-test. Gene mutation data were downloaded from the genomic data commons (https://gdc.cancer.gov/), and a mutation annotation format file was constructed using the “read.maf” function included in the “maftools” package in R/Bioconductor (21). The difference of TP53 and CTNNB1 mutations between risk groups was evaluated by Chi-square test. All the statistical analyses were performed using R software (v4.0.4, R Foundation for Statistical Computing, Vienna, Austria). A p-value less than 0.05 was considered statistically significant.
The patient characteristics are summarized in Table 1. In 31 patients (51.7%), tumors with TLRs greater than or equal to median value of TLR presented the high TLR phenotype. In the remaining 29 patients (48.3%), tumors with TLRs less than median value of TLR were assigned to the low TLR phenotype. The median value of TLR was 1.7. TLRs ranged from 1.7 to 6.8 (mean: 2.8) for high TLR tumors and from 1.1 to 1.7 (mean: 1.4) for low TLR tumors. Milan criteria compliance (p = 0.014), young age (p = 0.025), large tumor size (p = 0.005), and the presence of microvascular invasion (p < 0.001) were significantly associated with high TLR phenotype. There were no significant associations between TLR and gender, normal liver SUV, HCC etiology, or presence of liver cirrhosis.
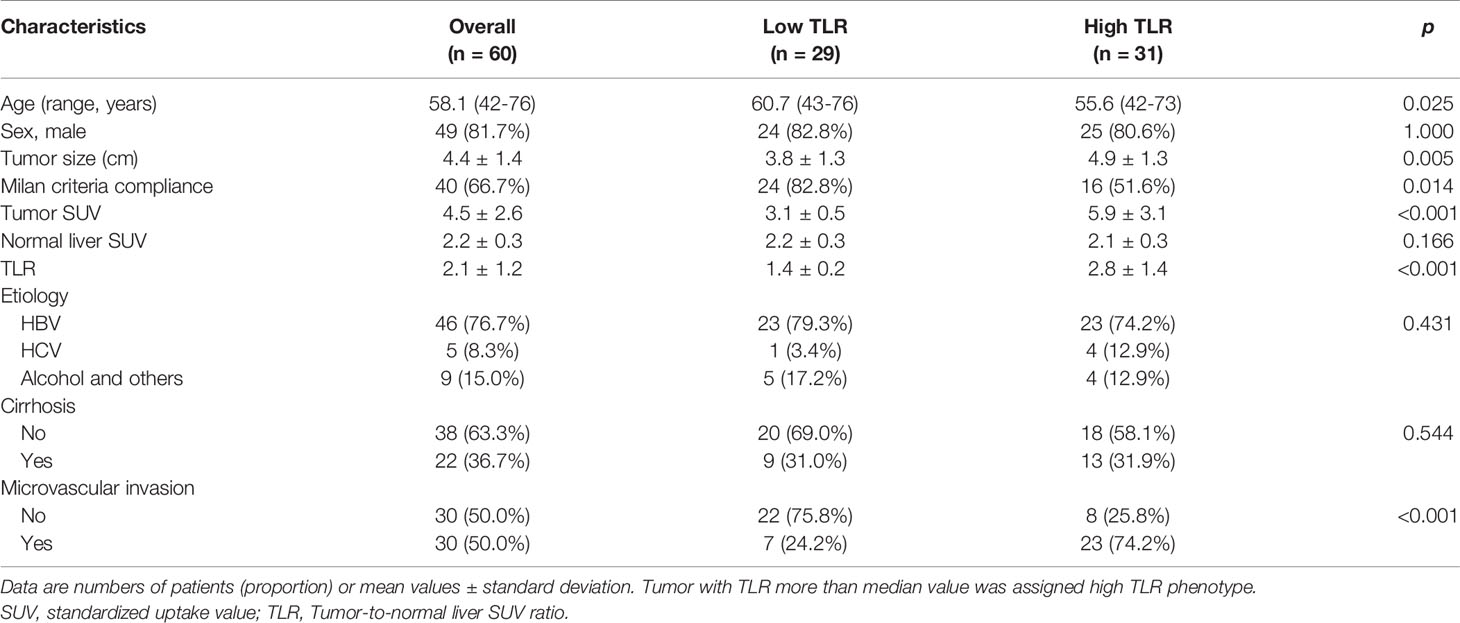
Table 1 Clinical characteristics of patients.
There were 42 genes with significant positive correlations and 87 genes with significant negative correlations (p < 0.05) with tumor FDG uptake. The list of genes is described in Supplementary Table 1. Gene set enrichment analysis according to TLR using the REACTOME and KEGG databases demonstrated upregulated glucose metabolism, including glycolysis and hypoxia-inducible factor-1 (HIF-1) signaling pathway upregulation, and downregulated lipid metabolism, including fatty acid metabolism and peroxisome proliferator-activated receptor (PPAR) signaling pathway downregulation, in HCC with high TLR phenotype (Figure 1).
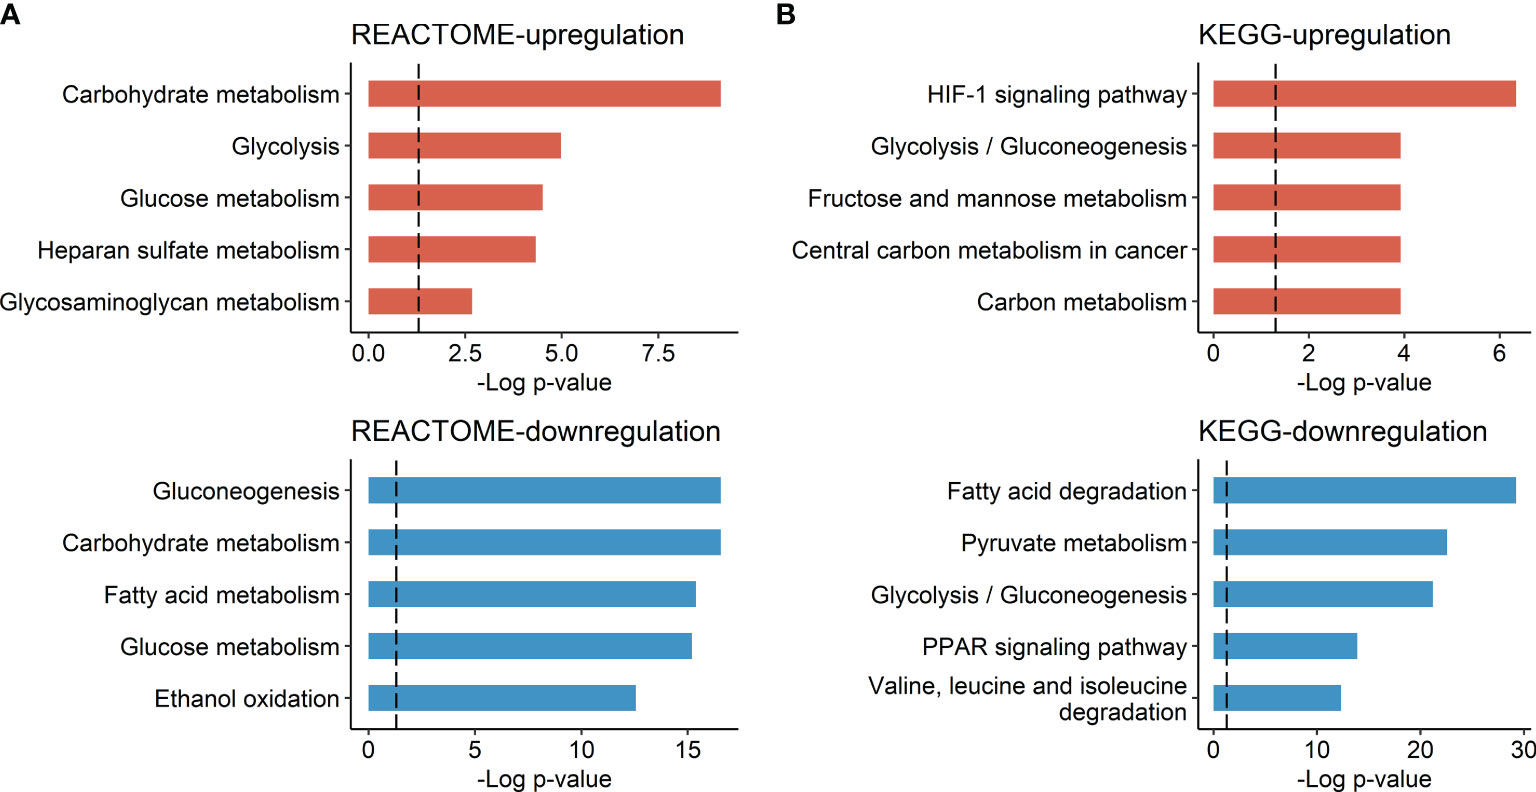
Figure 1 Molecular pathways associated with HCC tumor FDG uptake. (A) Molecular pathways listed in the REACTOME database and (B) molecular pathways listed in the KEGG database. Bar plots represent the negative log p-value of each molecular pathway.
Considering the overlap of genes in these molecular pathways, the upregulated gene sets involved in glycolysis and HIF-1 signaling were merged into a glucose metabolism-associated gene set. The downregulated gene sets involved in fatty acid metabolism and the PPAR signaling pathway were merged into a lipid metabolism-associated gene set. There were nine genes with positive correlation among the glucose metabolism-associated gene set and 21 genes with negative correlation among the lipid metabolism-associated gene set. The list of glucose metabolism-associated genes and lipid metabolism-associated genes related to tumor FDG uptake are described in Supplementary Tables 2, 3, respectively.
The GESS of glucose metabolism showed a positive correlation with tumor FDG uptake (r = 0.607 and p < 0.001). The GESS of lipid metabolism showed a negative correlation with tumor FDG uptake (r = -0.562 and p < 0.001). The metabolic balance score showed a positive correlation with tumor FDG uptake (r = 0.639, p < 0.001). A heatmap visualized the expression of the top 5 genes with high correlation coefficients, the GESSs of each metabolism, and TLR values according to the metabolic balance score (Figure 2).
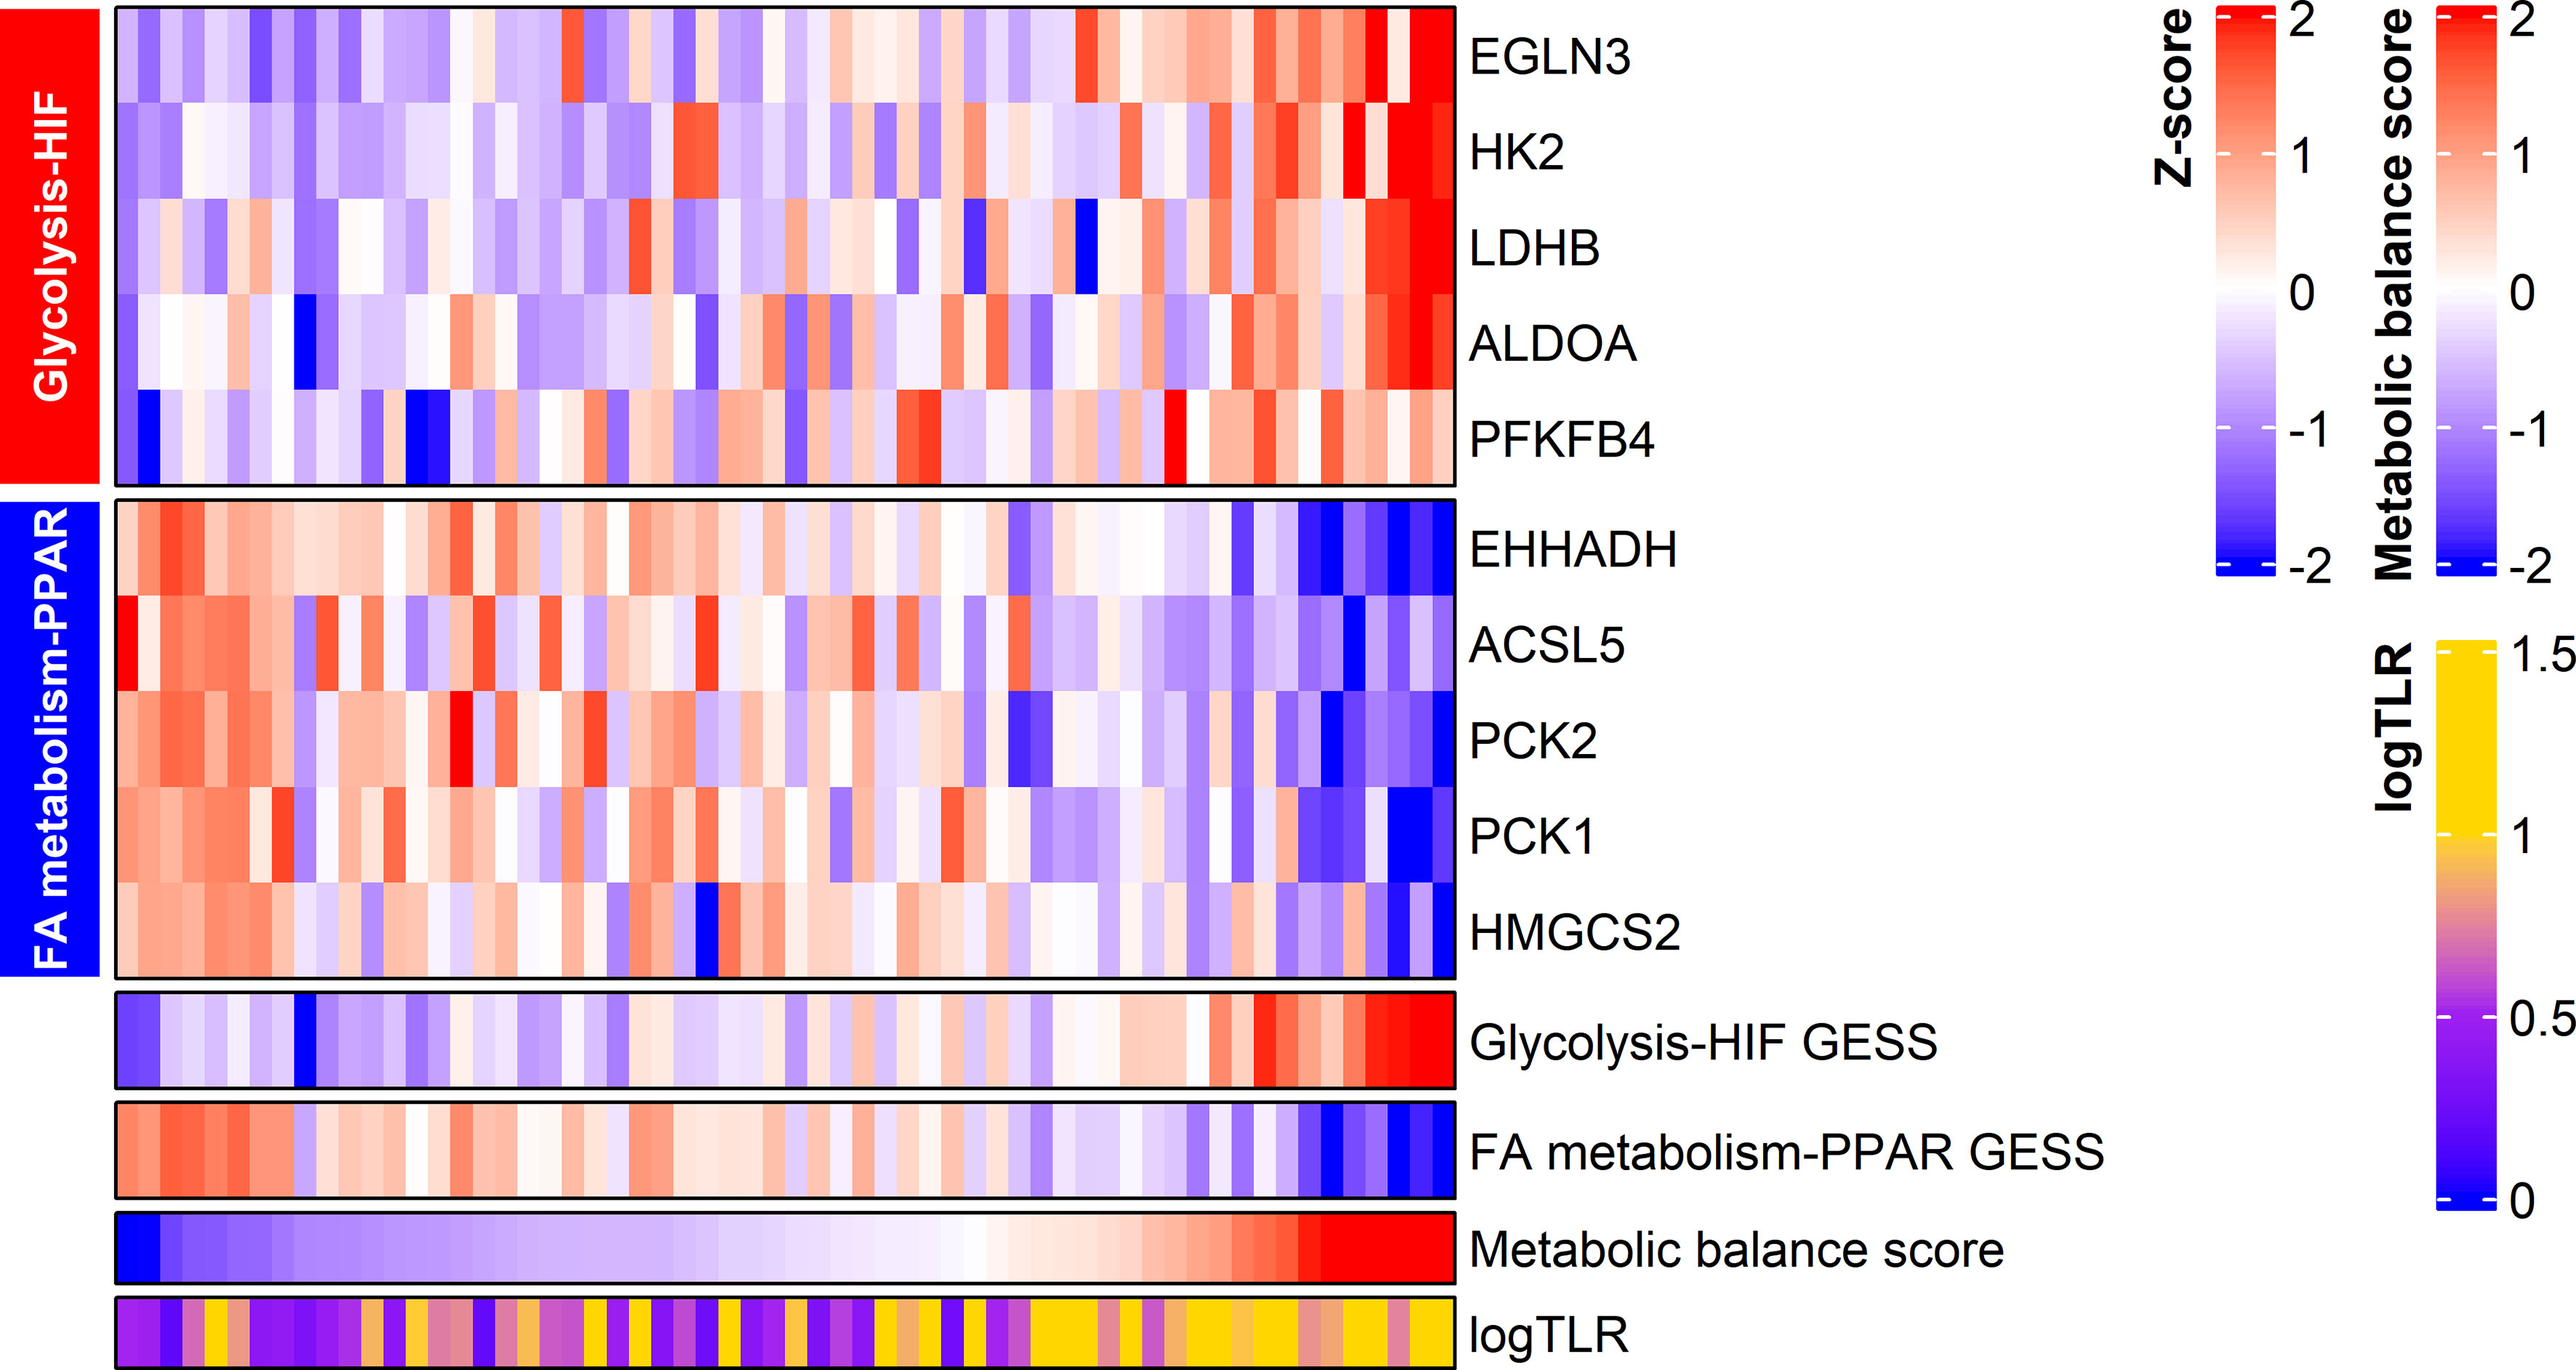
Figure 2 Expression of metabolism-associated genes related to HCC tumor FDG uptake. The expression of the top five genes from each gene set are displayed in the heatmap. Metabolic balance score showed a positive correlation with TLR in HCC. logTLR, tumor-to-normal liver standardized uptake value ratio in log scale base 2; HIF, hypoxia-inducible factor-1; FA, fatty acid.
By means of univariable Cox regression analysis for DFS, PFKFB4, ALDOA, EGLN3, CYP4A22, PCK1, ACADL, CYP4A11, EHHADH, GAPDH, HMGCS2, and ENO2 genes were found to have p-values of less than 0.1 in Wald test. In multivariate Cox regression analysis for DFS, PFKFB4 was an independent prognostic gene (Table 2). In univariable Cox regression analysis for OS, PFKFB4, EGLN3, ALDOA, GAPDH, HK2, ENO2, PFKFB3, HIF1A, HMGCS2, EHHADH, ECI1, and LDHB genes had p-values less than 0.1. In multivariable Cox regression analysis for OS, PFKFB4, EGLN3, GAPDH, HMGCS2, and ECI1 were independent prognostic genes (Table 3).
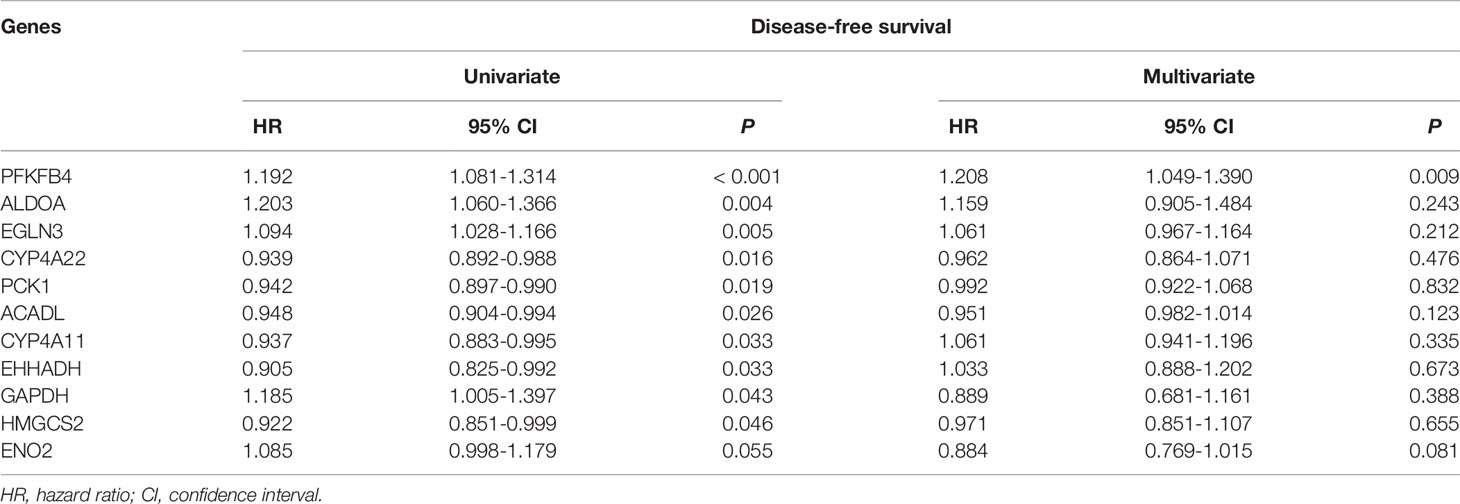
Table 2 Cox regression analysis of disease-free survival for metabolism-associated genes.
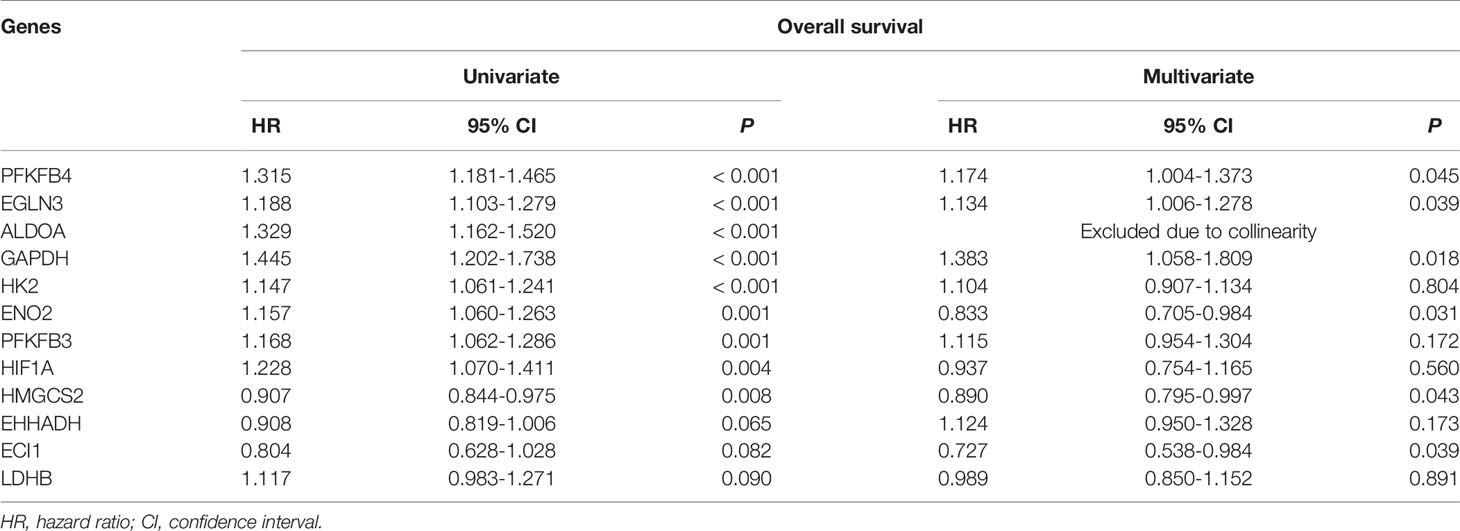
Table 3 Cox regression analysis of overall survival for metabolism-associated genes.
Seven metabolism-associated genes, including PFKFB4, ALDOA, EGLN3, EHHADH, GAPDH, HMGCS2, and ENO2, were potential prognostic biomarkers for HCC. Kaplan-Meier curves showed a significantly worse DFS (p = 0.001) and OS (p < 0.001) in patients with high-risk GESS compared to those with low-risk GESS (Figure 3). The expression levels of PFKFB4, ALDOA, EGLN3, GAPDH, and ENO2 were significantly higher in the high-risk group for OS, while the expression levels of EHHADH and HMGCS2 were significantly lower in the high-risk group for OS (p < 0.001, Figure 4).
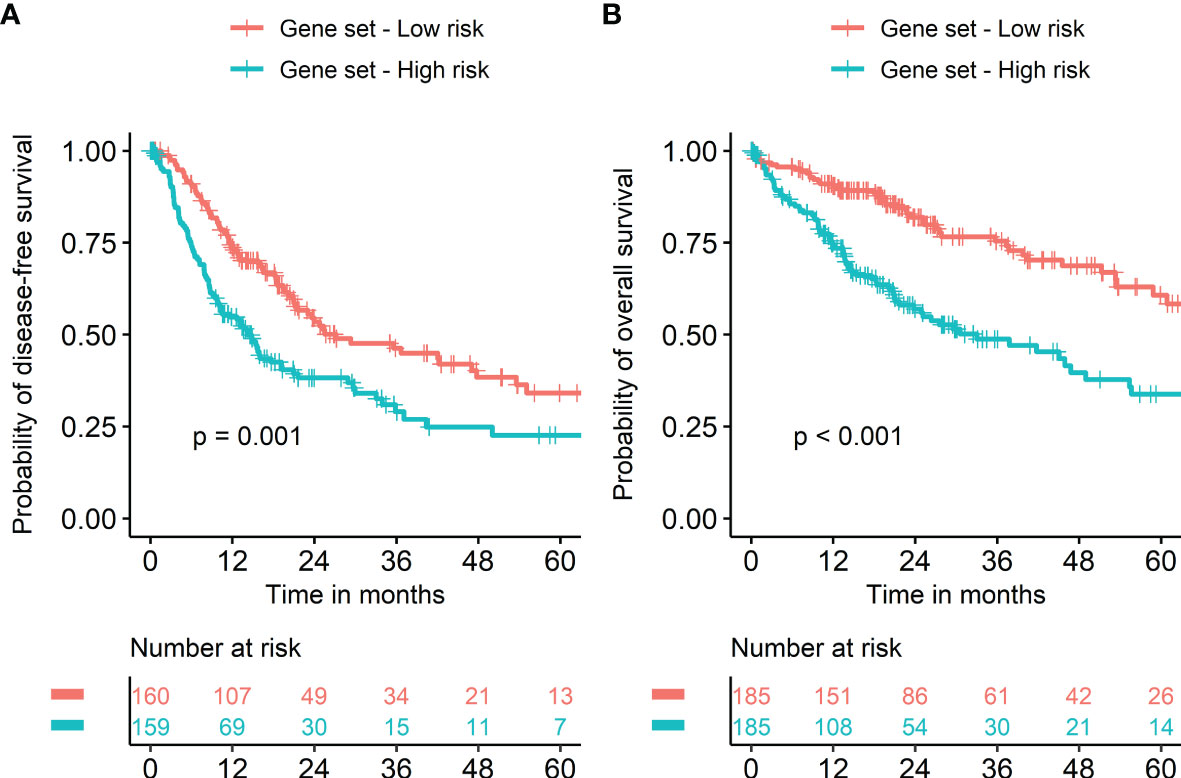
Figure 3 Survival of HCC patients according to the biomarker gene expression signature. Risk groups were classified according to prognostic index with seven biomarker genes (PFKFB4, ALDOA, EGLN3, EHHADH, GAPDH, HMGCS2, and ENO2). Kaplan‐Meier curves showed a significantly worse prognosis in patients with high-risk gene expression signatures compared to those with low-risk gene expression signatures in terms of both disease-free (A) and overall survival (B).
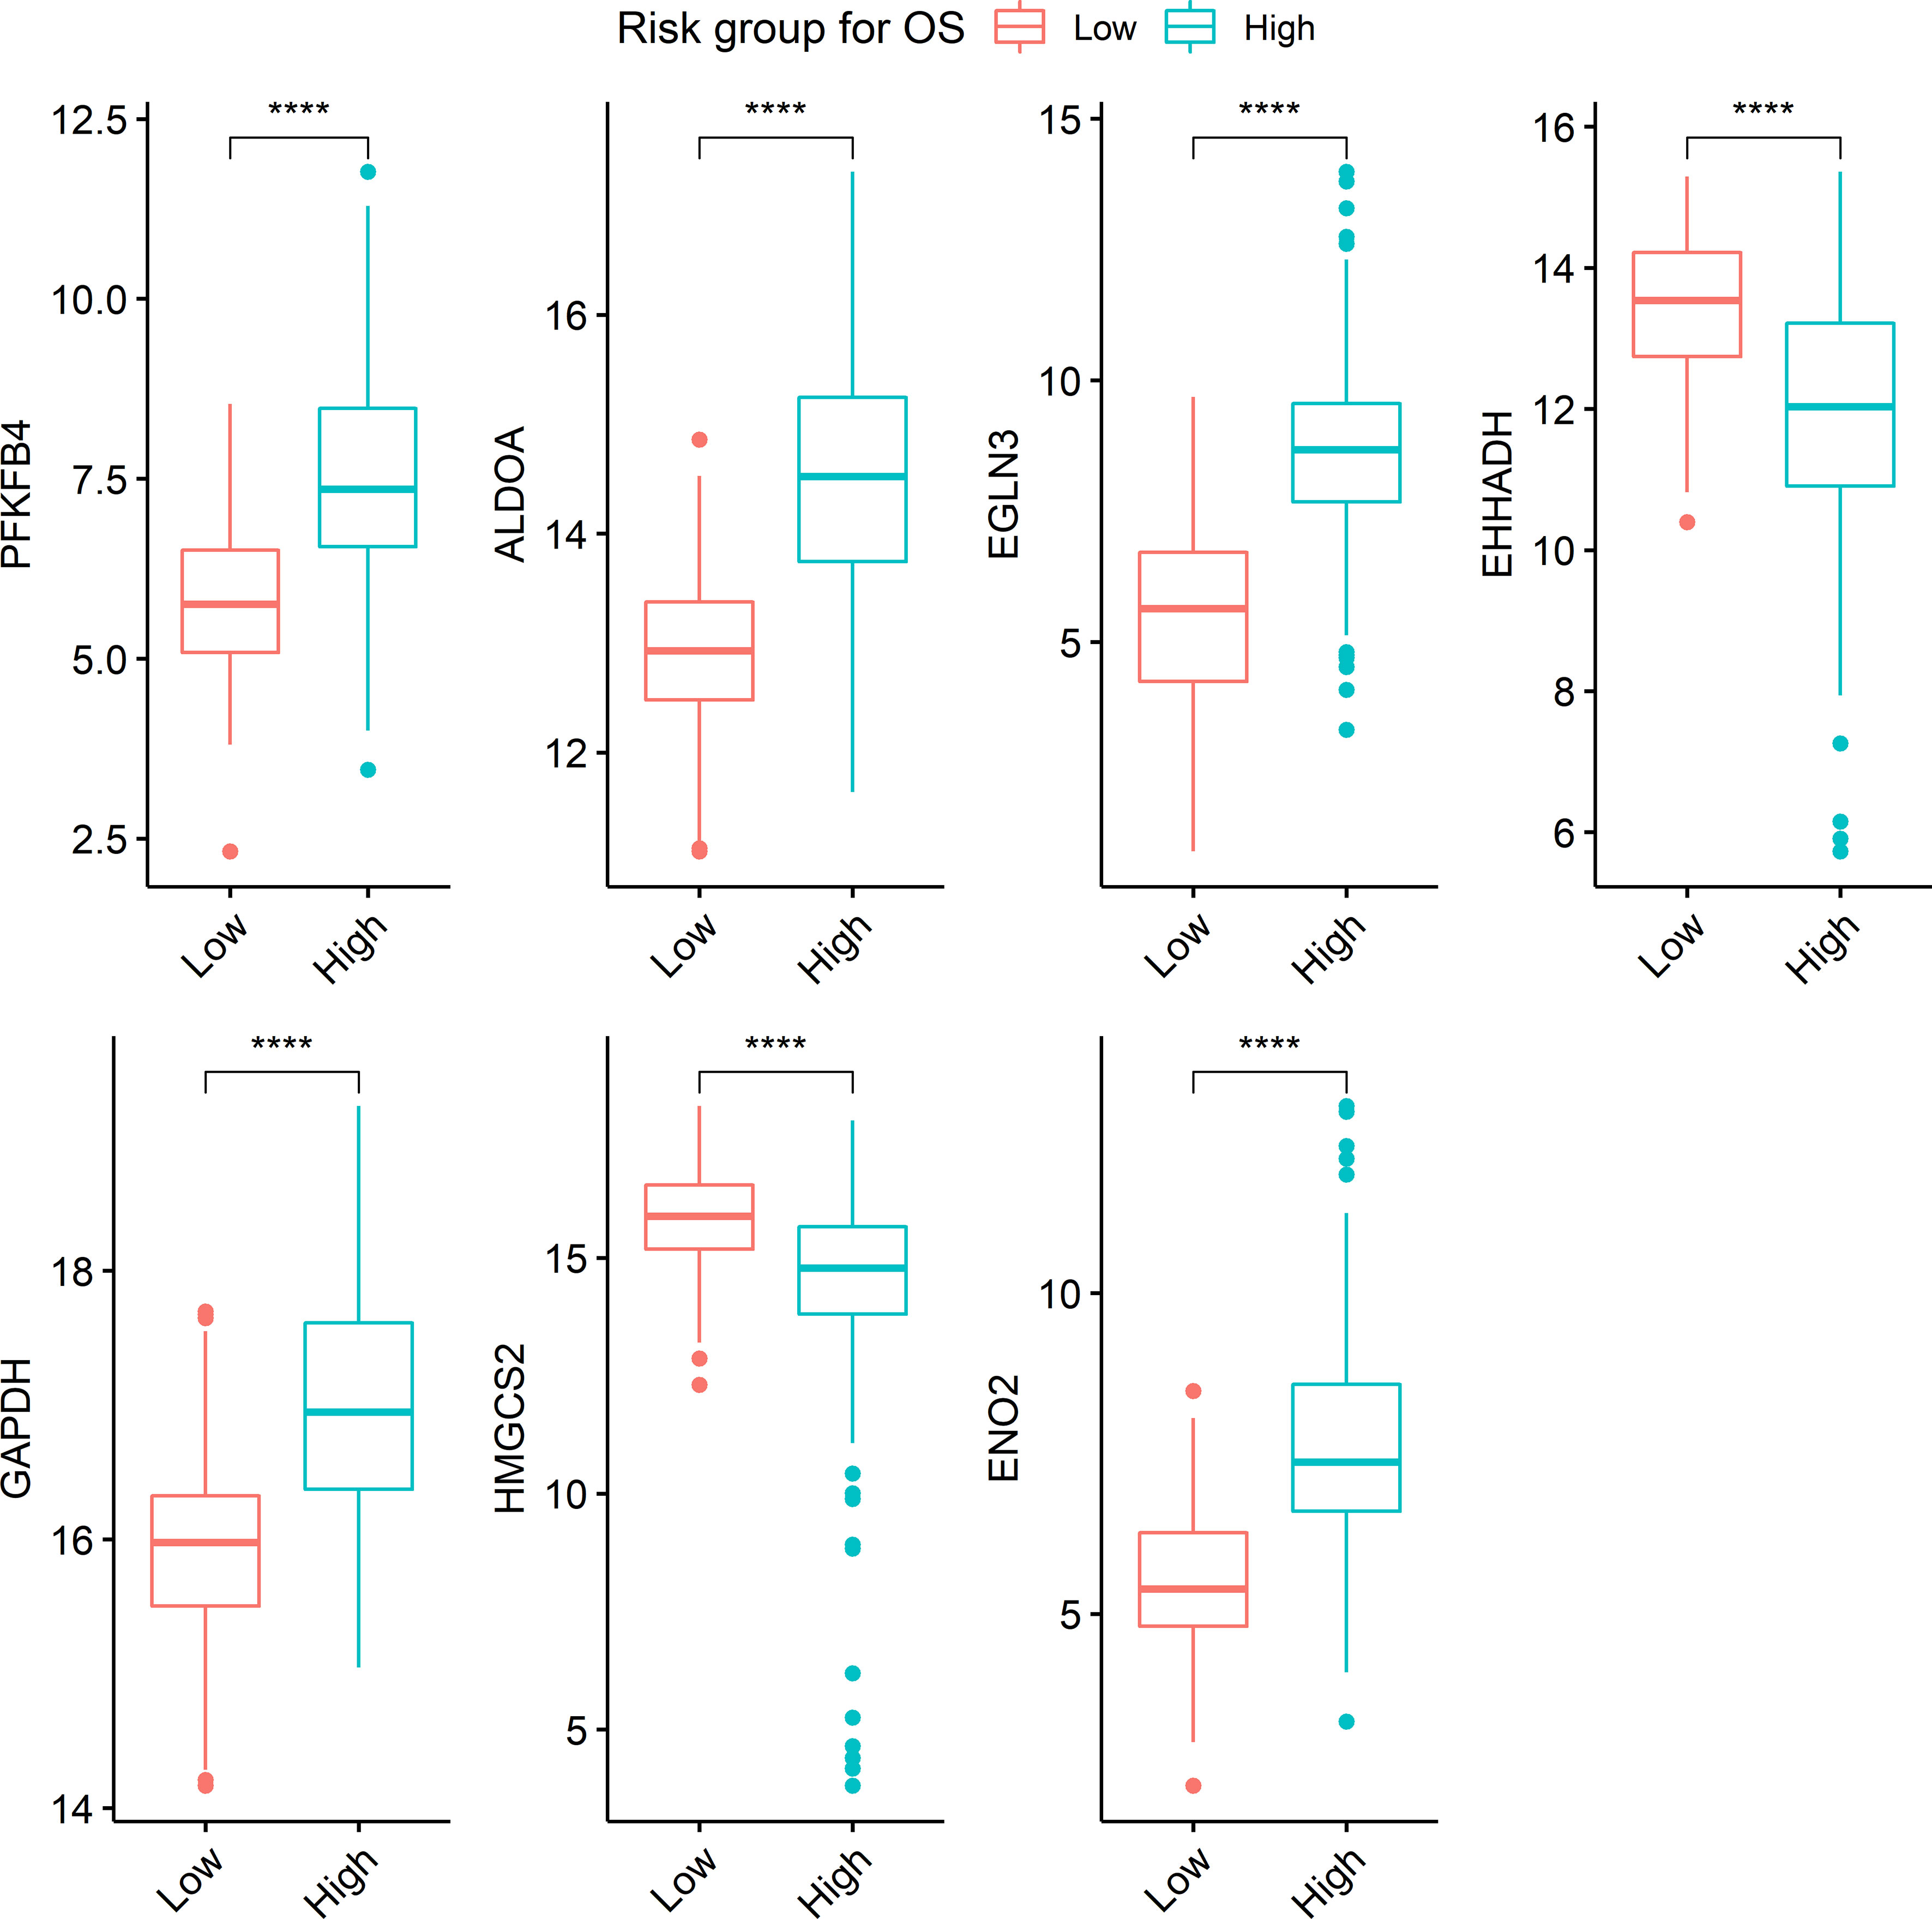
Figure 4 Boxplots visualizing the expression level of genes according to risk groups. ****The expression level of each gene was significantly different between risk groups (p < 0.001). Boxplots represent the expression level of seven genes, PFKFB4, ALDOA, EGLN3, EHHADH, GAPDH, HMGCS2, and ENO2.
Stratifying metabolic balance scores using a cutoff of zero demonstrated significant differences in DFS (HR = 1.22 and p = 0.002) and OS (HR = 1.33 and p < 0.001) according to metabolic dominance (glucose versus lipid, Figure 5). The proportion of high-risk patients with TP53-mutant HCC was significantly higher than that of those with wild-type TP53 (57.9% vs. 36.7%, p < 0.001, Supplementary Figure 1A). The proportion of low-risk patients with CTNNB1-mutant HCC was significantly higher than that of patients with wild-type CTNNB-1 (74.7% vs. 53.0%, p < 0.001, Supplementary Figure 1B). A heatmap was used to visualize the expression level of 30 metabolism-associated genes according to risk group (Supplementary Figure 2).
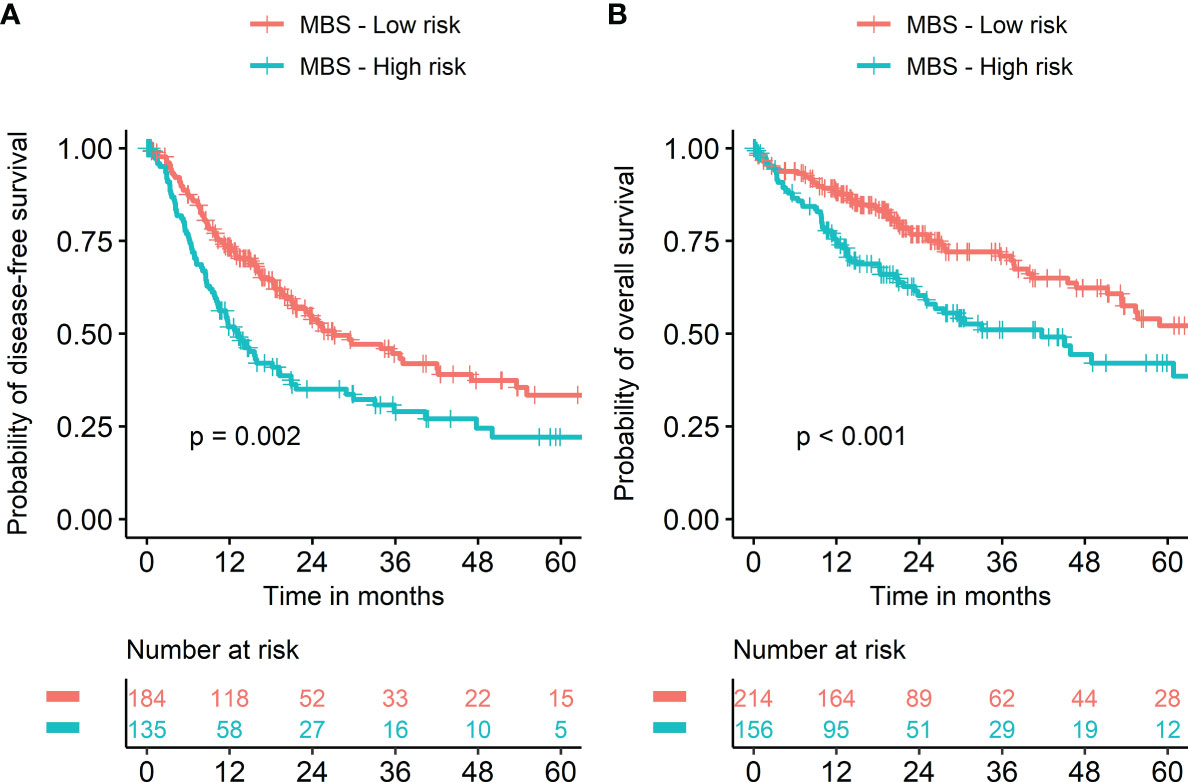
Figure 5 Kaplan‐Meier survival curves according to metabolic balance score. Risk groups were classified into two groups using metabolic balance score (MBS). Kaplan‐Meier curves showed significantly worse prognosis in patients with high MBS compared to those with low MBS in terms of both disease-free (A) and overall survival (B).
FDG PET/CT is the representative imaging modality to explore biologic tumor characteristics. Particularly in HCC, FDG PET/CT imaging findings have unique characteristics compared to other malignancies. Although many kinds of malignancies show high FDG uptake, it is not uncommon for HCC tumors to show low FDG uptake or isometabolic uptake, which is difficult to discriminate from normal liver tissue. This is not only due to the relatively high physiologic uptake of liver tissue but also due to the biologic characteristics of HCC. Therefore, previous studies have attempted to investigate proteins and genes affecting FDG uptake in HCC. Izuishi et al. showed that increased levels of GLUT1 and decreased levels of glucose-6-phosphatase are associated with high HCC FDG uptake (22). Chen et al. revealed an inverse correlation between the expression of fructose 1,6-bisphosphatase 1 and FDG uptake (23). Lee et al. investigated the characteristics of gene expression profiles according to FDG uptake in ten patients with HCC (17). Contrary to the aforementioned research, the present study performed an explorative investigation of metabolism-associated gene expression within 60 patients, which is the largest cohort for a radiogenomics HCC study to the best of our knowledge.
In this study, molecular pathways of glycolysis and HIF-1 signaling were revealed to be positively associated with HCC tumor FDG uptake. Glycolysis is the most representative mechanism to affect tumor glucose uptake. Tumor cells promote HIF-1 signaling to resist hypoxic conditions. The HIF-1 signaling pathway enhances the anaerobic glycolytic pathway to provide energy for tumor cells (24). The result of this study implies that resistance to hypoxic conditions mainly contributes to glucose uptake in HCC. Although there are previous reports that HIF-1 signaling correlates with FDG uptake in other types of cancer, such as lung cancer and breast cancer (25, 26), there was no transcriptomic evidence of the association between HIF-1 signaling and FDG uptake in HCC.
Notably, PFKFB4 showed a significant, positive correlation with FDG uptake. It was a significant, independent prognostic gene for survival in the TCGA-LIHC dataset. PFKFB enzymes produce fructose-2,6-bisphosphate, which activates 6-phosphofructo-1-kinase, a rate-limiting enzyme in glycolysis (27). It was revealed as a poor prognostic factor in HCC (28). Interestingly, EGLN3 was another significant, independent prognostic gene for OS in the TCGA-LIHC dataset among the other metabolism-associated genes related to tumor FDG uptake. PHD3, which is a protein encoded by the EGLN3 gene, has tumor suppressor functions in various cancer types (29–31). However, there is controversy surrounding the prognostic value of PHD3 in cancer. Previous studies suggested that PHD3 downregulation is correlated with HCC aggressiveness and poor prognosis (32, 33). On the other hand, some reports indicated that increased PHD3 had an association with poor prognosis in other cancer subtypes (34, 35). The results of this study support the effect of increased PHD3 on unfavorable prognosis. EGLN3, a target gene of the HIF-1 protein, induces positive feedback following enhanced HIF-1 activity (36). In this regard, increased PHD3 expression under hypoxia was shown to enhance cancer cell survival and the progression of disease (37). In addition, PFKFB4 is induced by HIF-1 activation in hypoxic conditions (38). In brief, it is suggested that upregulation of the glycolytic pathway via PFKFB4 in hypoxic conditions mainly affects poor prognosis in HCC. Furthermore, the results of the present study strongly support previous knowledge that high tumor FDG uptake in HCC is associated with poor prognosis and hypoxic tumor microenvironmental conditions (14, 15).
Fatty acid metabolism and PPAR signaling were downregulated functions alongside increased FDG uptake. This result is readily understandable, as the PPAR signaling pathway regulates fatty acid oxidation (39). Tanaka et al. suggested the de-differentiation of HCC to be correlated with reduced fatty acid oxidation and increased glycolysis (40). In this aspect, the present study is consistent with the well-established knowledge that poorly differentiated HCCs demonstrate high FDG uptake (41). In addition, HMGCS2 and ECI1, involved with fatty acid metabolism, are correlated with good prognosis with respect to OS, supported by previous knowledge that the suppression of fatty acid oxidation promotes the growth and metastasis of HCC (42). Furthermore, this result supports that PET/CT using C-11 acetate or F-18 fluorocholine tracers to visualize HCC with low FDG uptake due to enhanced fatty acid metabolism (43, 44).
We calculated the unified metabolic reprogramming scale representing the balance between glucose versus lipid metabolism gene expression in HCC. A high metabolic balance score was hypothesized to represent the metabolic shift to glycolytic process from fatty acid metabolism. This score showed an excellent correlation with tumor FDG uptake. The cutoff of zero, which is supposed as the balanced state of glucose versus lipid metabolism, showed good prognostic stratification. In brief, metabolic shift to glucose metabolism from lipid metabolism contributes to tumor FDG uptake and poor prognosis in HCC. Furthermore, there were significant differences in TP53 and CTNNB1 mutation between risk groups according to metabolic balance score. This suggests that metabolic characteristics may be associated with the genetic mutation profile, consistent with a previous report of HCC transcriptome classification demonstrating the associations between TP53 mutation and the cell cycle as well as those between CTNNB1 mutation and the Wnt pathway (45). In addition, there are similar studies reporting enhanced glycolysis in TP53-mutant HCCs and enhanced fatty acid oxidation in CTNNB1-mutant HCCs (46, 47).
We selected seven gene signatures associated with tumor FDG uptake in HCC. A prognostic model with those genes showed excellent stratification for both DFS and OS. In addition, those genes may have significance in selecting potential candidates for individualized therapy in terms of precision medicine. Sorafenib, as a kinase inhibitor, and nivolumab, as an immune checkpoint inhibitor, have been recently used for molecular targeted therapy (3, 4). The therapeutic effect of sorafenib is decreased under hypoxic conditions (48). In addition, suppressing glycolysis results in re-sensitizing HCC cells to sorafenib (49). As glycolytic activity and HIF-1 signaling are activated in tumors with high FDG uptake, the application of sorafenib may be considered referring to FDG PET/CT findings. In particular, CD147 is a favorable therapeutic target with respect to the metabolic reprogramming of HCC. Within glucose metabolism, CD147 promotes tumor growth through the regulation of glycolysis via degradation of p53 protein (50). In addition, p53 downregulates the expression of PFKFB4, which showed an excellent correlation with tumor FDG uptake and good prognostic power in the present study (51). Within fatty acid metabolism, CD147 induces tumor growth by regulating fatty acid oxidation via inhibition of PPAR-alpha. In brief, inhibition of CD147 may be a novel therapeutic strategy for metabolism modulation (52). One clinical study showed the treatment effects of 131I-metuximab, which is a radioimmunoconjugate of iodine-131, and monoclonal antibody targeting CD147. It provided profit in survival rate and recurrence rate in HCC patients that underwent radiofrequency ablation (53). This study indicates that FDG PET/CT may be a good diagnostic modality to select candidates for metabolism-targeted therapy. CD147-targeted therapy to inhibit glycolysis and disinhibit fatty acid metabolism should be considered for patients with high tumor FDG uptake. Further study is warranted to evaluate the role of FDG PET/CT imaging biomarkers to select appropriate patients for metabolism-targeting therapy.
In brief, the present study has several clinical implications. First, conventional microscopic assessment of HCC is not fully standardized so that there is limitation to predict prognosis and select individualized therapeutic option accurately. The concrete transcriptomic evidence suggested in this study may be validated and utilized in personalized medicine in terms of tumor metabolism. Second, FDG PET/CT as a non-invasive functional imaging is commonly performed in initial workup for malignant disease including HCC. It is usually conducted prior to biopsy or surgery which allows obtaining histological samples. Metabolic characteristics of HCC as well as presence of metastasis provided by FDG PET/CT will contribute to predict prognosis and plan further treatment or follow-up. Furthermore, it is expected to support surrogate information for histopathologic findings as TLR showed a good association with microvascular invasion which is an important prognostic factor (data not shown). Third, transcriptomic examination is not commonly utilized in clinical field due to its high cost and requirement of high-end analytic instruments. FDG PET/CT may provide information of glucose metabolism which can be obtained from genomic analysis. In addition, a useful complementary information for lipid metabolism of HCC can be obtained with other tracers such as F-18 fluorocholine (54, 55).
There are several limitations to this study. First, a prognostic validation analysis could not be performed in subjects with both FDG PET/CT imaging and RNA-seq data due to a limited sample size. Further study as an internal and external validation is warranted to analyze prognostic power. Second, we have focused on metabolism-associated genes related to tumor FDG uptake. Although there are many biological functions and pathways that affect tumor FDG uptake in HCC, we did not cover the whole transcriptome. Nevertheless, the limited scope of subject genes aided in the analysis of significant molecular pathways by removing genes irrelevant to key metabolic processes.
In conclusion, metabolism-associated genes and molecular functions associated with tumor FDG uptake were explored in HCC. Increased tumor FDG uptake was found to be associated with glycolysis and HIF-1 signaling pathway upregulation, whereas fatty acid metabolism and PPAR signaling were downregulated. Metabolic balance score representing the gene expression balance between glucose versus lipid metabolism in HCC showed a good association with tumor FDG uptake. It also showed excellent prognostic power in the TCGA-LIHC dataset. Seven genes, PFKFB4, ALDOA, EGLN3, EHHADH, GAPDH, HMGCS2, and ENO2, related to tumor FDG uptake were revealed to have a good prognostic value for survival in HCC. This study suggested key metabolic pathways to potentially affect tumor FDG uptake in HCC. The transcriptomic evidence of this study strongly supports the prognostic power of FDG PET/CT and indicates the potential usefulness of FDG PET/CT imaging to select appropriate HCC patients for metabolism-targeted therapy.
The datasets presented in this study can be found in online repositories. The names of the repository/repositories and accession number(s) can be found below: NCBI under BioProject PRJNA794275.
The studies involving human participants were reviewed and approved by Samsung Medical Center Institutional Review Board. Written informed consent for participation was not required for this study in accordance with the national legislation and the institutional requirements.
HL, JYC, and SH designed the study. J-GJ, J-WJ, and JK contributed to data collection. HL and SH performed data analysis and interpretation. HL and SH drafted the article. JYC and J-GJ provided critical revision of the article. All authors contributed to the article and approved the submitted version.
This research was supported by the Basic Science Research Program through the National Research Foundation of Korea (NRF) funded by the Ministry of Science and ICT (Grant No. NRF-2017R1A2B4006598).
The authors declare that the research was conducted in the absence of any commercial or financial relationships that could be construed as a potential conflict of interest.
All claims expressed in this article are solely those of the authors and do not necessarily represent those of their affiliated organizations, or those of the publisher, the editors and the reviewers. Any product that may be evaluated in this article, or claim that may be made by its manufacturer, is not guaranteed or endorsed by the publisher.
The Supplementary Material for this article can be found online at: https://www.frontiersin.org/articles/10.3389/fonc.2022.845900/full#supplementary-material
Supplementary Figure 1 | The proportion of high-risk patients according to TP53 and CTNNB1 mutation status. (A) The proportion of high-risk patients with TP53-mutant HCC was significantly higher than that of those with wild-type TP53 (57.9% vs. 36.7%, p < 0.001). (B) The proportion of low-risk patients with CTNNB1-mutant HCC was significantly higher than that of patients with wild-type CTNNB-1 (74.7% vs. 53.0%, p < 0.001). Mut (+), mutant; WT, wild type.
Supplementary Figure 2 | The expression of 30 metabolism-associated genes according to prognostic index. Subjects were plotted in increasing order of prognostic index in the heatmap. Expression of glycolysis-associated genes increases along prognostic index, whereas that of fatty acid metabolism-associated genes decreases. OS, overall survival; HIF, hypoxia-inducible factor-1; FA, fatty acid.
Supplementary Table 1 | Results of correlation analysis between expression of metabolism-associated genes and tumor FDG uptake in HCC.
1. El-Serag HB. “The Liver: Biology and Pathobiology,”. Epidemiol Hepatocellular Carcinoma Wiley-Blackwell) (2020) 758-72. doi: 10.1002/9781119436812.ch59
2. NCCN. National Comprehensive Cancer Network Hepatobiliary Cancers (Version 5.2021) [Online] (2021). Available at: https://www.nccn.org/professionals/physician_gls/pdf/hepatobiliary.pdf (Accessed October 21, 2021).
3. Llovet J, Ricci S, Mazzaferro V, Hilgard P, Raoul J, Zeuzem S, et al. Randomized Phase III Trial of Sorafenib Versus Placebo in Patients With Advanced Hepatocellular Carcinoma (HCC). J Clin Oncol (2007) 25(18_suppl):LBA1–1. doi: 10.1200/jco.2007.25.18_suppl.lba1
4. El-Khoueiry AB, Sangro B, Yau T, Crocenzi TS, Kudo M, Hsu C, et al. Nivolumab in Patients With Advanced Hepatocellular Carcinoma (CheckMate 040): An Open-Label, non-Comparative, Phase 1/2 Dose Escalation and Expansion Trial. Lancet (2017) 389(10088):2492–502. doi: 10.1016/S0140-6736(17)31046-2
5. Chevret S, Trinchet J-C, Mathieu D, Abou Rached A, Beaugrand M, Chastang C, et al. A New Prognostic Classification for Predicting Survival in Patients With Hepatocellular Carcinoma. J Hepatol (1999) 31(1):133–41. doi: 10.1016/s0168-8278(99)80173-1
6. Tamura S, Kato T, Berho M, Misiakos EP, O’Brien C, Reddy KR, et al. Impact of Histological Grade of Hepatocellular Carcinoma on the Outcome of Liver Transplantation. Arch Surg (2001) 136(1):25–30. doi: 10.1001/archsurg.136.1.25
7. Takahashi S, Kudo M, Chung H, Inoue T, Ishikawa E, Kitai S, et al. PIVKA-II is the Best Prognostic Predictor in Patients With Hepatocellular Carcinoma After Radiofrequency Ablation Therapy. Oncology (2008) 75(Suppl 1):91–8. doi: 10.1159/000173429
8. Antoch G, Saoudi N, Kuehl H, Dahmen G, Mueller SP, Beyer T, et al. Accuracy of Whole-Body Dual-Modality Fluorine-18–2-Fluoro-2-Deoxy-D-Glucose Positron Emission Tomography and Computed Tomography (FDG-PET/CT) for Tumor Staging in Solid Tumors: Comparison With CT and PET. J Clin Oncol (2004) 22(21):4357–68. doi: 10.1200/JCO.2004.08.120
9. Murakami T, Mochizuki K, Nakamura H. Imaging Evaluation of the Cirrhotic Liver. Semin Liver Dis (2001) 21(02):213–24. doi: 10.1055/s-2001-15497
10. Khan MA, Combs CS, Brunt EM, Lowe VJ, Wolverson MK, Solomon H, et al. Positron Emission Tomography Scanning in the Evaluation of Hepatocellular Carcinoma. J Hepatol (2000) 32(5):792–7. doi: 10.1016/s0168-8278(00)80248-2
11. Teefey SA, Hildeboldt CC, Dehdashti F, Siegel BA, Peters MG, Heiken JP, et al. Detection of Primary Hepatic Malignancy in Liver Transplant Candidates: Prospective Comparison of CT, MR Imaging, US, and PET. Radiology (2003) 226(2):533–42. doi: 10.1148/radiol.2262011980
12. Lee JW, Paeng JC, Kang KW, Kwon HW, Suh K-S, Chung J-K, et al. Prediction of Tumor Recurrence by 18F-FDG PET in Liver Transplantation for Hepatocellular Carcinoma. J Nucl Med (2009) 50(5):682–7. doi: 10.2967/jnumed.108.060574
13. Pant V, Sen IB, Soin AS. Role of 18F-FDG PET CT as an Independent Prognostic Indicator in Patients With Hepatocellular Carcinoma. Nucl Med Commun (2013) 34(8):749–57. doi: 10.1097/MNM.0b013e3283622eef
14. Lee JW, Oh JK, Chung YA, Na SJ, Hyun SH, Hong IK, et al. Prognostic Significance of 18F-FDG Uptake in Hepatocellular Carcinoma Treated With Transarterial Chemoembolization or Concurrent Chemoradiotherapy: A Multicenter Retrospective Cohort Study. J Nucl Med (2016) 57(4):509–16. doi: 10.2967/jnumed.115.167338
15. Na SJ, Oh JK, Hyun SH, Lee JW, Hong IK, Song B-I, et al. 18f-FDG PET/CT can Predict Survival of Advanced Hepatocellular Carcinoma Patients: A Multicenter Retrospective Cohort Study. J Nucl Med (2017) 58(5):730–6. doi: 10.2967/jnumed.116.182022
16. Lee JD, Yang WI, Park YN, Kim KS, Choi JS, Yun M, et al. Different Glucose Uptake and Glycolytic Mechanisms Between Hepatocellular Carcinoma and Intrahepatic Mass-Forming Cholangiocarcinoma With Increased 18F-FDG Uptake. J Nucl Med (2005) 46(10):1753–9.
17. Lee JD, Yun M, Lee JM, Choi Y, Choi Y-H, Kim JS, et al. Analysis of Gene Expression Profiles of Hepatocellular Carcinomas With Regard to 18 F-Fluorodeoxyglucose Uptake Pattern on Positron Emission Tomography. Eur J Nucl Med Mol Imaging (2004) 31(12):1621–30. doi: 10.1007/s00259-004-1602-1
18. Xia H, Chen J, Gao H, Kong SN, Deivasigamani A, Shi M, et al. Hypoxia-Induced Modulation of Glucose Transporter Expression Impacts 18F-Fluorodeoxyglucose PET-CT Imaging in Hepatocellular Carcinoma. Eur J Nucl Med Mol Imaging (2020) 47(4):787–97. doi: 10.1007/s00259-019-04638-4
19. Duan Y, Evans DS, Miller RA, Schork NJ, Cummings SR, Girke T. Signaturesearch: Environment for Gene Expression Signature Searching and Functional Interpretation. Nucleic Acids Res (2020) 48(21):e124–4. doi: 10.1093/nar/gkaa878
20. Chae YK, Chang S, Ko T, Anker J, Agte S, Iams W, et al. Epithelial-Mesenchymal Transition (EMT) Signature is Inversely Associated With T-Cell Infiltration in non-Small Cell Lung Cancer (NSCLC). Sci Rep (2018) 8(1):1–8. doi: 10.1038/s41598-018-21061-1
21. Mayakonda A, Lin D-C, Assenov Y, Plass C, Koeffler HP. Maftools: Efficient and Comprehensive Analysis of Somatic Variants in Cancer. Genome Res (2018) 28(11):1747–56. doi: 10.1101/gr.239244.118
22. Izuishi K, Yamamoto Y, Mori H, Kameyama R, Fujihara S, Masaki T, et al. Molecular Mechanisms of [18F] Fluorodeoxyglucose Accumulation in Liver Cancer. Oncol Rep (2014) 31(2):701–6. doi: 10.3892/or.2013.2886
23. Chen R, Li J, Zhou X, Liu J, Huang G. Fructose-1, 6-Bisphosphatase 1 Reduces 18F FDG Uptake in Hepatocellular Carcinoma. Radiology (2017) 284(3):844–53. doi: 10.1148/radiol.2017161607
24. Harris AL. Hypoxia—a Key Regulatory Factor in Tumour Growth. Nat Rev Cancer (2002) 2(1):38–47. doi: 10.1038/nrc704
25. Bos R, van der Hoeven JJ, van der Wall E, van der Groep P, Van Diest PJ, Comans EF, et al. Biologic Correlates of 18fluorodeoxyglucose Uptake in Human Breast Cancer Measured by Positron Emission Tomography. J Clin Oncol (2002) 20(2):379–87. doi: 10.1200/JCO.2002.20.2.379
26. Heiden BT, Chen G, Hermann M, Brown RK, Orringer MB, Lin J, et al. 18f-FDG PET Intensity Correlates With a Hypoxic Gene Signature and Other Oncogenic Abnormalities in Operable non-Small Cell Lung Cancer. PloS One (2018) 13(7):e0199970. doi: 10.1371/journal.pone.0199970
27. Yalcin A, Telang S, Clem B, Chesney J. Regulation of Glucose Metabolism by 6-Phosphofructo-2-Kinase/Fructose-2, 6-Bisphosphatases in Cancer. Exp Mol Med (2009) 86(3):174–9. doi: 10.1016/j.yexmp.2009.01.003
28. Zhang X, Li J, Ghoshal K, Fernandez S, Li L. Identification of a Subtype of Hepatocellular Carcinoma With Poor Prognosis Based on Expression of Genes Within the Glucose Metabolic Pathway. Cancers (Basel) (2019) 11(12):2023. doi: 10.3390/cancers11122023
29. Su Y, Loos M, Giese N, Hines O, Diebold I, Görlach A, et al. PHD3 Regulates Differentiation, Tumour Growth and Angiogenesis in Pancreatic Cancer. Br J Cancer (2010) 103(10):1571–9. doi: 10.1038/sj.bjc.6605936
30. Garvalov BK, Foss F, Henze A-T, Bethani I, Gräf-Höchst S, Singh D, et al. PHD3 Regulates EGFR Internalization and Signalling in Tumours. Nat Commun (2014) 5:5577. doi: 10.1038/ncomms6577
31. Henze A-T, Garvalov BK, Seidel S, Cuesta AM, Ritter M, Filatova A, et al. Loss of PHD3 Allows Tumours to Overcome Hypoxic Growth Inhibition and Sustain Proliferation Through EGFR. Nat Commun (2014) 5:5582. doi: 10.1038/ncomms6582
32. Ma M, Hua S, Li G, Wang S, Cheng X, He S, et al. Prolyl Hydroxylase Domain Protein 3 and Asparaginyl Hydroxylase Factor Inhibiting HIF-1 Levels are Predictive of Tumoral Behavior and Prognosis in Hepatocellular Carcinoma. Oncotarget (2017) 8(8):12983–3002. doi: 10.18632/oncotarget.14677
33. Shi M, Dai W-Q, Jia R-R, Zhang Q-H, Wei J, Wang Y-G, et al. APCCDC20-Mediated Degradation of PHD3 Stabilizes HIF-1a and Promotes Tumorigenesis in Hepatocellular Carcinoma. Cancer Lett (2021) 496:144–55. doi: 10.1016/j.canlet.2020.10.011
34. Couvelard A, Deschamps L, Rebours V, Sauvanet A, Gatter K, Pezzella F, et al. Overexpression of the Oxygen Sensors PHD-1, PHD-2, PHD-3, and FIH Is Associated With Tumor Aggressiveness in Pancreatic Endocrine Tumors. Clin Cancer Res (2008) 14(20):6634–9. doi: 10.1158/1078-0432.CCR-07-5258
35. Andersen S, Donnem T, Stenvold H, Al-Saad S, Al-Shibli K, Busund L-T, et al. Overexpression of the HIF Hydroxylases PHD1, PHD2, PHD3 and FIH are Individually and Collectively Unfavorable Prognosticators for NSCLC Survival. PloS One (2011) 6(8):e23847. doi: 10.1371/journal.pone.0023847
36. Luo W, Hu H, Chang R, Zhong J, Knabel M, O’Meally R, et al. Pyruvate Kinase M2 is a PHD3-Stimulated Coactivator for Hypoxia-Inducible Factor 1. Cell (2011) 145(5):732–44. doi: 10.1016/j.cell.2011.03.054
37. Chu X, Xiang M, Feng L, Liu H, Zhou C. Prolyl Hydroxylase 3 Involvement in Lung Cancer Progression Under Hypoxic Conditions: Association With Hypoxia-Inducible Factor-1α and Pyruvate Kinase M2. J Thorac Dis (2019) 11(9):3941–50. doi: 10.21037/jtd.2019.08.124
38. Chesney J, Clark J, Klarer AC, Imbert-Fernandez Y, Lane AN, Telang S. Fructose-2, 6-Bisphosphate Synthesis by 6-Phosphofructo-2-Kinase/Fructose-2, 6-Bisphosphatase 4 (PFKFB4) is Required for the Glycolytic Response to Hypoxia and Tumor Growth. Oncotarget (2014) 5(16):6670–86. doi: 10.18632/oncotarget.2213
39. Smith S. Peroxisome Proliferator-Activated Receptors and the Regulation of Mammalian Lipid Metabolism. Biochem Soc Trans (2002) 30(6):1086–90. doi: 10.1042/bst0301086
40. Tanaka M, Masaki Y, Tanaka K, Miyazaki M, Kato M, Sugimoto R, et al. Reduction of Fatty Acid Oxidation and Responses to Hypoxia Correlate With the Progression of De-Differentiation in HCC. Mol Med Rep (2013) 7(2):365–70. doi: 10.3892/mmr.2012.1201
41. Torizuka T, Tamaki N, Inokuma T, Magata Y, Sasayama S, Yonekura Y, et al. In Vivo Assessment of Glucose Metabolism in Hepatocellular Carcinoma With FDG-PET. J Nucl Med (1995) 36(10):1811–7.
42. Yuan P, Mu J, Wang Z, Ma S, Da X, Song J, et al. Down-Regulation of SLC25A20 Promotes Hepatocellular Carcinoma Growth and Metastasis Through Suppression of Fatty-Acid Oxidation. Cell Death Dis (2021) 12(4):361. doi: 10.1038/s41419-021-03648-1
43. Ho C-L, Simon C, Yeung DW. 11C-Acetate PET Imaging in Hepatocellular Carcinoma and Other Liver Masses. J Nucl Med (2003) 44(2):213–21.
44. Talbot J-N, Gutman F, Fartoux L, Grange J-D, Ganne N, Kerrou K, et al. PET/CT in Patients With Hepatocellular Carcinoma Using [18 F] Fluorocholine: Preliminary Comparison With [18 F] FDG PET/CT. Eur J Nucl Med Mol Imaging (2006) 33(11):1285–9. doi: 10.1007/s00259-006-0164-9
45. Boyault S, Rickman DS, De Reyniès A, Balabaud C, Rebouissou S, Jeannot E, et al. Transcriptome Classification of HCC is Related to Gene Alterations and to New Therapeutic Targets. Hepatology (2007) 45(1):42–52. doi: 10.1002/hep.21467
46. Senni N, Savall M, Granados DC, Alves-Guerra M-C, Sartor C, Lagoutte I, et al. β-Catenin-Activated Hepatocellular Carcinomas are Addicted to Fatty Acids. Gut (2019) 68(2):322–34. doi: 10.1136/gutjnl-2017-315448
47. Chen P-M, Li J-R, Liu C-C, Tang F-Y, Chiang E-PI. Metabolic Pathways Enhancement Confers Poor Prognosis in P53 Exon Mutant Hepatocellular Carcinoma. Cancer Inform (2020) 19:1176935119899913. doi: 10.1177/1176935119899913
48. Méndez-Blanco C, Fondevila F, García-Palomo A, González-Gallego J, Mauriz JL. Sorafenib Resistance in Hepatocarcinoma: Role of Hypoxia-Inducible Factors. Exp Mol Med (2018) 50(10):1–9. doi: 10.1038/s12276-018-0159-1
49. Feng J, Dai W, Mao Y, Wu L, Li J, Chen K, et al. Simvastatin Re-Sensitizes Hepatocellular Carcinoma Cells to Sorafenib by Inhibiting HIF-1α/PPAR-γ/PKM2-Mediated Glycolysis. J Exp Clin Cancer Res (2020) 39(1):24. doi: 10.1186/s13046-020-1528-x
50. Huang Q, Li J, Xing J, Li W, Li H, Ke X, et al. CD147 Promotes Reprogramming of Glucose Metabolism and Cell Proliferation in HCC Cells by Inhibiting the P53-Dependent Signaling Pathway. J Hepatol (2014) 61(4):859–66. doi: 10.1016/j.jhep.2014.04.035
51. Ros S, Flöter J, Kaymak I, Da Costa C, Houddane A, Dubuis S, et al. 6-Phosphofructo-2-Kinase/Fructose-2, 6-Biphosphatase 4 is Essential for P53-Null Cancer Cells. Oncogene (2017) 36(23):3287–99. doi: 10.1038/onc.2016.477
52. Li J, Huang Q, Long X, Zhang J, Huang X, Aa J, et al. CD147 Reprograms Fatty Acid Metabolism in Hepatocellular Carcinoma Cells Through Akt/mTOR/SREBP1c and P38/Pparα Pathways. J Hepatol (2015) 63(6):1378–89. doi: 10.1016/j.jhep.2015.07.039
53. Bian H, Zheng J-S, Nan G, Li R, Chen C, Hu C-X, et al. Randomized Trial of [131I] Metuximab in Treatment of Hepatocellular Carcinoma After Percutaneous Radiofrequency Ablation. J Natl Cancer Inst (2014) 106(9):dju239. doi: 10.1093/jnci/dju239
54. Talbot J-N, Fartoux L, Balogova S, Nataf V, Kerrou K, Gutman F, et al. Detection of Hepatocellular Carcinoma With PET/CT: A Prospective Comparison of 18F-Fluorocholine and 18F-FDG in Patients With Cirrhosis or Chronic Liver Disease. J Nucl Med (2010) 51(11):1699–706. doi: 10.2967/jnumed.110.075507
55. Fartoux L, Balogova S, Nataf V, Kerrou K, Huchet V, Rosmorduc O, et al. A Pilot Comparison of 18F-Fluorodeoxyglucose and 18F-Fluorocholine PET/CT to Predict Early Recurrence of Unifocal Hepatocellular Carcinoma After Surgical Resection. Nucl Med Commun (2012) 33(7):757–65. doi: 10.1097/MNM.0b013e328350fb9f
Keywords: hepatocellular carcinoma, prognosis, FDG PET/CT, lipid metabolism, glucose metabolism, gene signatures
Citation: Lee H, Choi JY, Joung J-G, Joh J-W, Kim JM and Hyun SH (2022) Metabolism-Associated Gene Signatures for FDG Avidity on PET/CT and Prognostic Validation in Hepatocellular Carcinoma. Front. Oncol. 12:845900. doi: 10.3389/fonc.2022.845900
Received: 30 December 2021; Accepted: 17 January 2022;
Published: 31 January 2022.
Edited by:
Alessandro Passardi, Scientific Institute of Romagna for the Study and Treatment of Tumors (IRCCS), ItalyReviewed by:
Chanisa Chotipanich, European Association of Nuclear Medicine, AustriaCopyright © 2022 Lee, Choi, Joung, Joh, Kim and Hyun. This is an open-access article distributed under the terms of the Creative Commons Attribution License (CC BY). The use, distribution or reproduction in other forums is permitted, provided the original author(s) and the copyright owner(s) are credited and that the original publication in this journal is cited, in accordance with accepted academic practice. No use, distribution or reproduction is permitted which does not comply with these terms.
*Correspondence: Seung Hyup Hyun, c2hubS5oeXVuQHNhbXN1bmcuY29t
†These authors have contributed equally to this work and share first authorship
Disclaimer: All claims expressed in this article are solely those of the authors and do not necessarily represent those of their affiliated organizations, or those of the publisher, the editors and the reviewers. Any product that may be evaluated in this article or claim that may be made by its manufacturer is not guaranteed or endorsed by the publisher.
Research integrity at Frontiers
Learn more about the work of our research integrity team to safeguard the quality of each article we publish.