
94% of researchers rate our articles as excellent or good
Learn more about the work of our research integrity team to safeguard the quality of each article we publish.
Find out more
ORIGINAL RESEARCH article
Front. Oncol. , 10 March 2022
Sec. Hematologic Malignancies
Volume 12 - 2022 | https://doi.org/10.3389/fonc.2022.840616
This article is part of the Research Topic Epidemiological Trends in Hematological Malignancies View all 7 articles
 Yang Ou1
 Yichen Long2
 Lili Ji3
 Yanxia Zhan3
 Tiankui Qiao1Xiangdong Wang1,4
 Hao Chen5*
 Yunfeng Cheng1,3,4,6*
Background: The prognosis of chronic lymphocytic leukemia (CLL) has been improved dramatically, but there are limited studies focusing on CLL disease burden on a global scale. We aimed to evaluate the accurate assessment of the disease burden of CLL that may provide more detailed epidemiological information for rational policies.
Methods: The main source of the data was the Global Burden of Disease (GBD) study 2019. Incident cases, death cases, disability-adjusted life years (DALYs), and their corresponding age-standardized rates (ASRs) from 1990 to 2019 were used to describe the burden of CLL. Data about attributable risk factors were also extracted and analyzed. Bayesian age-period-cohort (BAPC) models were used to assess and project the incidence and mortality rates till 2030.
Results: Globally, the incidence of CLL had been increasing. Deaths and DALYs decreased slightly. The burden of death and DALY is affected by socio-demographic index (SDI). The incidence rate, death rate, and DALY rate of CLL increased significantly with age. Male-to-female ratios of incidence rates varied in different SDI quintiles. Smoking, high body mass index, and occupational exposure to benzene or formaldehyde were the potential risk factors related to CLL. Global ASIRs might tend to increase until 2030, while ASDR would decrease until 2030.
Conclusion: The disease burden of CLL decreased in higher SDI countries but increased in lower ones. Strategies for early detection of asymptomatic CLL, development of novel drugs, and measures against attributable factors should be implemented to combat CLL burden.
Chronic lymphocytic leukemia (CLL) is a mature B-cell neoplasm characterized by the progressive accumulation of monoclonal B lymphocytes. It is the most prevalent type of leukemia in the Western hemisphere, accounting for approximately 25% to 35% of all leukemias in the United States (1). An epidemiologic profile of CLL has been established, such that the disorder is more common in men with a male-to-female ratio of approximately 1.2:1 to 1.7:1 (1, 2). It is considered to be a disease of older adults, with a median age of approximately 70 years at diagnosis (3). The incidence of CLL varies by race and geographic location, which is higher among Caucasians (2, 4) and extremely low in Asia (5, 6).
The development of novel targeted drugs for CLL, including Bruton’s tyrosine kinase inhibitors (BTKi; ibrutinib and acalabrutinib), BCL2 inhibitors (venetoclax), and phosphatidylinositol 3-kinase inhibitors (PI3Ki; idelalisib and duvelisib), has fundamentally changed the CLL therapy landscape (7) and dramatically improves the prognosis of CLL patients in developed countries. Five-year overall survival has been more than 60% in the era of BTKi (8–10), and is about 86% after the advent of venetoclax (11). However, access to these novel agents is still limited to certain developed countries, so every effort should be made to ensure patients of developing countries could also benefit from these outstanding medicines (12). While rational policymaking in the era of novel agents is pivotal, there remains paucity of literature to assess the disease burden of CLL in global, regional, and national scope, as well as to review the changes over the past 30 years.
The Global Burden of Disease (GBD) study launched by the Global Burden of Disease Collaborative Network assesses 286 causes of death, 369 diseases and injuries, and 87 risk factors in 204 countries and territories (13). Several studies have used GBD data to estimate the disease burden of leukemia (14–16), but none of them focused on CLL. In addition, studies predicting the disease burden of CLL based on GBD study results are scarce. In this study, we collected CLL data between 1990 and 2019 from the GBD 2019 study, including incidence, disease-related mortality, disability-adjusted life years (DALYs), their corresponding age-standardized rates (ASRs), and their attributable risk factors across gender, age, socio-demographic index (SDI), region, and country. Furthermore, we used change percentages from 1990 to 2019 and estimated annual percentage changes (EAPCs) to quantify the trends of ASRs. We aimed to assess the accurate assessment of the distribution, burden, and trends of CLL in different regions and countries, then project CLL’s disease burden until 2030, which would provide more detailed epidemiological information and formulate more rational policies. As such, the aim of the present study is to examine the accurate assessment of the distribution, burden, and trends of CLL in different regions and nations, and then project CLL disease burden until 2030, which could provide important epidemiological information for healthcare policymaking.
Data on CLL was collected from the latest version of the GBD study by using the Global Health Data Results tool (http://ghdx.healthdata.org/gbd-results-tool) (13). The protocol used for GBD 2019 was posted on the website of the Institute for Health Metrics and Evaluation (http://www.healthdata.org/sites/default/files/files/Projects/GBD/March2020_GBD%20Protocol_v4.pdf). This study was compliant with the Guidelines for Accurate and Transparent Health Estimates Reporting (GATHER) (17). According to the instruction, the number and rate of incidence, death, and DALY of CLL were extracted between 1990 and 2019 based on age, sex, SDI, region, and country, without any inclusion/exclusion criteria. According to the geographical and socioeconomical features, the world was divided into 21 regions, including North America, East Asia, South Asia, and Eastern Europe. The SDI is a composite indicator of development status strongly correlated with health outcomes. It is the geometric mean of zero-to-one indices of total fertility rate under the age of 25 (TFU25), mean education for those ages 15 and older (EDU15+), and lag distributed income (LDI) per capita (18). According to SDI, areas were categorized into 5 levels, including low, low-middle, middle, high-middle, and high. Data were available for 204 countries/territories, including China, India, and France. The methodologies of the overall GBD 2019 and estimations of disease burden were as described in the previous studies (15, 16, 19).
Calculations of ASR were based on the age structure of the standard populations, so the ASR was a necessary and representative index considering the differences in the age structure of multiple populations. The ASR (per 100,000 populations) was calculated using the following formula:
In the formula, ai denotes the age-specific rates in the ith age group, wi denotes the number of persons (or the weight) in the corresponding ith age subgroup of the selected reference standard population, and A denotes the number of age groups.
The EAPCs were used to evaluate the trends of ASRs, which were calculated using a regression model: y = α + βx + ϵ (y = ln (ASR), x = calendar year, and ϵ = error term). EAPC = 100 × (exp (β) − 1) and its 95% UI were obtained from the regression model (16, 20, 21). If the EAPC and lower limit of UI were negative values, the incidence rate was considered to have a descending trend; in contrast, if the EAPC and upper limit of UI were positive, the incidence rate was considered to have an ascending trend. Pearson correlation analysis and loess local weighted regression (LOESS) were used to examine the correlation. All calculations and analyses were performed using the R software (version 3.6.3). All tests were two-tailed, and a p-value of <0.05 was considered statistically significant.
Several models were used to predict the incidence or mortality rate of cancers based on population data, including Joinpoint (22), age-period-cohort (APC) model (23), Nordpred model (24), and Bayesian APC model (BAPC) (25). Zhebin Du et al. applied 5 models above the GBD data to predict incidence and mortality rates and assessed their performances, finally finding BAPC with a relatively lower error rate (26). Knoll and colleagues compared predictive performances of five models, including BAPC, generalized linear models (GLMs), and generalized additive models (GALs) with age and period as covariates and found that BAPC models had the highest coverage (calculated as the fraction of projections with 95% uncertainty interval [UI]) (27).
APC models analyze registry data according to the age group of the individual, the date of the event that was considered (period), and the birth cohort of the individual (28). Bayesian APC models are particularly useful to project future cancer burden as they involve no parametric assumptions. Bray provided a comparison of projections derived from linear power models, as well as the classical and Bayesian version of the APC model, and concluded that the Bayesian APC model could achieve more sensible projections (29). An R package “BAPC” developed by Andrea Riebler and Leonard Held (30), which were based on integrated nested Laplace approximations, had been widely used to project GBD data (26, 31, 32). We utilized “BAPC” in our study to project the incidence and mortality rates until 2030, based on the incidence and death cases of CLL classified by age group from 1990 to 2019 in GBD dataset, and estimates or standard projection variants of the population classified by age group from World Population Prospects Project 2019 (https://population.un.org/wpp/Download/Standard/Population/). Data of the world and 5 individual countries including USA, Ukraine, China, India, and Afghanistan (which represent 5 different SDI levels respectively) were included.
The global incident number of chronic lymphocytic leukemia was 1,034.67 ×102 [95% uncertainty interval (UI) = (934.64, 1,189.42)] in 2019, with a total increase of 155.24% from 1990 (Figures 1A–C, Table 1 and Supplementary Table S1). The global age-standardized incidence rate (ASIR) was 1.28 (1.16, 1.48) per 100,000, and it showed an increasing trend with an annual average of 0.47% [EAPC = 0.47; 95% CI = (0.33, 0.61)] from 1990 to 2019 (Figures 2A–C, Figure 3 upper, Table 1 and Supplementary Table S4). In 1990, the high SDI quintile had an ASIR of 2.24 (2.05, 2.39)/100,000 persons, which then increased and peaked at 2.74 (2.51, 3.05)/100,000 persons in 2003. After that, the ASIR of the high SDI quintile dropped to its lowest level of 2.24 (2.02, 2.74)/100,000 persons in 2017. In recent years, the ASIR of the high SDI quintile rose slightly again (Table 1, Figures 2A–C and Supplementary Table S4). Except for the high SDI quintile, other SDI quintiles all had increasing trends of ASIRs. According to their EAPCs of ASIRs, the middle SDI quintile had the most obvious increase [EAPC = 2.98 (2.76, 3.19)] (Table 1, Figures 2A–C and Figure 3 upper). In terms of geographical regions, High-income North America with an ASIR of 3.19 (2.69, 3.94)/100,000 persons, and Central Europe with an ASIR of 3 (2.53, 3.68)/100,000 persons in 2019 remained the top two highest incidence rates in the world. From 1990 to 2019, the EAPCs of ASIRs showed an increasing trend in most geographical regions except in High-income North America [EAPC = −0.68 (−0.96, −0.41)] and Oceania [EAPC = −0.35 (−0.46, −0.24)]. Among them, East Asia [EAPC = 5.84 (5.41, 6.26)] and Central Europe [EAPC = 3.77 (3.29, 4.24)] had the highest increasing speed (Table 1 and Figure 3 upper). Regarding observation of countries and territories, in 2019, the top three countries with the most incident cases of CLL were the United States of America (183.19 (152.66, 228.91) ×102), China (159.1 (130.45, 194.43) ×102), and India (76.73 (63.3, 91.63) ×102) (Supplementary Table S4). Qatar (6.57 (4.64, 9.31)/100,000 persons), Israel (4.53 (3.34, 6.14)/100,000 persons), and Croatia (4.47 (3.34, 6.05)/100,000 persons) had the highest ASIRs in 2019 (Figure 4A, Supplementary Table S7). Poland (EAPC = 7.48 (6.25, 8.74)) and Netherlands (EAPC = −3.35 (−4.69, −2)) had the most increase and decrease in ASIRs, respectively (Figure 5A, Supplementary Table S10).
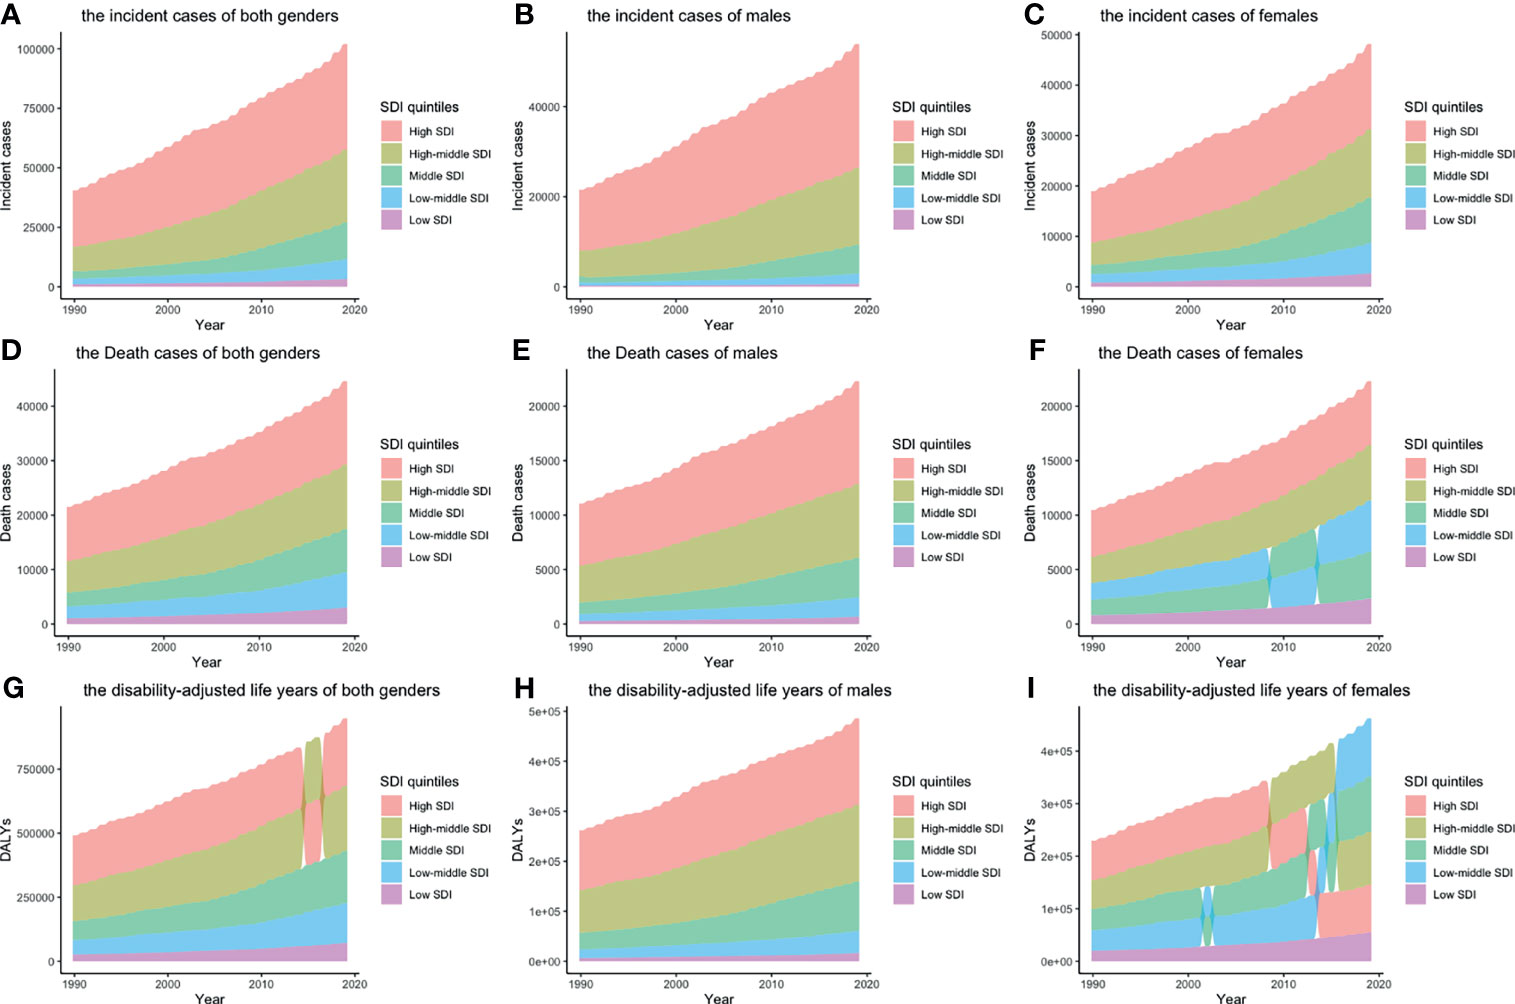
Figure 1 Incident cases, death cases, and DALYs of different SDI quintiles from 1990 to 2019 by gender: (A) incident cases of both genders; (B) incident cases of males; (C) incident cases of females; (D) death cases of both genders; (E) death cases of males; (F) death cases of females; (G) DALYs of both genders; H: DALYs of males; I: DALYs of females. Alluvia represent numbers of different SDI quintiles, from the highest (the SDI quintile with largest number) to the lowest (the SDI quintile with smallest number). (DALY, disability-adjusted life year; SDI, socio-demographic index).
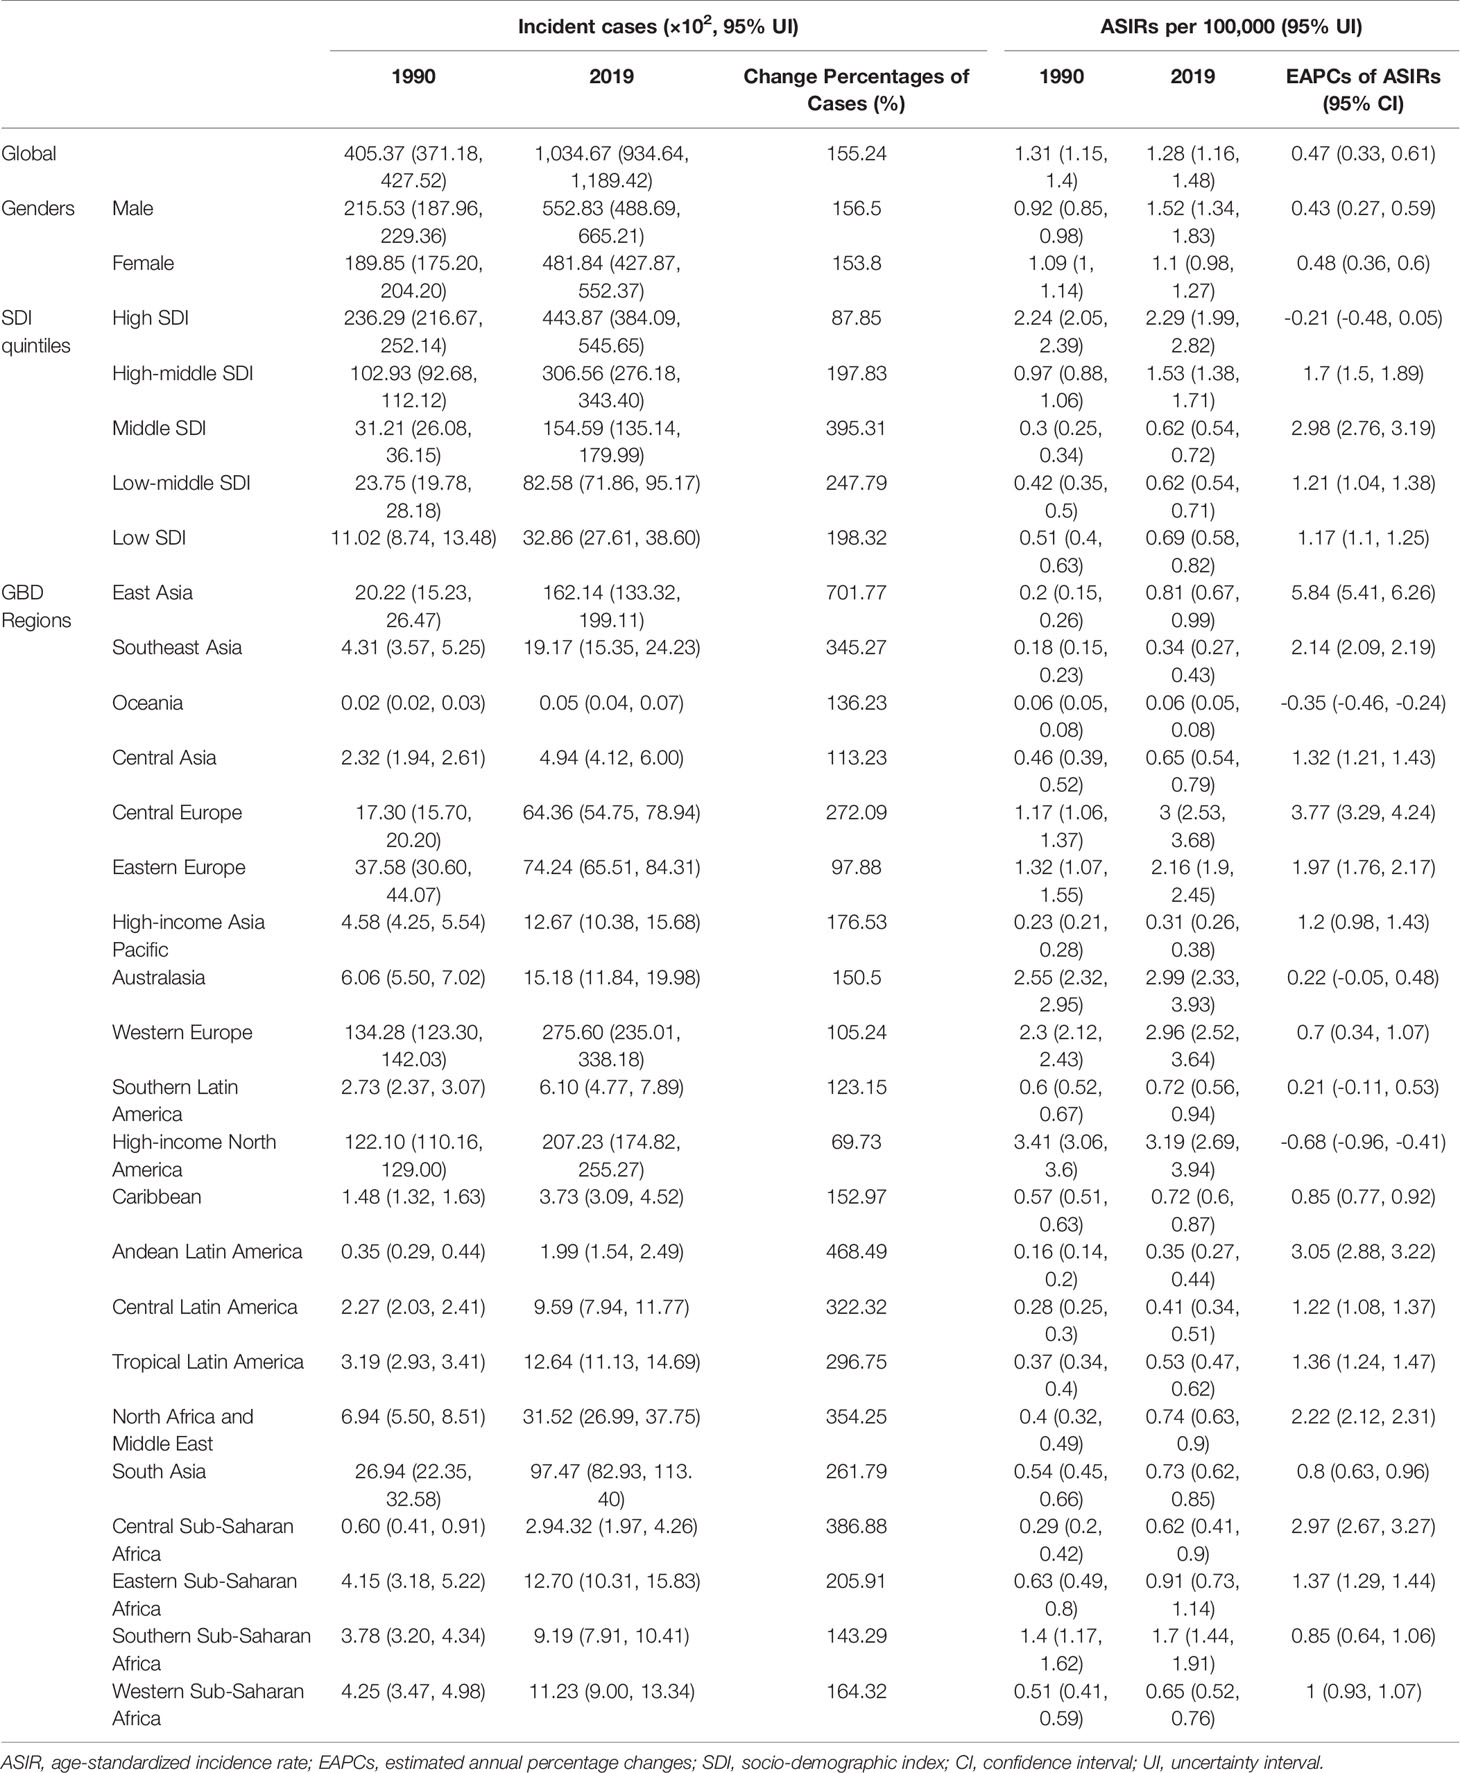
Table 1 The incident cases and ASIRs of CLL in 1990 and 2019, and the trends from 1990 to 2019.
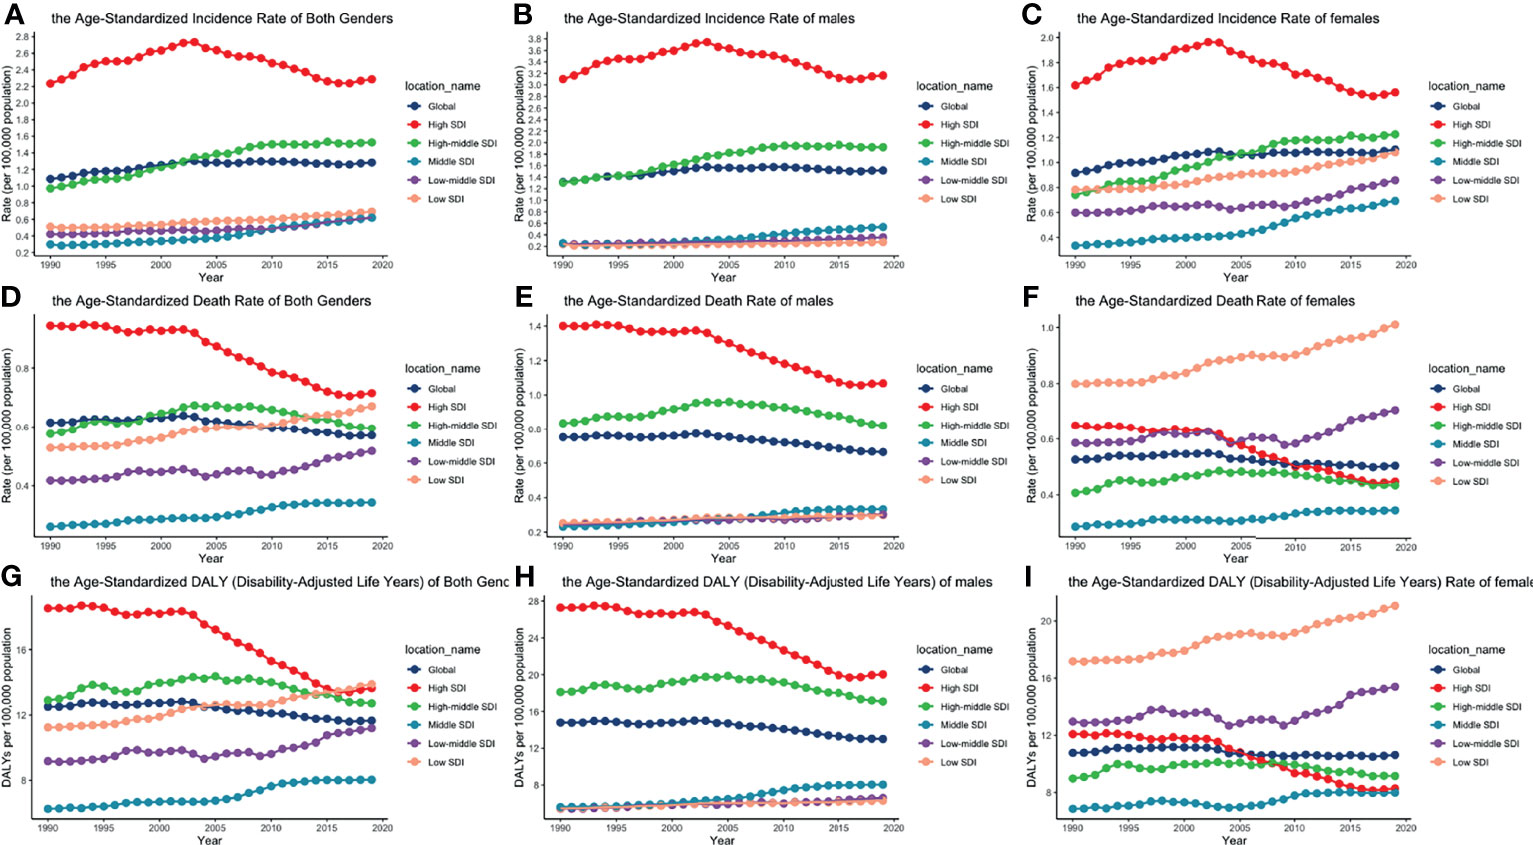
Figure 2 ASIRs, ASDRs, and age-standardized DALY rates of different SDI quintiles from 1990 to 2019 by gender: (A) ASIRs of both genders; (B) ASIRs of males; (C) ASIRS of females; (D) ASDRs of both genders; (E) ASDRs of males; (F) ASDRs of females; (G) age-standardized DALY rates of both genders; (H) age-standardized DALY rates of males; (I) age-standardized DALY rates of females. (ASIR, age-standardized incidence rate; ASDR, age-standardized death rate; DALY, disability-adjusted life year; SDI, socio-demographic index).
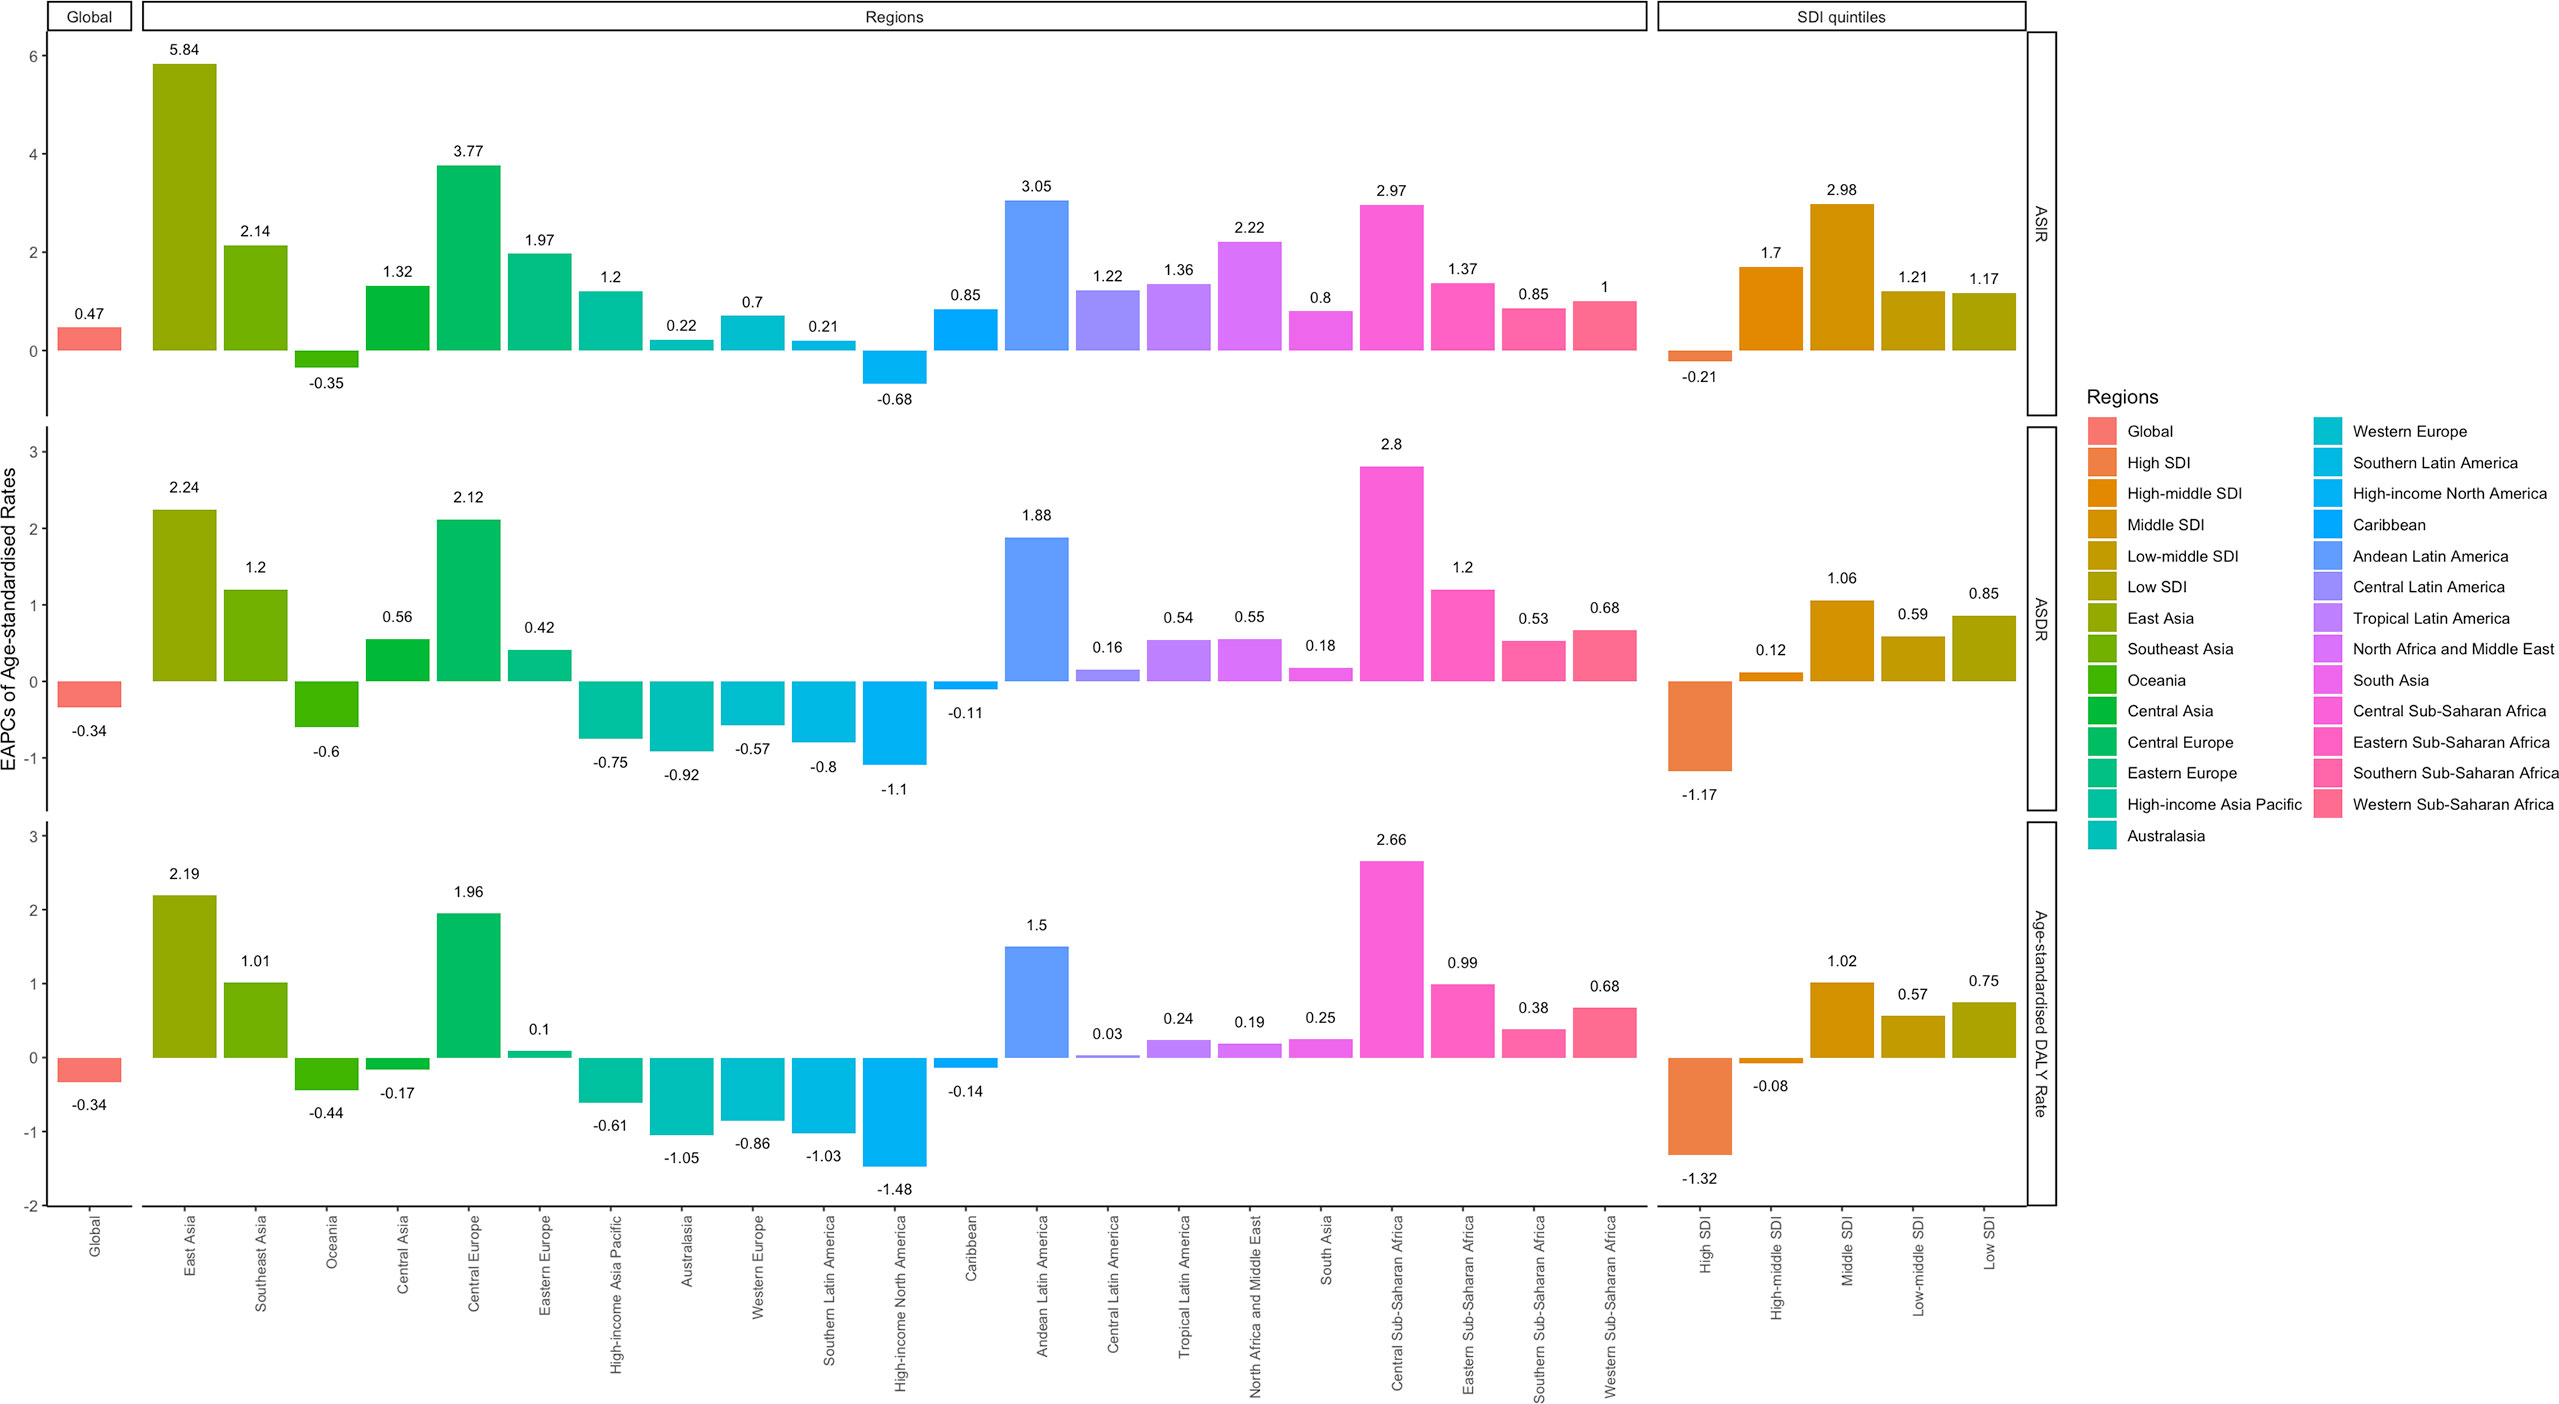
Figure 3 EAPCs of ASIR (upper), ASDRs (middle), and age-standardized DALY rates (lower), in the global (left), regional (middle) and SDI (right) levels. (ASIR, age-standardized incidence rate; ASDR, age-standardized death rate; DALY, disability-adjusted life year; SDI, socio-demographic index).
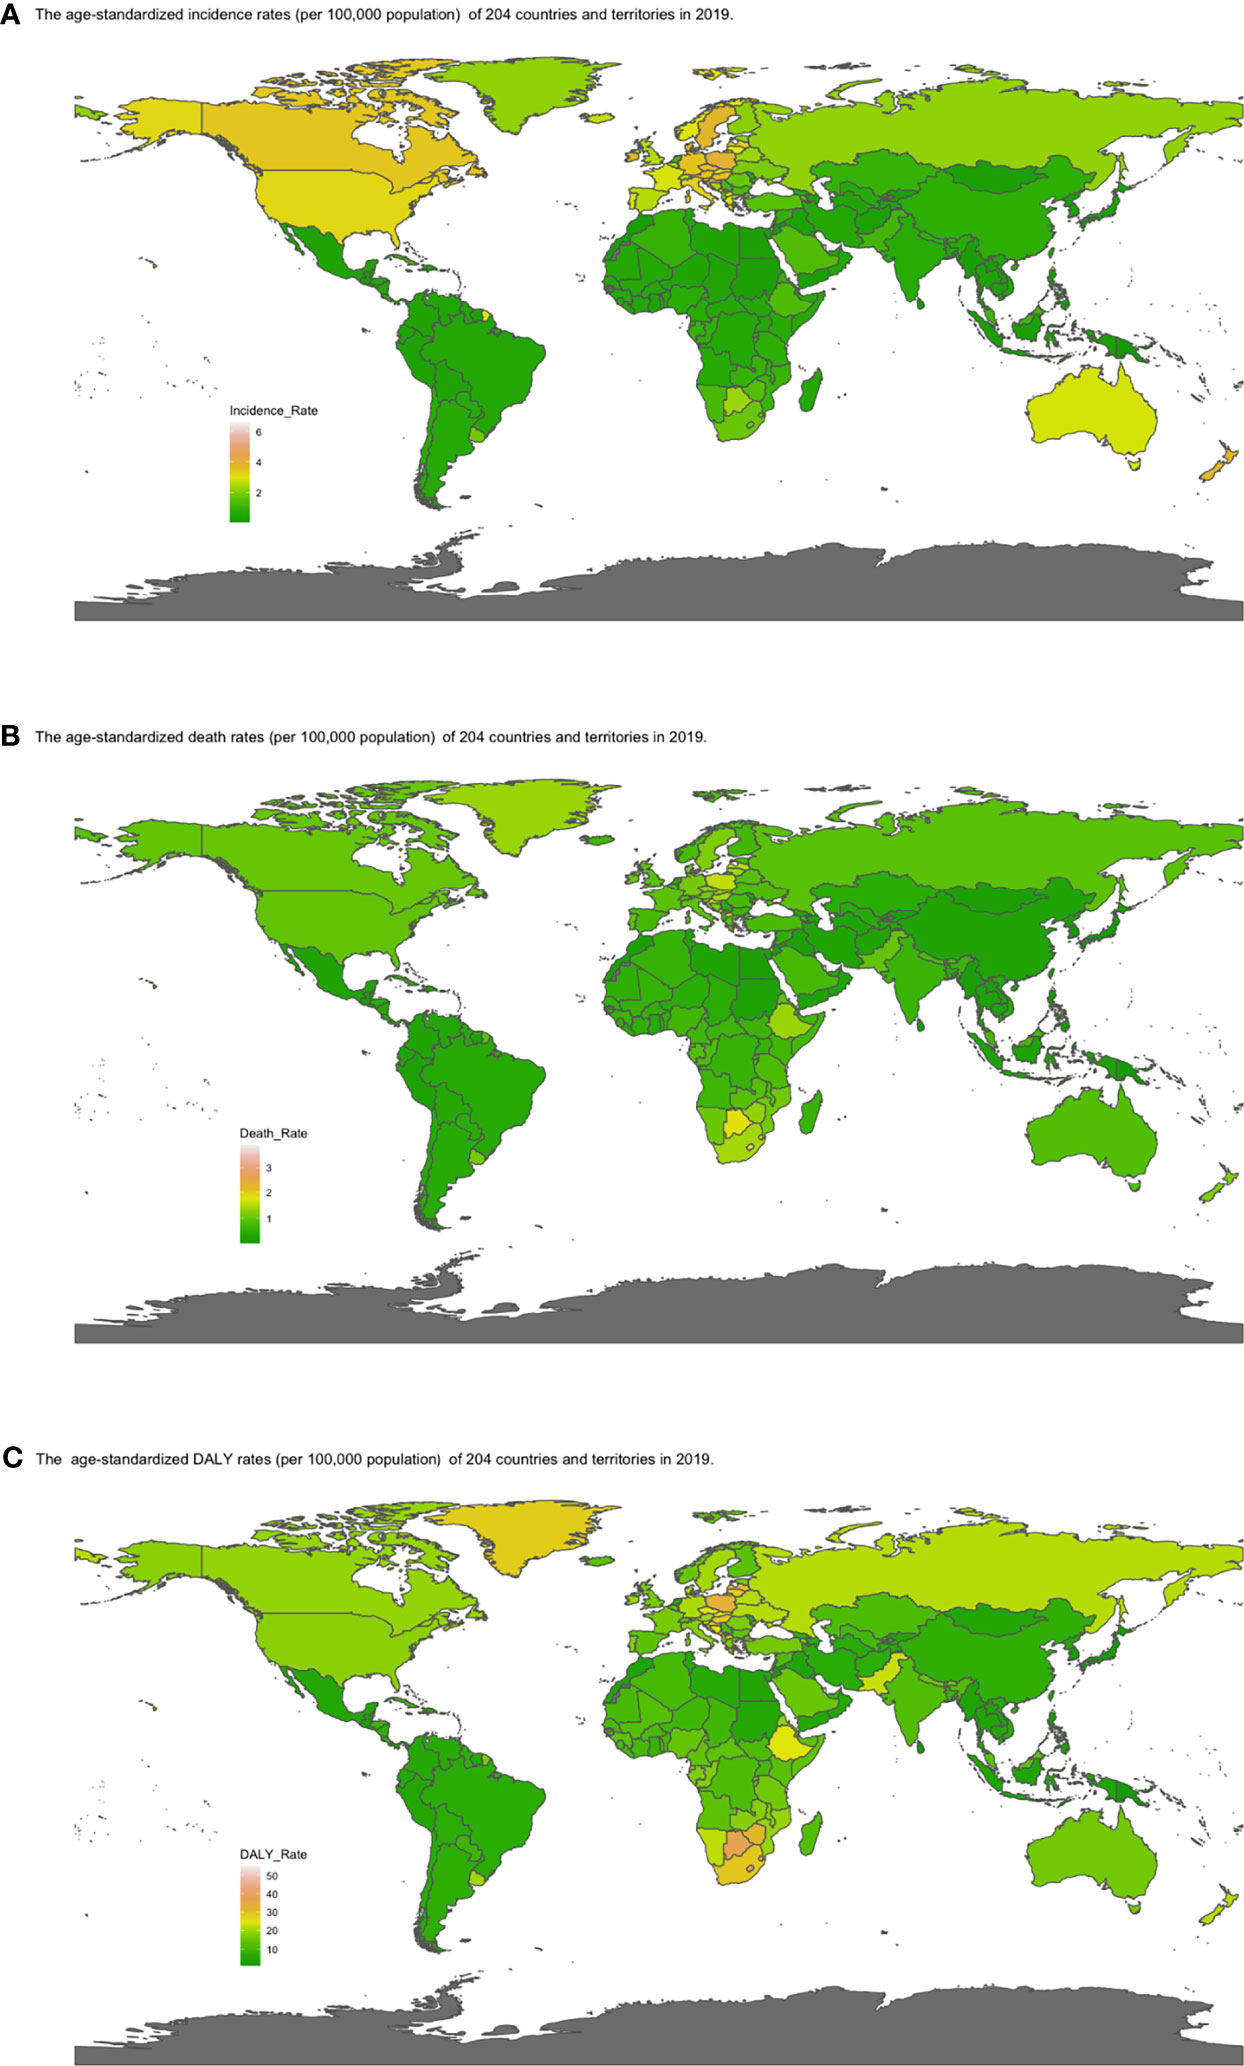
Figure 4 Map of (A) ASIR, (B) ASDRs, and (C) age-standardized DALY rates by country in 2019. Heat gradient represents age-standardized rates from pink (highest) to dark green (lowest). (ASIR, age-standardized incidence rate; ASDR, age-standardized death rate; DALY, disability-adjusted life year; EAPC, estimated annual percentage change).
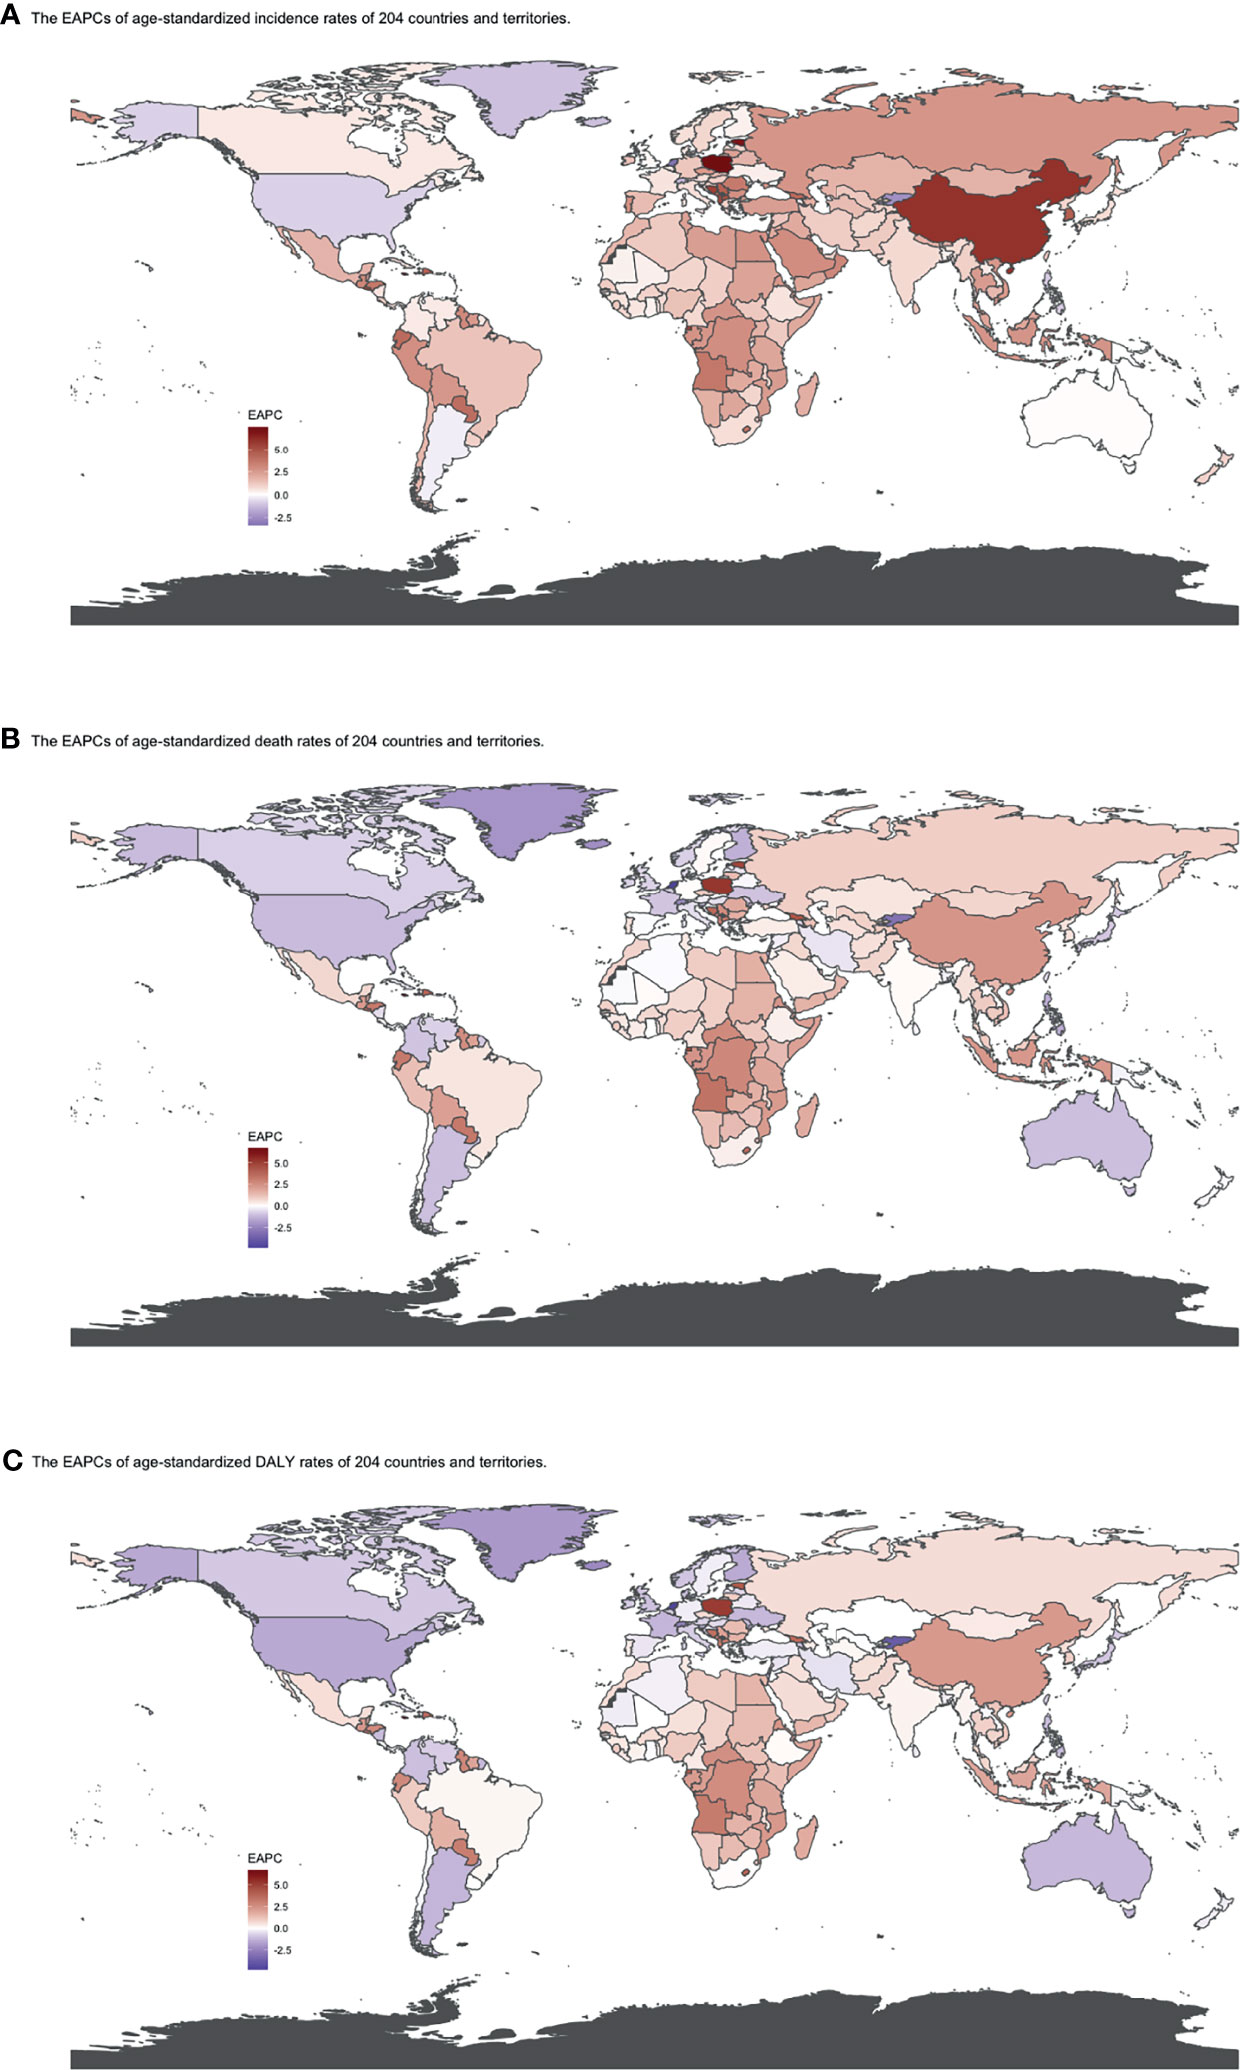
Figure 5 EAPCs of (A) ASIR, (B) ASDRs, and (C) age-standardized DALY rates by country from 1990 to 2019. Heat gradient represents the change trends of EAPCs from red (highest) to blue (lowest). Blue indicates a downward trend and Red indicates an upward trend. (ASIR, age-standardized incidence rate; ASDR, age-standardized death rate; DALY, disability-adjusted life year; EAPC, estimated annual percentage change).
At the global level, death number of CLL was 446.13 ×10² [95% uncertainty interval (UI) = (403.93, 500.74)] in 2019, which increased 107.03% from 1990 (Table 2, Figures 1D–F and Supplementary Table S2). The age-standardized death rate (ASDR) was 1.28 (1.16, 1.48) per 100,000, decreasing with an annual average of 0.34% [EAPC = −0.34; 95% CI = (−0.43, −0.25)] from 1990 to 2019 (Table 2, Figures 2D–F and Figure 3 middle). Among different SDI quintiles, the high SDI quintile always had the highest ASDR from 1990 (0.94/100,000 persons) to 2019 (0.72/100,000 persons), although it kept declining constantly [EAPC = −1.17 (−1.32, −1.02)]. The ASDR trend of the high-middle SDI quintile was a parabola, peaking at 0.67 (0.62, 0.73)/100,000 persons in 2005. Three lower SDI quintiles had increasing trends of ASDRs (Table 2, Figures 2D–F and Supplementary Table S5). Southern Sub-Saharan Africa (1.43 (1.17, 1.6) per 100,000), Central Europe (1.18 (1, 1.42) per 100,000), and High-income North America (0.98 (0.87, 1.19) per 100,000) ranked the top 3 on the list of ASDRs of 21 geographical regions in 2019. The trends of ASDRs from 1990 to 2019 of different geographical regions were quite varied: Central Sub-Saharan Africa had the highest increasing speed [EAPC = 2.8 (2.49, 3.12)], while High-income North America had the most significant decreasing trend [−1.1 (−1.26, −0.94)] (Table 2 and Figure 3 middle). On the scale of countries and territories, India (61.96 (50.77, 74.94) ×102), the United States of America (59.42 (52.53, 72.18) ×102), and China (47.12 (38.86, 58.22) ×102) had the largest numbers of death cases in 2019 (Supplementary Table S5). The top 3 countries and territories on the ranking of the highest ASDRs of CLL in 2019 were Qatar (3.87 (2.44, 5.84) per 100,000), Seychelles (2.53 (2.12, 3.03) per 100,000), and Lesotho (1.79 (1.17, 2.5) per 100,000) (Figure 4B and Supplementary Table S8). From 1990 to 2019, Jamaica [EAPC = 6.68 (5.76, 7.6)] had the most significant increasing trend of ASDRs while Netherlands [EAPC = −4.85 (−6.11, −3.57)] dropped the fastest (Figure 5B and Supplementary Table S11).
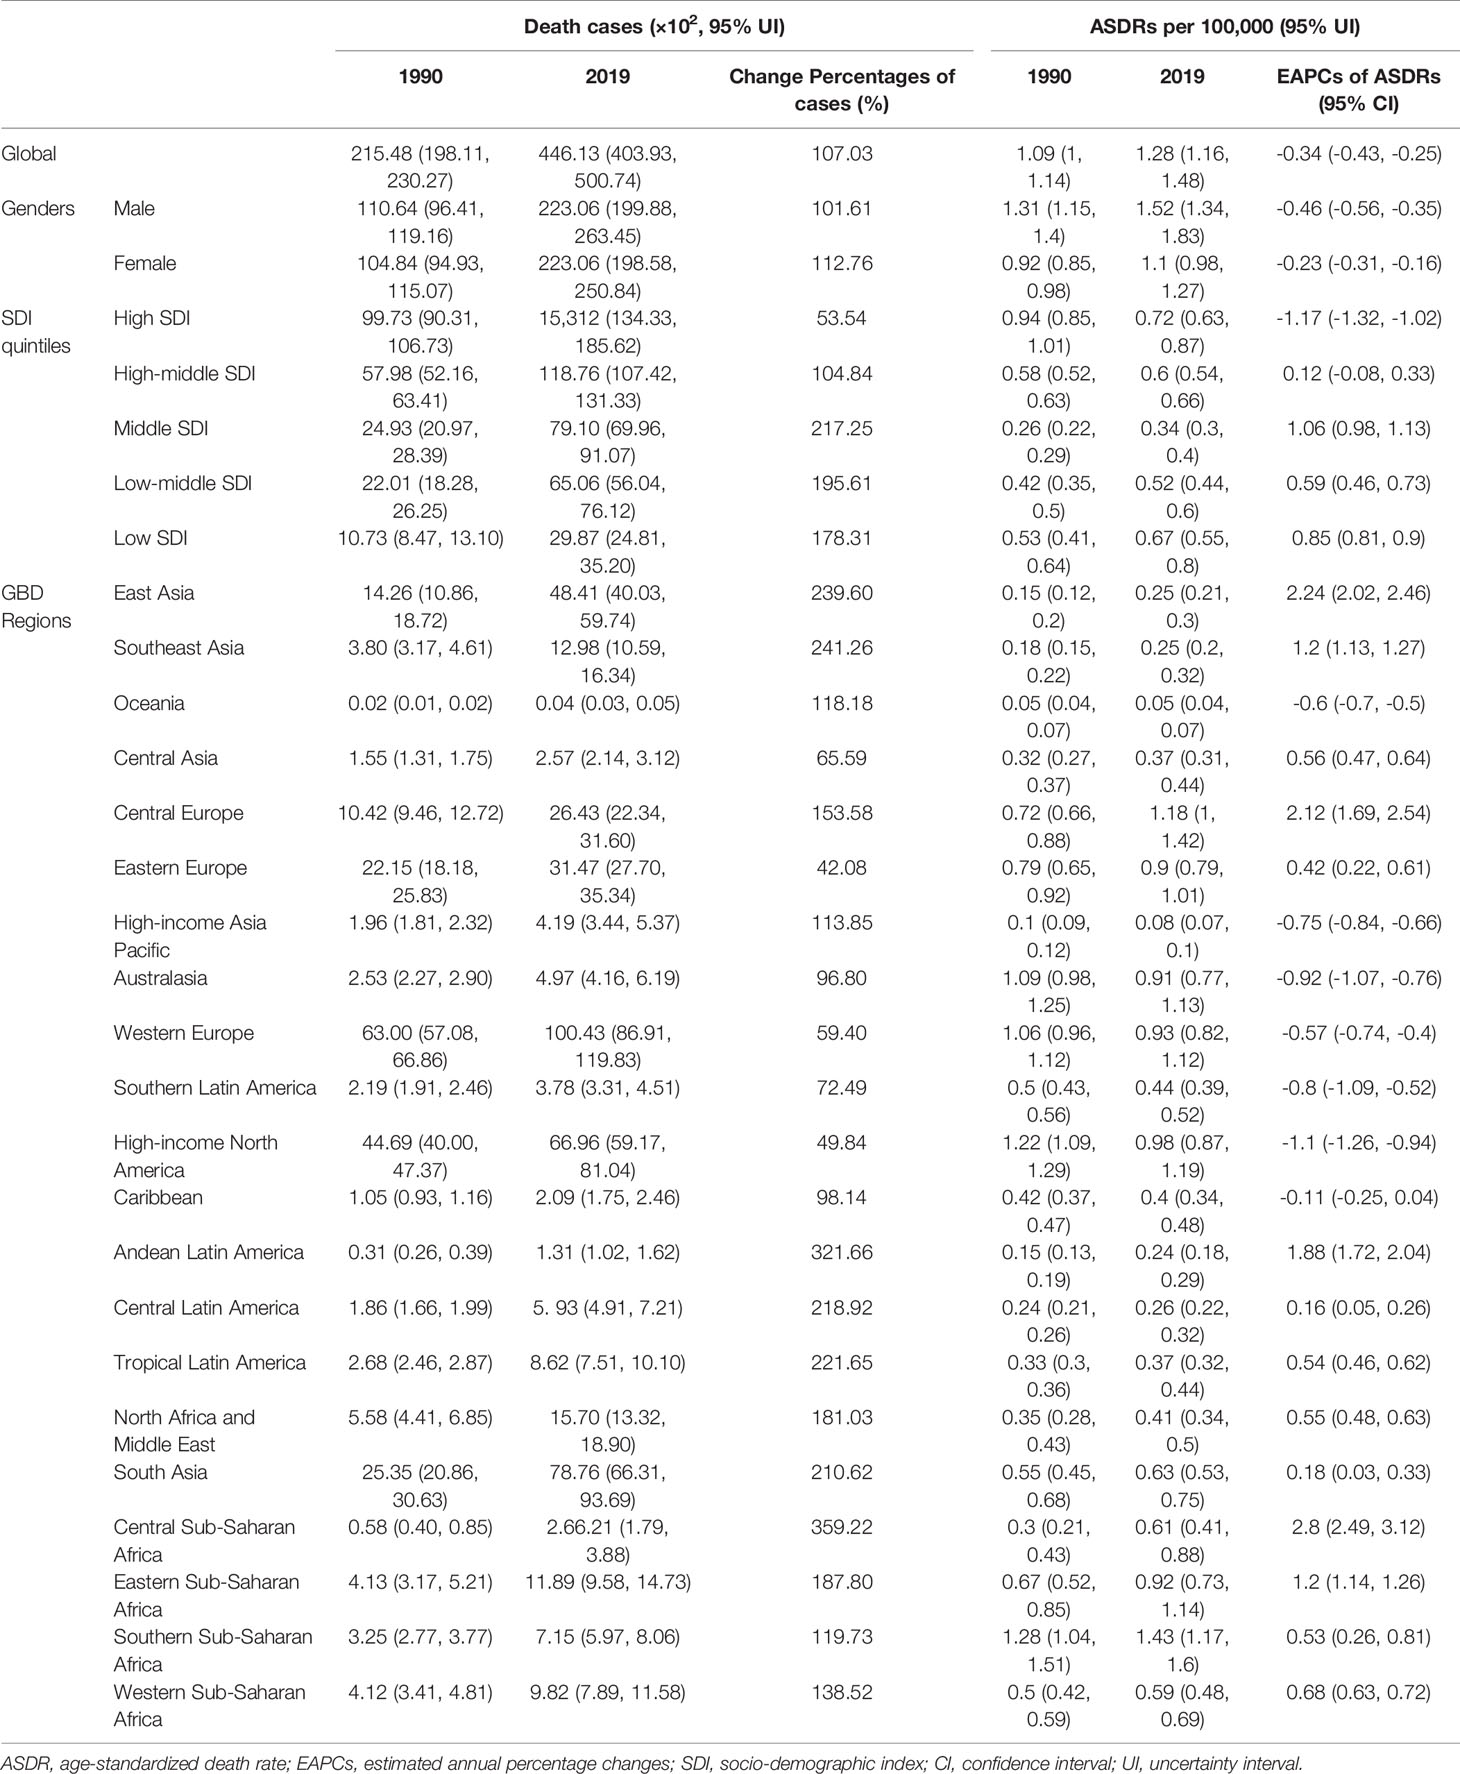
Table 2 The death cases and ASDRs of CLL in 1990 and 2019, and the trends from 1990 to 2019.
The DALYs doubled from 4,920.74 (4,452.50, 5,322.84) years in 1990 to 9,484.64 (8,741.97, 10,652.54) years in 2019 (Table 3, Figures 1G–I and Supplementary Table S3). From 1990 to 2019, the age-standardized DALY rates of CLL decreased significantly [EAPC = −0.34 (−0.4, −0.27)] (Table 3 and Figure 3 lower). At the SDI quintiles level, the trends of age-standardized DALY rates were in accordance with the changes of death rates: decreasing in the high SDI; increasing from 1990, peaking at 2005, then declining until 2019 in high-middle SDI quintiles; and increasing in the other three SDI quintiles from 1990 to 2019 (Figures 2G–I and Supplementary Table S6). Interestingly, the high SDI quintile had the highest age-standardized DALY rate in 1990, but in 2019, the low SDI quintile had the highest value. The high SDI quintile had a considerable decrease in age-standardized DALY rates with EAPC at −1.32 (−1.5, −1.14) (Table 3 and Supplementary Table S6, Figure 2G, Figure 3 lower). In terms of geographical regions, Southern Sub-Saharan Africa (29.73 (25.33, 33.8) per 100,000) and Central Europe (25.09 (21.23, 30.39) per 100,000) were the top two regions with the highest DALY rates in 2019. The EAPCs of age-standardized DALYs rates varied in different geographical regions: from the highest [Central Sub-Saharan Africa, 2.66 (2.34, 2.98)] to lowest [High-income North America, −1.48 (−1.66, −1.29)] (Table 3 and Figure 3 lower). Regarding observation of countries and territories, in 2019, China (1,469.13 (1,218.16, 1,792.32) ×102) and India (1,397.69 (1,142.67, 1,707.53) ×102) had the most DALYs (Supplementary Table S6). Qatar (54.89 (38.8, 78.2)/100,000 persons), Seychelles (54.31 (45.79, 64.76)/100,000 persons), and Lesotho (38.06 (24.43, 53.76)/100,000 persons) had the highest age-standardized DALY rates in 2019 (Figure 4C and Supplementary Table S9). Jamaica [EAPC = 6.72 (5.81, 7.63)] had the most increase in age-standardized DALY rates, while Netherlands [EAPC = −4.82 (−6.06, −3.55)] had the most decrease (Figure 5C and Supplementary Table S12).
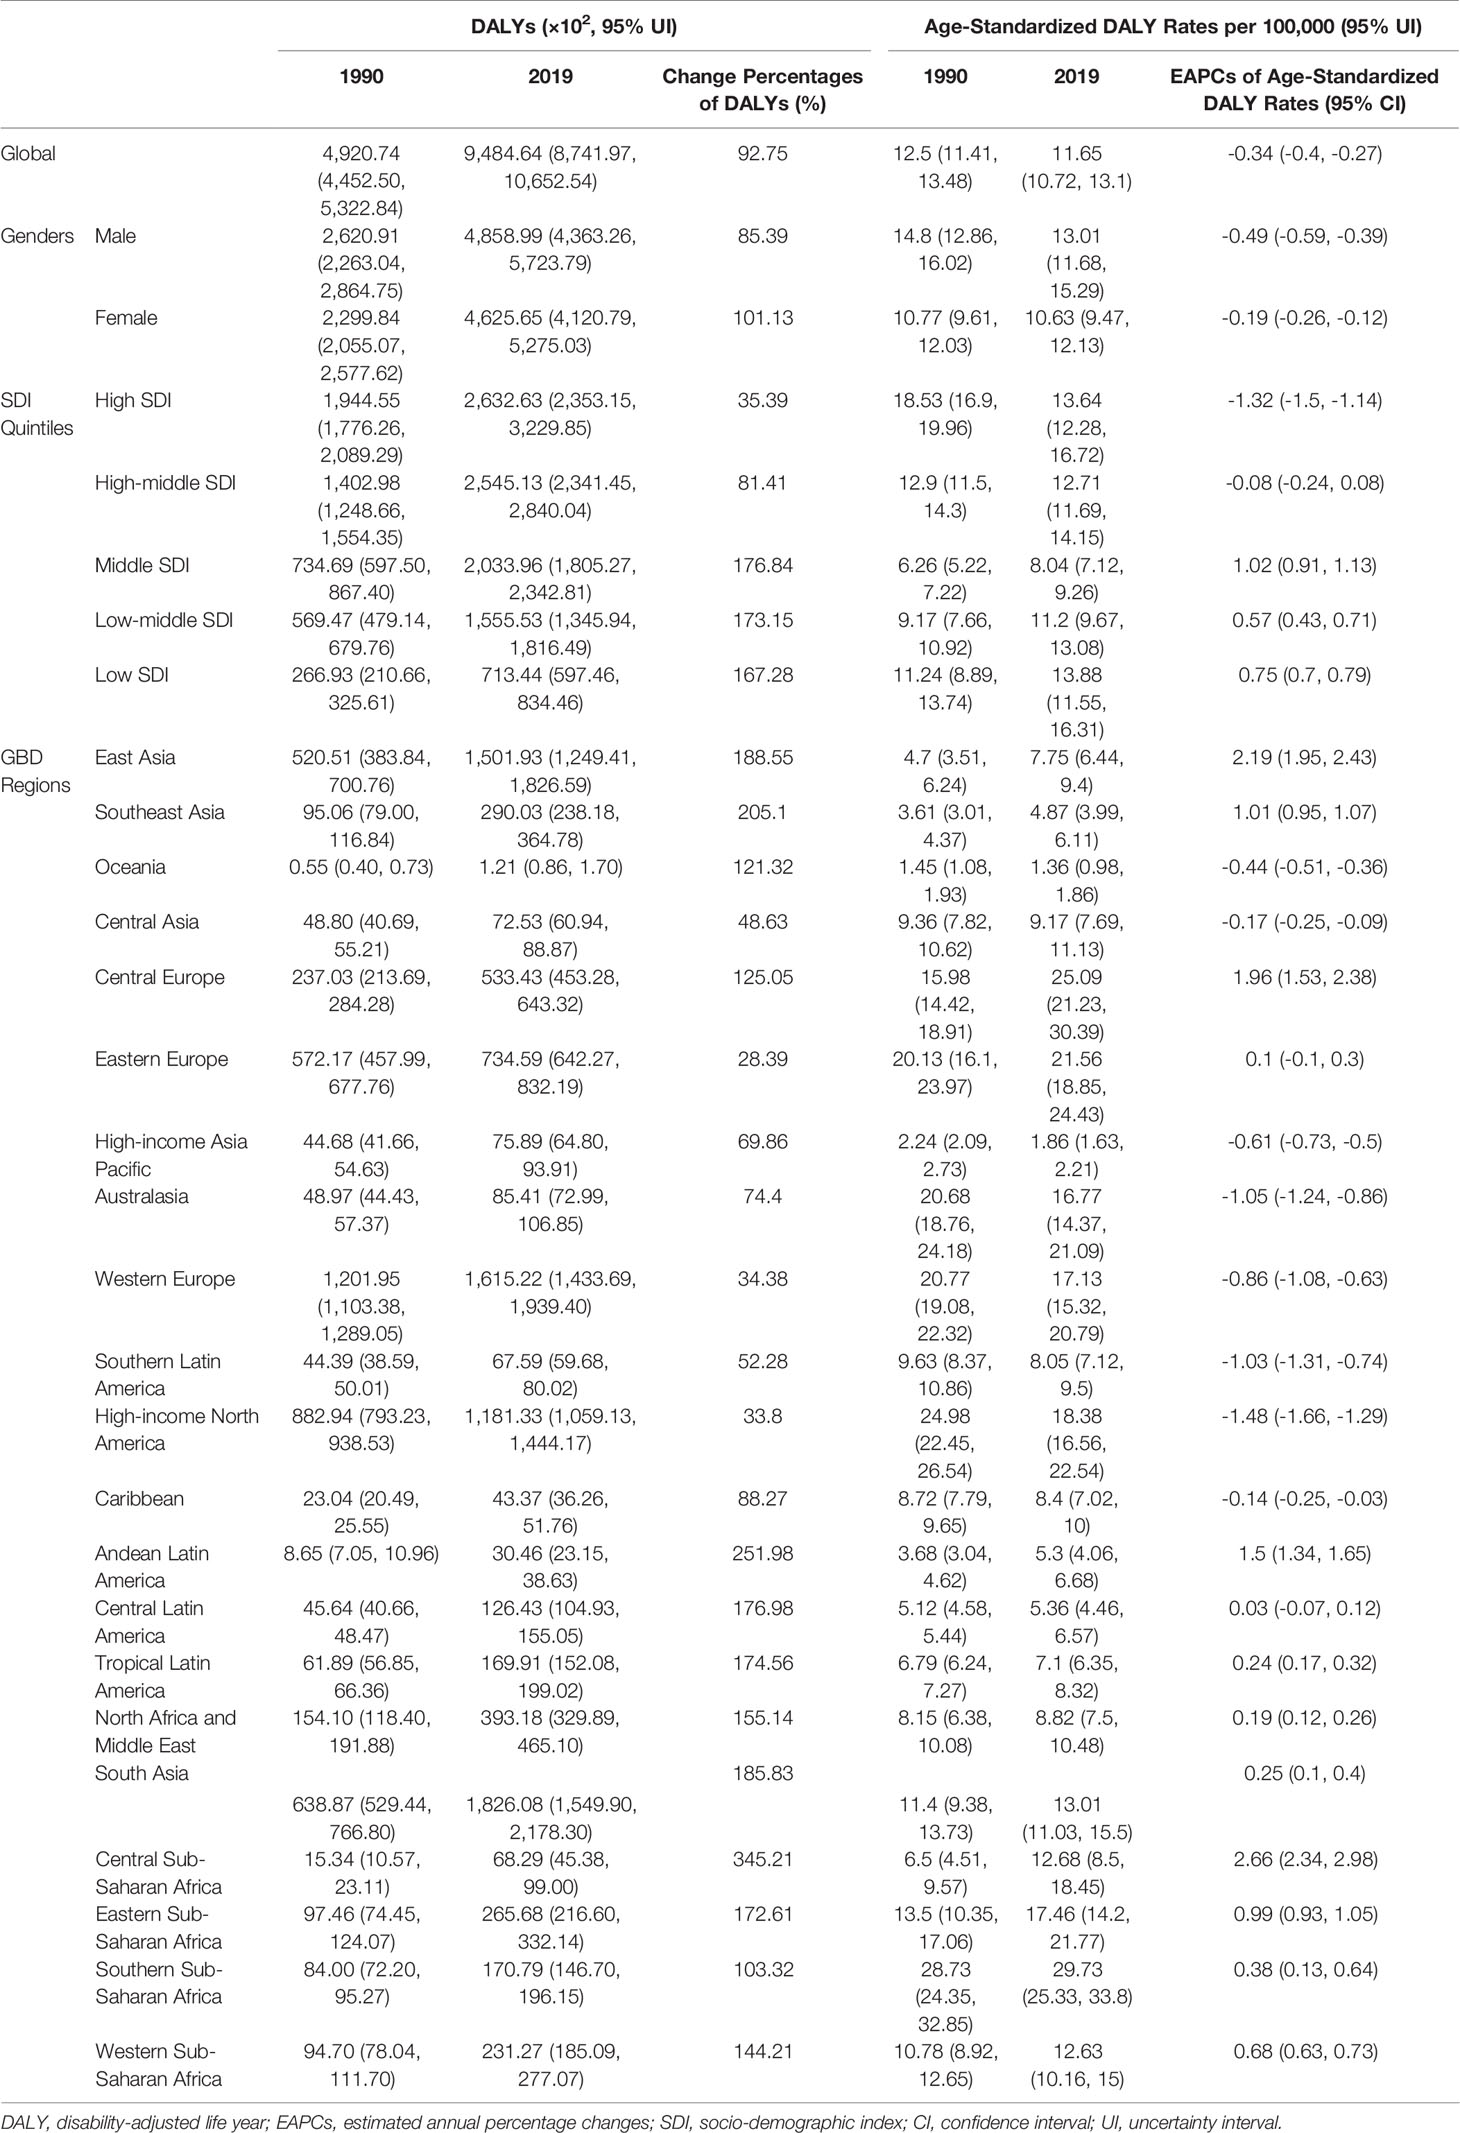
Table 3 The DALYs and age-standardized DALY Rates of CLL in 1990 and 2013, and the trends from 1990 to 2019.
The trends of age-standardized incidence rates, death rates, and DALY rates of women or men were consistent with those of both genders, both globally and in the scale of SDI quintiles (Figures 2A–H and Supplementary Tables S4–S6). The male-to-female ratios of ASIRs were more than one and increasing from the age group of 55 to 59 significantly, which showed that men were more susceptive to CLL especially in elder people, while male-to-female ratios of incident cases were decreasing from the age group of 70 to 74 probably due to women having a higher average life expectancy than men (Figures 7A, B and Supplementary Table S13). The ASDRs and the age-standardized DALY rates had a similar trend compared with ASIRs (Figures 7C–F and Supplementary Tables S14, S15). The male-to-female ratios of ASIRs, ASDRs, and age-standardized DALY rates were varied in different SDI quintiles: men had higher burdens of incidence, death, and DALY in high and high-middle SDI quintiles (male-to-female ratio ≥ 1), while the other three lower SDI quintiles had the opposite trend (male-to-female ratio < 1) (Figures 2B, C, E, F, H, I and Figures 6A–C).
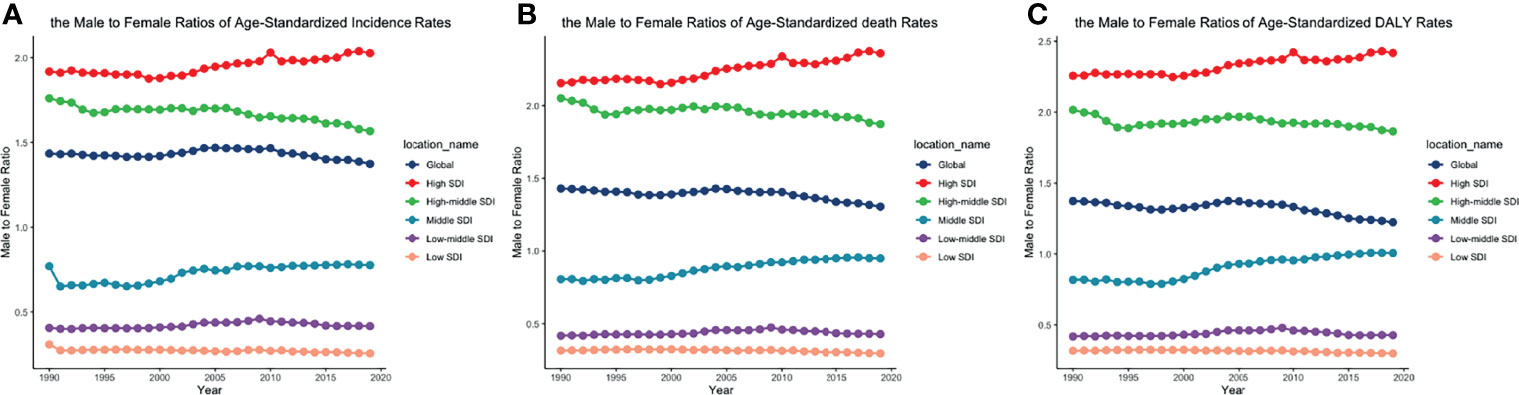
Figure 6 The male-to-female ratios of (A) ASIR, (B) ASDRs, and (C) age-standardized DALY rates by SDI quintiles from 1990 to 2019. (ASIR, age-standardized incidence rate; ASDR, age-standardized death rate; DALY, disability-adjusted life year; SDI, socio-demographic index).
CLL occurred almost exclusively after the age of 20 years, and the incidence rates, death rates, and DALY rates increased significantly with age, in both men and women (Figures 7A, C, E and Supplementary Tables S13-S15). People from 60 to 75 had the most incident cases and longest DALYs, and people under the age of 70–85 suffered from the most death cases (Figures 7B, D, F and Supplementary Tables S13-S15). The higher the SDI, the higher proportions of the elderly cases (Figures 8A–C and Supplementary Tables S16-S18) were. The incident case, death cases, and DALYs of different age groups all increased with years, but ASIRs, ASDRs, and age-standardized DALY rates changed slightly (Figures 9A–F).
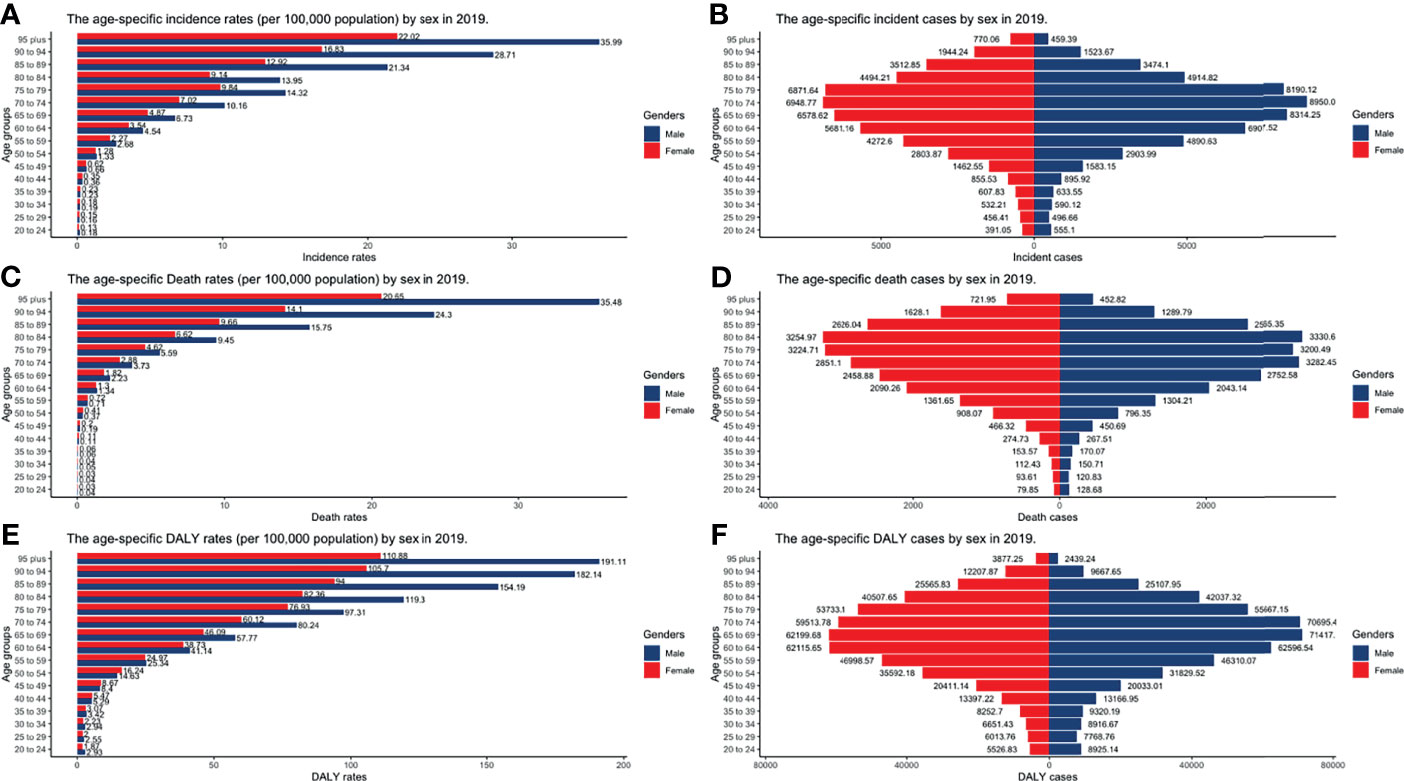
Figure 7 The burden of incidence, deaths, and DALY by gender and age groups in 2019. (A) Incident cases; (B) Incidence rates; (C) death cases; (D) death rates; (E) DALY rates; (F) DALY cases (DALY, disability-adjusted life year).
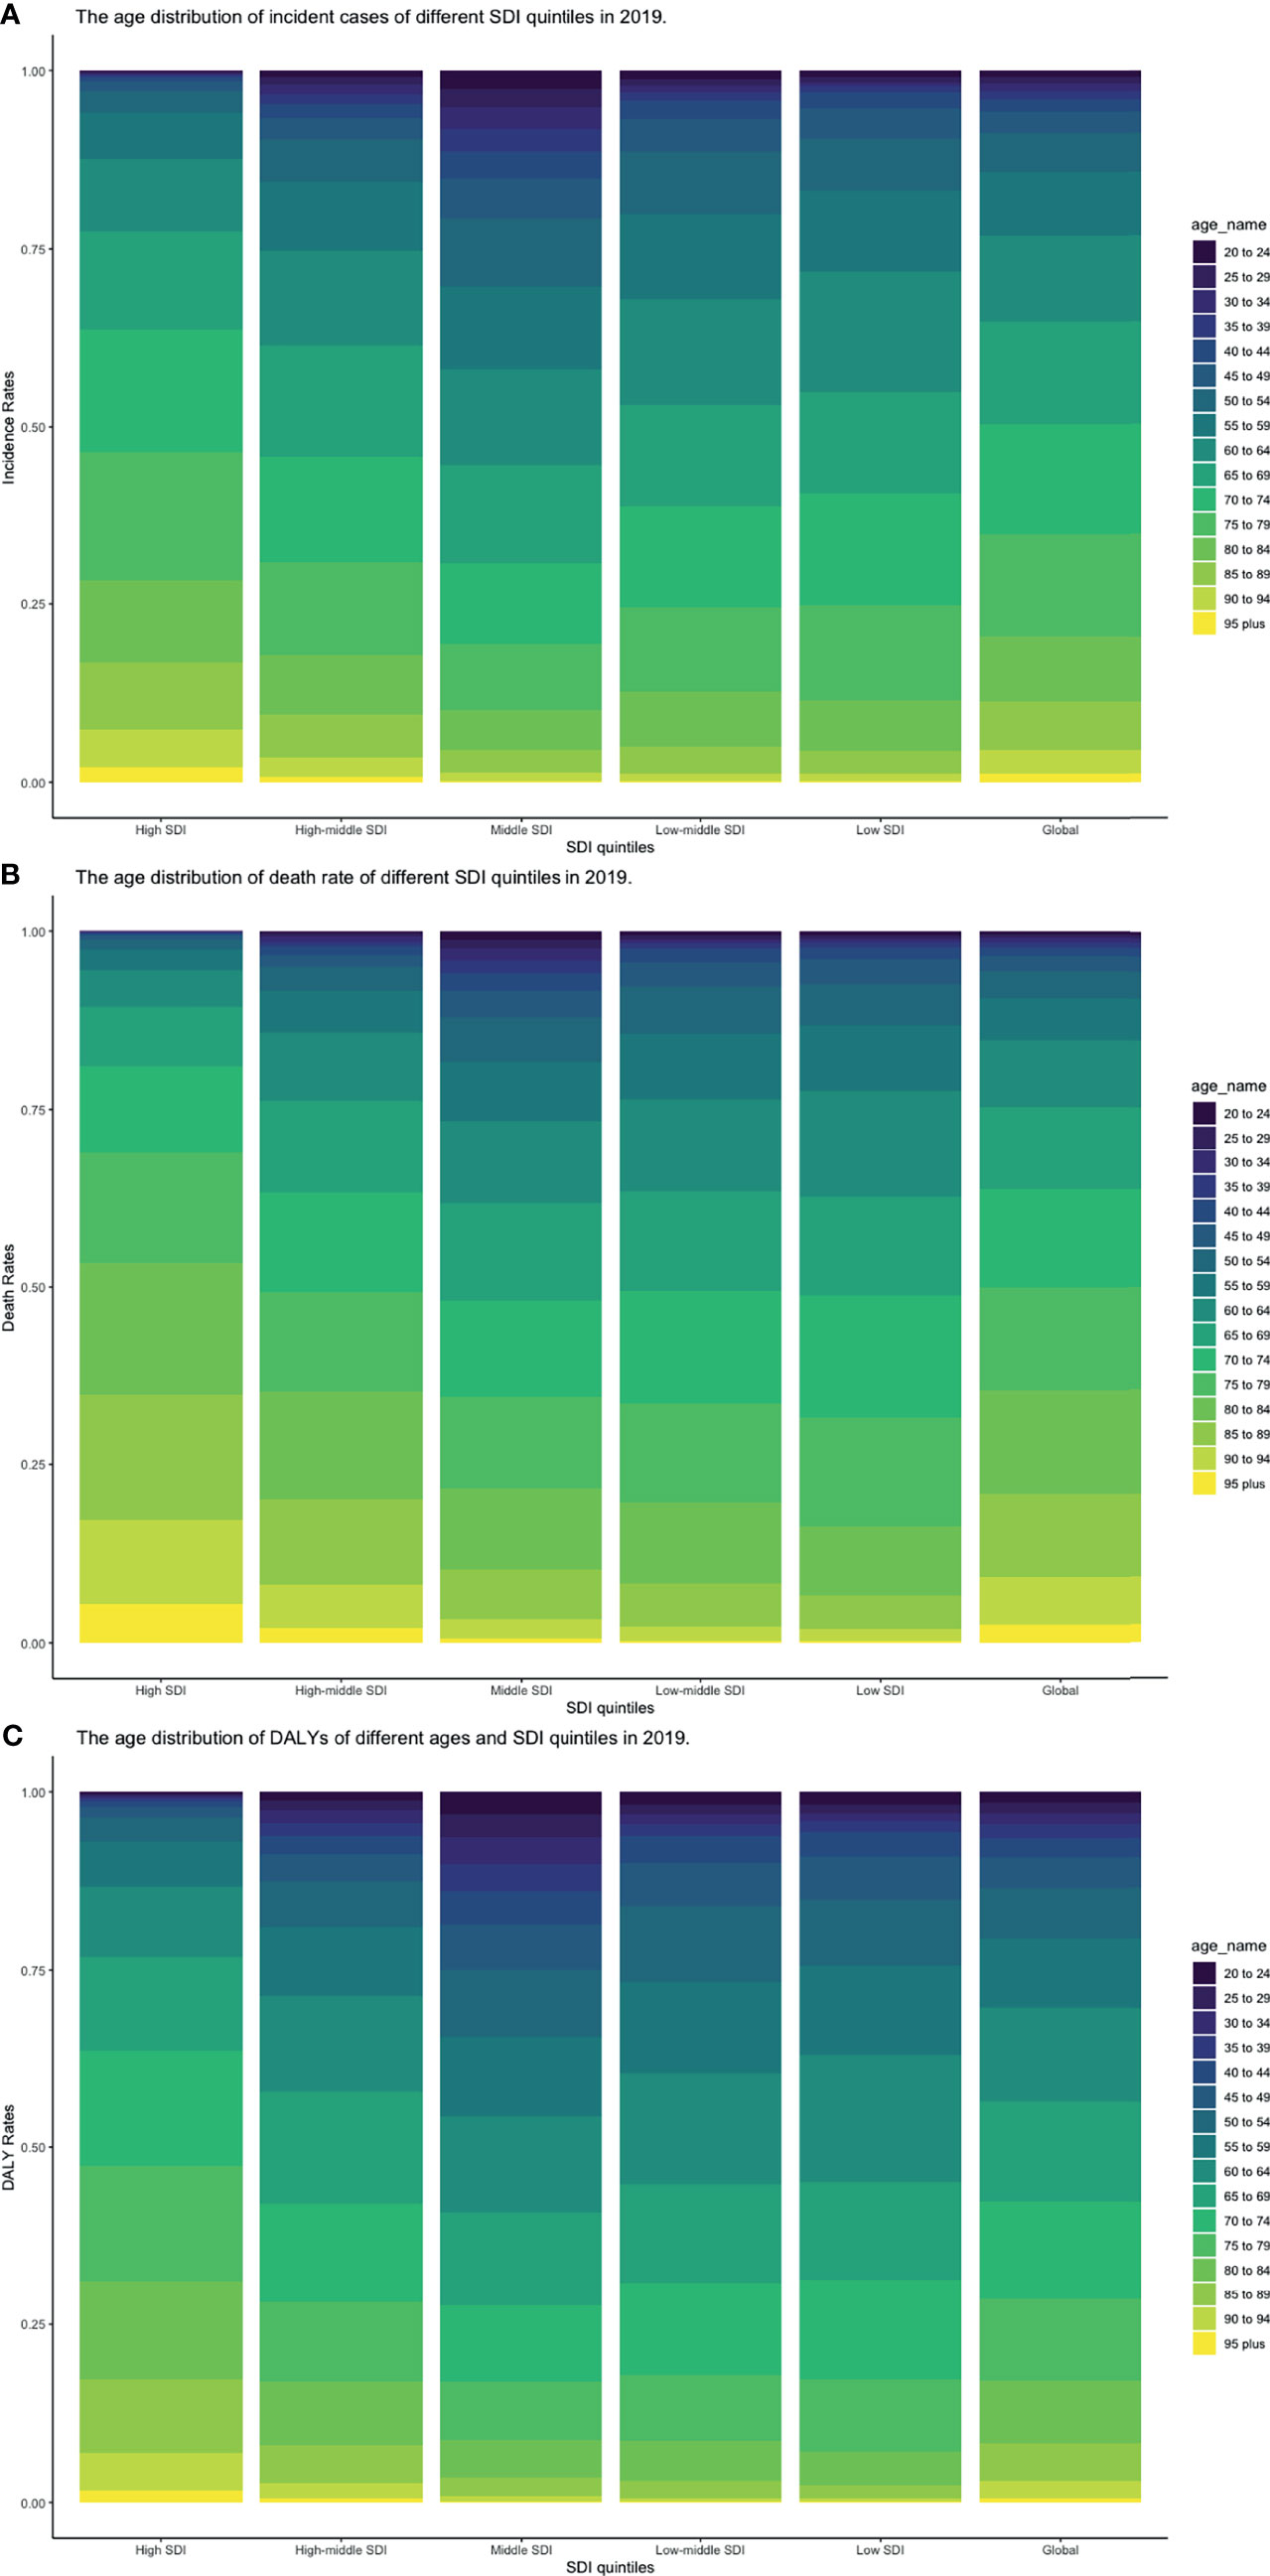
Figure 8 Proportion of age groups on (A) incident cases, (B) death cases, and (C) DALYs by SDI quintiles in 2019 (DALY, disability-adjusted life year; SDI, socio-demographic index).
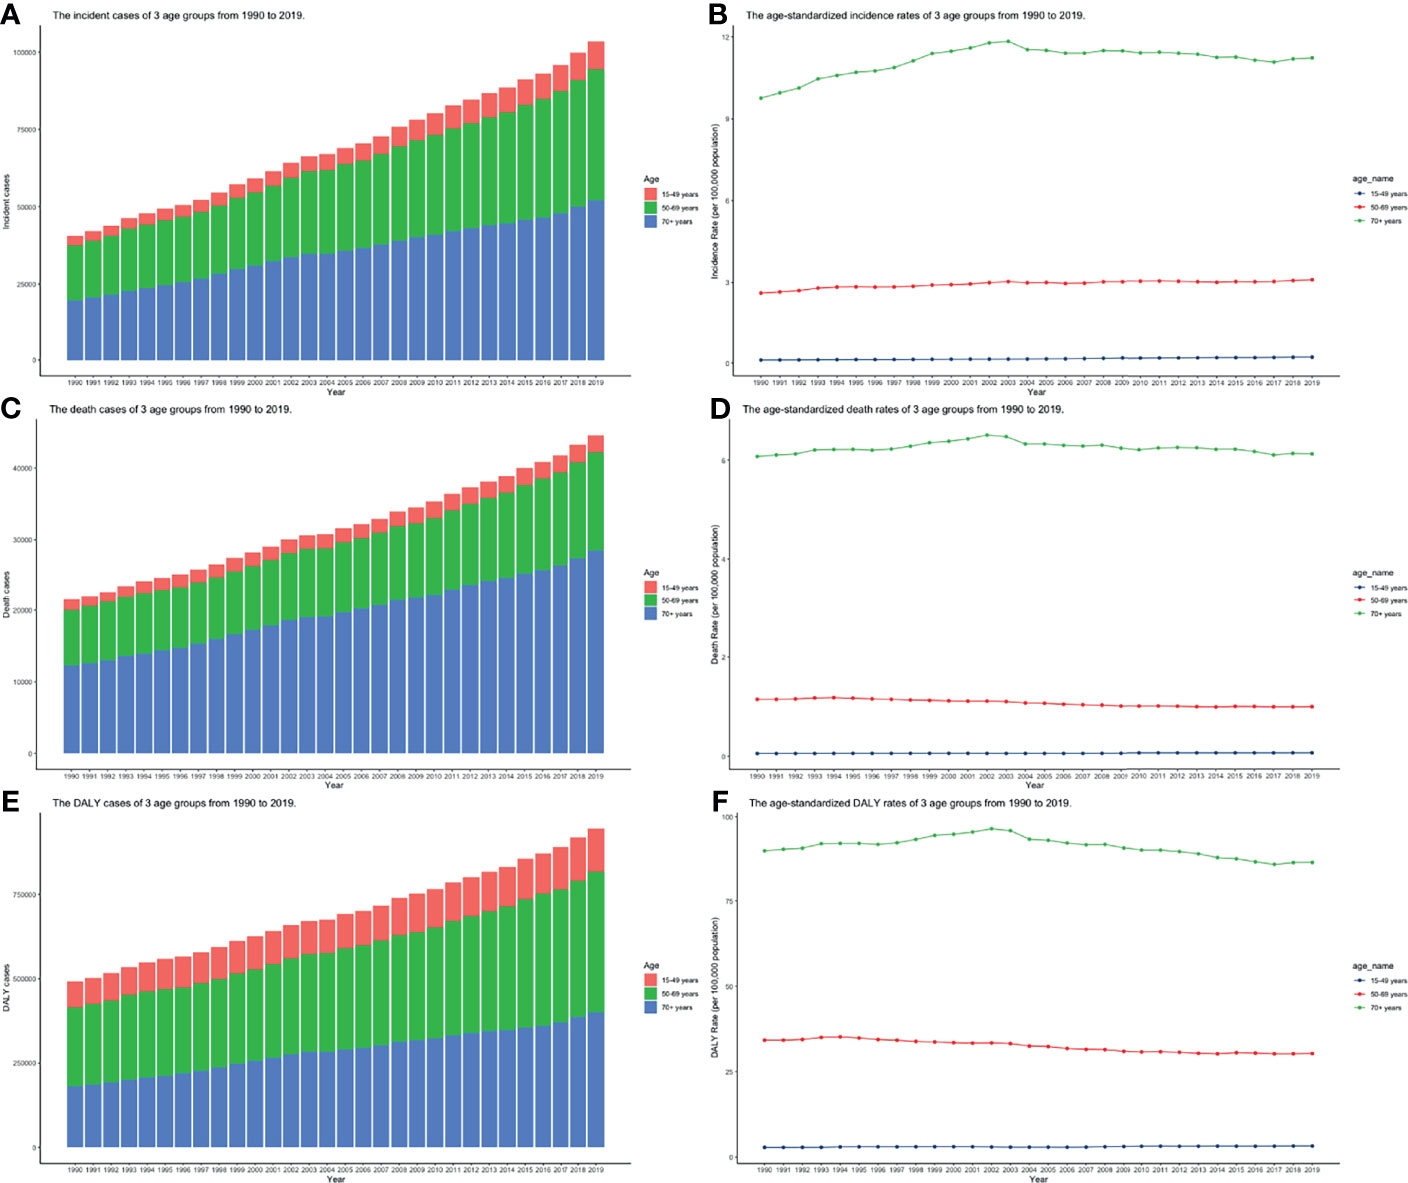
Figure 9 The burden of incidence, deaths, and DALY of 3 age groups from 1990 to 2019. (A) Incident cases; (B) Incidence rates; (C) death cases; (D) death rates; (E) DALY rates; (F) DALYs (ASIR, age-standardized incidence rate; ASDR, age-standardized death rate; DALY, disability-adjusted life year).
Pearson correlation analysis did not show the correlation between the EAPCs of ASIRs (r = 0.035, p = 0.62), ASDRs (r = −0.383, p < 0.01), and age-standardized DALY rates (r = −0.407, p < 0.01) from 1990 to 2019 and SDI in 2019. Then, we used loess local weighted regression (LOESS) to fit the correlation between the EAPCs of ASIRs, ASDRs, age-standardized DALY rates from 1990 to 2019, and SDI in 2019. We found that the EAPCs of ASIRs were stable when SDI was lower than 0.65, but increased when SDI was higher, which indicated that the incidence might increase more rapidly in higher SDI countries (Figure 10A). The EAPCs of ASDRs and age-standardized DALY rates were stable when SDI was lower than 0.75, too. However, they decreased significantly when SDI was higher, demonstrating that the burdens of death and DALY were declining in higher SDI countries (Figures 10B, C). Then, we investigate the correlation between SDI and ASIRs, ASDRs, and age-standardized DALY rates in 21 regions around the globe by Pearson correlation analysis and LOESS. Although Pearson correlation analysis did not show the correlation between the ASDR (r = 0.294, p < 0.01), age-standardized DALY rates (r = 0.279, p < 0.01), and SDI from 1990 to 2019, ASIRs (r = 0.522, p < 0.01) had a positive correlation with SDI. LOESS results showed that all change trends were “S” shaped, dipping when SDI was about 0.45, and ASIRs kept increasing after that, while ASDRs and age-standardized DALY rates peaked when SDI was about 0.75, then declined (Figures 11A–C).
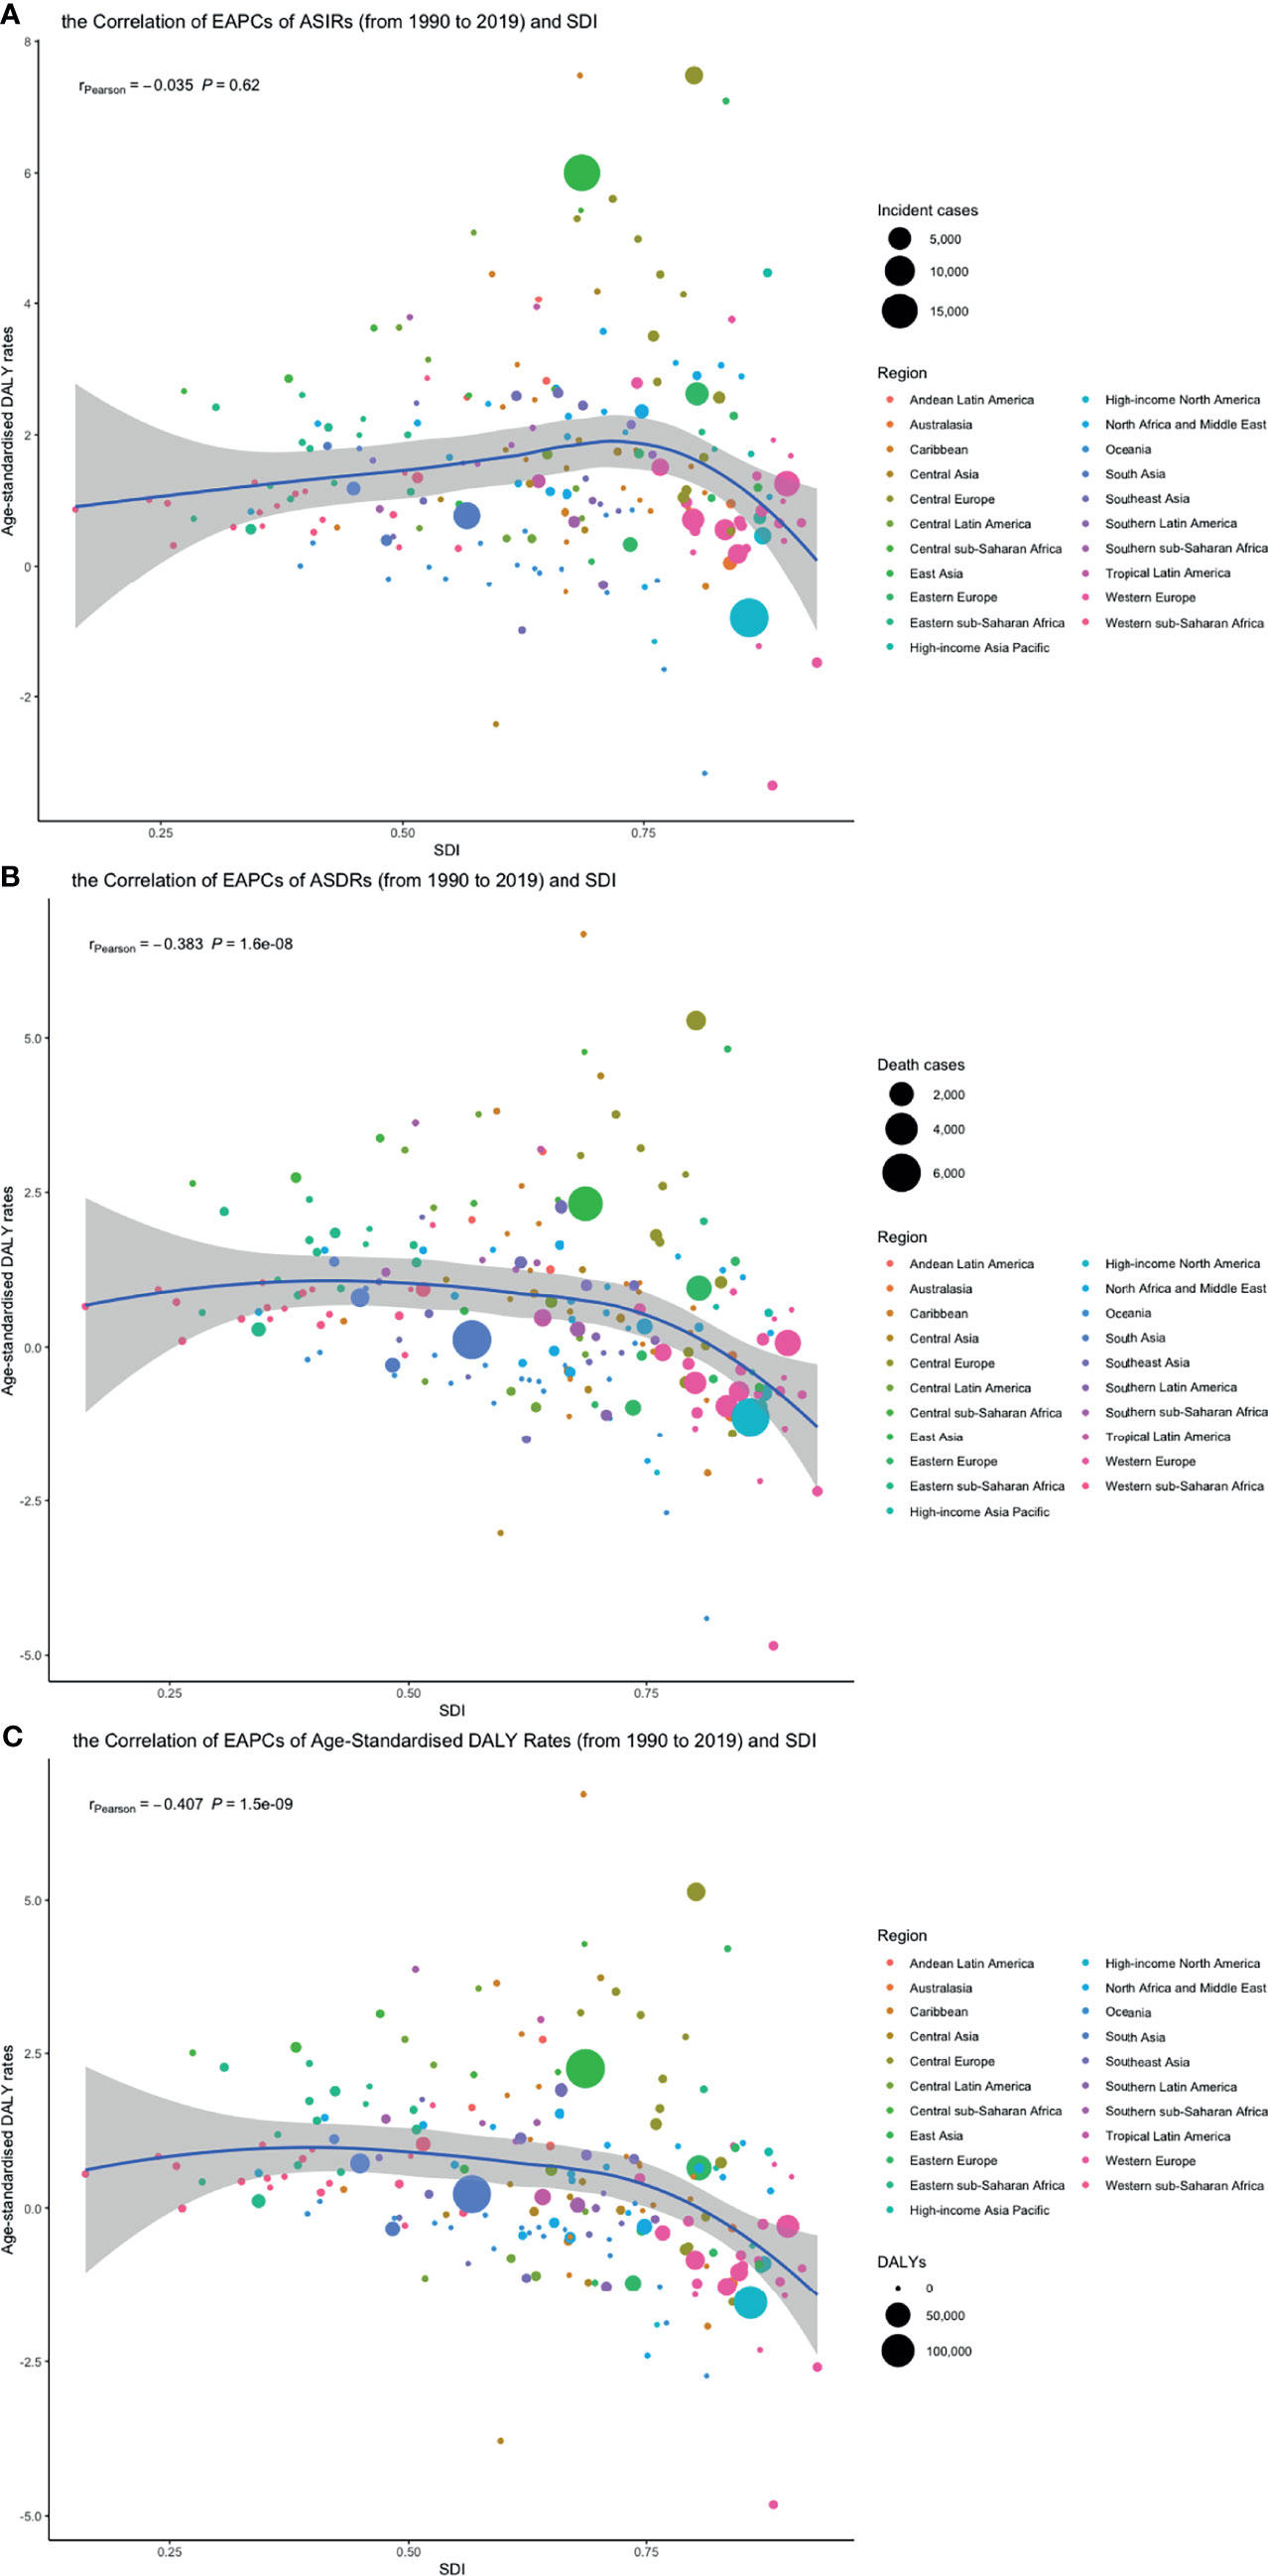
Figure 10 The correlation between EAPCs of (A) ASIR, (B) ASDRs, and (C) age-standardized DALY rates from 1990 to 2019 and SDI in 2019. The circles represent 204 countries or territories, the size of circle represents the number of incident cases, death cases or DALY, and the color of circle represents the region which the country or territory belongs to. (ASIR, age-standardized incidence rate; ASDR, age-standardized death rate; DALY, disability-adjusted life year; SDI, socio-demographic index; EAPC, estimated annual percentage change, SDI, socio-demographic index).
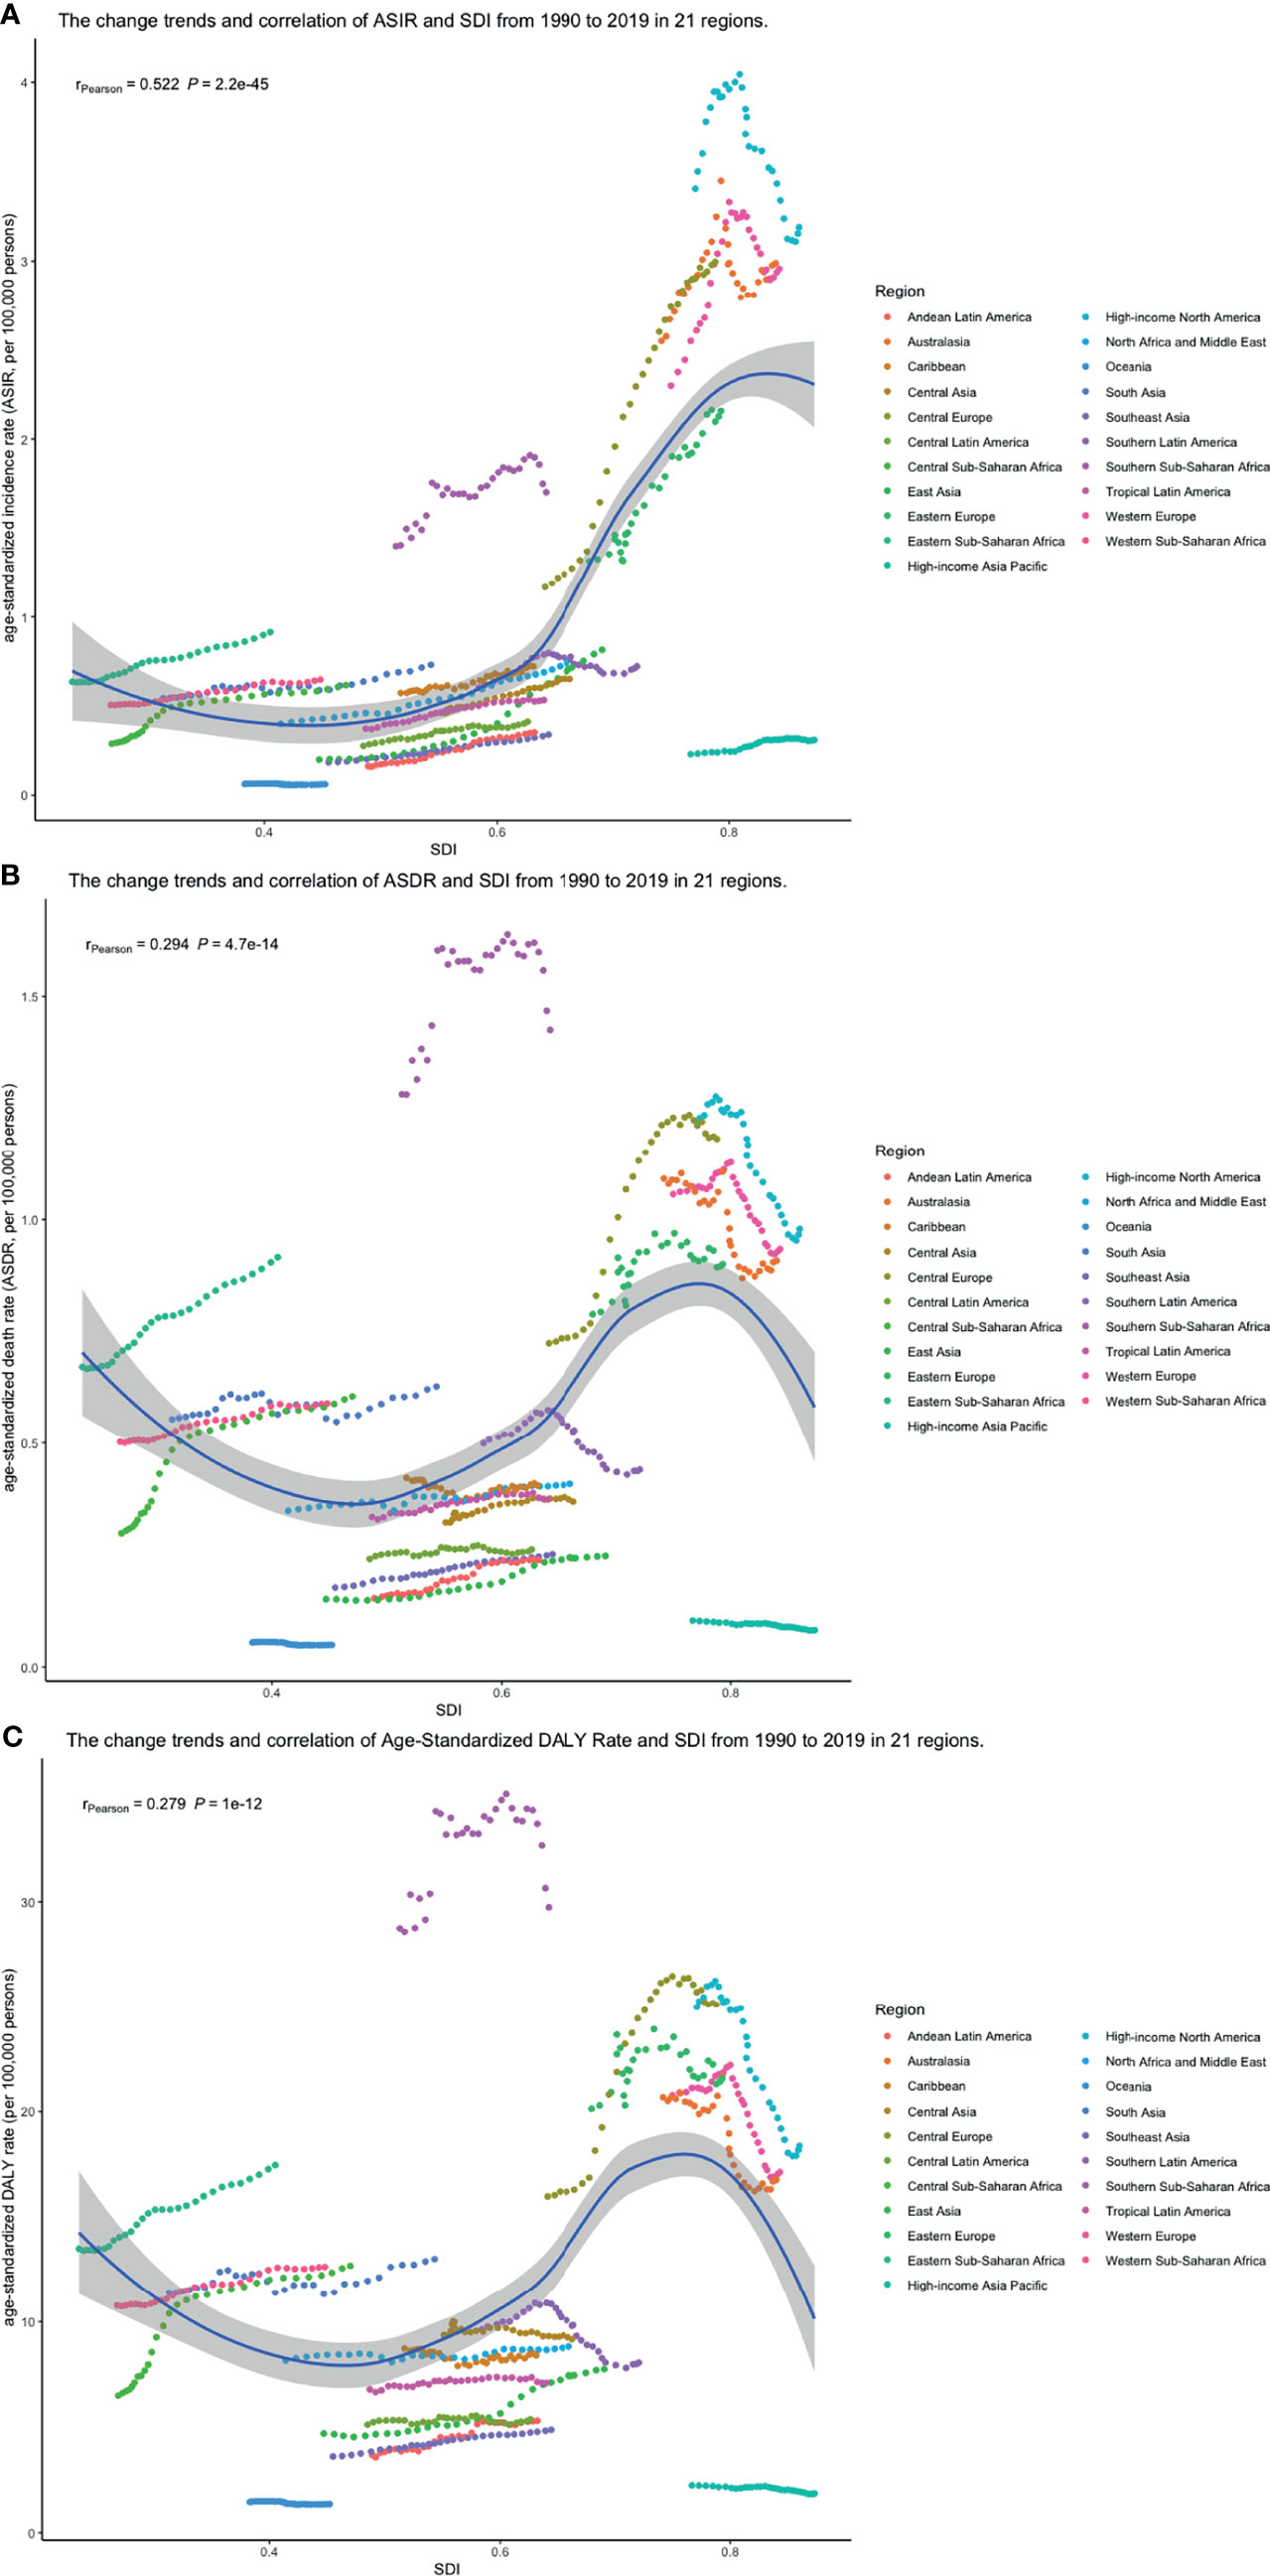
Figure 11 The change trend and correlation between (A) ASIR, (B) ASDRs, and (C) age-standardized DALY rates and SDI from 1990 to 2019. The color of circle represents the 21 different regions. (ASIR, age-standardized incidence rate; ASDR, age-standardized death rate; DALY, disability-adjusted life year; SDI, socio-demographic index; SDI, socio-demographic index).
From 1990 and 2019, smoking, high body mass index, and occupational exposure to benzene or formaldehyde were the potential risk factors related to CLL burden in the GBD study. Among all risk factors, smoking was the greatest contributor to CLL-related death and DALY from 1990 to 2019 in the globe but dropping gradually (Figures 12A, B).
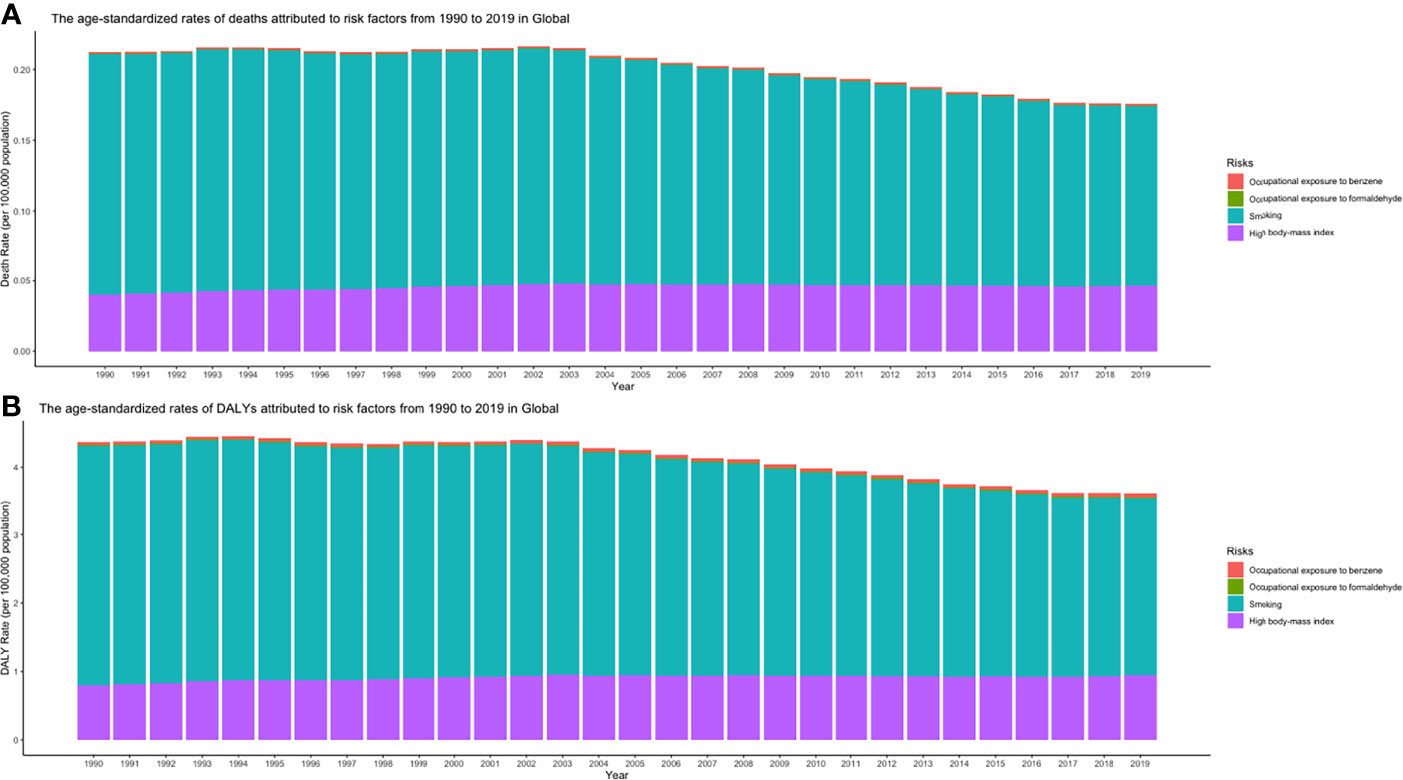
Figure 12 (A) ASDRs and (B) age-standardized DALY rates attributed to risk factors from 1990 to 2019 in Global (ASDR, age-standardized death rate; DALY, disability-adjusted life year).
ASIRs of the world might tend to increase, and so were 5 individual countries that represented 5 different SDI levels, respectively (Figure 13). However, their ASDRs were varied: global ASDRs and the ASDRs of the United States (representing the high SDI quintile) might decrease until 2030, and the ASIRs of Ukraine (high-middle SDI quintile), China (middle SDI quintile), India (low-middle SDI quintile), and Afghanistan (low SDI quintile) would increase (Figure 14).
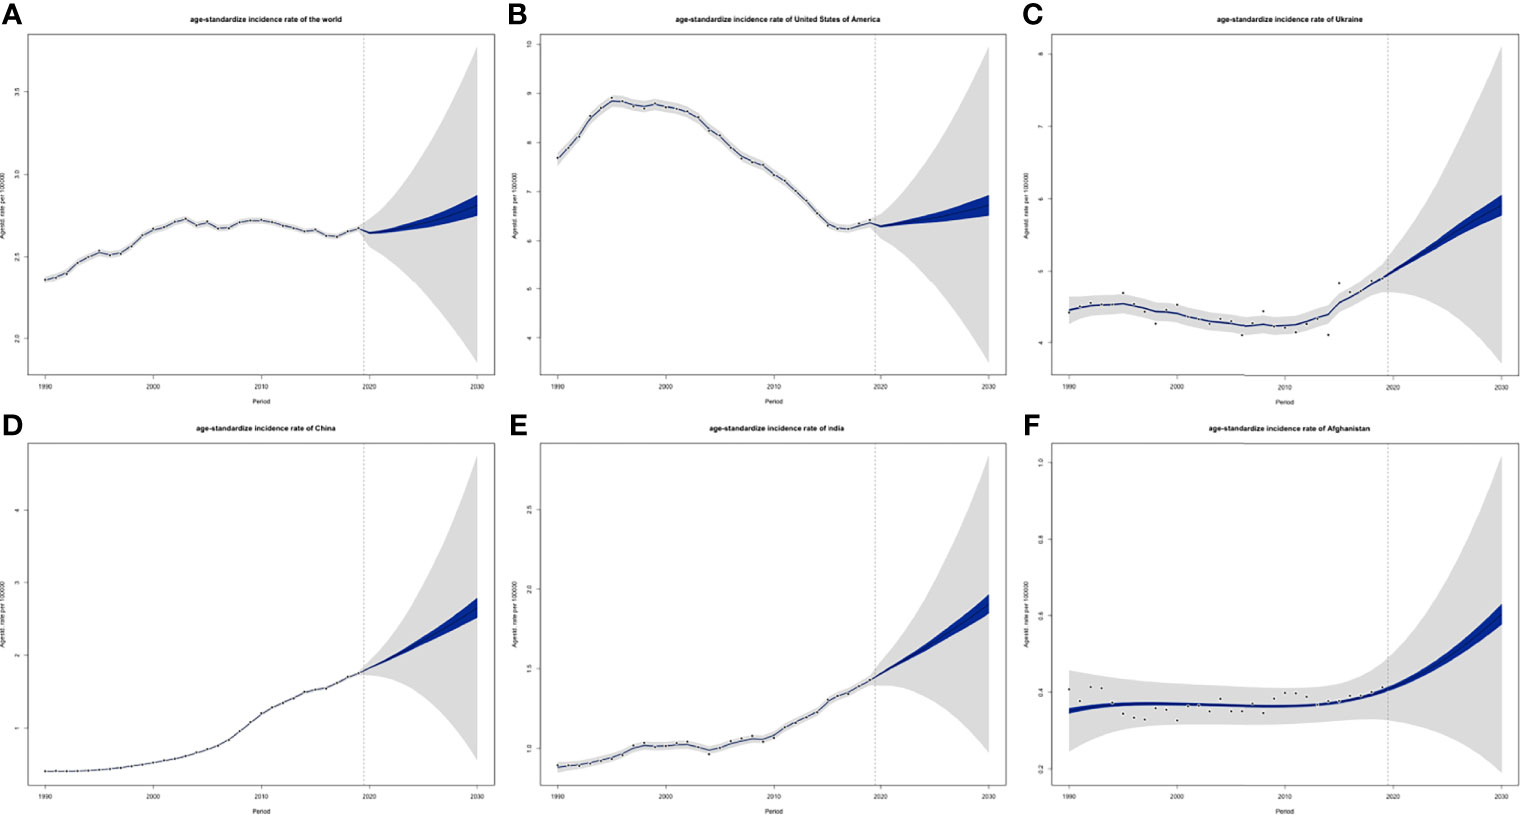
Figure 13 Projections of ASIRs of (A) the world, (B) USA, (C) Ukraine, (D) China, (E) India and (F) Afghanistan from 2020 to 2030: blue areas are 5% confidence intervals and grey areas are 95% confidence intervals; black dots are observation value from 1990 to 2019 (ASIR, age-standardized incidence rate).
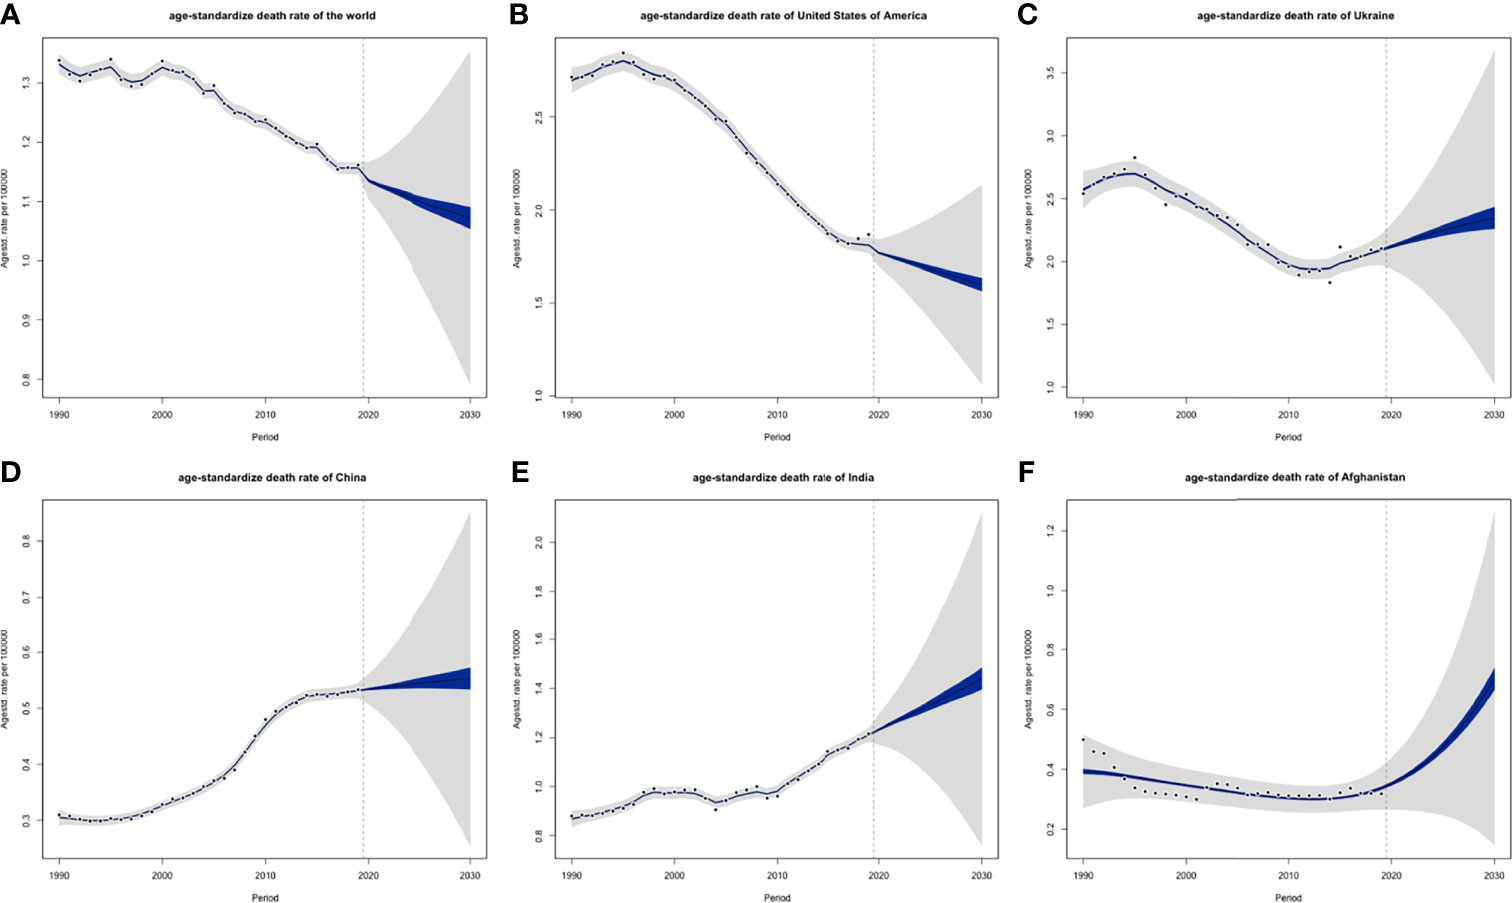
Figure 14 Projections of ASDRs of (A) the world, (B) USA, (C) Ukraine, (D) China, (E) India and (F) Afghanistan from 2020 to 2030: blue areas are 5% confidence intervals and grey areas are 95% confidence intervals; black dots are observation value from 1990 to 2019 (ASDR, age-standardized death rate; DALY).
In the present study, trends of CLL disease burden were assessed based on the GBD study from 1990 to 2019, which provides valuable epidemiologic information for health promotion and disease prevention. Globally, the ASDRs and age-standardized DALY rates generally declined, yet the ASIRs increased slightly. During the same period, the incident cases, death cases, and DALYs of CLL continued to increase, partly due to population growth in developing countries and population aging in developed countries (33). From 1990 to 2019, the ASIRs showed an increasing trend in most geographical regions except in high-income North America and Oceania. Some middle or high-middle SDI regions such as Eastern Asia and Central Europe experienced the fastest growth. In terms of ASDRs and age-standardized DALY rates, the burden of death and DALY in low SDI quintiles stepped up dramatically. Meanwhile, ASDRs and age-standardized DALY rates of high SDI quintiles, such as high-income North America, Western Europe, and Australasia, dropped obviously.
The occurrence of CLL is strongly genetically determined. Environmental factors may also operate but are likely to be less important (34). In our study, the ASIRs in high SDI regions like North America, Western Europe, and Australasia are about 10 times more than High-income Asia Pacific, which has a similar SDI to them. Some genome-wide association studies (GWAS) may explain this phenomenon: these studies support a hereditary link between disease susceptibility CLL and some single-nucleotide polymorphisms (SNPs), including 10q23.31 [ACTA2 or FAS (ACTA2/FAS), 18q21.33 (BCL2), 11p15.5 (C11orf21), 4q25 (LEF1), 2q33.1 (CASP10 or CASP8), 9p21.3 (CDKN2B-AS1), 18q21.32 (PMAIP1), 15q15.1 (BMF), 2p22.2 (QPCT), 2q13 (ACOXL), 8q22.3 (ODF1) and 5p15.33 (TERT)], several of which are proximal to genes involved in apoptosis (35). GWAS of familial cases of CLL suggests that the 6p21.3 region, which includes HLA-DQA1 and HLA-DRB5, is associated with susceptibility to CLL (36–38). However, ethnic differences are found in SNPs associated with CLL: some SNPs associated with CLL found by GWAS of European population are studied in Chinese of Hong Kong, and it demonstrates that mean allele frequencies (MAF) of some CLL-associated SNPs in Chinese are moderately to extremely lower than those in persons of predominantly European descent, which means that those gene determined in the European population are not significantly associated with susceptibility to CLL in the Chinese population (39). These genetic differences may underlie different etiological, pathogenetic, and biological features of CLL between Asians and persons of predominantly European descent with CLL and explain the regional difference of CLL’s incidence partly. All populations arose from a common African Black ancestor, but different clades have different admixture with archaic hominins including Neanderthals, Denisovans, and Homo erectus, which may explain different CLL incidences (5).
Apart from genetic factors, some socioeconomic reasons may also account for the “S”-shaped trend between ASIRs and SDI. Regular blood routine screening may be important in funding asymptomatic patients but unavailable in lower SDI countries: a cross-sectional descriptive study reported 9.1% of patients diagnosed with CLL in Sudan were Rai stage 0 (40), similar percentages were found in Pakistan (41) and Northern India (42), and this percentage in developed countries was 17.6% (43); Binet stage A patients in South-Western Nigeria were 18.2% of all patients diagnosed with CLL (44), while those in developed countries account for 50% (45). The diagnosis of CLL is established by blood counts, blood smears, and immunophenotyping of circulating B lymphocytes to identify a clonal B-cell population (46), which may not be easily accessible in lower SDI countries. In addition, for many developing countries, data sources for informing cancer burden estimation are still sparse (19), and cancer incidence data available in low- and middle-income countries (LMIC) are limited (47); thus, the incidence rates in lower SDI countries may be underestimated.
The pharmaceutic development has changed the landscape of the treatment of CLL, therefore reducing the disease burden of death and DALY in high SDI regions. In the 1970s, oral alkylating agents such as chlorambucil with/without steroids or cyclophosphamide with/without prednisone were the “standard” regimens (48–50). However, the paradigm shifted in the treatment of CLL over the last couple of years. The treatment in CLL has come a long way since the advent of chlorambucil with/without prednisone, purine analogues such as fludarabine, pentostatin, or a combination of fludarabine with cyclophosphamide, and later on combination with rituximab in the late 2000s (51). Moreover, novel targeted drugs for CLL, including Bruton’s tyrosine kinase inhibitors (BTKi; ibrutinib and acalabrutinib), BCL2 inhibitors (venetoclax), and phosphatidylinositol 3-kinase inhibitors (PI3Ki; idelalisib and duvelisib), have improved the prognosis of CLL patients in developed countries significantly in the last 10 years (7). Unfortunately, access to the novel agents is currently limited to certain developed countries, and every effort should be made to make sure patients in developing countries also benefit from these outstanding drugs (12). Most novel drugs and targeted drugs approved by the US Food and Drug Administration (FDA) and marketed in the United States are not available in developing countries such as India (52). In a resource-limited hospital in Nigeria, the major first-line chemotherapy used was cyclophosphamide, vincristine, and prednisolone (CVP) for 42.9% of patients, followed by chlorambucil and prednisolone (CP) for 31.4%. Few patients are accessible to newer drugs, like rituximab with cyclophosphamide, hydroxodaunorubicin, oncovin, and prednisolone (R-CHOP), or fludarabine, cyclophosphamide, and prednisolone (FCP) (53). This situation may partly explain the increasingly serious disease burden of death and DALY in low SDI countries.
CLL occurred almost exclusively after the age of 20 years, and the incidence rates, death rates, and DALY rates increased significantly with age, in both men and women. It poses a serious challenge to aging countries. Unusual low male-to-female ratios of incidence rates (male-to-female ratio < 1) are observed in lower SDI quintiles in our study. Moreover, we found that male-to-female ratios of incidence rates in different age groups are all affected by SDI quintiles (Supplementary Figures S1A–F). The low male-to-female ratios are predominant in Africa, South Asia, Greenland, Mongolia, and some countries in Southeast Asia (Supplementary Figure S2). Some studies achieved similar results (44, 53), while others did not (40–42). Considering the possible underestimation of incidence rates in lower SDI countries and the male-to-female ratio of CLL in African American patients (male-to-female ratio ≥ 1), we infer that the incidence rates of men were underestimated more badly than those of women. The more significant correlation between incidence rates and SDI observed in men than in women (Supplementary Figures S3A-C) may support our inference.
In the current study, smoking, high body mass index, and occupational exposure to benzene or formaldehyde are the potential risk factors related to CLL burden. Several lifestyles and occupational or environmental histories are thought to be risk factors that predispose to CLL/SLL, including farmers (may have benzene and heavy solvent exposure) (54, 55) and central obesity in women (56), but these associations have not been proven in other studies (54).
This study has some limitations. The accuracy of the results depended on the quality and quantity of GBD data (57). However, as data sources for cancer burden estimation were scarce, and cancer registries covered only a small fraction of the population, especially in some underdeveloped regions, the accuracy and integrity of the GBD data were potentially compromised. Besides, misdiagnosed patients might have a potential impact on the incident cases. In addition, the incidence rates of CLL may be underestimated. Furthermore, miscoded incidence/deaths and changes in coding practices or coding systems may also have an effect (19).
Globally, the incidence of CLL had been increasing from 1990 to 2019, and the burden of death and DALY decreased slightly. The ASIRs showed an increasing trend in most geographical regions except in high-income North America and Oceania. The burden of death and DALY was affected by SDI: in low SDI quintiles, ASDRs and age-standardized DALY rates stepped up dramatically, while ASDRs and age-standardized DALY rates of high SDI quintiles dropped significantly. It might result from imbalanced access to novel agents. It posed a serious challenge to aging countries that the incidence rates, death rates, and DALY rates of CLL increased significantly with age. The incidence rates of men were underestimated compare to those of women from unusually low male-to-female ratios of incidence rates (male-to-female ratio < 1) observed in lower SDI quintiles. Global ASIRs might tend to increase until 2030, while ASDRs of the world would decrease until 2030 possibly because of the dropping ASDRs of high SDI quintile countries. Consequently, strategies for early detection of asymptomatic CLL, development of novel drugs, and measures against attributable factors such as smoking and high body mass index should be implemented to reduce CLL burden, especially in lower SDI quintiles.
The original contributions presented in the study are included in the article/Supplementary Material. Further inquiries can be directed to the corresponding authors.
The study was in accordance with the ethical standards formulated in the Helsinki Declaration and was approved by the respective local Medical Ethics Committees of Jinshan Hospital of Fudan University.
YO, YL, and YC conceived the study. YO, YL, YZ, HC, LJ, TQ, XW, and YC performed the literature review, analyzed the data, and drafted the manuscript. HC and XW contributed to the critical revision of the manuscript. All authors contributed to the article and approved the submitted version.
This work was supported by grants from Program of the Shanghai Academic/Technology Researcher leader (20XD1401000), Shanghai Engineering Research Center of Tumor Multi-Target Gene Diagnosis (20DZ2254300), and Key Subject Construction Program of Shanghai Health Administrative Authority (ZK2019B30). All authors obtained permission to acknowledge all those mentioned in the Acknowledgments.
The authors declare that the research was conducted in the absence of any commercial or financial relationships that could be construed as a potential conflict of interest.
All claims expressed in this article are solely those of the authors and do not necessarily represent those of their affiliated organizations, or those of the publisher, the editors and the reviewers. Any product that may be evaluated in this article, or claim that may be made by its manufacturer, is not guaranteed or endorsed by the publisher.
This study was conducted at the Center for Tumor Diagnosis & Therapy, Jinshan Hospital. We sincerely thank all the staff and participants for their important contributions.
The Supplementary Material for this article can be found online at: https://www.frontiersin.org/articles/10.3389/fonc.2022.840616/full#supplementary-material
Supplementary Table S1 | Age-standardized incidence rates by genders in different SDI quintiles from 1990 to 2019. SDI, socio-demographic index.
Supplementary Table S2 | Age-standardized death rate by gender in different SDI quintiles from 1990 to 2019. SDI, socio-demographic index.
Supplementary Table S3 | Age-standardized DALY rates by genders in different SDI quintiles from 1990 to 2019. DALY, disability-adjusted life year; SDI, socio-demographic index.
Supplementary Table S4 | Incidence cases of 204 countries and territories in 2019 (from high to low). UI: uncertainty interval.
Supplementary Table S5 | Death cases of 204 countries and territories in 2019 (from high to low). UI: uncertainty interval.
Supplementary Table S6 | The DALYs 204 countries and territories in 2019 (from high to low). DALY: disability-adjusted life year, UI: uncertainty interval.
Supplementary Table S7 | Age-standardized incidence rates of 204 countries and territories in 2019 (from high to low). ASIR: age-standardized incidence rate, UI: uncertainty interval.
Supplementary Table S8 | Age-standardized death rates of 204 countries and territories in 2019 (from high to low). ASDR: age-standardized death rate, UI: uncertainty interval.
Supplementary Table S9 | Age-standardized DALY rates of 204 countries and territories in 2019 (from high to low). DALY: disability-adjusted life year, UI: uncertainty interval.
Supplementary Table S10 | The EAPCs of ASIRs of 204 countries and territories from1990 to 2019 (from high to low). ASIR: age-standardized incidence rate, EAPCs: estimated annual percentage changes, CI: confidence interval.
Supplementary Table S11 | The EAPCs of ASDRs of 204 countries and territories from1990 to 2019 (from high to low). ASDR: age-standardized death rate, EAPCs: estimated annual percentage changes, CI: confidence interval.
Supplementary Table S12 | The EAPCs of age-standardized DALY Rates of 204 countries and territories from1990 to 2019 (from high to low). DALY: disability-adjusted life year, EAPCs: estimated annual percentage changes, CI: confidence interval.
Supplementary Table S13 | The age and gender distribution of incident cases and ASIRs of CLL in 2019. ASIR: age-standardized incidence rate, UI: uncertainty interval.
Supplementary Table S14 | The age and gender distribution of death cases and ASIRs of CLL in 2019. ASDR: age-standardized death rate, UI: uncertainty interval.
Supplementary Table S15 | The age and gender distribution of DALYs and age-standardized DALY Rates of CLL in 2019. DALY: disability-adjusted life year, UI: uncertainty interval.
Supplementary Table S16 | The age and region distribution of incident cases (95% UI) of CLL in 2019. ASIR: age-standardized incidence rate, UI: uncertainty interval.
Supplementary Table S17 | The age and region distribution of death cases (95% UI) of CLL in 2019. ASDR: age-standardized death rate, UI: uncertainty interval.
Supplementary Table S18 | The age and region distribution of DALYs (95% UI) of CLL in 2019. DALY: disability-adjusted life year, UI: uncertainty interval.
1. Siegel RL, Miller KD, Fuchs HE, Jemal A. Cancer Statistics, 2021. CA: Cancer J Clin (2021) 71(1):7–33. doi: 10.3322/caac.21654
2. Hernández JA, Land KJ, McKenna RW. Leukemias, Myeloma, and Other Lymphoreticular Neoplasms. Cancer (1995) 75(1 Suppl):381–94. doi: 10.1002/1097-0142(19950101)75:1+<381::AID-CNCR2820751320>3.0.CO;2-B
3. Smith A, Howell D, Patmore R, Jack A, Roman E. Incidence of Haematological Malignancy by Sub-Type: A Report From the Haematological Malignancy Research Network. Br J Cancer (2011) 105(11):1684–92. doi: 10.1038/bjc.2011.450
4. Yamamoto JF, Goodman MT. Patterns of Leukemia Incidence in the United States by Subtype and Demographic Characteristics, 1997-2002. Cancer Causes Control CCC (2008) 19(4):379–90. doi: 10.1007/s10552-007-9097-2
5. Yang S, Varghese AM, Sood N, Chiattone C, Akinola NO, Huang X, et al. Ethnic and Geographic Diversity of Chronic Lymphocytic Leukaemia. Leukemia (2021) 35(2):433–9. doi: 10.1038/s41375-020-01057-5
6. Miranda-Filho A, Piñeros M, Ferlay J, Soerjomataram I, Monnereau A, Bray F. Epidemiological Patterns of Leukaemia in 184 Countries: A Population-Based Study. Lancet Haematol (2018) 5(1):e14–24. doi: 10.1016/S2352-3026(17)30232-6
7. Roeker LE, Mato AR. Approaches for Relapsed CLL After Chemotherapy-Free Frontline Regimens. Hematol Am Soc Hematol Educ Program (2020) 2020(1):10–7. doi: 10.1182/hematology.2020000168
8. Villavicencio A, Solans M, Zacarías-Pons L, Vidal A, Puigdemont M, Roncero JM, et al. Comorbidities at Diagnosis, Survival, and Cause of Death in Patients With Chronic Lymphocytic Leukemia: A Population-Based Study. Int J Environ Res Public Health (2021) 18(2). doi: 10.3390/ijerph18020701
9. Ko BS, Chen LJ, Huang HH, Chen HM, Hsiao FY. Epidemiology, Treatment Patterns and Survival of Chronic Lymphocytic Leukaemia/Small Lymphocytic Lymphoma (CLL/SLL) in Taiwan, 2006-2015. Int J Clin Pract (2021) 75(8):e14258. doi: 10.1111/ijcp.14258
10. Ahn IE, Farooqui MZH, Tian X, Valdez J, Sun C, Soto S, et al. Depth and Durability of Response to Ibrutinib in CLL: 5-Year Follow-Up of a Phase 2 Study. Blood (2018) 131(21):2357–66. doi: 10.1182/blood-2017-12-820910
11. Ma S, Seymour JF, Brander DM, Kipps TJ, Choi MY, Anderson MA, et al. Efficacy of Venetoclax Plus Rituximab for Relapsed CLL: 5-Year Follow-Up of Continuous or Limited- Duration Therapy. Blood (2021) 138(10):836–46. doi: 10.1182/blood.2020009578
12. Iovino L, Shadman M. Novel Therapies in Chronic Lymphocytic Leukemia: A Rapidly Changing Landscape. Curr Treat Options Oncol (2020) 21(4):24. doi: 10.1007/s11864-020-0715-5
13. Global Burden of Disease Collaborative Network. Global Burden of Disease Study 2019 (GBD 2019) Results. Institute for Health Metrics and Evaluation (IHME (2020). Available at: http://ghdx.healthdata.org/gbd-results-tool.
14. Li B, Tang H, Cheng Z, Zhang Y, Xiang H. The Current Situation and Future Trend of Leukemia Mortality by Sex and Area in China. Front Public Health (2020) 8:598215. doi: 10.3389/fpubh.2020.598215
15. Lin X, Wang J, Huang X, Wang H, Li F, Ye W, et al. Global, Regional, and National Burdens of Leukemia From 1990 to 2017: A Systematic Analysis of the Global Burden of Disease 2017 Study. Aging (2021) 13(7):10468–89. doi: 10.18632/aging.202809
16. Ou Z, Yu D, Liang Y, He W, Li Y, Zhang M, et al. Analysis of the Global Burden of Disease Study Highlights the Trends in Death and Disability-Adjusted Life Years of Leukemia From 1990 to 2017. Cancer Commun (London England) (2020) 40(11):598–610. doi: 10.1002/cac2.12094
17. Stevens GA, Alkema L, Black RE, Boerma JT, Collins GS, Ezzati M, et al. Guidelines for Accurate and Transparent Health Estimates Reporting: The GATHER Statement. Lancet (London England) (2016) 388(10062):e19–23. doi: 10.1016/S0140-6736(16)30388-9
18. Global Burden of 87 Risk Factors in 204 Countries and Territories, 1990-2019: A Systematic Analysis for the Global Burden of Disease Study 2019. Lancet (London England) (2020) 396(10258):1223–49. doi: 10.1016/S0140-6736(20)30752-2
19. Global Burden of Disease Cancer C, Fitzmaurice C, Allen C, Barber RM, Barregard L, Bhutta ZA, et al. Global, Regional, and National Cancer Incidence, Mortality, Years of Life Lost, Years Lived With Disability, and Disability-Adjusted Life-Years for 32 Cancer Groups, 1990 to 2015: A Systematic Analysis for the Global Burden of Disease Study. JAMA Oncol (2017) 3(4):524–48. doi: 10.1001/jamaoncol.2016.5688
20. Deng Y, Wang M, Zhou L, Zheng Y, Li N, Tian T, et al. Global Burden of Larynx Cancer, 1990-2017: Estimates From the Global Burden of Disease 2017 Study. Aging (2020) 12(3):2545–83. doi: 10.18632/aging.102762
21. Liu Z, Jiang Y, Yuan H, Fang Q, Cai N, Suo C, et al. The Trends in Incidence of Primary Liver Cancer Caused by Specific Etiologies: Results From the Global Burden of Disease Study 2016 and Implications for Liver Cancer Prevention. J Hepatol (2019) 70(4):674–83. doi: 10.1016/j.jhep.2018.12.001
22. Jung K-W, Won Y-J, Hong S, Kong H-J, Lee ES. Prediction of Cancer Incidence and Mortality in Korea, 2020. Cancer Res Treat (2020) 52(2):351–8. doi: 10.4143/crt.2020.203
23. Wu J, Yang S, Xu K, Ding C, Zhou Y, Fu X, et al. Patterns and Trends of Liver Cancer Incidence Rates in Eastern and Southeastern Asian Countries (1983-2007) and Predictions to 2030. Gastroenterology (2018) 154(6):1719–28.e5. doi: 10.1053/j.gastro.2018.01.033
24. Soares SCM, Dos Santos KMR, de Morais Fernandes FCG, Barbosa IR, de Souza DLB. Testicular Cancer Mortality in Brazil: Trends and Predictions Until 2030. BMC Urol (2019) 19(1):59. doi: 10.1186/s12894-019-0487-z
25. Liu Z, Jiang Y, Fang Q, Yuan H, Cai N, Suo C, et al. Future of Cancer Incidence in Shanghai, China: Predicting the Burden Upon the Ageing Population. Cancer Epidemiol (2019) 60:8–15. doi: 10.1016/j.canep.2019.03.004
26. Du Z, Chen W, Xia Q, Shi O, Chen Q. Trends and Projections of Kidney Cancer Incidence at the Global and National Levels, 1990-2030: A Bayesian Age-Period-Cohort Modeling Study. biomark Res (2020) 8:16–. doi: 10.1186/s40364-020-00195-3
27. Knoll M, Furkel J, Debus J, Abdollahi A, Karch A, Stock C. An R Package for an Integrated Evaluation of Statistical Approaches to Cancer Incidence Projection. BMC Med Res Methodol (2020) 20(1):257–. doi: 10.1186/s12874-020-01133-5
28. Bray F, Møller B. Predicting the Future Burden of Cancer. Nat Rev Cancer (2006) 6(1):63–74. doi: 10.1038/nrc1781
29. Bray I. Application of Markov Chain Monte Carlo Methods to Projecting Cancer Incidence and Mortality. J R Stat Soc: Ser C (Appl Statistics) (2002) 51(2):151–64. doi: 10.1111/1467-9876.00260
30. Riebler A, Held L. Projecting the Future Burden of Cancer: Bayesian Age-Period-Cohort Analysis With Integrated Nested Laplace Approximations. Biom J (2017) 59(3):531–49. doi: 10.1002/bimj.201500263
31. Zhang L, Cao F, Zhang G, Shi L, Chen S, Zhang Z, et al. Trends in and Predictions of Colorectal Cancer Incidence and Mortality in China From 1990 to 2025. Front Oncol (2019) 9:98. doi: 10.3389/fonc.2019.00098
32. Bai L, Liu Z, Fang Q, Yan Q, Shi O, Bao P, et al. The Trends and Projections in the Incidence and Mortality of Liver Cancer in Urban Shanghai: A Population-Based Study From 1973 to 2020. Clin Epidemiol (2018) 10:277–88. doi: 10.2147/CLEP.S153951
33. Fitzmaurice C, Abate D, Abbasi N, Abbastabar H, Abd-Allah F, Abdel-Rahman O, et al. Global, Regional, and National Cancer Incidence, Mortality, Years of Life Lost, Years Lived With Disability, and Disability-Adjusted Life-Years for 29 Cancer Groups, 1990 to 2017: A Systematic Analysis for the Global Burden of Disease Study. JAMA Oncol (2019) 5(12):1749–68. doi: 10.1001/jamaoncol.2019.2996
34. Yang SM, Li JY, Gale RP, Huang XJ. The Mystery of Chronic Lymphocytic Leukemia (CLL): Why is it Absent in Asians and What Does This Tell Us About Etiology, Pathogenesis and Biology? Blood Rev (2015) 29(3):205–13. doi: 10.1016/j.blre.2014.12.001
35. Berndt SI, Skibola CF, Joseph V, Camp NJ, Nieters A, Wang Z, et al. Genome-Wide Association Study Identifies Multiple Risk Loci for Chronic Lymphocytic Leukemia. Nat Genet (2013) 45(8):868–76. doi: 10.1158/1538-7445.AM2013-LB-23
36. Slager SL, Rabe KG, Achenbach SJ, Vachon CM, Goldin LR, Strom SS, et al. Genome-Wide Association Study Identifies a Novel Susceptibility Locus at 6p21.3 Among Familial CLL. Blood (2011) 117(6):1911–6. doi: 10.1182/blood-2010-09-308205
37. Slager SL, Skibola CF, Di Bernardo MC, Conde L, Broderick P, McDonnell SK, et al. Common Variation at 6p21.31 (BAK1) Influences the Risk of Chronic Lymphocytic Leukemia. Blood (2012) 120(4):843–6. doi: 10.1182/blood-2012-03-413591
38. Slager SL, Camp NJ, Conde L, Shanafelt TD, Achenbach SJ, Rabe KG, et al. Common Variants Within 6p21.31 Locus are Associated With Chronic Lymphocytic Leukaemia and, Potentially, Other non-Hodgkin Lymphoma Subtypes. Br J Haematol (2012) 159(5):572–6. doi: 10.1111/bjh.12070
39. Lan Q, Au WY, Chanock S, Tse J, Wong KF, Shen M, et al. Genetic Susceptibility for Chronic Lymphocytic Leukemia Among Chinese in Hong Kong. Eur J Haematol (2010) 85(6):492–5. doi: 10.1111/j.1600-0609.2010.01518.x
40. Basabaeen AA, Abdelgader EA, Babekir EA, Eltayeb NH, Altayeb OA, Fadul EA, et al. Clinical Presentation and Hematological Profile Among Young and Old Chronic Lymphocytic Leukemia Patients in Sudan. BMC Res Notes (2019) 12(1):202–. doi: 10.1186/s13104-019-4239-7
41. Zeeshan R, Sultan S, Irfan SM, Kakar J, Hameed MA. Clinico-Hematological Profile of Patients With B-Chronic Lymphoid Leukemia in Pakistan. Asian Pacific J Cancer Prev APJCP (2015) 16(2):793–6. doi: 10.7314/APJCP.2015.16.2.793
42. Gogia A, Sharma A, Raina V, Kumar L, Vishnubhatla S, Gupta R, et al. Assessment of 285 Cases of Chronic Lymphocytic Leukemia Seen at Single Large Tertiary Center in Northern India. Leukemia Lymphoma (2012) 53(10):1961–5. doi: 10.3109/10428194.2012.672734
43. Rai KR, Sawitsky A, Cronkite EP, Chanana AD, Levy RN, Pasternack BS. Clinical Staging of Chronic Lymphocytic Leukemia. Blood (1975) 46(2):219–34. doi: 10.1182/blood.V46.2.219.219
44. Salawu L, Bolarinwa RA, Durosinmi MA. Chronic Lymphocytic Leukaemia: a-Twenty-Years Experience and Problems in Ile-Ife, South-Western Nigeria. Afr Health Sci (2010) 10(2):187–92.
45. Binet JL, Auquier A, Dighiero G, Chastang C, Piguet H, Goasguen J, et al. A New Prognostic Classification of Chronic Lymphocytic Leukemia Derived From a Multivariate Survival Analysis. Cancer (1981) 48(1):198–206. doi: 10.1002/1097-0142(19810701)48:1<198::AID-CNCR2820480131>3.0.CO;2-V
46. Hallek M. Chronic Lymphocytic Leukemia: 2020 Update on Diagnosis, Risk Stratification and Treatment. Am J Hematol (2019) 94(11):1266–87. doi: 10.1002/ajh.25595
47. Bray F. The Evolving Scale and Profile of Cancer Worldwide: Much Ado About Everything. Cancer Epidemiol Biomarkers Prev Publ Am Assoc Cancer Res Cosponsored by Am Soc Prev Oncol (2016) 25(1):3–5. doi: 10.1158/1055-9965.EPI-15-1109
48. Galton DA, Israels LG, Nabarro JD, Till M. Clinical Trials of P-(Di-2-Chloroethylamino)-Phenylbutyric Acid (CB 1348) in Malignant Lymphoma. Br Med J (1955) 2(4949):1172–6. doi: 10.1136/bmj.2.4949.1172
49. Galton DA, Wiltshaw E, Szur L, Dacie JV. The Use of Chlorambucil and Steroids in the Treatment of Chronic Lymphocytic Leukaemia. Br J Haematol (1961) 7:73–98. doi: 10.1111/j.1365-2141.1961.tb00321.x
50. Farrerasvalenti P, Rozman C, Blanco F. TREATMENT OF CHRONIC LYMPHATIC LEUKEMIA WITH A NEW ALKYLATING AGENT, CYCLOPHOSPHAMIDE. Rev Clin Espanola (1963) 91:17–22.
51. Rai KR, Jain P. Chronic Lymphocytic Leukemia (CLL)-Then and Now. Am J Hematol (2016) 91(3):330–40. doi: 10.1002/ajh.24282
52. Sathyanarayanan V, Flowers CR, Iyer SP. Comparison of Access to Novel Drugs for Lymphoma and Chronic Lymphocytic Leukemia Between India and the United States. JCO Glob Oncol (2020) 6:1124–33. doi: 10.1200/GO.20.00012
53. Korubo KI, Okite UP, Ezeugwu SI. Chronic Lymphocytic Leukemia: Prognostic Factors at Presentation in a Resource-Limited Center. JCO Glob Oncol (2021) 7:56–62. doi: 10.1200/GO.20.00276
54. Talibov M, Auvinen A, Weiderpass E, Hansen J, Martinsen JI, Kjaerheim K, et al. Occupational Solvent Exposure and Adult Chronic Lymphocytic Leukemia: No Risk in a Population-Based Case-Control Study in Four Nordic Countries. Int J Cancer (2017) 141(6):1140–7. doi: 10.1002/ijc.30814
55. Burmeister LF, Van Lier SF, Isacson P. Leukemia and Farm Practices in Iowa. Am J Epidemiol (1982) 115(5):720–8. doi: 10.1093/oxfordjournals.aje.a113354
56. Benavente Y, Casabonne D, Costas L, Robles C, Alonso E, de la Banda E, et al. Established and Suggested Exposures on CLL/SLL Etiology: Results From the CLL-MCC-Spain Study. Cancer Epidemiol (2018) 52:106–11. doi: 10.1016/j.canep.2017.12.012
57. Lin Q, Mao L, Shao L, Zhu L, Han Q, Zhu H, et al. Global, Regional, and National Burden of Chronic Myeloid Leukemia, 1990-2017: A Systematic Analysis for the Global Burden of Disease Study 2017. Front Oncol (2020) 10:580759–. doi: 10.3389/fonc.2020.580759
59. Global Burden of Disease Collaborative Network. Global Burden of Disease Study 2019 (GBD 2019). Seattle, United States: Results. Institute for Health Metrics and Evaluation (IHME) (2020) Available from http://ghdx.healthdata.org/gbd-results-tool.
Keywords: chronic lymphocytic leukemia, epidemiology, incidence, death, disability-adjusted life years
Citation: Ou Y, Long Y, Ji L, Zhan Y, Qiao T, Wang X, Chen H and Cheng Y (2022) Trends in Disease Burden of Chronic Lymphocytic Leukemia at the Global, Regional, and National Levels From 1990 to 2019, and Projections Until 2030: A Population-Based Epidemiologic Study. Front. Oncol. 12:840616. doi: 10.3389/fonc.2022.840616
Received: 21 December 2021; Accepted: 07 February 2022;
Published: 10 March 2022.
Edited by:
Mohamed A. Yassin, Hamad Medical Corporation, QatarReviewed by:
Abdolreza Sotoodeh Jahromi, Jahrom University of Medical Sciences, IranCopyright © 2022 Ou, Long, Ji, Zhan, Qiao, Wang, Chen and Cheng. This is an open-access article distributed under the terms of the Creative Commons Attribution License (CC BY). The use, distribution or reproduction in other forums is permitted, provided the original author(s) and the copyright owner(s) are credited and that the original publication in this journal is cited, in accordance with accepted academic practice. No use, distribution or reproduction is permitted which does not comply with these terms.
*Correspondence: Yunfeng Cheng, eWZjaGVuZ0BmdWRhbi5lZHUuY24=; Hao Chen, aC5jaGVuQGZ1ZGFuLmVkdS5jbg==
Disclaimer: All claims expressed in this article are solely those of the authors and do not necessarily represent those of their affiliated organizations, or those of the publisher, the editors and the reviewers. Any product that may be evaluated in this article or claim that may be made by its manufacturer is not guaranteed or endorsed by the publisher.
Research integrity at Frontiers
Learn more about the work of our research integrity team to safeguard the quality of each article we publish.