 Zhicong Zhao
 Zhenjun Zhao
 Jianye Wang
 He Zhang1,4
 Qiang Xia
- 1Department of Liver Surgery, Renji Hospital, Shanghai Jiao Tong University School of Medicine, Shanghai, China
- 2Department of Systems Biology, Beckman Research Institute of City of Hope, Duarte, CA, United States
- 3Department of Surgery, School of Medicine, Technical University of Munich, Munich, Germany
- 4Department of Surgery, The University of Hong Kong-Shenzhen Hospital, Shenzhen, China
- 5Shanghai Engineering Research Center of Transplantation and Immunology, Shanghai, China
- 6Shanghai Institute of Transplantation, Shanghai, China
The ATP binding cassette (ABC) transporter family is ubiquitous in eukaryotes, specifically in vertebrates, and plays a crucial role in energy homeostasis, cell signaling, and drug resistance. Accumulating evidence indicates that some ABC transporters contribute to cancer cell proliferation and tumor progression; however, relatively little is known about the behavior of the ABC transporter family in hepatocellular carcinoma (HCC). By analyzing two public transcriptomic databases, we evaluated the effect of genes in the ABC transporter family on HCC prognostic prediction; ABCC6 was selected for further study. Notably, ABCC6 was found to be downregulated in HCC tissues and correlated with favorable outcomes in patients with HCC. Moreover, ABCC6 knockdown not only significantly promoted cell proliferation in vitro and in vivo, but also inhibited cell cycle arrest and cell apoptosis. Transcriptome analysis revealed that ABCC6 depletion enhanced the “mitotic cell cycle” and “DNA replication” pathways, and suppressed the “PPAR signaling pathway”. Further investigation demonstrated that PPARα, one of the key regulators in peroxisome metabolism, is located downstream of ABCC6. In summary, our study provides profound insights into the behavior of ABC transporter family genes in various HCC cohorts, identifies ABCC6 as a biomarker for early-stage HCC diagnosis, and offers experimental basis for further investigations of targeting ABCC6 in the treatment of patients with HCC.
Introduction
Hepatocellular carcinoma (HCC) is the sixth most common cancer worldwide and accounts for approximately 85% of primary liver cancers (1). Moreover, incidence rates of HCC are significantly higher in China, Southeast Asia, and Africa than the rest of the world (2). Risk factors for HCC include hepatitis B virus infection, cirrhosis, non-alcoholic fatty liver disease, excessive alcohol consumption, autoimmune disease, and accumulation of reactive oxygen species (ROS) (3, 4). Additionally, early diagnosis through surveillance and curative treatment has considerably improved the 5-year survival of patients with HCC (5). Therefore, it’s strongly recommended to systematically screen target populations that are at a particularly high risk for developing HCC.
The ATP binding cassette (ABC) transporter family represents one of the largest families of transmembrane proteins (6). ABC transporters are found among all living organisms, and are classified into seven subfamilies, designated ABCA-ABCG (6). By utilizing the energy from ATP hydrolysis, ABC transporters can translocate specific substrates across the membrane (7). Furthermore, the past few decades have witnessed numerous studies documenting the contribution of ABC transporters to multidrug resistance. Specifically, some ABC transporters, such as ABCC1, ABCG2, and ABCB1, are highly efficient at extruding drugs from cancer cells, resulting in substantial multidrug resistance (8). More recently, accumulating evidence indicates that some ABC transporters also contribute to cancer cell proliferation and tumor progression (6, 7). For example, ABCC4 knockdown induces cell cycle arrest and apoptosis in acute myeloid leukemia (9). Overexpression of ABCC1 correlates with reduced overall survival in patients with neuroblastoma (10). Elevated ABCA13 mRNA levels are linked to poor clinical outcomes in patients with gastric adenocarcinoma (11). At the same time, some ABC transporters (e.g., ABCA1, ABCA2, and ABCA7) are essential for lipid transport and homeostasis (12). However, because ABC transporters perform multiple functions simultaneously, controversial results have been reported (13). Thus, there is a pressing need to understand the overall behavior of ABC transporter family genes in HCC.
ABCC6, primarily localized in the basolateral membrane of hepatocytes, belongs to the ABC transporter C subfamily (14). Several studies have demonstrated that ABCC6 plays an important role in mineralization homeostasis. It’s well-established that ABCC6 mutations cause a complex autosomal recessive disease, called pseudoxanthoma elasticum (PXE) (15, 16). Mechanistically, ABCC6 overexpression results in the efflux of ATP, which is rapidly converted into nucleoside monophosphates and pyrophosphate and alters the extracellular environment (17). Moreover, recent studies have suggested that ABCC6 variations correlate with altered plasma triglyceride levels and increased coronary risks (18, 19). Additionally, genetic deletion of Abcc6 in mice disturbs cholesterol homeostasis and lipid metabolism (20). However, the role of ABCC6 in tumor biology has been poorly investigated.
In the present study, we first analyzed the prognostic value of ABC transporter family genes using the Cancer Genome Atlas (TCGA) and GSE14520 datasets, and then identified ABCC6 as a potential biomarker for early-stage HCC diagnosis and prognostic prediction. Specifically, ABCC6 expression was downregulated in HCC tissues and positively correlated with favorable overall survival in patients with HCC. Functional studies further revealed that ABCC6 knockdown significantly enhanced cancer cell proliferation in vitro and in vivo. Mechanistically, ABCC6 depletion inhibits the PPARα (Peroxisome proliferator-activated receptor alpha) activity and protects HCC cells from oxidative damage.
Materials and Methods
Cell Culture
HCC Cell lines MHCC97H, SMMC7721, and Huh7 were obtained from Cell Resource Center of Shanghai Institutes for Biological Sciences, Chinese Academy of Sciences. Normal human hepatic cell line L-02 and human HCC cell lines MHCC97L and LM3 were kindly given from Huashan Hospital, Cancer Metastasis Institute, Fudan University, Shanghai. All cell lines were grown in DMEM medium (Gibco) supplemented with 10% Fetal bovine serum(FBS)(Gibco), and 1% penicillin-streptomycin (Gibco), incubated at 37°C and 5% CO2. Mycoplasma contamination was tested every month.
Patients and Samples
Fresh human HCC tumor tissues and adjacent paratumor tissues were collected from patients who underwent surgical resection or liver transplantation at Department of Liver Surgery, Renji Hospital, Shanghai Jiao Tong University School of Medicine. Written informed consent was obtained from each patient. For Clinical analyses, two independent HCC cohorts of HCC patients were retrospectively adopted. HCC cohort 1 (hepatectomy cohort) included 153 HCCs collected between February 2010—August 2015 from Department of Liver Surgery, Renji Hospital, Shanghai Jiao Tong University School of Medicine. HCC cohort 2 (liver transplantation cohort) included 70 HCCs collected between January 2015—April 2016 from Department of Liver Surgery, Renji Hospital, Shanghai Jiao Tong University School of Medicine. All patients were diagnosed with HCC according to the NCCN guidelines and routinely followed up. This study was approved by the Renji Hospital Ethics Committee.
Constructs and Transfections
Human full-length ABCC6 cDNA was inserted to the lentiviral vector CMV-MCS-3FLAG-SV40- EGFP-IRES-Puromycin plasmid by Fubio company (Shanghai, China). Short hairpin RNA (shRNA) targeting ABCC6 was constructed into PLKO.1 plasmid by Genepharma Company (Shanghai, China), while a non-target shRNA (5’- GCGCGCTTTGTAGGATTCG-3’) was used as a negative control. To construct stable cell lines with overexpression or downregulation of ABCC6, lentivirus particles were generated based on above plasmids and transfected into HCC cell lines in the presence of polybrene. 48 hours after infection, puromycin (2μg/ml) was added into culture cells. Knockdown and overexpression efficiency was confirmed by western blot. The shRNA target sequences employed in this study are listed as below: shABCC6#1: GTGGCCGAGAATGCTATGAAT; shABCC6#2: CGTAGATGAAAGCCAGAGGAT.
Tissue Microarray Immunohistochemistry Analysis
Two tissue microarrays with definite HCC diagnosis were constructed in this study. All HCC samples were first reviewer histologically by hematoxylin and eosin staining to identify the border between Tumor and paratumor. Then, representative areas were punched out and mounted onto a recipient block with a semi-automated TMArrayer. Immunohistochemistry assays using tissue microarray were performed according to standard protocol. Briefly, paraffin-embedded tissue microarray slides were deparaffinized and rehydrated for 30 min. Antigen retrieval was done by incubating the slides in citrate buffer (pH 6.0) by boiling for 10 min in the microwave oven. After fully cooled down, the slides were incubated with ABCC6 antibody (Proteintech, 27848-1-AP) overnight at 4°C. After washing three times with PBST, the slides were incubated with HRP-conjugated secondary antibody (Proteintech, SA00001-2). Signals were developed in DAB detection solution (Beyotime, p0203) under microscopic observation and counterstained with hematoxylin. After staining, photographs were captured using Leica microscope. The Image-Pro Plus v6.0 software was used to calculate the integrated optical density (IOD) of each photograph, and the ratio of IOD to total tissue area was calculated as staining intensity.
CCK-8, Colony Formation, and EdU (5-Ethynyl-2’-Deoxyuridine) Incorporation Assays
For CCK-8 assay, HCC cell lines were infected with indicated lentivirus and selected for 1 week to generate stable knockdown or overexpression cells. Then, the cells were seeded into 96-well plates at a density of 3 × 10³ cells per well and incubated at 37°C. Every 24 hours, 10% (V/V) CCK-8 (Dojindo, CK04-11) was added to the culture medium and incubated for one hour. Cell viability was measured at OD 450 nm using a SpectraMax i3 microplage reader (Molecular Devices, USA).
Colony formation assay were performed to evaluate the long-term proliferation ability. HCC cell lines were seeded into 60mm dishes at a density of 3 × 10³ cells per well and cultured for 14 days. The medium was changed twice a week. Cells were washed gently with PBS and fixed in 4% formaldehyde for 20 minutes followed by staining with 0.1% (w/v) crystal violet. The cell culture plates were scanned to obtain digital images, and the colonies were counted under microscope.
The EdU (5-Ethynyl-2’-Deoxyuridine) incorporation assay was performed using BeyoClick™ EdU Cell Proliferation Kit (Beyotime, C0078S) according to the manufacturer’s instructions to further validate cell proliferation ability. Briefly, 1×10⁵ cells were planted in 24-well plates with coverslips 24 hours before experiments. Then, 50 mM EdU labeling medium was added into each well and incubated for 2h at 37°C. The cells were fixed using 4% paraformaldehyde for 20 min and treated with 0.5% Triton X-100 for 10 min at room temperature. Then, the cells were stained with Click Reaction mix for 30 min, and the nuclei were stained using DAPI. Proliferation rate was determined by quantifying the percentage of EdU+ cells using fluorescence microscope.
Transwell-Migration Assay
8μm transwell inserts (Falcon, USA) were used to measure the migratory of cells. Briefly, 5×10⁴ HCC cells in 200 μl of DMEM were placed into the upper chamber, 500 μl DMEM medium containing 10% FBS was added to the lower chambers. After 48 h, the non-migrated cells on the top side were wiped carefully and the inserts were fixed in 5% formaldehyde solution for 10 min. After that, each inset was stained with 0.1% crystal violet for 10 min, then washed with PBS for three times. Three random microscopic fields were captured and cells were counted for each group.
Cell Apoptosis and Cell Cycle Assay
Stable 97H and Huh7 cells were seeded into 6-well plates at a density of 5× 10⁵ cells per well 24 hours before the apoptosis assay. After treating with 20 μM cisplatin (Selleck Chemicals, S1166) for 24 hours, cells were harvested by trypsinization, washed twice with PBS, stained with APC-Annexin V and PI following the manufacturers’ instructions (MultiSciences, 70-AP107-100). Flow cytometry was performed using Beckman CytoFLEX and the results were analyzed with FlowJo software.
For cell cycle analysis, cells were harvested and fixed in cold 70% ethanol overnight at 4°C. Cells were then stained with PI staining solution (Sangon Biotech, E607306) for 15min, followed by washing with PBS twice. Flow cytometry was performed using Beckman CytoFLEX and the results were analyzed with FlowJo software.
Intracellular ROS Assay
The intracellular ROS level was detected by CellROX™ Cytometry Assay Kit (Thermo Fisher, C10493). Briefly, cells were harvested and stained with 500 nM CellRox reagent for 60 min at 37°C. After washing the cells once with PBS, immediately analyzed the samples by Beckman CytoFLEX. The results were analyzed with FlowJo software.
Seahorse XF Cell Energy Phenotype Assay
Cellular energy phenotypes and metabolic switching was measured by Seahorse XFe96 Analyzer (Agilent, USA) with Seahorse XF Cell Energy Phenotype Test Kit (Agilent, 103325-100). In brief, 0.5-1 × 10⁵ cells were seeded in 96-well Seahorse plates with XF RPMI medium supplemented with 2 mM glutamine, 10 mM glucose, 1mM pyruvate, and 5 mM HEPES, and then incubated in a CO2-free incubator for 1 hour prior to the assay. For assessment of energy phenotypes, 100 μM oligomycin and FCCP were used according to the manufacturer’s instructions.
β-Galactosidase Staining
The β-galactosidase staining was performed using Senescence β-Galactosidase Staining Kit (Beyotime, C0602) according to the manufacturer’s instructions. Briefly, 5×10⁵ cells were planted in 6-well plates with coverslips 24 hours before experiments. The cells were fixed using 4% paraformaldehyde for 20 min and then stained with working solution at 37°C overnight. The second day, cells were washed with PBS for three times and observed under microscope. Senescence rate was determined by quantifying the percentage of positive cells.
ATP and Malondialdehyde (MDA) Assay
To measure the intracellular ATP level, we utilized the CellTiter-Glo Cell Viability Assay (Premega, G9241). Control and stable ABCC6 knockdown HCC cells were seeded into 96-well plates at a density of 1 × 10⁴ cells per well and incubated at 37°C. The second day, added 100μl CellTiter-Glo reagent to the medium in each well, mixed the contents for 2 minutes and incubated at room temperature for 10 minutes. The luminescent signals were measured using a SpectraMax i3 microplage reader (Molecular Devices, USA).
To evaluate lipid peroxidation, we utilized the MDA assay (Beyotime, S0131S). Control and stable ABCC6 knockdown HCC cells were seeded into 6-well plates at a density of 1 × 10⁶ cells per well and incubated at 37°C. Cells were lysed using Western lysis buffer, and the protein concentration was measured using a BCA protein Assay kit (Thermo Fisher). MDA assay was performed according to the manufacturer’s instructions. Signal was measured at OD 532 nm using a SpectraMax i3 microplage reader (Molecular Devices, USA). Relative MDA level was normalized by the protein concentration of each sample.
In Vivo Tumor Growth Assays
NSG (NOD-scid IL2Rgammanull) mice were purchased from Shanghai Model Organisms Ltd. and bred at the specific-pathogen-free core facilities in Renji Hospital. All mice were housed on a 12 hours-12 hours light-dark cycle. 5×10⁶ shNS and shABCC6 97H cells were injected subcutaneously into 6-weeks-old NSG mice (n=4 per group). Tumors were measured using a caliper and the tumor volume was calculated as (width × width × length/2). Mice were euthanized when they met the institutional euthanasia criteria for tumor size. At the end-point, tumors were collected and weighted. Animal experimental protocols were approved by the Institutional Animal Care and Use Committee of Renji Hospital, Shanghai Jiao Tong University School of Medicine.
Western Blot
Total protein was extracted using RIPA Lysis Buffer (Thermo Fisher) according to the manufacturer’s instructions. The protein concentration was measured using a BCA protein Assay kit (Thermo Fisher). Equal amounts of proteins were separated by 8-10% SDS-PAGE gel and then transferred onto polyvinylidene fluoride membranes. Chemiluminescence signaling was detected by ECL Western Blotting Substrate (Vazyme, E412-01). Antibodies used for western blot were listed below: ABCC6 (Proteintech, 27848-1-AP), β-actin (Cell Signaling Technology, 3700S), PPARα (Novus, NB300-57), Cyclin D1 (Cell Signaling Technology, 2978S), ACOX1 (Proteintech, 10957-1-AP).
Real-Time Quantitative PCR
Total RNA was extracted from cell liens using Trizol (Thermo Fisher) according to the manufacturer’s instructions. RNA concentration was measured using Thermo Scientific Nanodrop Spectrophotometer. 0.8-1 µg total RNA was subjected to reverse transcription using HiScript III 1st Strand cDNA Synthesis Kit (Vazyme, R312-01) according to the manufacturer’s instructions. The Quantitative real-time PCR (qRT-PCR) was conducted using ChamQ SYBR Color qPCR Master Mix (Vazyme, Q441-02) in the Bio-Rad Real-Time PCR system. Gene expression levels were normalized to the expression of GAPDH or ACTB. Primers used for qRT-PCR were listed below: ABCC6-F: AGATGGTGCTTGGATTCGCC, ABCC6-R: GCCACACAGTAGGATGAATGAG; ABCA6-F: AAACAGAAAAGCGTGTATCAGCA, ABCA6-R: GAGGAGCCATTCCAGGAAACT; ABCG5-F: TGGACCAGGCAGATCCTCAAA, ABCG5-R: CCGTTCACATACACCTCCCC; PPARA-F: TTCGCAATCCATCGGCGAG, PPARA-R: CCACAGGATAAGTCACCGAGG; ACOX1-F: GGAACTCACCTTCGAGGCTTG, ACOX1-R: TTCCCCTTAGTGATGAGCTGG; CCND1-F: GCTGCGAAGTGGAAACCATC, CCND1-R: CCTCCTTCTGCACACATTTGAA; GAPDH-F: GGAGCGAGATCCCTCCAAAAT, GAPDH-R: GGCTGTTGTCATACTTCTCATGG.
RNA-Seq
Total RNA was isolated from shNS and shABCC6 97H cells using Trizol (Thermo Fisher) according to the manufacturer’s instructions. rRNA was subsequently depleted from total RNA using NEBNext rRNA depletion kit (New England BioLabs). After that, NEBNext Ultra Directional RNA Library Prep Kit (New England BioLabs) was used for library preparation. RNA sequencing was performed by Annorad Ltd. using Novaseq 6000 platform. GO and KEGG analysis were performed using David Bioinformatics Resources 6.8 (https://david.ncifcrf.gov/). Gene set enrichment analysis (GSEA) was carried out using GSEA software v2.0.
Statistical Analysis
Data are presented as mean ± standard error of the mean (SEM). Statistical comparisons were performed by using two-tailed t-tests, one-way ANOVA or Kaplan-Meier analysis. P values less than 0.05 were considered statistically significant. NS, not significant. All statistical analyses were carried out using R (Version 4.0.1) or Graphpad Prism 8 (GraphPad Software).
Results
ABC Transporter Family Gene Expression and Behavior in HCC
To evaluate the role of ABC family genes in HCC, we first analyzed two public HCC datasets; the Cancer Genome Atlas (TCGA) and the GSE14520 (with the largest number of HCC patients and detailed clinical information) datasets. By comparing the expression levels of ABC family genes in HCC tumors and paratumors, we found that approximately 1/3 of the ABC genes were significantly upregulated, and 1/3 were downregulated (Figure 1A). After incorporating the clinical prognosis information into analysis, it was noted that some ABC family genes correlated with overall survival or progression-free survival of patients HCC. However, only ABCA6, ABCB11, ABCC6, and ABCG5 showed consistent results in both TCGA and GSE14520 datasets (Tables 1, 2). Notably, high ABCA6, ABCB11, ABCC6, and ABCG5 expression levels were correlated with favorable overall survival (Figures 1B, C). Additionally, bioinformatics analyses also showed that the mRNA levels of these genes were attenuated in tumors comparing with those in paratumor tissues (Figures 1D, E). Furthermore, expression levels of these genes gradually decreased as TNM staging advanced in both TCGA and GSE14520 datasets (Figures 1F, G). Similarly, we also found that their expression levels decreased with advanced HCC histological staging in the TCGA dataset (Figure 2A). Collectively, our data suggest that among all ABC family genes, ABCA6, ABCB11, ABCC6, and ABCG5 might serve as potential tumor suppressor genes in HCC.
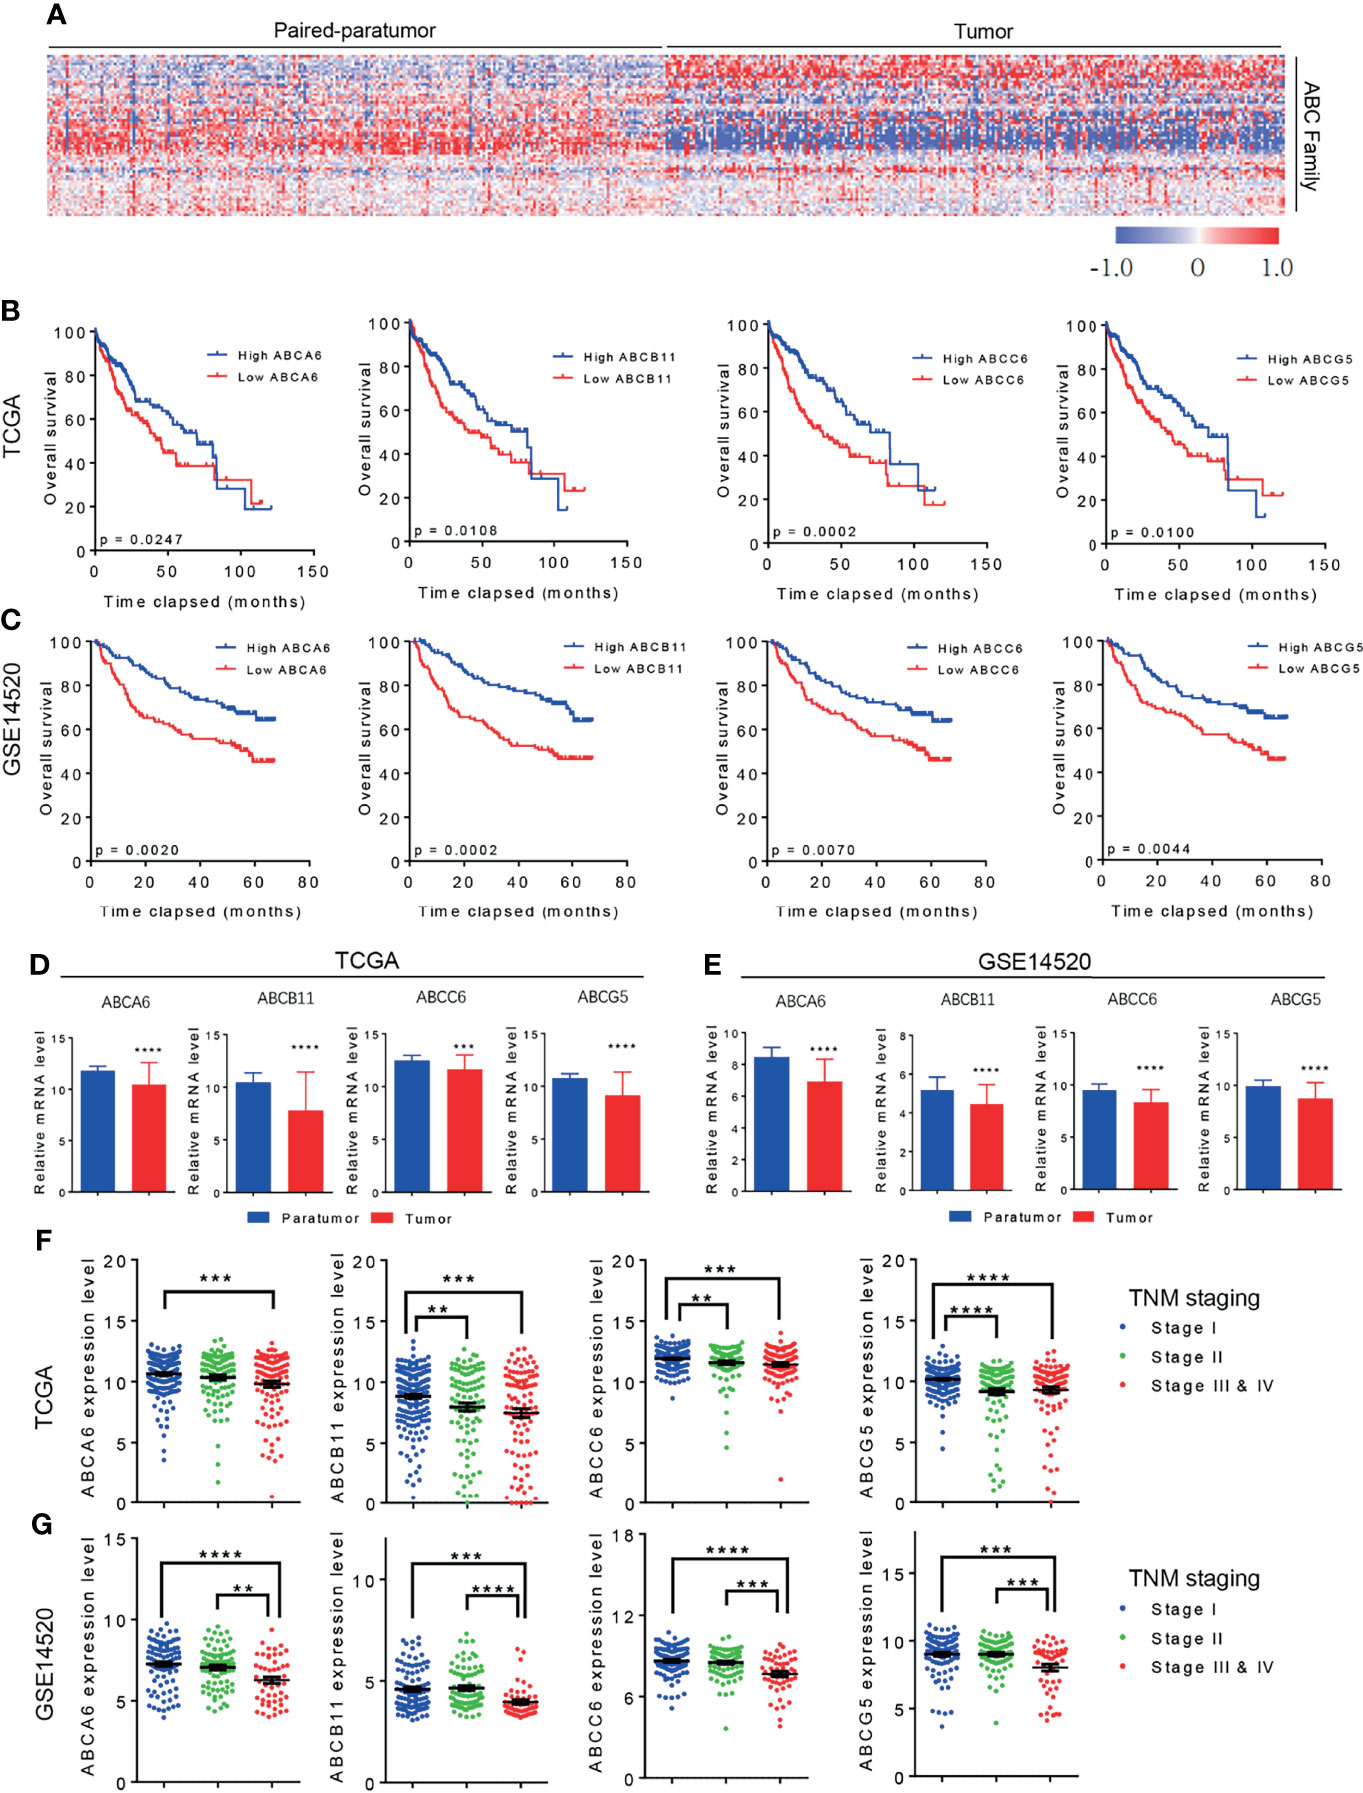
Figure 1 The Role of ABC transporter family genes in HCC. (A) Heat map showing the differential expression of ABC transporter family genes in TCGA dataset. (B) Kaplan-Meier analysis showing the overall survival of patients with HCC in correlation with high or low ABC family genes level. Data was derived from TCGA dataset. (C) Kaplan-Meier analysis showing the overall survival of HCC patients in correlation with high or low ABC family genes level. Data was derived from GSE14520 dataset. (D) TCGA dataset showing the differential expression of ABC family genes in HCC paratumor tissues and tumor tissues. (E) GSE14520 dataset showing the differential expression of ABC family genes in HCC paratumor tissues and tumor tissues. (F) TCGA database showing the expression level of ABC family genes with advanced HCC TNM staging. (G) GSE14520 dataset showing the expression level of ABC family genes with advanced HCC TNM staging. Error bars indicate means ± SEM. P-values were determined by two tailed t-test (D, E), one-way ANOVA (F, G) and Kaplan-Meier analysis (B, C). **P < 0.01, ***P < 0.001, ****P < 0.0001.
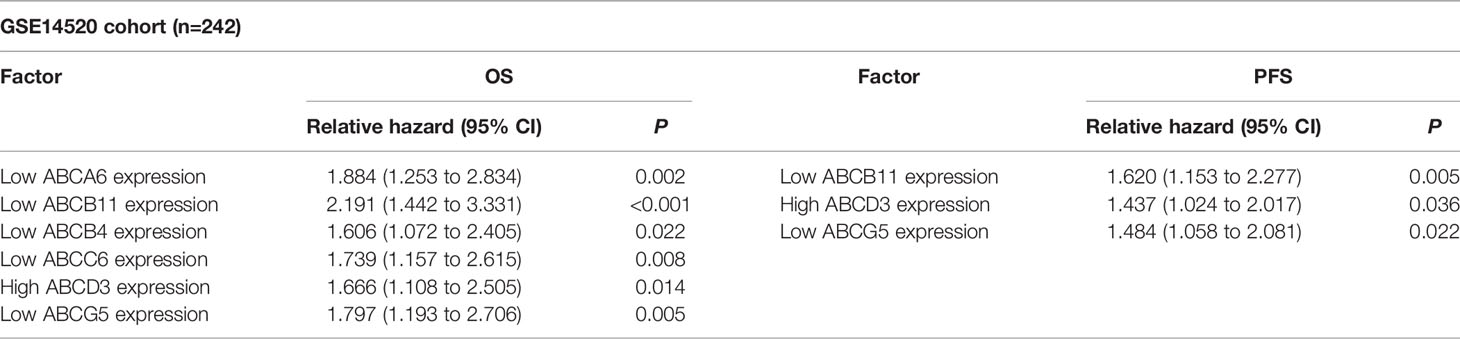
Table 1 Cox regression analysis of ABC family genes in GSE14520 cohort.

Table 2 Cox regression analysis of ABC family genes in TCGA cohort.
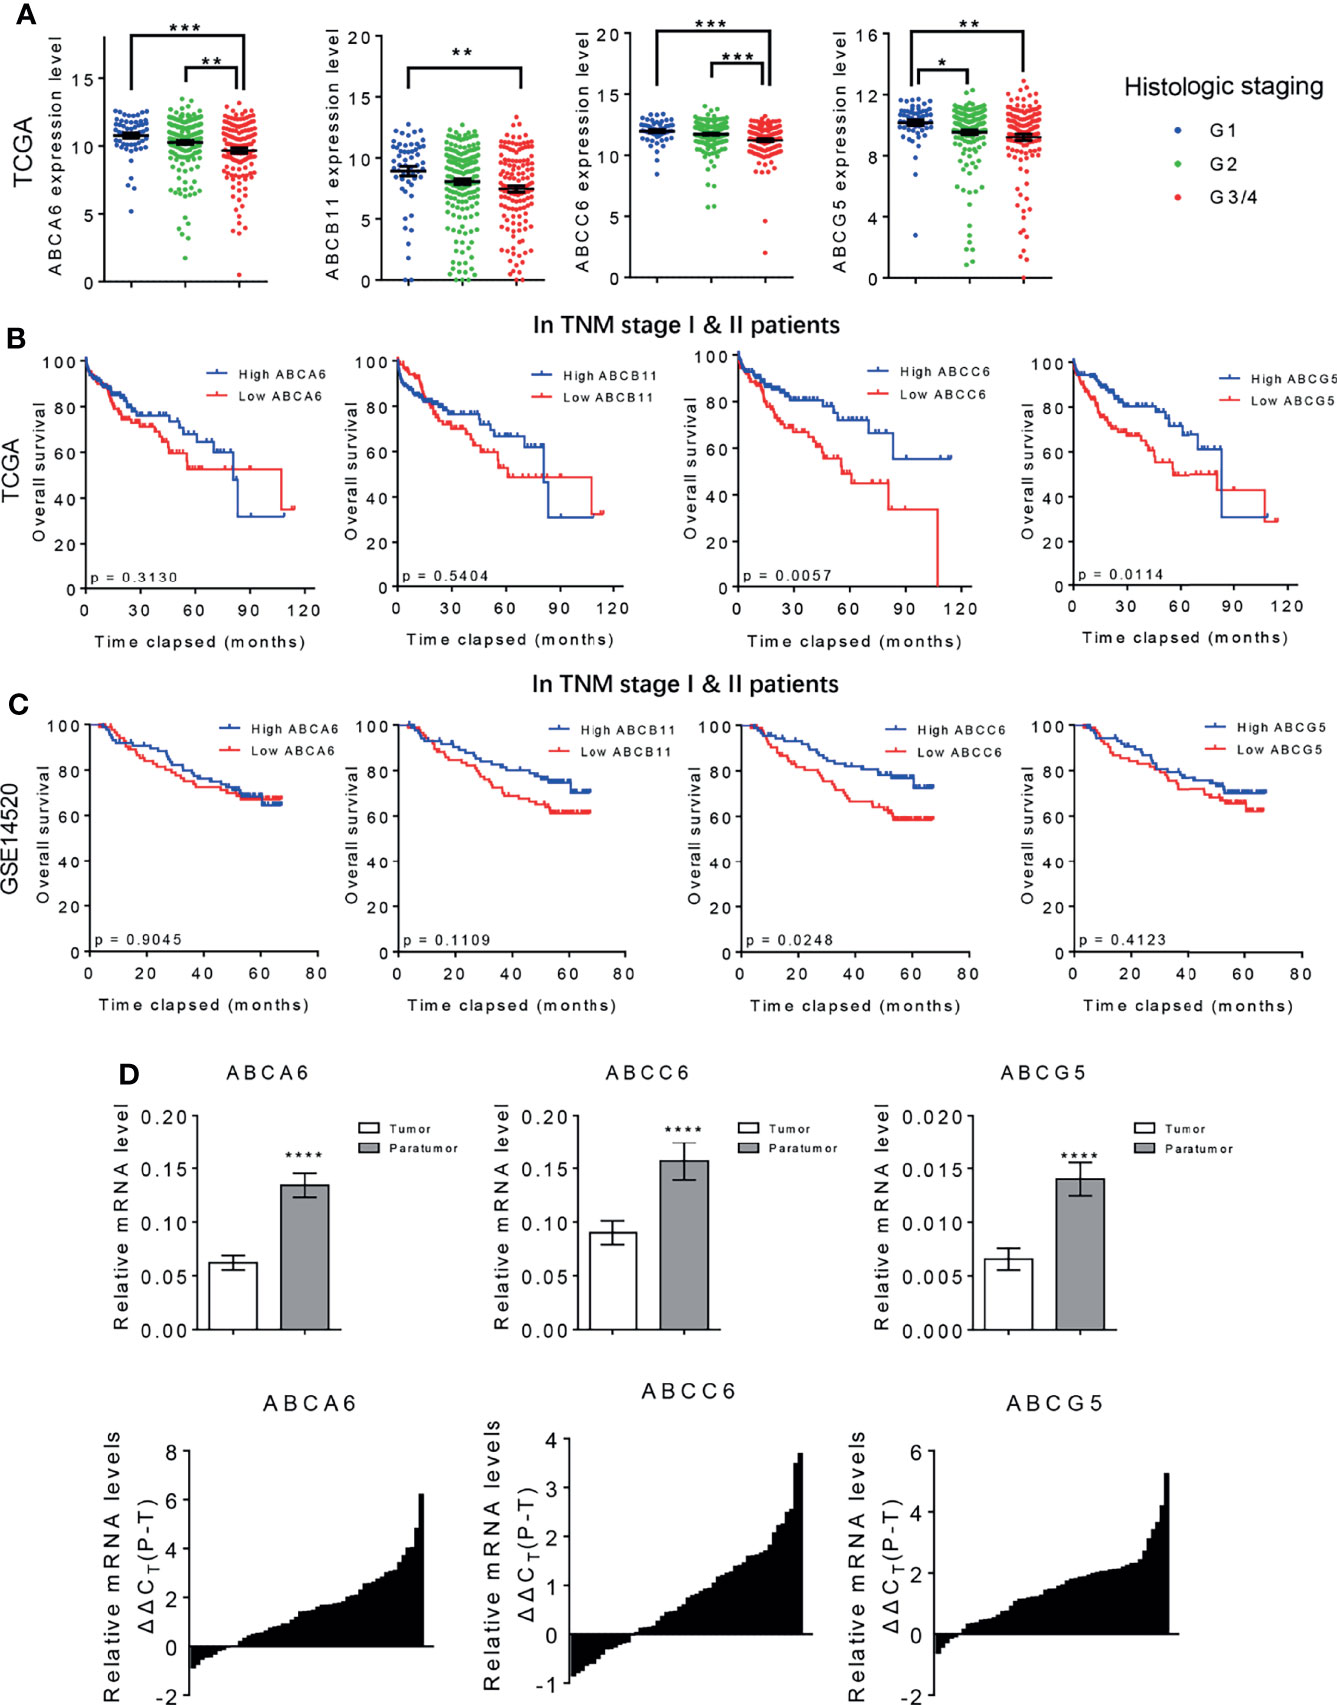
Figure 2 ABCA6, ABCC6, and ABCG5 might serve as tumor suppressor genes in HCC. (A) TCGA database showing the expression level of ABC family genes in different HCC histologic staging. (B) Kaplan-Meier analysis showing the overall survival of early stage HCC patients (TNM I & II) with high or low ABC family genes level. Data was derived from TCGA database. (C) Kaplan-Meier analysis showing the overall survival of early stage HCC patients (TNM I & II) with high or low ABC family genes level. Data was derived from GSE14520 dataset. (D) qPCR analysis validating the differential expression of ABCA6, ABCC6 and ABCG5 in 50 pairs of early-stage HCC tumor and paratumor tissues. Error bars indicate means ± SEM. P-values were determined by two tailed t-test (D), one-way ANOVA (A) and Kaplan-Meier analysis (B, C). *P < 0.05, **P < 0.01, ***P < 0.001, ****P < 0.0001.
Identification of ABCC6 as a Biomarker for Early-Stage HCC
It is well-established that overall survival rates are significantly higher in patients with HCC that are diagnosed at an early-stage and receive immediate treatment (21). However, because early-stage HCC does not present significant symptoms, delayed diagnosis and treatment are common and likely contribute to poor cancer outcomes (22). To further assess the clinical value of ABCA6, ABCB11, ABCC6, and ABCG5 in patients with HCC, we re-analyzed the public datasets and focused on early-stage HCC (TNM stage I & II). Interestingly, Kaplan-Meier analyses showed that ABCC6 positively correlates with overall survival in TNM stage I and II HCC patients in both datasets, suggesting that ABCC6 displays significant prognostic value in early-stage HCC. In contrast, ABCA6, ABCB11, and ABCG5 did not display consistent prognostic value in early-stage HCC (Figures 2B, C).
Furthermore, we measured the expression of ABCA6, ABCC6, and ABCG5 in 50 pairs of early-stage tumor tissues and paratumor tissues using quantitative reverse transcription polymerase chain reaction (qRT-PCR). Consistent with our bioinformatic analysis, this assessment also showed significantly lower ABCC6 expression in tumor tissues than in paratumor tissues (Figure 2D), suggesting that ABCC6 might be a potential diagnostic marker in HCC.
Evaluating the Clinical Effects of ABCC6 Expression in Patients With HCC
Our previous studies have identified ABCA6, ABCC6 and ABCG5 as potential tumor-suppressor genes in HCC. To further narrow down our candidate gene, we assessed the mRNA level of these genes in normal human tissues using the BioGPS database (http://biogps.org). Only ABCC6 was found to be specifically expressed in normal liver tissue (Figure 3A), highlighting its importance in liver homeostasis. Moreover, western blotting assays confirmed lower ABCC6 expression in tumor tissue than in paratumor tissues (Figure 3B). Accordingly, we focused on the function of ABCC6 in the development and progression of HCC.
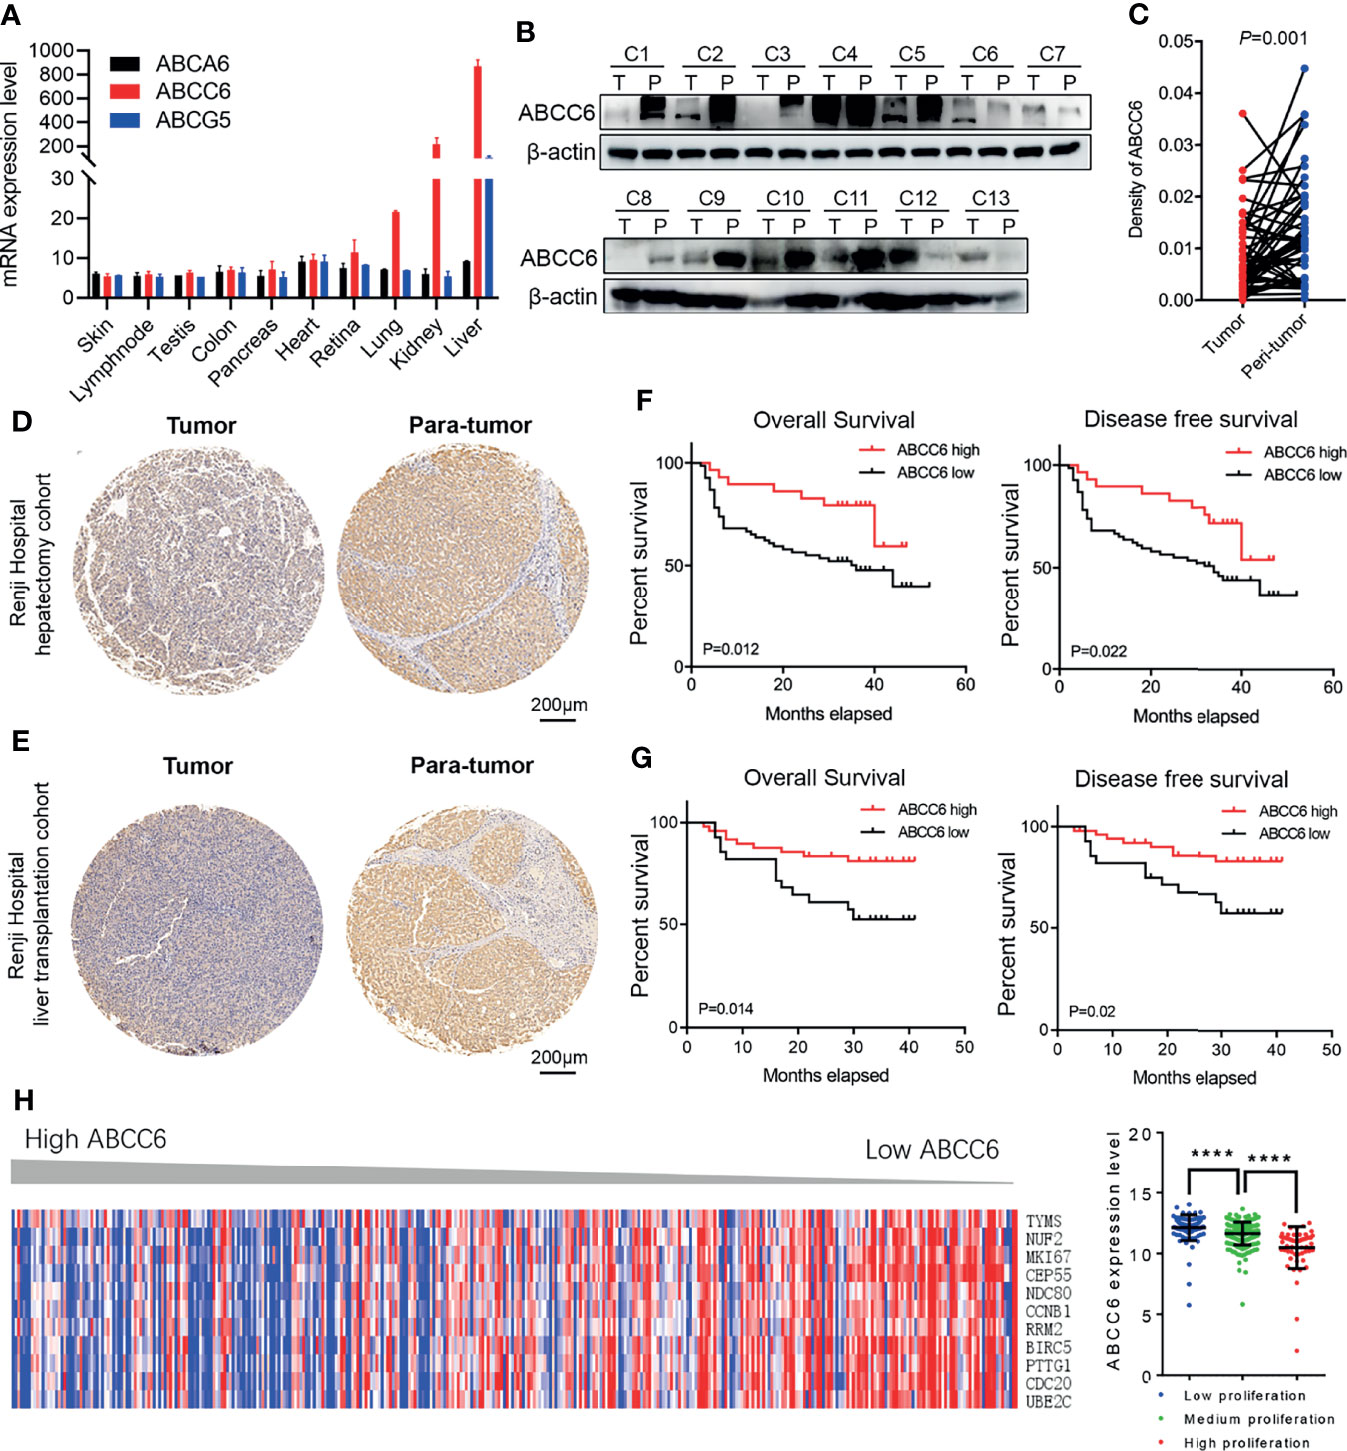
Figure 3 The clinical outcomes of ABCC6 in patients with HCC. (A) BioGPS database showing the mRNA expression level of ABCA6, ABCC6, and ABCG5 in different normal human tissues. (B) Western blotting displaying ABCC6 protein levels in 13 pairs of HCC tumor and paratumor tissues. (C) Statistical analysis showing the differential protein level of ABCC6 in Renji Hospital hepatectomy HCC tissue array. (D) Representative IHC figure showing the ABCC6 protein level in Renji Hospital hepatectomy HCC tissue array. (E) Representative IHC figure showing the ABCC6 protein level in Renji Hospital liver transplantation HCC tissue array. (F) Kaplan-Meier analysis showing the overall survival and disease-free survival of HCC patients in correlation with high or low ABCC6 levels in Renji Hospital hepatectomy cohort. (G) Kaplan-Meier analysis showing the overall survival and disease-free survival of HCC patients in correlation with high or low ABCC6 levels in Renji Hospital liver transplantation cohort. (H) Heatmap and histogram showing the expression of proliferation-related genes in correlation with different ABCC6 expression level. Data was derived from TCGA dataset. Error bars indicate means ± SEM. P-values were determined by two tailed t-test (C), one-way ANOVA (H) and Kaplan-Meier analysis (F, G). ****P < 0.0001.
To further validate our bioinformatic data, we employed two independent HCC cohorts. Cohort 1 (hepatectomy cohort) included 153 individuals who were hospitalized between 2010 and 2015 who underwent liver resection surgery at the Department of Liver Surgery, Renji Hospital, Shanghai Jiao Tong University School of Medicine. Cohort 2 (liver transplantation cohort) included 70 individuals who underwent liver transplantation between 2015 and 2016 at the Department of Liver Surgery, Renji Hospital, Shanghai Jiao Tong University School of Medicine. To evaluate the association between ABCC6 expression and clinicopathological features of HCC, we used immunohistochemistry to detect ABCC6 expression in tissue microarrays of patients from both cohorts. Consistently, ABCC6 was significantly downregulated in tumor tissues compared to paratumor tissues (Figures 3C–E). We divided all cases into high and low ABCC6 groups according to the immunohistochemistry expression level, and noticed that patients with high ABCC6 expression displayed increased overall survival and disease-free survival (Figures 3F, G), which is consistent with the TCGA and GSE14520 bioinformatic results. Multivariate Cox regression analysis of clinical prognostic information demonstrated that downregulated ABCC6 was not only an independent prognostic marker, but also correlated with some malignant and aggressive clinicopathological features, such as high AFP values and large tumor size (Table 3). Furthermore, we interrogated the TCGA database and analyzed the relationship between ABCC6 expression and several proliferation markers (e.g., MKI67, CCNB1, RRM2, and CDC20). A negative correlation was observed between expression of ABCC6 and these proliferation markers (Figure 3H). Collectively, our data suggest that ABCC6 is downregulated in HCC tumor tissues and correlates with favorable outcomes in patients with HCC.
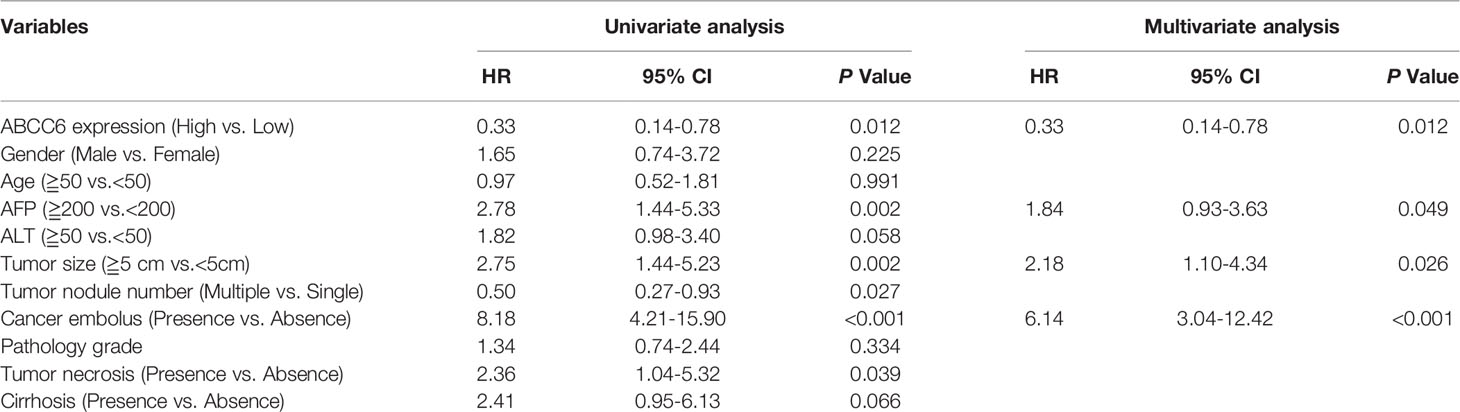
Table 3 Cox regression analysis of risk factors associated with overall survival in Renji Hospital hepatectomy cohort.
ABCC6 Knockdown Promotes HCC Proliferation In Vitro and In Vivo
Next, we investigated the effect of ABCC6 on the biological function of HCC cell lines in vitro. ABCC6 expression and protein levels were first examined in five commercial available HCC cell lines (MHCC97H, MHCC97L, SMMC7721, Huh7, and HCC-LM3) and one normal human hepatic cell line (L-02). Enhanced ABCC6 levels were observed in MHCC97H, MHCC97L, and Huh7 cells, while lower ABCC6 levels were observed in SMMC7721 and HCC-LM3 cells. All HCC cell lines displayed lower ABCC6 protein levels than normal hepatic cell line (Figures 4A, B). Furthermore, different HCC cell lines were chosen for loss- or gain-of-function studies based on their endogenous ABCC6 levels. ABCC6 knockdown (using two short hairpin RNAs) or overexpression efficiency was confirmed by western blotting (Figures 4C, D). CCK-8 assay, colony formation assay and EdU (5-Ethynyl-2’-Deoxyuridine) incorporation assays all showed significantly enhanced proliferation ability in HCC cells with ABCC6 knockdown (Figures 4E–G), and the proliferation ability was decreased after ABCC6 overexpression (Figures 4H–J). Taken together, these data suggest that ABCC6 plays a tumor-suppressive role by inhibiting HCC proliferation in vitro.
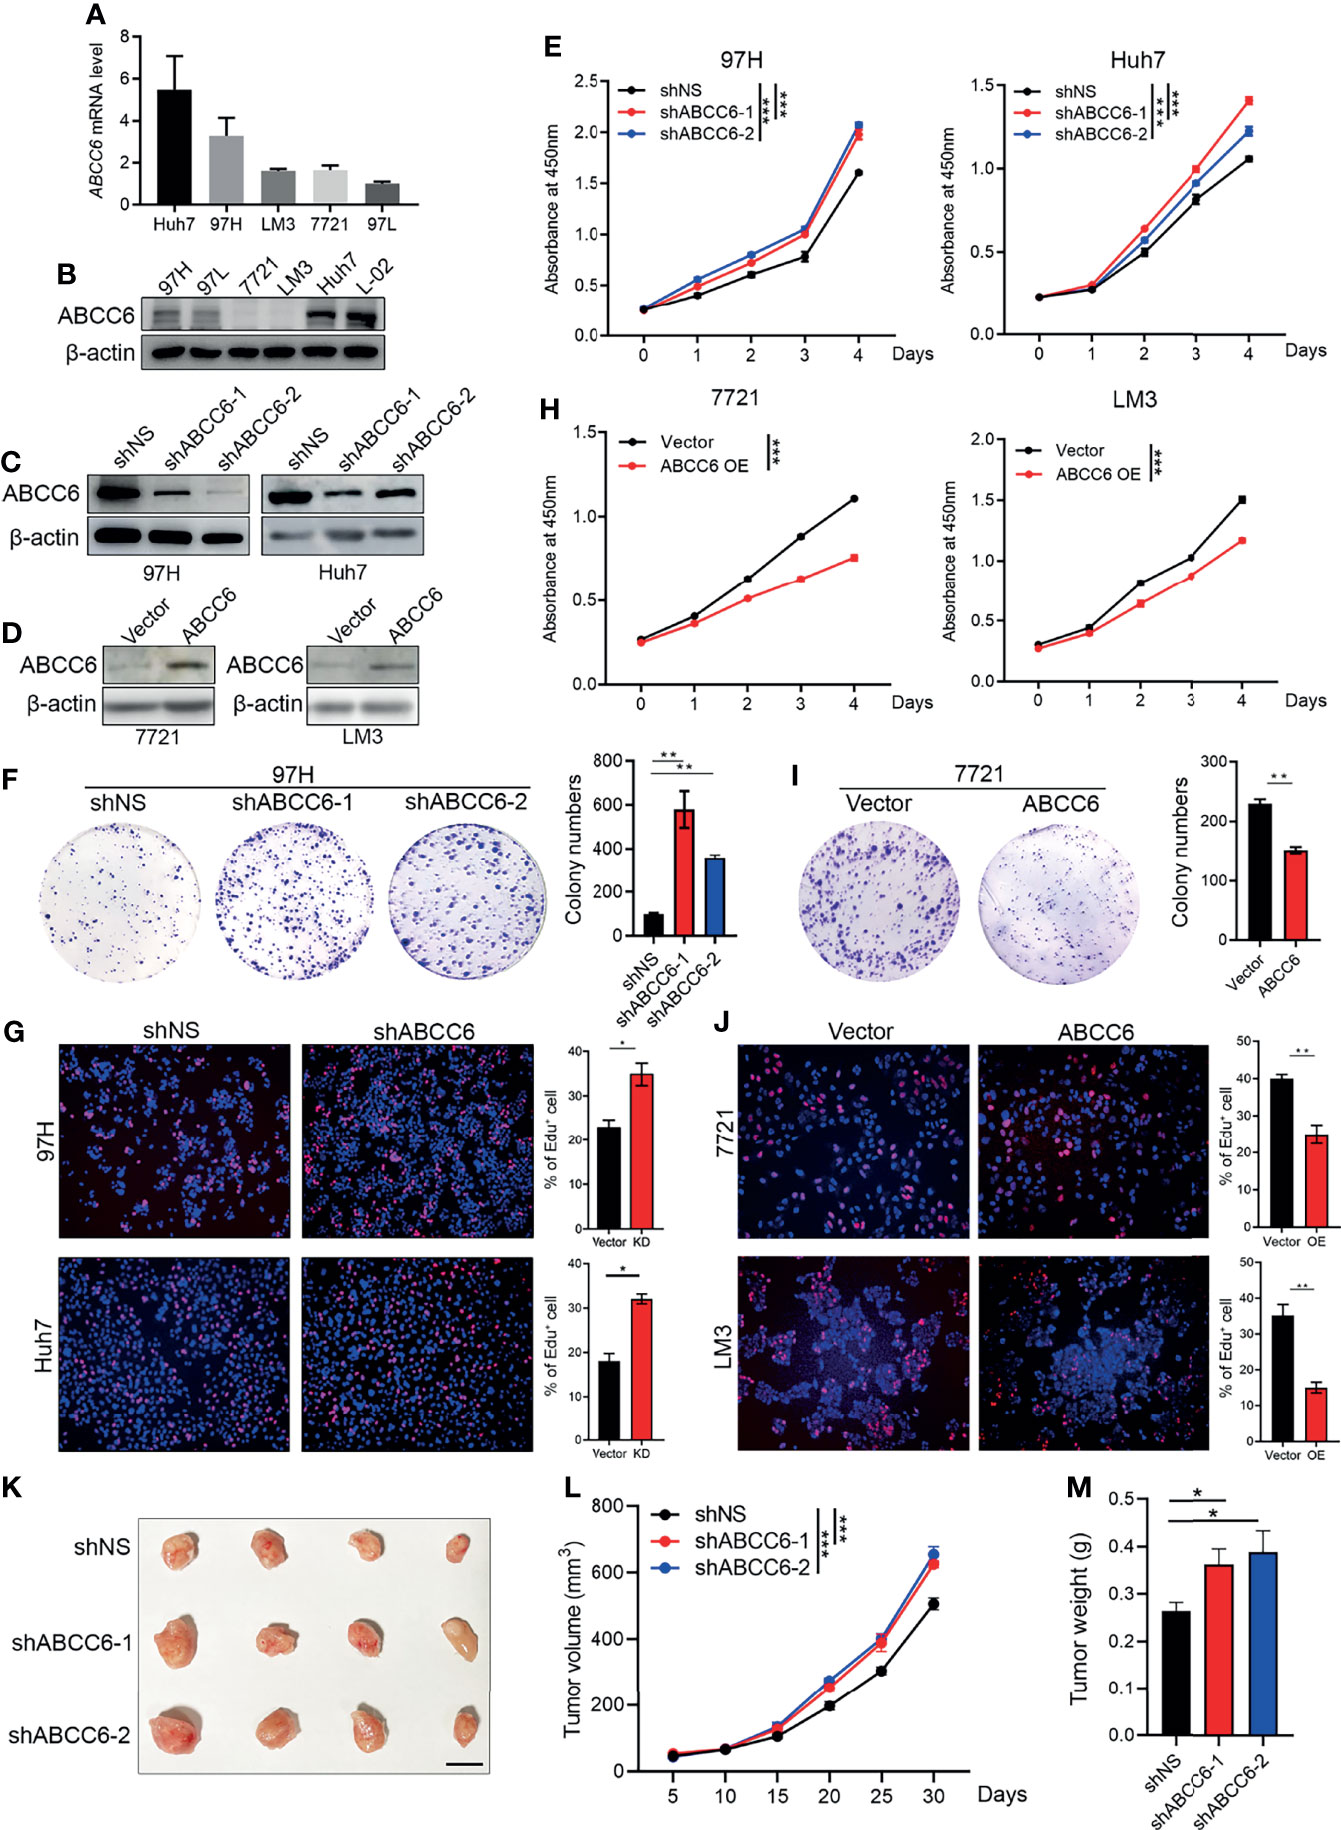
Figure 4 ABCC6 knockdown promotes HCC cell lines proliferation in vitro and in vivo. (A) qPCR analysis showing ABCC6 mRNA expression level in different HCC cell lines. (B) Western blot displaying ABCC6 protein level in different HCC cell lines as well as one normal human hepatic cell line (L-02). (C) Western Blot validating the ABCC6 knockdown efficiency in 97H and Huh7 cell lines. (D) Western Blot validating the ABCC6 overexpression efficiency in 7721 and LM3 cell lines. (E) CCK-8 assay showing the cell proliferation of ABCC6 knockdown 97H and Huh7 cells. (F) Colony formation assay of ABCC6 knockdown 97H cells. (G) Edu incorporation assay showing the effect of ABCC6 knockdown on the cell proliferative ability of 97H and Huh7 cells. (H) CCK-8 assay showing the cell proliferation of ABCC6 overexpression 7721 and LM3 cells. (I) Colony formation assay of ABCC6 overexpression 7721 cells. (J) Edu incorporation assay showing the effect of ABCC6 overexpression on the cell proliferative ability of 7721 and LM3 cells. (K) Images showing the subcutaneous xenograft of ShNS, ShABCC6-1, and ShABCC6-2 97H cells. n=4; The scale bar indicates 1cm. (L) The growth curves of ShNS, ShABCC6-1, and ShABCC6-2 97H cells subcutaneously injected into NSG immunodeficient mice. (M) The weight of tumors collected from xenograft NSG mouse model implanted with ShNS, ShABCC6-1, and ShABCC6-2 97H cells. Error bars indicate means ± SEM. P-values were determined by two tailed t-test (E–J) and one-way ANOVA (L, M). *P < 0.05, **P < 0.01, ***P < 0.001.
We further examined the role of ABCC6 in HCC development and progression in vivo using an NSG (NOD-scid IL2Rgammanull) xenograft mouse model. The same number of control or ABCC6 knockdown MHCC97H cells was injected subcutaneously into the left flank of NSG mice. As expected, tumor size, tumor growth curve, and tumor weight were substantially augmented following ABCC6 knockdown (Figures 4K–M), indicating that ABCC6 depletion also facilitates tumor progression in vivo.
ABCC6 Knockdown Influences Cell Cycle and Cell Apoptosis
To further study the role of ABCC6 in tumor biology, we knocked down or overexpressed ABCC6 in HCC cells and evaluated their migration ability. The results showed that migrative ability was promoted by ABCC6 depletion and hindered by ABCC6 overexpression (Figure 5A). In addition, cell cycle analysis showed that ABCC6 knockdown significantly increased the percentage of cells in the G2/M phase and decreased the G0/G1 phase, suggesting that ABCC6 may regulate the cell cycle in cancer cells (Figures 5B, C). ABCC6 depletion also affected the proportion of β gal-positive cells in vitro (Figure 5D), revealing the possible role of ABCC6 in regulating cell senescence. Furthermore, ABCC6 knockdown significantly inhibited cisplatin-induced cell apoptosis in both 97H and Huh7 cells (Figures 5E, F), implying that ABCC6 depletion might contribute to HCC growth by ensuring apoptosis resistance.
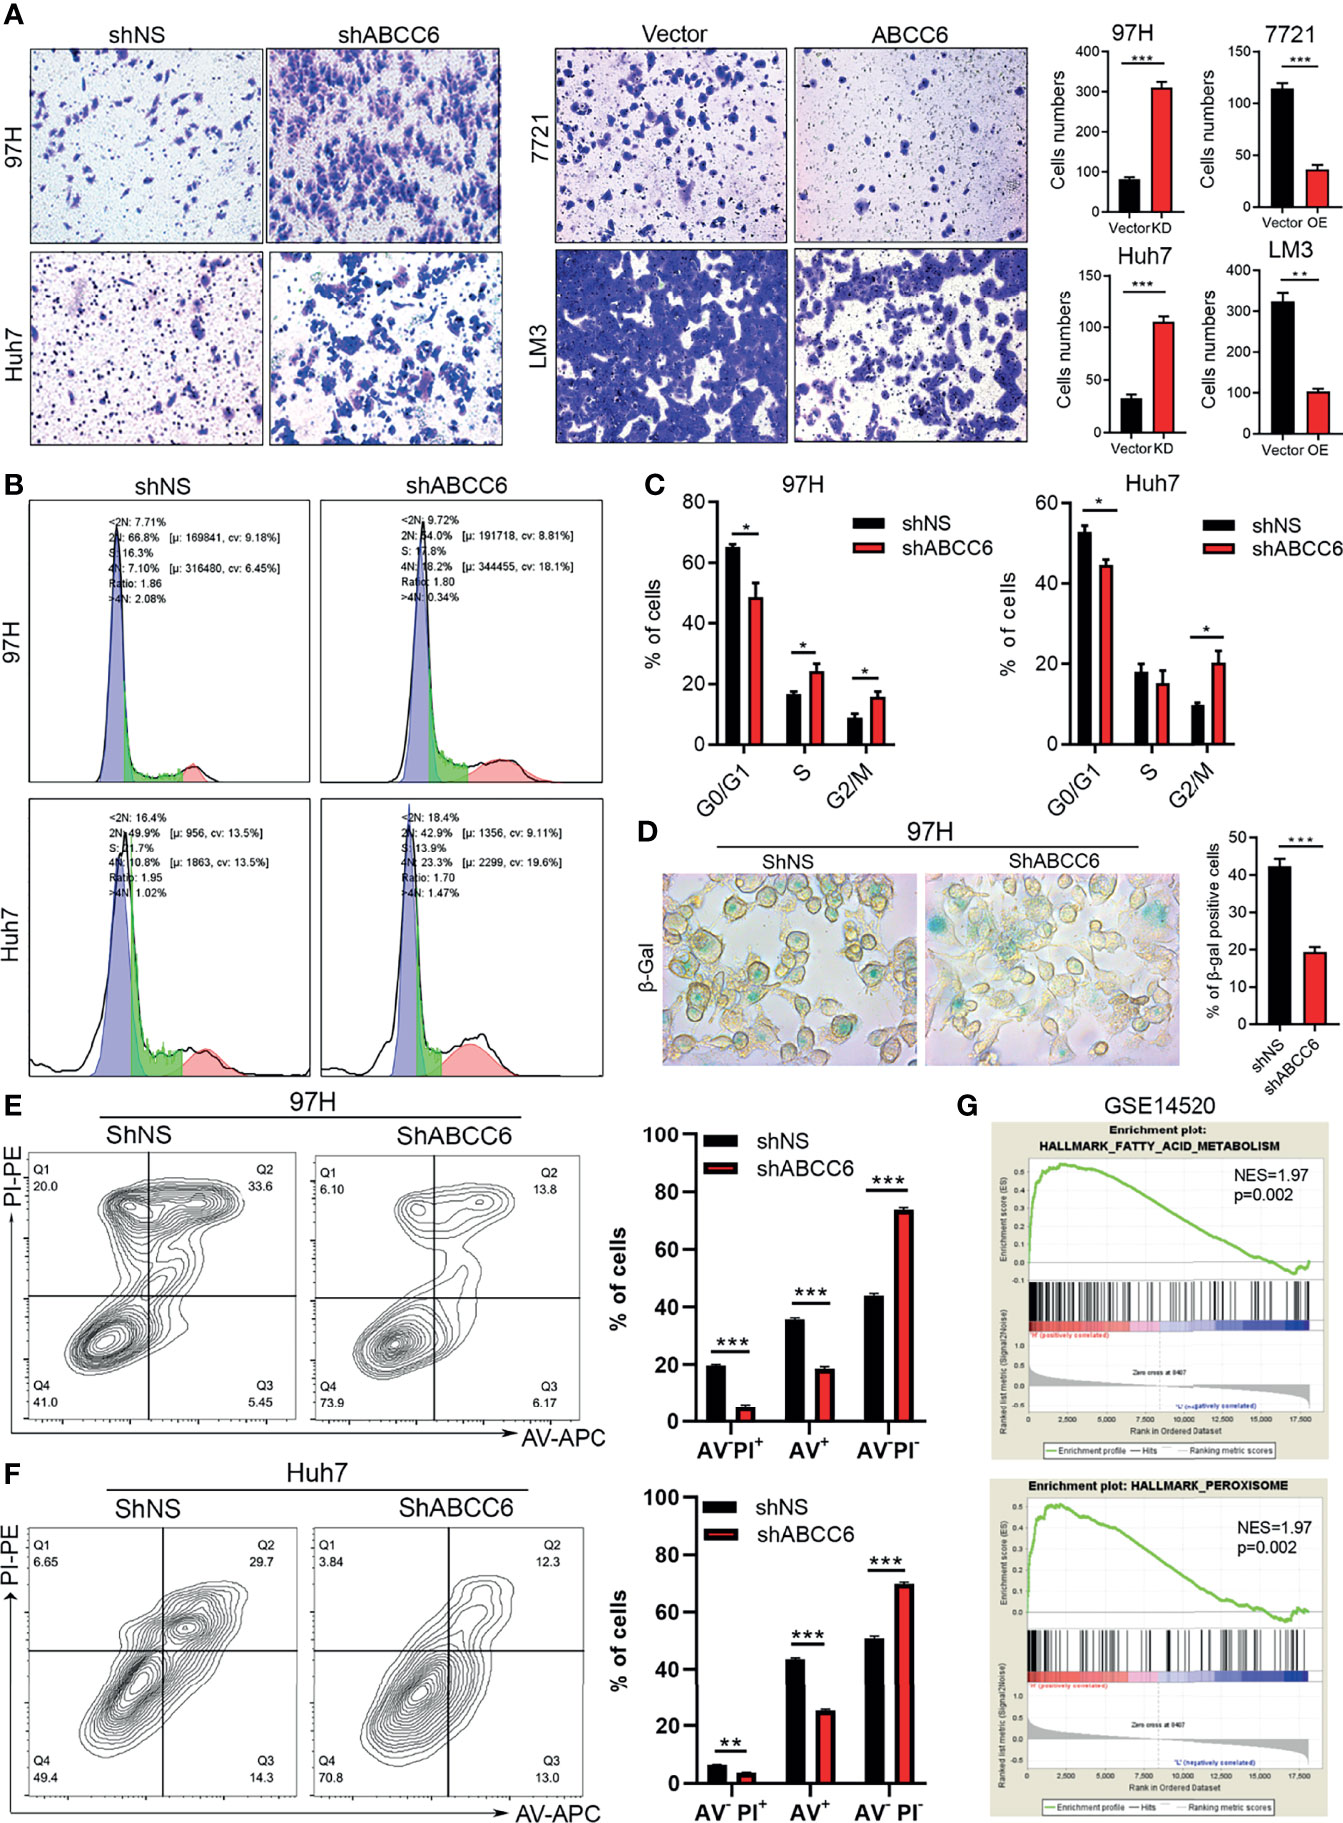
Figure 5 ABCC6 affect HCC cell lines migration, cell cycle arrest and apoptosis. (A) Transwell assay showing the effect of ABCC6 knockdown and overexpression in the migration ability of HCC cell lines. (B) The results of cell cycle analysis by flow cytometry in ABCC6 knockdown 97H and Huh7 cells. The blue peak and the red peak represents G0-G1, G2-M stage respectively. The middle is S stage. (C) Statistical analysis showing the effect of ABCC6 knockdown in the cell cycle of 97H and Huh7 cells. (D) β-galactosidase staining showing the senescence status of HCC cell lines after ABCC6 knockdown. (E) Flow cytometry analysis showing the effect of ABCC6 knockdown on the apoptosis of 97H cells treating with 20 μM cisplatin for 24 hours. (F) Flow cytometry analysis showing the effect of ABCC6 knockdown on the apoptosis of Huh7 cells treating with 20 μM cisplatin for 24 hours. (G) GSEA analysis showing the enrichment pathway of ABCC6 high samples in GSE14520 dataset. Error bars indicate means ± SEM. P-values were determined by two tailed t-test (A, C–F). *P < 0.05, **P < 0.01, ***P < 0.001.
We then performed gene set enrichment analysis (GSEA) using GSE14520 sequence data. Notably, the “fatty acid metabolism” and “peroxisome” pathways were highly active in samples with high expression of ABCC6 (Figure 5G). Furthermore, to evaluate the potential down-stream targets of ABC family genes, we analyzed the TCGA dataset and overlapped the co-expression gene (R>0.4 or <-0.4) of ABCC6, ABCA6, ABCB11, ABCG5. Thirteen genes were identified as co-expression genes through overlapping (Figure 6A). Intriguingly, CAT, PPARA, ACOX1, and ACOX2 are essential peroxisomal genes.
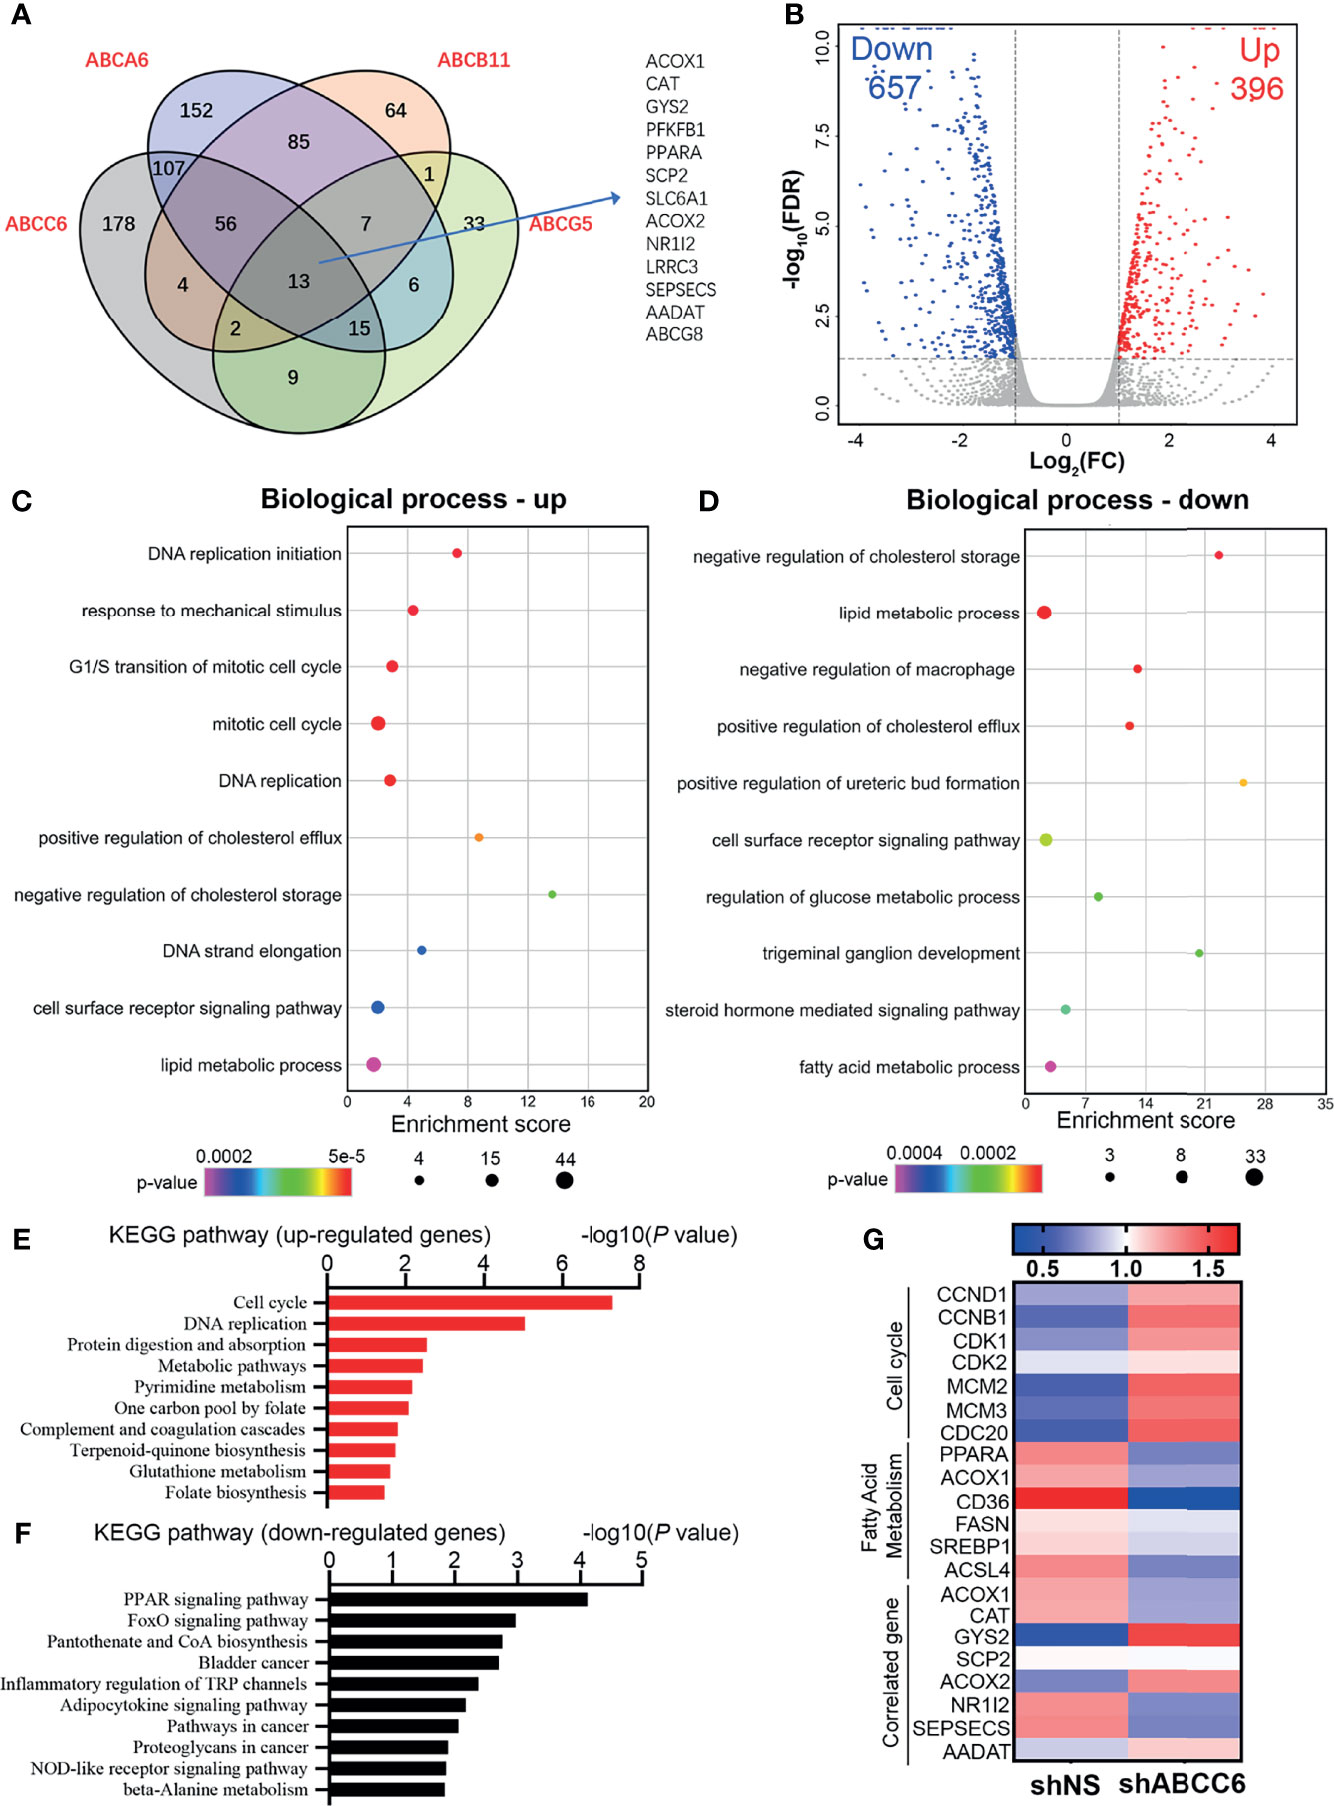
Figure 6 Transcriptome-wide analysis of ABCC6 knockdown 97H cells. (A) Venn diagram showing the overlap among positive correlation (R>0.4) genes of ABCA6, ABCB11, ABCC6 and ABCG5. Data was derived from TCGA database. (B) Volcano plot showing the up-regulated and down-regulated genes in ABCC6 knockdown 97H cells. Cut-off value: |log2(FC)|>1, P<0.05. (C) Gene Ontology (GO) enrichment analysis of up-regulated genes in ABCC6 knockdown 97H cells. (D) Gene Ontology (GO) enrichment analysis of down-regulated genes in ABCC6 knockdown 97H cells. (E) KEGG pathway analysis of up-regulated genes in ABCC6 knockdown 97H cells. (F) KEGG pathway analysis of down-regulated genes in ABCC6 knockdown 97H cells. (G) Heatmap showing the relative expression levels of cell cycle, fatty acid metabolism and ABCC6 correlated genes based on the RNA-seq results.
Transcriptome-Wide Analysis of ABCC6 in HCC Cells
Next, we sought to elucidate the mechanism by which ABCC6 regulates HCC cell proliferation. To comprehensively assess the effects of ABCC6 on HCC cells, we performed RNA-sequencing using control and ABCC6-knockdown MHCC97H cells. The volcano plot showed that 657 genes were downregulated while 396 genes were upregulated after ABCC6 depletion (|log2(FC)|>1, P<0.05) (Figure 6B and Supplementary Table 1). Gene Ontology (GO) analysis showed that “DNA replication” and “cell cycle” pathways were significantly enhanced as a result of ABCC6 knockdown, while lipid and fatty acid metabolism were significantly inhibited (Figures 6C, D). Additionally, the Kyoto Encyclopedia of Genes and Genomes (KEGG) analysis also exhibited the upregulation of “cell cycle” and “DNA replication” pathways, and the downregulation of “PPAR signaling pathway” (Figures 6E, F). Finally, we examined the expression of key genes in the “cell cycle” and “fatty acid metabolism” pathways. Strikingly, the expression of CCND1, CCNB1, CDK1, and CDK2 was all significantly augmented by ABCC6 knockdown, while PPARA, ACOX1, CD36, ACSL4 were mitigated (Figure 6G). Taken together, these data suggest that ABCC6 depletion enhances cell proliferation by regulating peroxisome activity.
ABCC6 Knockdown Inhibits PPARα Activity
Peroxisomes are membrane-bound oxidative organelles found in the cytoplasm and involve more than 50 different metabolic enzymes. Peroxisomes play key roles in lipid metabolism and are essential for ROS production (23). Recent studies have reported that cancer cells exhibit remarkable alterations in peroxisome activity (24), and peroxisome metabolism is largely reduced in HCC (25). Our previous results demonstrated that ABCC6 is positively correlated with both “peroxisome” pathway and essential peroxisomal genes in the HCC public dataset; ABCC6 knockdown significantly inhibited the expression of PPARA and ACOX1 in HCC cells. Thus, we consider the possibility whether ABCC6 depletion promotes cell proliferation by inhibiting peroxisome activity.
It is well-established that ABCC6 overexpression results in the efflux of ATP, which decreases intracellular ATP levels. Accordingly, we found that ABCC6 knockdown increased intracellular ATP levels (Figure 7A). Consistent with our RNA-sequence results, qRT-PCR analysis showed that PPARA and ACOX1 were decreased after ABCC6 depletion, while the mRNA level of CCND1 was enhanced (Figure 7B). Furthermore, western blotting indicated that ABCC6 knockdown mitigated the protein levels of PPARα and ACOX1, while enhanced the protein level of CyclinD1, vice versa (Figures 7C, D). As PPARα and ACOX1 mainly influence lipid metabolism, we performed the malondialdehyde (MDA) assay to evaluate lipid peroxidation. As expected, ABCC6 knockdown significantly inhibited lipid peroxidation in HCC cells (Figure 7E). Moreover, seahorse assay showed that ABCC6 depletion affected the cellular energy phenotype and mitigated the oxygen consumption rate (OCR) of cancer cells under stress conditions (Figure 7F), most likely due to the lower lipid peroxidation activity. We further examined the intracellular ROS levels and found that ABCC6 overexpression elevated ROS levels (Figure 7G). To determine whether PPARα directly contributes to cell proliferation, we treated ABCC6 knockdown cells with PPARα agonist fenofibrate and monitored cell growth. Consistently, fenofibrate treatment partially rescued the cell proliferation phenotypes (Figures 7H, I). Taken together, these findings support the notion that ABCC6 knockdown inhibits peroxisomal ACOX1 and PPARα to prevent oxidative damage in HCC cells, thereby enhancing cell proliferation.
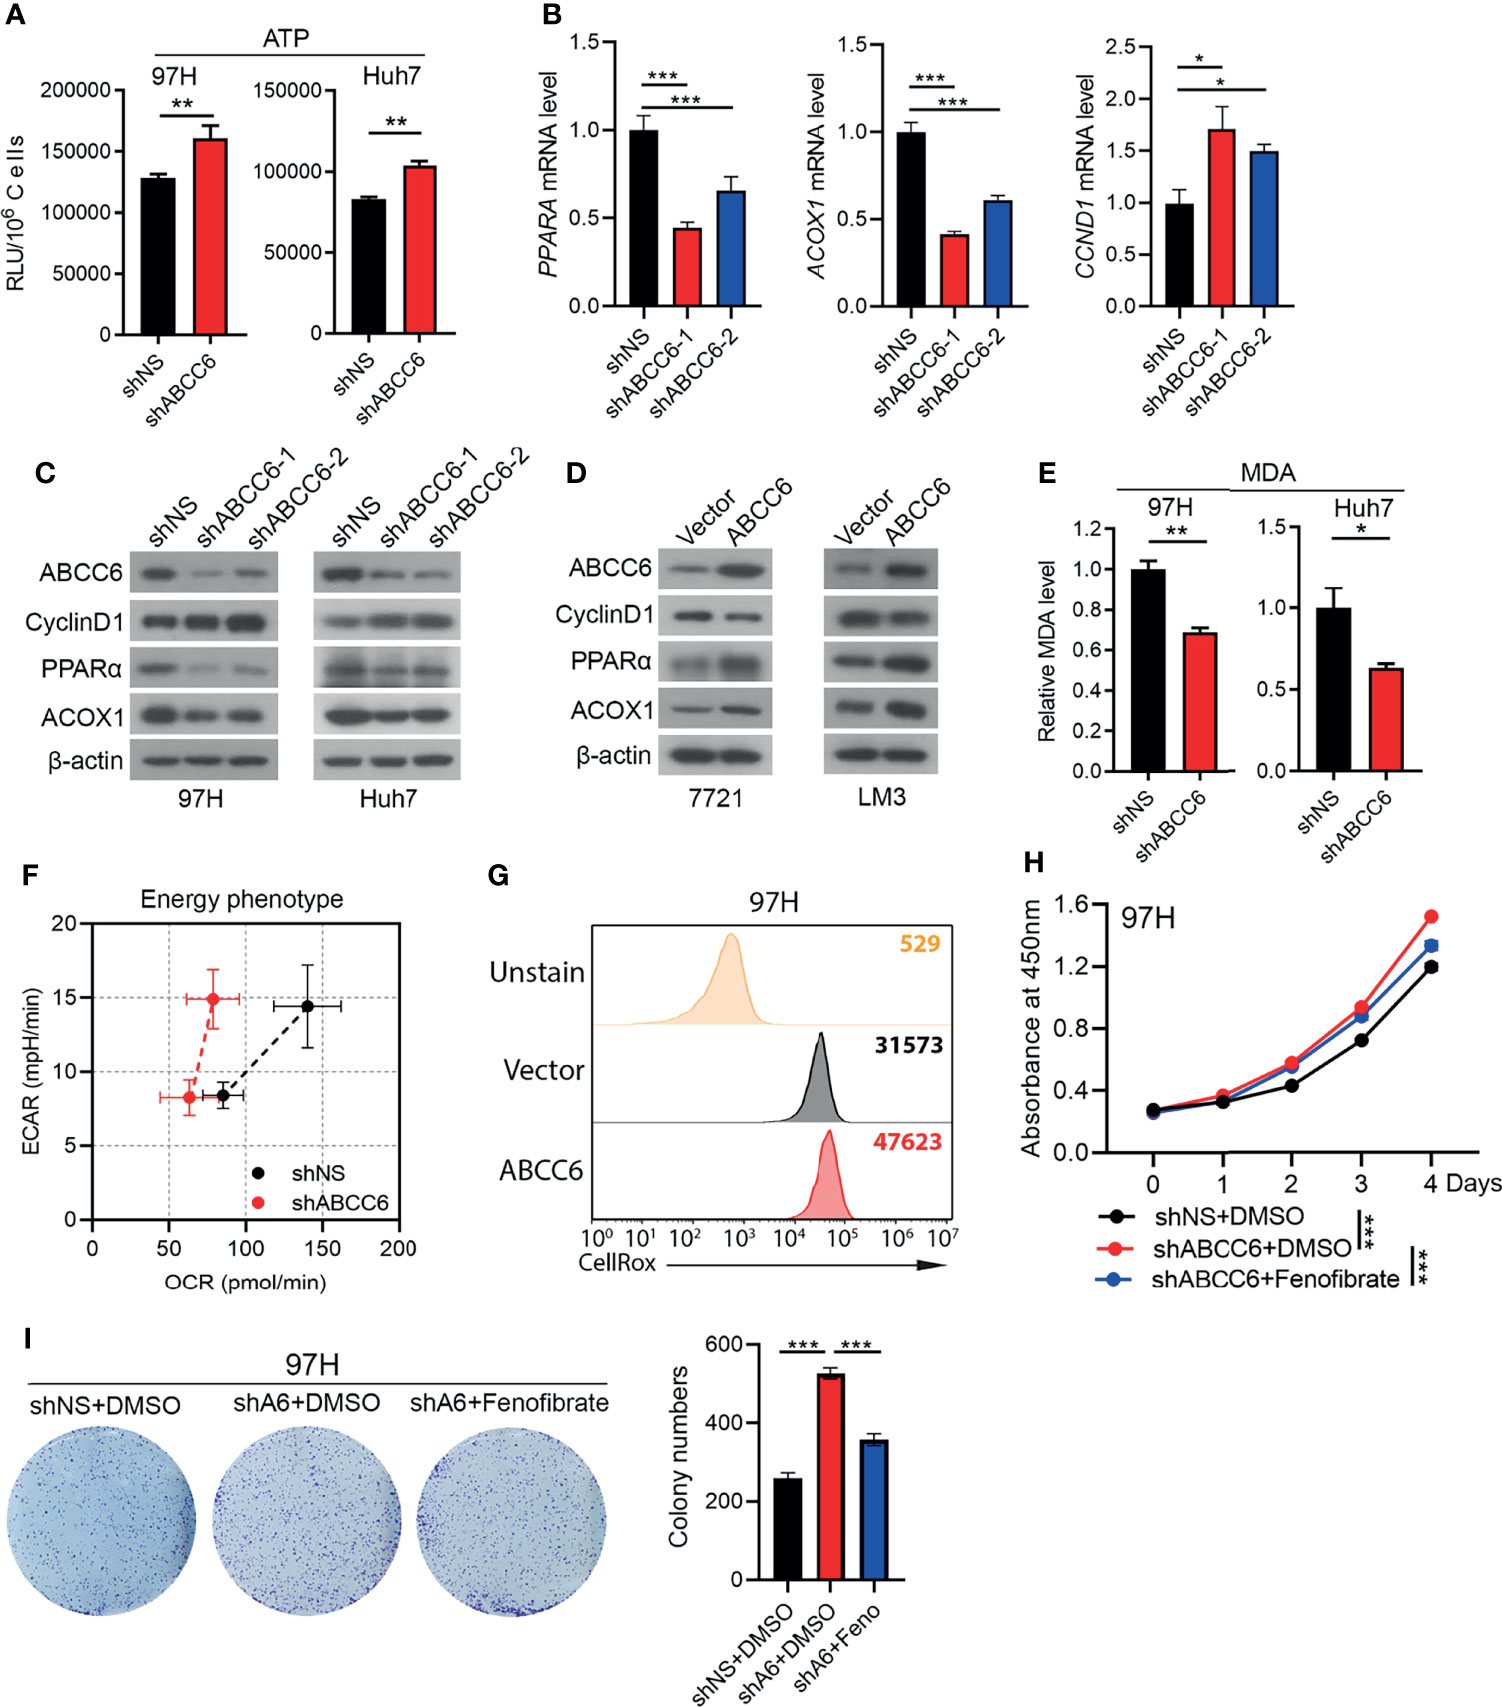
Figure 7 ABCC6 knockdown suppressed PPARα expression in HCC cells. (A) ATP level of ABCC6 knockdown and control 97H and Huh7 cells. (B) qPCR analysis showing the expression of PPARA, ACOX1 and CCND1 in ABCC6 knockdown 97H cells. (C) Western blot showing the protein levels of ABCC6, Cyclin D1, PPARα and ACOX1 in ABCC6 knockdown 97H and Huh7 cells. (D) Western blot showing the protein levels of ABCC6, Cyclin D1, PPARα and ACOX1 in ABCC6 overexpression 7721 and LM3 cells. (E) MDA assay showing the relative lipid peroxidation level of ABCC6 knockdown and control 97H and Huh7 cells. (F) Seahorse assay displaying the baseline and stressed energy phenotype of ABCC6 knockdown and control 97H cells. (G) Flow cytometry analysis showing the intracellular ROS level of vector and ABCC6 overexpression 97H cells. (H) CCK-8 assay showing the effect of PPARα agonist fenofibrate in the proliferation of ABCC6 knockdown and control 97H cells. (I) Colony formation assay showing the effect of PPARα agonist fenofibrate in the proliferation of ABCC6 knockdown and control 97H cells. Error bars indicate means ± SEM. P-values were determined by two tailed t-test (A, E) and one-way ANOVA (B, H, I). *P < 0.05, **P < 0.01, ***P < 0.001.
Discussion
ABC transporter family genes have diverse roles in energy homeostasis, lipid metabolism, drug resistance, and tumor progression. Although several studies suggested that ABC transporter family genes might serve as cancer drivers in multiple cancer types (7), other studies indicated that some ABC family genes may be tumor suppressors. For example, eight ABC transporter genes (e.g., ABCA8, ABCC6, and ABCC9) were significantly downregulated in prostate cancer tissues compared with noncancerous tissues (26). However, the behavior of ABC transporter family genes in HCC has not been clearly investigated. In this study, we evaluated the expression level and prognostic prediction value of all ABC transporter family members in TCGA and GSE14520 datasets, and found that ABCC6 is significantly downregulated in HCC tumor tissues and correlated with favorable outcomes in patients with HCC. Consistent with our findings, a previous study also demonstrated that the ABCC6 protein was highly expressed in liver tissue, but remained non-detectable in a small panel of human tumor samples (27).
It is well-established that ABCC6 mutation is responsible for PXE; however, the biological function of ABCC6 in HCC was largely unexplored. Our in vitro and in vivo results indicated that ABCC6 knockdown significantly promoted HCC cell proliferation. Moreover, ABCC6 depletion suppressed cell cycle arrest and apoptosis. To further investigate the mechanisms of ABCC6 in HCC, we performed GSEA, co-correlation analysis, and transcriptome sequencing. Notably, GO and KEGG analysis indicated that “cell cycle” and “DNA replication” pathways were significantly upregulated, while “PPAR signaling pathway” was downregulated. Furthermore, PPARA and ACOX1 were found to be potential targets of ABCC6.
PPARα, a key regulator of peroxisome metabolism, is closely related to energy homeostasis and lipid metabolism (28). Recent studies have shown that PPARα-deficient mice are remarkably sensitive to DEN(diethylnitrosamine)-induced liver cancer, and PPARα inhibits HCC development by mediating the NF-κB pathway (29). Additionally, the PPARα agonist, fenofibrate, caused inhibitory effects in different cancer cell lines and animal tumor models, including hepatocarcinogenesis (30–32). In our study, we found that ABCC6 knockdown suppressed PPARα expression transcriptionally, and fenofibrate partially rescued the cell proliferation phenotype, suggesting that PPARα is the downstream target of ABCC6. Moreover, ACOX1 is the rate-limiting enzyme in fatty acid β-oxidation. A previous study suggested that ACOX1 is controlled by PPARα, and ACOX1 dysfunction contributes to hepatocarcinogenesis (33). We demonstrated that ABCC6 knockdown mitigated lipid metabolism and oxygen consumption in HCC cells, which could promote cell proliferation by preventing HCC cells from oxidative damage.
The current study still has several limitations. First, it does not address why ABCC6 is downregulated in tumor tissues. Moreover, although we demonstrated that ABCC6 regulates the activity of peroxisomes in HCC, further studies are required to determine the underlying mechanism by which ABCC6 suppresses the expression of PPARα and ACOX1. Additionally, our study does not investigate whether ABCC6 is responsible for the resistance to clinically approved HCC drugs, such as sorafenib, regorafenib, and lenvatinib.
In conclusion, ABCC6 depletion inhibits peroxisome activity, protects cancer cells from oxidative damage, and therefore promotes cell proliferation. Our study provides profound insights into the behavior of ABC transporter family genes in various HCC cohorts, identifies ABCC6 as a potential biomarker for early-stage HCC diagnosis, and highlights the significance of ABCC6 in liver cancer progression.
Data Availability Statement
The datasets presented in this study can be found in online repositories. The names of the repository/repositories and accession number(s) can be found in the article/Supplementary Material.
Ethics Statement
The studies involving human participants were reviewed and approved by the Renji Hospital Ethics Committee. The patients/participants provided their written informed consent to participate in this study. The animal study was reviewed and approved by the Institutional Animal Care and Use Committee of Renji Hospital, Shanghai Jiao Tong University School of Medicine.
Author Contributions
ZCZ designed the study, performed cellular and molecular experiments, interpreted the data and wrote the manuscript. ZJZ performed the bioinformatics analysis. JW, HZ, and ZX performed cellular and molecular experiments or data analyses. QX conceived the project, supervised the study and revised the paper. All authors discussed the results and commented on the manuscript. All authors contributed to the article and approved the submitted version.
Funding
This study was supported by National Natural Science Foundation of China (81972205); Major Program of the National Natural Science Foundation of China (92059205); Shanghai Municipal Hospital Three-year-project for Clinical Skills’ Promotion and Innovation (SHDC2020CR5012, SHDC2020CR2003A).
Conflict of Interest
The authors declare that the research was conducted in the absence of any commercial or financial relationships that could be construed as a potential conflict of interest.
Publisher’s Note
All claims expressed in this article are solely those of the authors and do not necessarily represent those of their affiliated organizations, or those of the publisher, the editors and the reviewers. Any product that may be evaluated in this article, or claim that may be made by its manufacturer, is not guaranteed or endorsed by the publisher.
Acknowledgments
We thank Dr. Jiajie Hou for helpful discussion and comment. We thank Jiaxin Li and Yuan Xu in the Department of Liver Surgery, Renji Hospital, Shanghai Jiao Tong University School of Medicine for the collection and follow-up of HCC patients.
Supplementary Material
The Supplementary Material for this article can be found online at: https://www.frontiersin.org/articles/10.3389/fonc.2022.840287/full#supplementary-material
Supplementary Table 1 | Transcriptome analysis of ABCC6 knockdown MHCC97H cells versus control cells.
References
1. Yang JD, Hainaut P, Gores GJ, Amadou A, Plymoth A, Roberts LR. A Global View of Hepatocellular Carcinoma: Trends, Risk, Prevention and Management. Nat Rev Gastroenterol Hepatol (2019) 16(10):589–604. doi: 10.1038/s41575-019-0186-y
2. Gomaa AI, Khan SA, Toledano MB, Waked I, Taylor-Robinson SD. Hepatocellular Carcinoma: Epidemiology, Risk Factors and Pathogenesis. World J Gastroenterol (2008) 14(27):4300–8. doi: 10.3748/wjg.14.4300
3. Fujiwara N, Friedman SL, Goossens N, Hoshida Y. Risk Factors and Prevention of Hepatocellular Carcinoma in the Era of Precision Medicine. J Hepatol (2018) 68(3):526–49. doi: 10.1016/j.jhep.2017.09.016
4. Rong G, Wang H, Bowlus CL, Wang C, Lu Y, Zeng Z, et al. Incidence and Risk Factors for Hepatocellular Carcinoma in Primary Biliary Cirrhosis. Clin Rev Allergy Immunol (2015) 48(2-3):132–41. doi: 10.1007/s12016-015-8483-x
5. Tang A, Hallouch O, Chernyak V, Kamaya A, Sirlin CB. Epidemiology of Hepatocellular Carcinoma: Target Population for Surveillance and Diagnosis. Abdom Radiol (NY) (2018) 43(1):13–25. doi: 10.1007/s00261-017-1209-1
6. Begicevic RR, Falasca M. ABC Transporters in Cancer Stem Cells: Beyond Chemoresistance. Int J Mol Sci (2017) 18(11):2362. doi: 10.3390/ijms18112362
7. Domenichini A, Adamska A, Falasca M. ABC Transporters as Cancer Drivers: Potential Functions in Cancer Development. Biochim Biophys Acta Gen Subj (2019) 1863(1):52–60. doi: 10.1016/j.bbagen.2018.09.019
8. Fletcher JI, Williams RT, Henderson MJ, Norris MD, Haber M. ABC Transporters as Mediators of Drug Resistance and Contributors to Cancer Cell Biology. Drug Resist Updat (2016) 26:1–9. doi: 10.1016/j.drup.2016.03.001
9. Copsel S, Bruzzone A, May M, Beyrath J, Wargon V, Cany J, et al. Multidrug Resistance Protein 4/ ATP Binding Cassette Transporter 4: A New Potential Therapeutic Target for Acute Myeloid Leukemia. Oncotarget (2014) 5(19):9308–21. doi: 10.18632/oncotarget.2425
10. Peaston AE, Gardaneh M, Franco AV, Hocker JE, Murphy KM, Farnsworth ML, et al. MRP1 Gene Expression Level Regulates the Death and Differentiation Response of Neuroblastoma Cells. Br J Cancer (2001) 85(10):1564–71. doi: 10.1054/bjoc.2001.2144
11. Araujo TM, Seabra AD, Lima EM, Assumpcao PP, Montenegro RC, Demachki S, et al. Recurrent Amplification of RTEL1 and ABCA13 and its Synergistic Effect Associated With Clinicopathological Data of Gastric Adenocarcinoma. Mol Cytogenet (2016) 9(1):52. doi: 10.1186/s13039-016-0260-x
12. Takahashi K, Kimura Y, Nagata K, Yamamoto A, Matsuo M, Ueda K. ABC Proteins: Key Molecules for Lipid Homeostasis. Med Mol Morphol (2005) 38(1):2–12. doi: 10.1007/s00795-004-0278-8
13. Nobili S, Lapucci A, Landini I, Coronnello M, Roviello G, Mini E. Role of ATP-Binding Cassette Transporters in Cancer Initiation and Progression. Semin Cancer Biol (2020) 60:72–95. doi: 10.1016/j.semcancer.2019.08.006
14. Favre G, Laurain A, Aranyi T, Szeri F, Fulop K, Le Saux O, et al. The ABCC6 Transporter: A New Player in Biomineralization. Int J Mol Sci (2017) 18(9):1941. doi: 10.3390/ijms18091941
15. Le Saux O, Martin L, Aherrahrou Z, Leftheriotis G, Váradi A, Brampton CN. The Molecular and Physiological Roles of ABCC6: More Than Meets the Eye. Front Genet (2012) 3:289. doi: 10.3389/fgene.2012.00289
16. Terry SF. The Human Face of ABCC6. FEBS Lett (2020) 594(23):4151–7. doi: 10.1002/1873-3468.14002
17. Bergen AA, Plomp AS, Schuurman EJ, Terry S, Breuning M, Dauwerse H, et al. Mutations in ABCC6 Cause Pseudoxanthoma Elasticum. Nat Genet (2000) 25(2):228–31. doi: 10.1038/76109
18. Wang J, Near S, Young K, Connelly PW, Hegele RA. ABCC6 Gene Polymorphism Associated With Variation in Plasma Lipoproteins. J Hum Genet (2001) 46(12):699–705. doi: 10.1007/s100380170003
19. Peloso GM, Demissie S, Collins D, Mirel DB, Gabriel SB, Cupples LA, et al. Common Genetic Variation in Multiple Metabolic Pathways Influences Susceptibility to Low HDL-Cholesterol and Coronary Heart Disease. J Lipid Res (2010) 51(12):3524–32. doi: 10.1194/jlr.P008268
20. Ibold B, Tiemann J, Faust I, Ceglarek U, Dittrich J, Gorgels T, et al. Genetic Deletion of Abcc6 Disturbs Cholesterol Homeostasis in Mice. Sci Rep (2021) 11(1):2137. doi: 10.1038/s41598-021-81573-1
21. Singal AG, Waljee AK, Patel N, Chen EY, Tiro JA, Marrero JA, et al. Therapeutic Delays Lead to Worse Survival Among Patients With Hepatocellular Carcinoma. J Natl Compr Canc Netw (2013) 11(9):1101–8. doi: 10.6004/jnccn.2013.0131
22. Sengupta S, Parikh ND. Biomarker Development for Hepatocellular Carcinoma Early Detection: Current and Future Perspectives. Hepat Oncol (2017) 4(4):111–22. doi: 10.2217/hep-2017-0019
23. Waterham HR, Ferdinandusse S, Wanders RJ. Human Disorders of Peroxisome Metabolism and Biogenesis. Biochim Biophys Acta (2016) 1863(5):922–33. doi: 10.1016/j.bbamcr.2015.11.015
25. Litwin JA, Beier K, Volkl A, Hofmann WJ, Fahimi HD. Immunocytochemical Investigation of Catalase and Peroxisomal Lipid Beta-Oxidation Enzymes in Human Hepatocellular Tumors and Liver Cirrhosis. Virchows Arch (1999) 435(5):486–95. doi: 10.1007/s004280050432
26. Demidenko R, Razanauskas D, Daniunaite K, Lazutka JR, Jankevicius F, Jarmalaite S. Frequent Down-Regulation of ABC Transporter Genes in Prostate Cancer. BMC Cancer (2015) 15(1):683. doi: 10.1186/s12885-015-1689-8
27. Scheffer GL, Hu X, Pijnenborg AC, Wijnholds J, Bergen AA, Scheper RJ. MRP6 (ABCC6) Detection in Normal Human Tissues and Tumors. Lab Invest (2002) 82(4):515–8. doi: 10.1038/labinvest.3780444
28. Lefebvre P, Chinetti G, Fruchart JC, Staels B. Sorting Out the Roles of PPAR Alpha in Energy Metabolism and Vascular Homeostasis. J Clin Invest (2006) 116(3):571–80. doi: 10.1172/JCI27989
29. Zhang N, Chu ES, Zhang J, Li X, Liang Q, Chen J, et al. Peroxisome Proliferator Activated Receptor Alpha Inhibits Hepatocarcinogenesis Through Mediating NF-κB Signaling Pathway. Oncotarget (2014) 5: (18):8330. doi: 10.18632/oncotarget.2212
30. Panigrahy D, Kaipainen A, Huang S, Butterfield CE, Barnés CM, Fannon M, et al. PPARα Agonist Fenofibrate Suppresses Tumor Growth Through Direct and Indirect Angiogenesis Inhibition. Proc Natl Acad Sci USA (2008) 105: (3):985–90. doi: 10.1073/pnas.0711281105
31. Yamasaki D, Kawabe N, Nakamura H, Tachibana K, Ishimoto K, Tanaka T, et al. Fenofibrate Suppresses Growth of the Human Hepatocellular Carcinoma Cell via PPARα-Independent Mechanisms. Eur J Cell Biol (2011) 90: (8):657–64. doi: 10.1016/j.ejcb.2011.02.005
32. Luo Y, Xie C, Brocker CN, Fan J, Wu X, Feng L, et al. Intestinal PPARalpha Protects Against Colon Carcinogenesis via Regulation of Methyltransferases DNMT1 and PRMT6. Gastroenterology (2019) 157(3):744–59 e4. doi: 10.1053/j.gastro.2019.05.057
Keywords: ABC transporter family, ABCC6, biomarker, cell proliferation, hepatocellular carcinoma, PPARα, peroxisome
Citation: Zhao Z, Zhao Z, Wang J, Zhang H, Xi Z and Xia Q (2022) ABCC6 Knockdown Fuels Cell Proliferation by Regulating PPARα in Hepatocellular Carcinoma. Front. Oncol. 12:840287. doi: 10.3389/fonc.2022.840287
Received: 21 December 2021; Accepted: 28 January 2022;
Published: 24 February 2022.
Edited by:
Yunfei Xu, Shandong University, ChinaReviewed by:
Zhixiang Jian, Guangdong Provincial People’s Hospital, ChinaNing Wei, University of Pittsburgh Medical Center, United States
Copyright © 2022 Zhao, Zhao, Wang, Zhang, Xi and Xia. This is an open-access article distributed under the terms of the Creative Commons Attribution License (CC BY). The use, distribution or reproduction in other forums is permitted, provided the original author(s) and the copyright owner(s) are credited and that the original publication in this journal is cited, in accordance with accepted academic practice. No use, distribution or reproduction is permitted which does not comply with these terms.
*Correspondence: Qiang Xia, eGlhcWlhbmdAc2hzbXUuZWR1LmNu
†These authors have contributed equally to this work