
94% of researchers rate our articles as excellent or good
Learn more about the work of our research integrity team to safeguard the quality of each article we publish.
Find out more
ORIGINAL RESEARCH article
Front. Oncol., 11 April 2022
Sec. Skin Cancer
Volume 12 - 2022 | https://doi.org/10.3389/fonc.2022.835929
This article is part of the Research TopicWomen in Skin Cancer: 2021View all 24 articles
 Elahe Minaei1,2
 Simon A. Mueller3,4
 Bruce Ashford1,3,5,6
 Amarinder Singh Thind1,6
 Jenny Mitchell5
 Jay R. Perry1,2
 Benjamin Genenger1,2
 Jonathan R. Clark3,7,8
 Ruta Gupta3,8,9
 Marie Ranson1,2*
Cutaneous squamous cell carcinoma (cSCC) of the head and neck region is the second most prevalent skin cancer, with metastases to regional lymph nodes occurring in 2%–5% of cases. To further our understanding of the molecular events characterizing cSCC invasion and metastasis, we conducted targeted cancer progression gene expression and pathway analysis in non-metastasizing (PRI-) and metastasizing primary (PRI+) cSCC tumors of the head and neck region, cognate lymph node metastases (MET), and matched sun-exposed skin (SES). The highest differentially expressed genes in metastatic (MET and PRI+) versus non-metastatic tumors (PRI-) and SES included PLAU, PLAUR, MMP1, MMP10, MMP13, ITGA5, VEGFA, and various inflammatory cytokine genes. Pathway enrichment analyses implicated these genes in cellular pathways and functions promoting matrix remodeling, cell survival and migration, and epithelial to mesenchymal transition, which were all significantly activated in metastatic compared to non-metastatic tumors (PRI-) and SES. We validated the overexpression of urokinase plasminogen activator receptor (uPAR, encoded by PLAUR) in an extended patient cohort by demonstrating higher uPAR staining intensity in metastasizing tumors. As pathway analyses identified epidermal growth factor (EGF) as a potential upstream regulator of PLAUR, the effect of EGF on uPAR expression levels and cell motility was functionally validated in human metastatic cSCC cells. In conclusion, we propose that uPAR is an important driver of metastasis in cSCC and represents a potential therapeutic target in this disease.
Cutaneous squamous cell carcinoma (cSCC) is a prevalent non-melanoma skin cancer worldwide (1). As principally a disease of the sun-exposed skin, most notably in the head and neck, cSCC is particularly prevalent in regions with intensive sun exposure such as Australasia where it represents a significant health burden (2, 3). Metastasis to regional lymph nodes in the head neck occurs in <5% of cases but imparts significant morbidity and mortality (4). Notwithstanding conventional systemic treatment options such as chemotherapy and, more recently, epidermal growth factor receptor inhibitors or immunotherapy, for a substantial proportion of advanced cSCC patients there are still no valid second-line therapies (5), indicating a need for alternate targeted therapy options and strategies.
Conventional clinicopathologic prognostic markers in cSCC are unreliable predictors of lymph node metastasis (6–8). Recent studies assessing the genomic and transcriptomic landscape of cSCC have revealed heterogeneity of cellular subtypes in these cancers; however, tumor cell populations harboring potentially clinically useful gene signatures and/or therapeutic targets of metastatic risk in primary cSCC are evident (1, 9–16). These biomarkers or molecular signatures of invasion and metastasis are overwhelmingly related to cancer progression pathways encompassing extracellular matrix (ECM) interactions and remodeling, epithelial to mesenchymal transition (EMT), cellular motility, and survival.
Altered proteolysis and EMT programs are required for ECM remodeling and tumor cell escape (17–19). In particular, overexpression of the urokinase plasminogen activator (uPA, encoded by PLAU) and its cognate cell surface receptor (uPAR, encoded by PLAUR) (including downstream effector and upstream regulator molecules) is associated with EMT (20) and correlates with increased metastasis and/or poorer patient survival in many solid tumor types (21–23) including mucosal squamous cell carcinoma of the oral cavity (24–30).
These genes and their proteins are also overexpressed in advanced and metastatic cSCC (15, 31, 32) with uPAR mRNA shown to be localized to a subpopulation of invasive cells in primary cSCCs (33). Upon binding to uPAR, uPA efficiently activates co-localized plasminogen to the potent broad-spectrum protease plasmin, which initiates a cascade of pericellular proteolysis that directly and indirectly (through the activation of pro-metalloproteinases, pro-MMPs) degrades integral ECM molecules including fibronectin, laminins, elastins, and collagens, thus enabling tumor cell invasion and dissemination (18, 22). Plasmin and MMPs are also responsible for the release and activation of latent growth/angiogenic factors (such as EGF and VEGF) and chemokines from the ECM, which promotes cellular proliferation, survival, and motility (18, 22). Activated receptor tyrosine kinase pathways have also been shown to enhance uPA system expression in cancer (23).
While others have either specifically or coincidently explored the expression of the uPA system, MMPs, and ECM interactors in cSCC (summarized in Table S1), few have focused exclusively on the uPA system in UV-induced cSCC of the head and neck encompassing the spectrum of disease states. To this end, we performed gene expression analyses using a curated cancer progression-targeted gene set in non-metastasizing and metastasizing head and neck cSCC primary tumors, lymph node metastases, and matched sun-exposed skin (SES). This was then used for gene enrichment and pathway analyses. An integrated gene expression was also performed on relevant gene expression omnibus (GEO) datasets to strengthen our findings. Recognizing the PLAUR gene as an important mediator of proteolytic networks in the tumor microenvironment, we further investigated uPAR protein levels and association with metastatic disease. Finally, the predicted activating effects of EGF was assessed in vitro on EGFR-expressing human metastatic cSCC cell lines.
The project was approved by the University of Wollongong Health and Medical Human Research Ethics Committee (Wollongong NSW, Australia, UOW/ISLHD HREC 14/397). Head and neck cSCC specimens from a total of 50 patients who underwent surgery with curative intent were retrieved from the Department of Tissue Pathology and Diagnostic Oncology at Royal Prince Alfred Hospital, Sydney NSW, Australia. Formalin-fixed paraffin-embedded (FFPE) specimens were derived from the head and neck region of 21 patients with primary tumors with no evidence of metastasis (PRI-), 14 patients with primary tumors that had metastasized (PRI+) (13 of which had available concurrent metastases), and an additional 15 patients with lymph node metastases, but with no available primary tumor. FFPE cores from SES were taken from the peripheral negative margins where available. The specimens used are summarized in Supplementary Data Sheet 1. High-risk disease was defined as per criteria of the 7th edition of the American Joint Commission on Cancer Staging Manual (34). Patients in the non-metastatic group had to meet one or more of the following criteria: absence of metastases at the >24-month follow-up after resection of the primary; negative sentinel lymph node biopsy at the time of resection of the primary; or histologically negative prophylactic neck dissection. Clinical features, treatment, and follow-up were obtained from the Sydney Head and Neck Cancer Institute database. For comparisons between the cohorts, the Mann–Whitney-U test was applied for non-parametric continuous data, the Fisher’s exact for categorical data in 2 × 2 contingency tables, and χ2 test for larger contingency tables.
Specimens underwent histopathological review to select areas with high neoplastic content (>30%) and exclude areas containing necrosis, hemorrhage, high keratin content, or significant inflammation. Three to six tissue cores (2 mm diameter) were then obtained from FFPE blocks of these specimens for deparaffinization and homogenization prior to RNA extraction. Tumor nucleic acids from specimens were extracted using AllPrep DNA/RNA FFPE Kit (80234, Qiagen, Hilden, Germany) according to the manufacturer’s instructions. RNA samples that met initial QC measures including high A260/280 (<1.8–2) and acceptable integrity (Invitrogen Qubit RNA IQ Assay, Thermo Fisher Scientific, Waltham, MA, USA) were utilized in gene expression assays.
Up to 150 ng of purified RNA was run on the nCounter Sprint (NanoString Technologies, Seattle, WA, USA) platform using the nCounter PanCancer Progression Panel (NanoString; 740 target genes, 30 housekeeping genes) as per the manufacturer’s instructions. nSolver Analysis Software 4.0 (NanoString) was used to remove specimens with low binding density or other technical QC flags. The raw data from the remaining specimens was then processed using the iterative RUVSeq normalization pipeline for QC, normalization, and data visualization/validation using NanoNormIter R package (35). After technical quality control steps, specimens SESP3, SESP29, and PRI+P7 were excluded from further analysis because of very low geometric mean of housekeeping gene expression. Housekeeping genes associated with phenotype were also excluded using the glm.nb function (Negative Binomial Generalized Linear Model) as specified in the RUVseq-based pipeline [refer to (35)]. The normalization step of all possible combinations of pairwise analyses was tested using different values of k (RUVg) and the different normalized expression datasets visualized using principal component analysis (PCA) and RLE plots to detect problematic samples for assessment of removal from further analysis. By this method, METP16 was flagged, assessed, and discarded. The final list of included specimens that underwent NanoString analyses are shown in Supplementary Data Sheet 1. After RUVg normalization of final specimens, differential expression analyses were performed using DESeq2. The top differentially expressed genes (DEGs) were selected based on both log2fold change between the compared groups and the p-values adjusted for multiple testing using the Benjamini–Hochberg method (36). Supplementary Data Sheet 2 contains differential gene expression data for all cohort comparisons.
Where indicated, raw data from the retained specimens that passed these QC steps were also analyzed using the global significance score function within the nCounter Advanced Analysis 2.0 software (NanoString) which is derived using the most DEGs in gene sets representative of a particular cancer progression annotation.
Ingenuity Pathway Analysis (IPA; Qiagen Inc., https://www.qiagenbioinformatics.com/products/ingenuitypathway-analysis) software was used to generate networks and functional analyses of gene expression datasets (37). IPA core analysis default settings were used, limited to the human knowledge base. We applied a global molecular network developed from information contained in the Ingenuity Pathways Knowledge Base incorporating DEGs from our study with log2 fold change (logFC) <-0.58, >0.58 (p-value < 0.05) for each comparison. Networks of these gene lists were then generated algorithmically based on their interrelationships. The significance of the association between lists of DEGs and the Diseases and Functions were assessed using (1) the ratio of DEGs (molecules) from the dataset that map to a specific cellular and molecular function category (in relation to the total number of molecules included in the particular disease and function) and (2) Fischer’s exact test (to determine the likelihood of association between the molecules in the dataset and the disease and function).
IPA uses the activation z-score algorithm to make a prediction of activation or inhibition (or no prediction) as well as to reduce the chance that random data will generate significant predictions. Causal Network and Upstream Regulator analyses were used to identify regulators with a probability of being responsible for the changes in gene expression observed, by calculating an overlap p-value with Fisher’s exact test and an activation z-score. Causal Networks are small hierarchical networks of regulators that control the expression of the dataset targets.
An expression meta-analysis study was performed on all available cSCC datasets in Gene Expression Omnibus (GEO) (38) containing normal skin from sun-exposed areas and cSCC cases classified as invasive or metastatic for comparison to our PRI+ vs. SES analyses. Using the detailed filtering criteria described in Table S2, only three datasets comprising 18 SES and 25 cSCC samples matched these criteria. In the first step, three separate differential expression analyses for each dataset was performed using the Limma (39) and GEOquery (40) packages. A universal threshold of p-value < 0.01 and logFC <-0.58, >0.58 was used for the collection of significantly DEG lists for each comparison. RankerGUI (41) ranked the DEG lists based on the logFC values, which were then used for a differential meta-analysis using the Robust Rank Aggregation (RRA) method (42). Significant DEG lists of the meta-analysis were extracted using a p-value cutoff < 0.05. In addition, Reactome (43) functional enrichment analysis of significantly DEG was carried out using Bioconductor package-ReactomePA (44).
Immunohistochemical staining for uPAR was performed using FFPE tissues from primary and metastatic cSCC specimens (listed in Supplementary Data Sheet 1). Briefly, 4-µm sections were deparaffinized and uPAR detected (after antigen retrieval at 100°C in pH 9.0 solution) with anti-uPAR at either 1:100 dilution (clone R4; Dako, Glostrup, Denmark) or 1:500 (10925-T30; Sino Biological, Chesterbrook, PA, USA) using the Ventana BenchMark Ultra Automated Immunohistochemistry (IHC)/ISH slide staining system with diaminobenzidine (DAB) as chromogen, followed by counterstaining with hematoxylin. The confounder effect of using the two different sources of anti-uPAR in this study was not significant (data not shown). Slides containing neutrophils and macrophages as internal and external positive controls, respectively, accompanied all staining runs. The proportion of tumor cells demonstrating complete membranous staining with uPAR was initially recorded as a proportion of the total number of tumor cells at the advancing edge of the tumor. Complete membranous staining of any intensity of the tumor cells was then scored and used for statistical analyses in this study. Scores were analyzed in GraphPad Prism 8.4.3.
Small RNA-Seq was performed using the Illumina HiSeq platform at the Australian Genome Research Facility Ltd., Westmead, NSW, Australia. The quality test of raw reads was assessed using the FastQC tool v0.11.9 (https://www.bioinformatics.babraham.ac.uk/projects/fastqc/). Poor-quality reads were trimmed using Cutadapt (version 2.8). Trimmed fastq sequences were mapped and annotated using sRNAbench (45). Next, a differential expression analysis based on negative binomial distribution was performed using the sRNAde tool (46), which integrates Deseq2 (47) and EdgeR (48). Further, significantly differentially expressed miRNAs were extracted based on log2FC ≥ ± 1 and p-values adjusted for multiple testing using the Benjamini–Hochberg method (36). In downstream analyses, miRDB (49, 50) was used to obtain putative targeted genes of statistically significant miRNAs. miRDB provides a collection of miRNA and mRNA interactions predicted by the Machine Learning Tool (MirTarget), which utilizes features related to miRNA binding and downregulated targets. miRNA–mRNA interactions having a score >75 were considered for further analysis. Finally, experimentally validated miRNA–mRNA interactions for PLAUR from the miRtarbase database (51) were explored. Two-tailed Spearman correlation coefficient between uPAR IHC and miRNA was calculated using GraphPad Prism 9.0.2.
The effect of EGF on cell migration was assessed in a scratch-wound assay using the IncuCyte® Zoom Kinetic Imaging System (Essen BioScience, Ann Arbor, MI, USA). Patient-derived metastatic cSCC cell line UW-CSCC2 [described in detail in (52)] was seeded onto collagen 1-coated 96-well ImageLock plates (Essen). After 24 h incubation in low serum containing media (DMEM supplemented with 1% FCS, no EGF), the cells were scratched according to manufacturer’s instructions using the 96-pin Essen Woundmaker™. The cells were subsequently washed with serum-free media, then incubated with 0, 5, 10, or 20 ng/ml human EGF ± 1 µM gefitinib in low serum media at 37°C, 5% CO2, and imaged over 24 h at ×10 objective to track cell motility and wound width. IncuCyte™ ZOOM software was used to analyze wound width reduction over time. Data were analyzed using GraphPad Prism 9.0.2.
For determination of uPAR levels, UW-CSCC2 cells were treated as above except that cells were lysed for total protein extraction and Western blotting 24 h after EGF ± 1 µM gefitinib treatment. Blots were incubated with anti-human uPAR rabbit polyclonal antibody (1:2,000; ab103791, Abcam) or anti-GAPDH mouse monoclonal antibody (1:5,000; G8795, Sigma-Aldrich, St. Louis, MO, USA) and detected using horseradish peroxidase-conjugated anti-rabbit IgG (7074S, Cell Signaling, Danvers, MA, USA) or anti-mouse IgG (ab205719, Abcam, Cambridge, MA, USA) both at 1:5,000 dilution. Chemiluminescence was generated using Pierce ECL Western Blotting Substrate (Thermo Fisher Scientific, Waltham, MA, USA) and visualized using a ChemiDoc MP Imaging System (Bio-Rad Laboratories). Densitometry was conducted using ImageJ (v1.53e, NIH, USA) and values normalized against the housekeeping protein GAPDH as protein loading control.
For detection of EGFR, cells were seeded into ibidi chamber slides (ibidi GmbH, Gräfelfing, Germany) and grown under regular culture conditions prior to staining with human anti-EGFR monoclonal antibody (1:1,000; MAB1095-100—R&D Systems, Minneapolis, MN, USA) followed by Alexa Fluor® 555-conjugated donkey anti-mouse IgG H&L (1:2,000; ab150106, Abcam). The cells were then counterstained with ActinRed 555 ready probes (Thermo Fisher) and RedDot2 Far-Red Nuclear Stain (Biotium, Inc., Fremont, CA, USA), and then imaged with a ×20 oil immersion objective and a TCS SP5 confocal microscope (Leica, Wetzlar, Germany).
Clinical and demographic data are shown in Table 1. While the sex distribution was similar, patients suffering from metastasizing cSCC (PRI+ and/or MET) were significantly older than patients with non-metastasizing cSCC (PRI-; p = 0.034). This age difference may be subject to bias, since in patients with MET where the primary tumor was not known, the age was recorded at the time of treatment of the lymph node metastasis, which is at a later point of the course of the disease. The two groups differed significantly in TNM tumor stage at the time of surgery, which was expected since the presence of lymph node metastasis is the determinant of the N-stage (p < 0.001) and reflects in higher overall stage (p < 0.001). The validity of the difference in the T-stage is limited, since the primary was no longer present at the time of surgery in 12 MET samples and could not be retrospectively determined. Although not statistically significant, lympho-vascular infiltration (LVI) was more commonly seen in the metastatic cohort, which could be expected since LVI is a crucial step in the development of lymph node metastasis. The rate of perineural infiltration and histopathological grading did not significantly differ between the two groups. Full clinico-pathological data for each sample are listed in Supplementary Data Sheet 1.
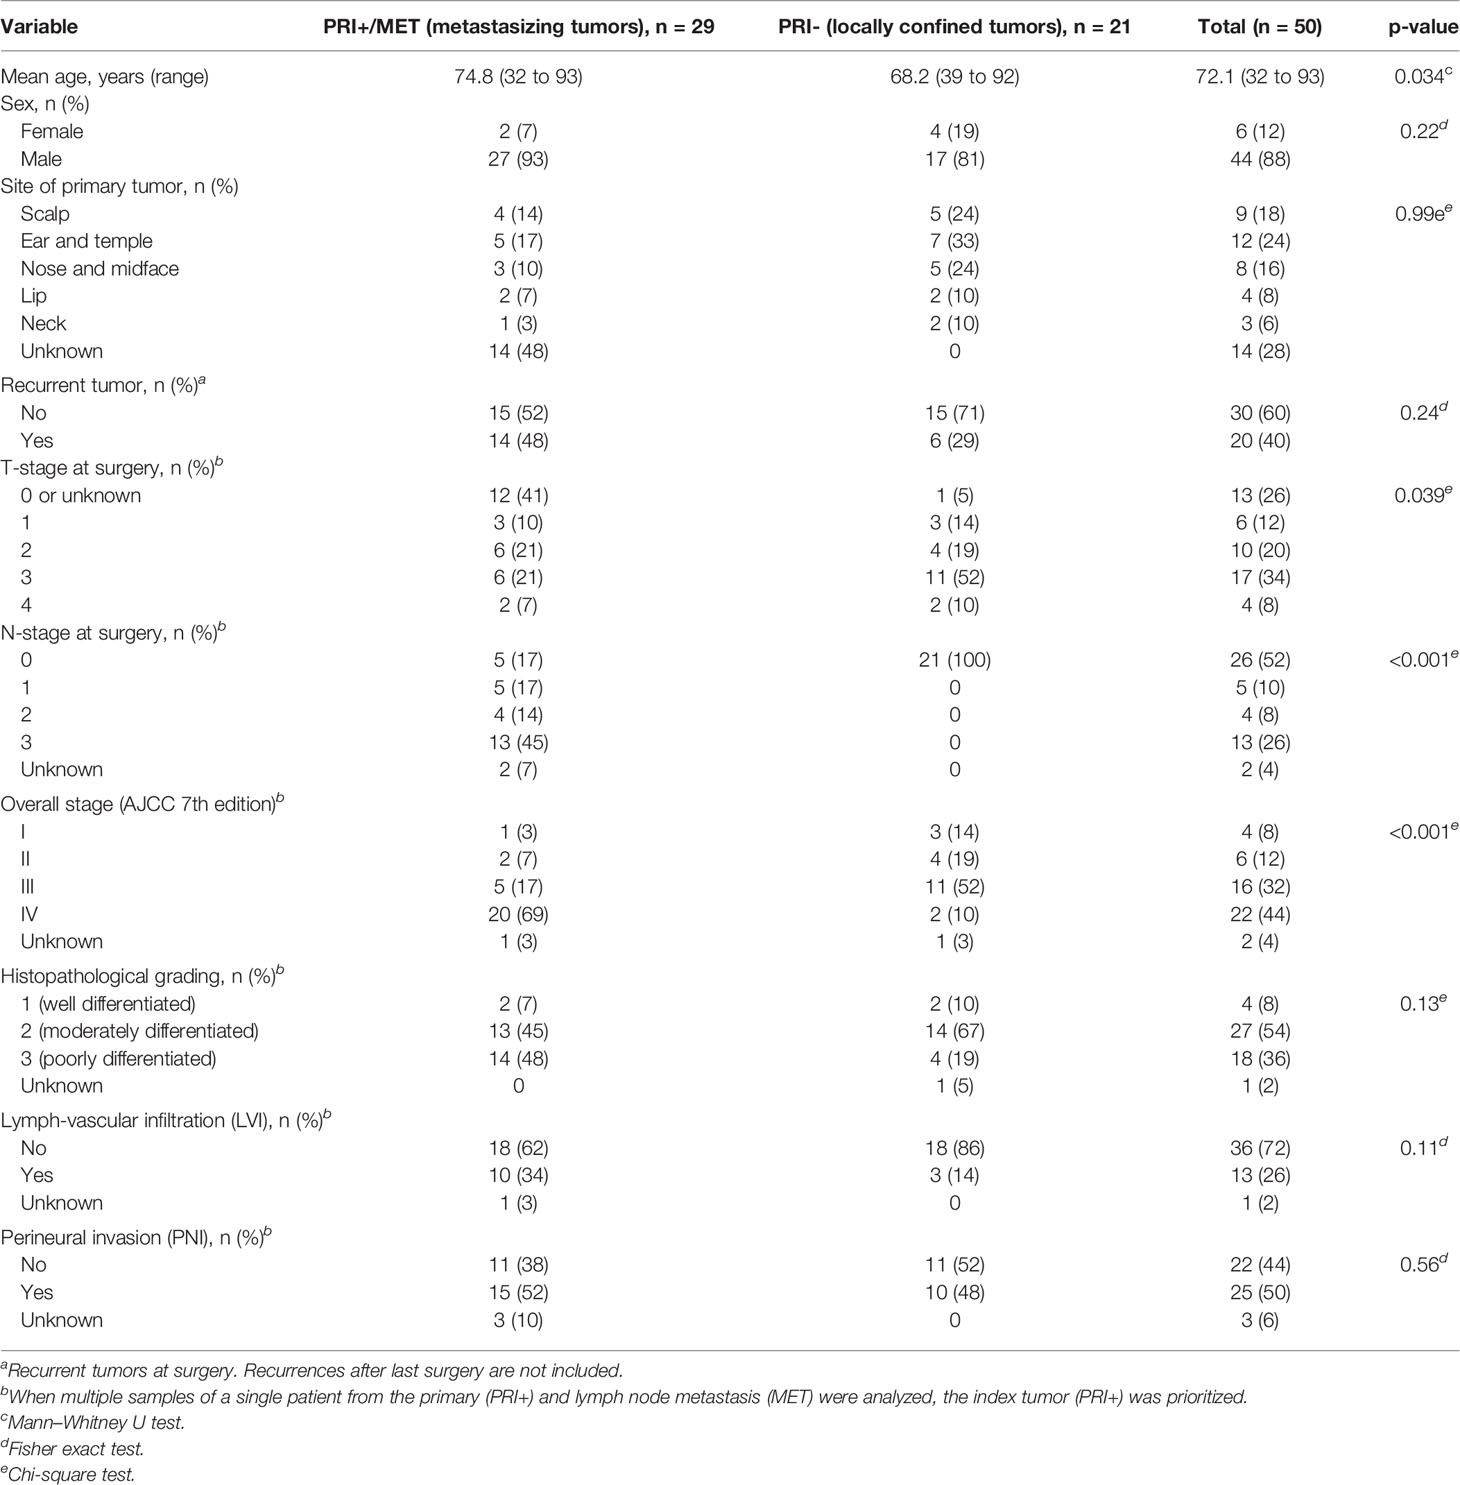
Table 1 Demographic and clinical data of the cohort of 50 patients with cSCC with (cohorts PRI+, MET) or without lymph node metastasis (PRI-).
A principal component analysis (PCA) plot based on all the normalized data of all cohort comparisons clearly separate the tumor cohorts (MET, PRI+, and PRI-) from SES (Figure 1A), with significant differential gene expression (log2FC ≥1 or ≤-1; adjp-value < 0.05) between all tumor cohorts and SES (Figures 1B–D). This included 229 DEGs in MET tumors vs. SES (147 up- and 82 downregulated), 214 in PRI+ (metastasizing primary tumors) vs. SES (133 up- and 81 downregulated), and 213 in PRI- (non-metastasizing primary tumors) vs. SES (124 up- and 89 downregulated) (refer to Supplementary Data Sheet 2 for gene list). This highlights the striking differential gene expression in cSCC compared to SES despite the high mutational burden reported in SES (53). Fifty percent (148/295) of the DEGs between the three comparisons (i.e., between MET or PRI+ or PRI- vs. SES) were shared (Figure 1E; Supplementary Data Sheet 2). Of the top 20 upregulated shared DEGs (Supplementary Data Sheet 2), 12 are associated with MMP remodeling, cell motility, and ECM receptor interaction annotations (Supplementary Image 1A), indicating that these pathways are already dysregulated in non-metastasizing primary tumors. However, key MMP remodeling-associated genes PLAU and MMP10 and basal cell marker KRT19 were uniquely shared upregulated genes in metastatic tumors (MET and PRI+) (Supplementary Image 1A). Of the top 20 downregulated DEGs, 10 genes with varied functions such as keratinocyte differentiation (KRT1) and dysregulated tumor–microenvironment interactions were shared between all tumor cohorts and SES (Supplementary Image 1B). Four genes with disparate functions were among the top 20 downregulated genes uniquely shared by metastatic tumors compared to SES (Supplementary Image 1B). These unique shared up- and downregulated genes clustered the MET/PRI+ cohort together away from the PRI- cohort, which showed intermediate behavior between the metastatic tumors and SES (Supplementary Image 1C).
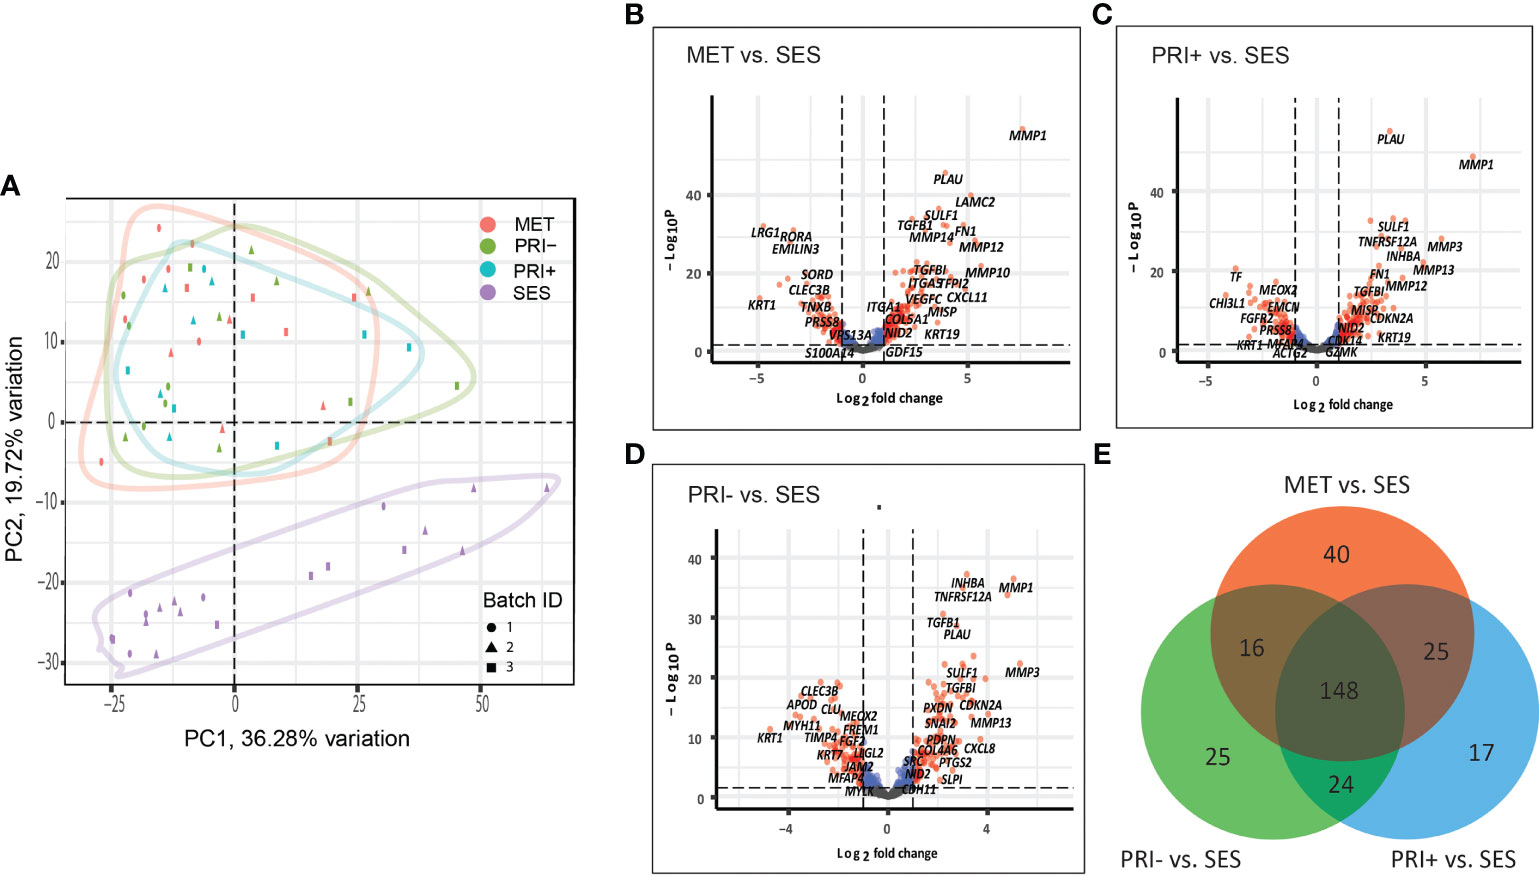
Figure 1 Cancer progression gene expression patterns of sun-exposed skin (SES) and non-metastatic (PRI-) and metastatic (PRI+ and MET) cSCC. (A) Principle component plot of tumor cohorts and SES normalized gene expression data. The first and second principal components are plotted on the x- and y-axis, respectively. Batch ID symbols indicate different NanoString runs and show lack of batch effect. (B–D) Volcano plots illustrating gene expression differences (x-axis) and significance (y-axis) (dotted horizontal lines) of (B) MET vs. SES, (C) PRI+ vs. SES, and (D) PRI- vs. SES. Each dot represents a gene. (E) Venn diagram depicting DEGs with log2 fold changes of ≥1 or ≤-1 between MET vs. SES, PRI+ vs. SES, and PRI- vs. SES and adjusted p-value ≤ 0.05. The number of DEGs for each pairwise comparison is indicated in the circles of the Venn diagram. The overlap between the circles shows DEGs that occur in more than one comparison.
A gene set analysis of the differential gene expression profiles of tumor cohorts compared to SES confirmed that MMP remodeling followed by cell motility, collagen family, and ECM receptor interaction was the most differentially expressed cancer progression pathway (Figure 2A). Stepwise increases in expression from SES to PRI- to PRI+ and MET were most evident for MMP remodeling (Figure 2B) and cell motility (Figure 2C) annotations.
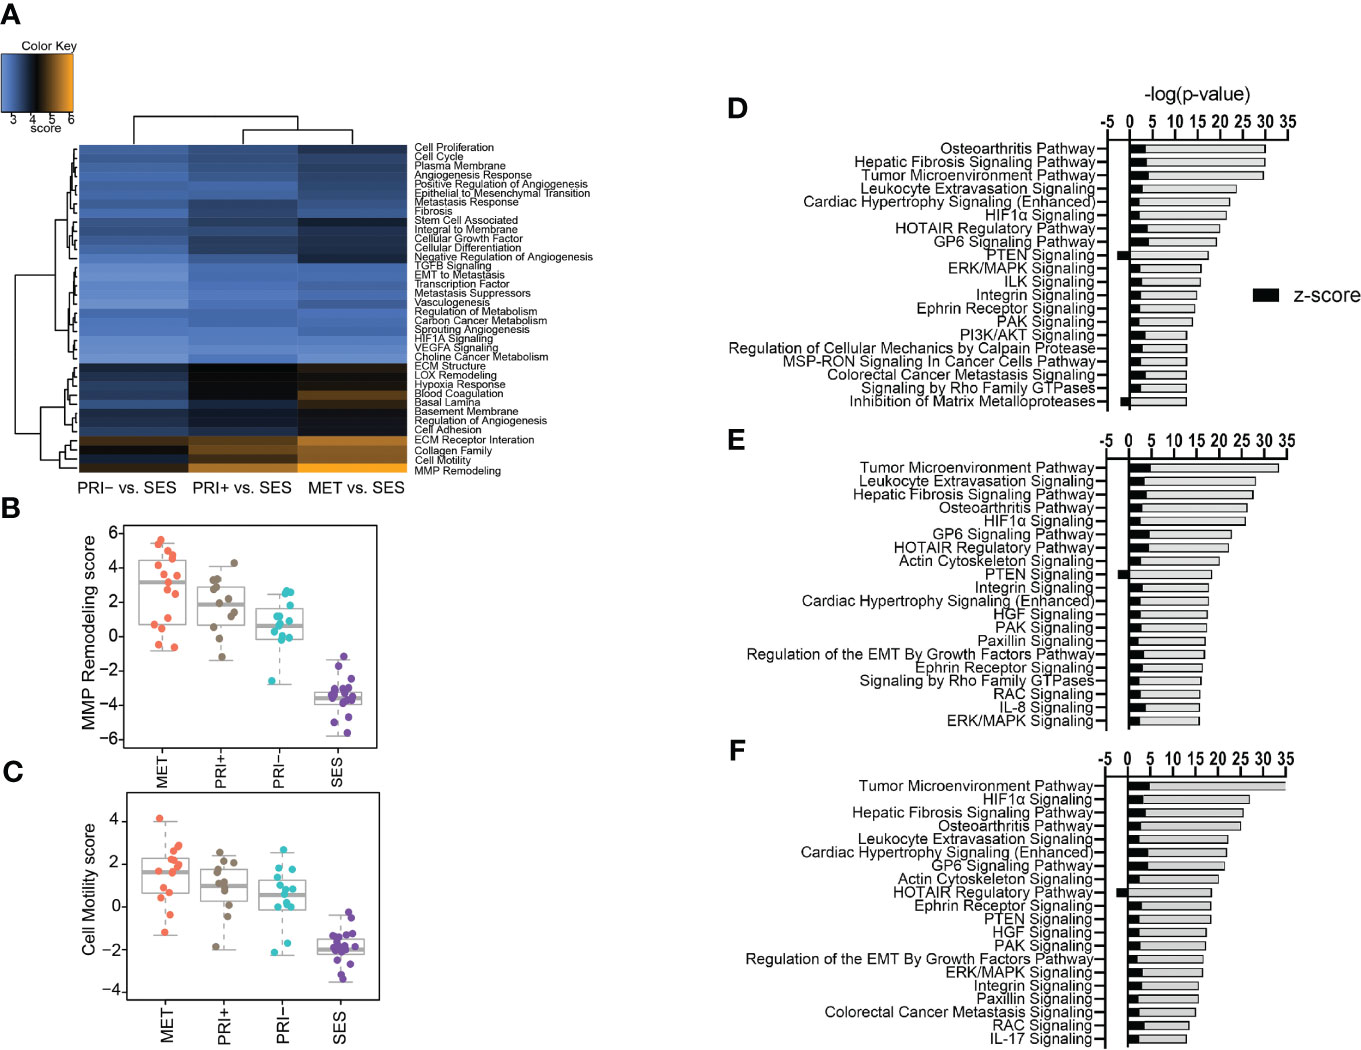
Figure 2 Pathway analyses of tumors vs. SES. (A) Heatmap of global significance scores of cancer progression gene annotations generated using nSolver Advanced Analysis software 2.0 (orange denotes gene sets whose genes exhibit extensive differential expression with the covariate (SES), blue denotes less differential expression). (B, C) Boxplots showing pathway scores (y-axis; fit using the first principal component of each gene set’s data) for two of the top differentially expressed cancer pathways specified in the heatmap. (D–F) Top 20 activated and inhibited canonical pathways (refer to Supplementary Data File 3) for (D) MET vs. SES, (E) PRI+ vs. SES, and (F) PRI- vs. SES showing significance level (-log (p-value)) along the x-axis and absolute activation z-score (<-2, >2) along the y-axis.
Ingenuity pathway analysis was then used to categorize the DEGs from the MET vs. SES, PRI+ vs. SES and PRI- vs. SES comparisons into canonical pathways. Significantly enriched canonical pathways [-log(p-value) >1.3, absolute value z-score >2, <-2] and the DEGs in each pathway are listed in Supplementary Data Sheet 3. In all tumor cohorts vs. SES, tumor microenvironment, leukocyte extravasation, hepatic fibrosis signaling pathway, and HIF1α signaling were among the top significantly activated CPs (Figures 2D–F). Significantly inhibited pathways included PTEN signaling (MET/PRI+ vs. SES only) and inhibition of matrix metalloproteinase (MET vs. SES only) (Figure 2F). Activation of leukocyte extravasation, which is the movement of leukocytes from the circulatory system toward a tumor [63], is in line with upregulated cell motility in tumors vs. SES found in our gene set analyses (Figure 2C). In line with other reports comparing cSCC vs. normal sun-exposed skin [64], ECM receptor interaction and interleukin signaling and PI3K/AKT/mTOR signaling were also significantly activated canonical pathways in our analyses (Figures 2D–F).
Integrative gene expression meta-analysis of publicly available invasive/metastatic cSCC (n = 25) vs. normal skin from sun-exposed area (n = 18) array data on the GEO platform (see Table S2 for detailed sample filtering criteria) revealed a total of 127 upregulated and 59 downregulated significant DEGs (Supplementary Data Sheet 4). Comparison of these significantly DEGs with our PRI+ vs. SES dataset found 33 DEGs genes in common (Supplementary Image 2A). Reactome pathway analysis using these shared genes again highlight enrichment of activated pathways affecting extracellular matrix interactions, organization or degradation, collagen family, and interleukin/chemokine signaling (Supplementary Image 2B) as per our independent analyses using nSolver and IPA.
A progressive decrease in the number of significantly DEGs was found between the metastatic (PRI+) compared to non-metastatic (PRI-) tumors vs. MET (Figure 3A). The MET vs. PRI+ comparison revealed 8 significant DEGs while MET vs. PRI- revealed 58 significant DEGs (Figure 3A; Supplementary Data Sheet 2). At these stringent cutoffs, only 3 DEGs were found in the PRI+ vs. PRI- comparison (Supplementary Data Sheet 2) likely due to small sample size and bulk sampling (discussed further below). Using a less stringent cutoff for PRI+ vs. PRI- (p < 0.01 instead of adjp < 0.05), there were 16 significant DEGs (Figure 3A, gray circle). That there were few significant cancer progression gene expression differences between metastatic primaries and metastases suggested that the PRI+ tumors had acquired many of the activated pathways necessary for metastasis. In further support of this, pathway analysis of the six available patients’ specimens with matched MET, PRI+, and SES samples showed that the tumor pairs by and large clustered together and away from SES (Supplementary Image 3).
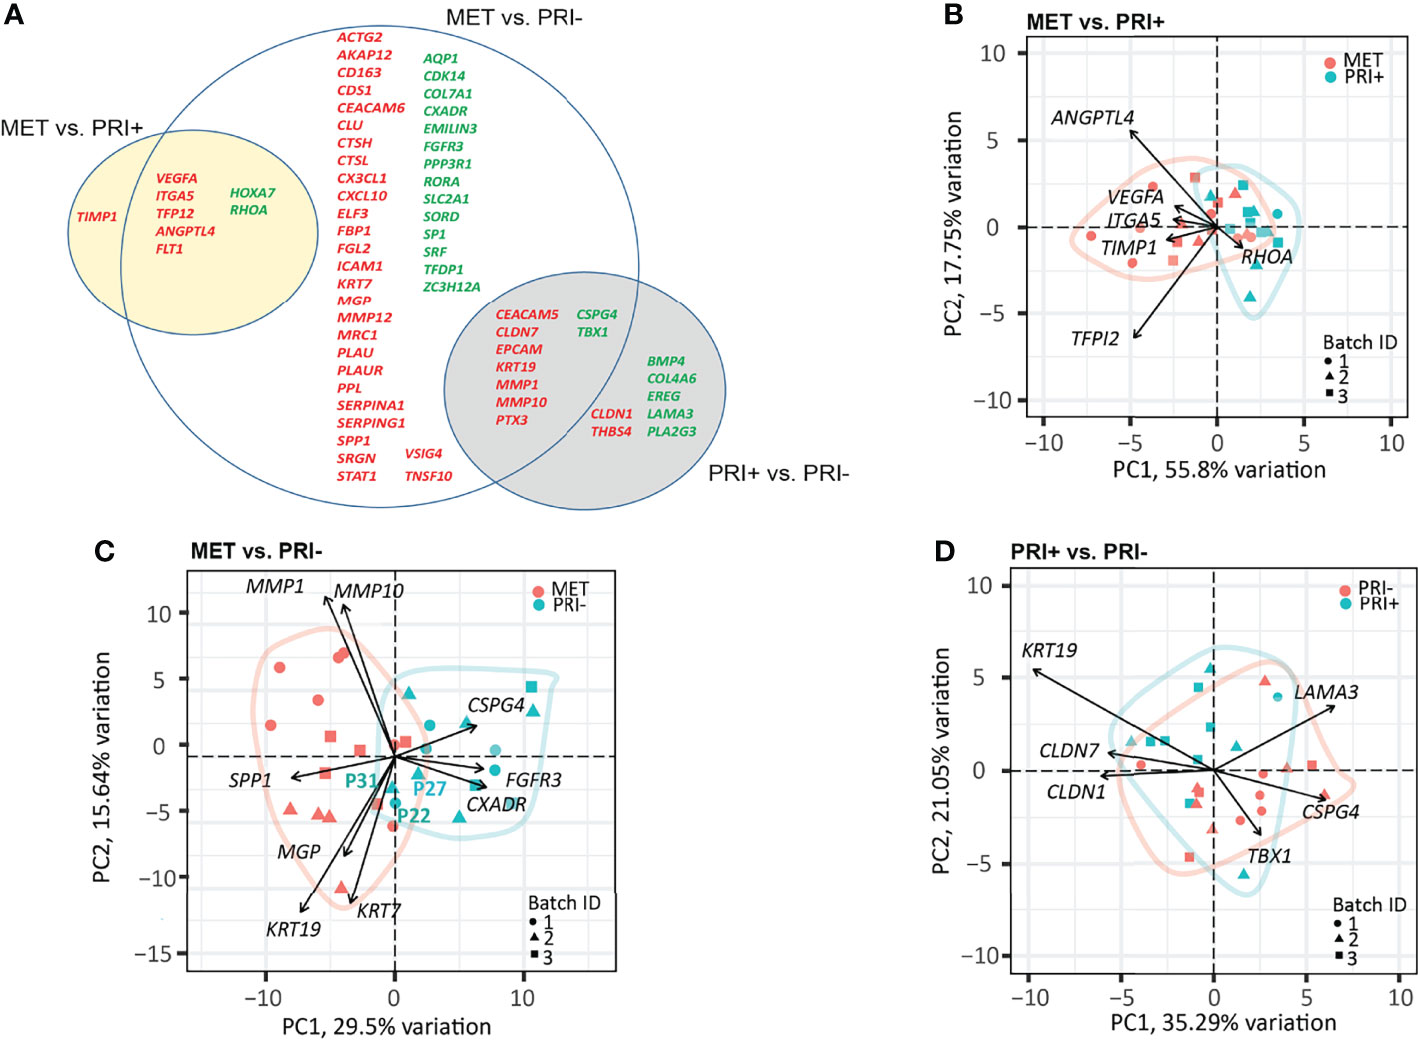
Figure 3 Cancer progression gene panel differential expression analysis between tumor cohorts. (A) Venn diagram depicting DEGs with log2 fold change ≥1 or ≤-1 between MET vs. PRI+ and MET vs. PRI- (adjusted p-values <0.05), and PRI+ vs. PRI- (p-values <0.01). Upregulated (red) and downregulated (green) DEGs for each pairwise comparison are indicated. The overlap between the circles show DEGs genes that occur in more than one comparison. (B–D) PCA loading plots based on significant DEGs between (B) MET and PRI+ (8), (C) MET and PRI- (54), and (D) PRI+ and PRI (16). Each symbol corresponds to one sample. Ellipses represent the region where the majority of samples are expected to fall. Non-overlapping ellipses imply that gene expression profiles cluster groups apart based on their distinct principal component scores. Batch ID symbols indicate samples analyzed in different NanoString runs and show lack of batch effect.
Of the 8 significantly DEGs between MET and PRI+, only one (TIMP1) was not shared with the MET vs. PRI- grouped cohort comparison (Figure 3A). Although TIMP1 encodes an inhibitor of MMPs, elevated expression of TIMP1 has been reported in head and neck SCCs (54–60) and has been shown to stimulate cell proliferation and prevent apoptosis (61). A PCA loading plot using these 8 significant DEGs (Figure 3B) indicates that ANGPTL4 (encodes angiopoietin) and TFPI2 (encodes tissue factor inhibitor 2) exert the largest effects on PC1 and PC2 (followed by VEGFA, ITGA5, TIMP1, and RHOA). These genes are involved in various functions that promote either angiogenesis, cell adhesions or motility, protection from anoikis, matrix remodeling, or epithelial–mesenchymal transition (EMT) and are known to play important roles in the metastatic process in several cancers (62). Interestingly, ITGA5, which is also a classic EMT marker enriched on tumor-specific keratinocyte (TSK) subsets of metastatic cSCC (9) and upregulated in various cancers (63), showed a stepwise increase in expression from SES to PRI, to PRI+ to MET (Supplementary Image 4).
Although the MET and PRI- cohorts could be separated using the 58 significant DEGs from the MET vs. PRI- comparison, a few PRI- specimens (P22 and P31 in particular) clustered with the MET cohort (Figure 3C). A closer examination of the clinicopathological characteristics of these specimens found these to be from patients with high-risk features such as either recurrences or PNI. PCA loadings show that the genes exerting the largest effects include MMP1 and MMP10, KRT7, and KRT19 (Figure 3C), high levels of which in other cancers have been associated with unfavorable prognosis (64). Another example is SPP1, which encodes a stromal cell ligand shown to interact with integrin receptors encoded by ITGB1 and ITGA5, which are both enriched on TSKs (9).
Of the 16 significant DEGs between PRI+ vs. PRI-, the majority were shared with the MET vs. PRI- comparison (Figure 3A). These genes feature MMPs (MMP10), cell differentiation and adhesion markers (KRT19, CEACAM5), and cell polarity and signal transducers (CLND7). While these genes exerted the largest effects on PRI+ as assessed by PCA loadings (Figure 3D), these cohorts were not distinguishable, possibly due to intra-tumoral heterogeneity and/or the particular area of primary tumor sampled.
To further investigate the molecular mechanisms underlying cSCC progression, the IPA downstream effect analysis function was used to identify diseases and function activation status, given the observed differential gene expression data described above. A relatively small number of significantly activated functions (p-value > 9.89E-10, z-score > 2) were evident in MET vs. PRI+, and these were broadly associated with cellular movement (Supplementary Image 5A; Supplementary Data Sheet 5). Notably, functions associated with cell death and survival were either significantly decreased or inactivated (e.g., apoptosis/anoikis of tumor cell lines) or activated (e.g., cell viability). A larger number of significantly activated functions were found in MET vs. PRI- (Supplementary Image 5B; Supplementary Data Sheet 5) with top-scoring functional categories most strongly associated with cellular movement (inclusive of invasion/migration of cells, leucocyte migration, chemotaxis) and cell-to-cell signaling and interaction. Cellular movement was the main functional category predicted to be activated in the PRI+ vs. PRI- comparison (inclusive of migration of keratinocytes and fibroblasts); however, functions related to inflammatory response was the top activated category (Figure 5C; Supplementary Data Sheet 5).
We then used the Upstream Analysis and Causal Network module of IPA to understand how the abovementioned functions might be regulated in our dataset by activated or inhibited upstream regulators. Supplementary Data Sheet 6 lists all the predicted activated or inhibited master regulators (z-score >2, <-2) which are hypothesized to control the expression of our dataset molecules either directly or indirectly through other regulators. Of these, IL1RN (interleukin 1 receptor antagonist) is predicted to be a significantly inhibited master regulator contributing to the gene expression changes seen in MET vs. primary (PRI+ or PRI) tumors. IL1RN acts indirectly on downstream targets distinguishing MET from PRI+ by mediating the activity of intermediary regulators including TGFB1 (an important TSK/EMT marker) and the inflammatory cytokines TNF, IFNG, and IL1 (with high confidence of activation) (Figure 4A). This then leads to the upregulation of VEGFA, TIMP1, SPP1, ITGA5, and CEACAM5, all known to be associated with increased invasiveness (9, 56, 65), and downregulation of various genes including the tumor-suppressor APC (APC regulator of WNT signaling pathway). Altogether, this is predicted to increase the neoplasia of tumor cells, migration of tumor and leukocytes, and decrease apoptosis of tumor cell lines (Figure 4A). In MET vs. PRI-, IL1RN acts directly on downstream targets such as VEGFA, TIMP1, SPP1, and MMP1 and the stem cell gene CD44 (Supplementary Data Sheet 6).
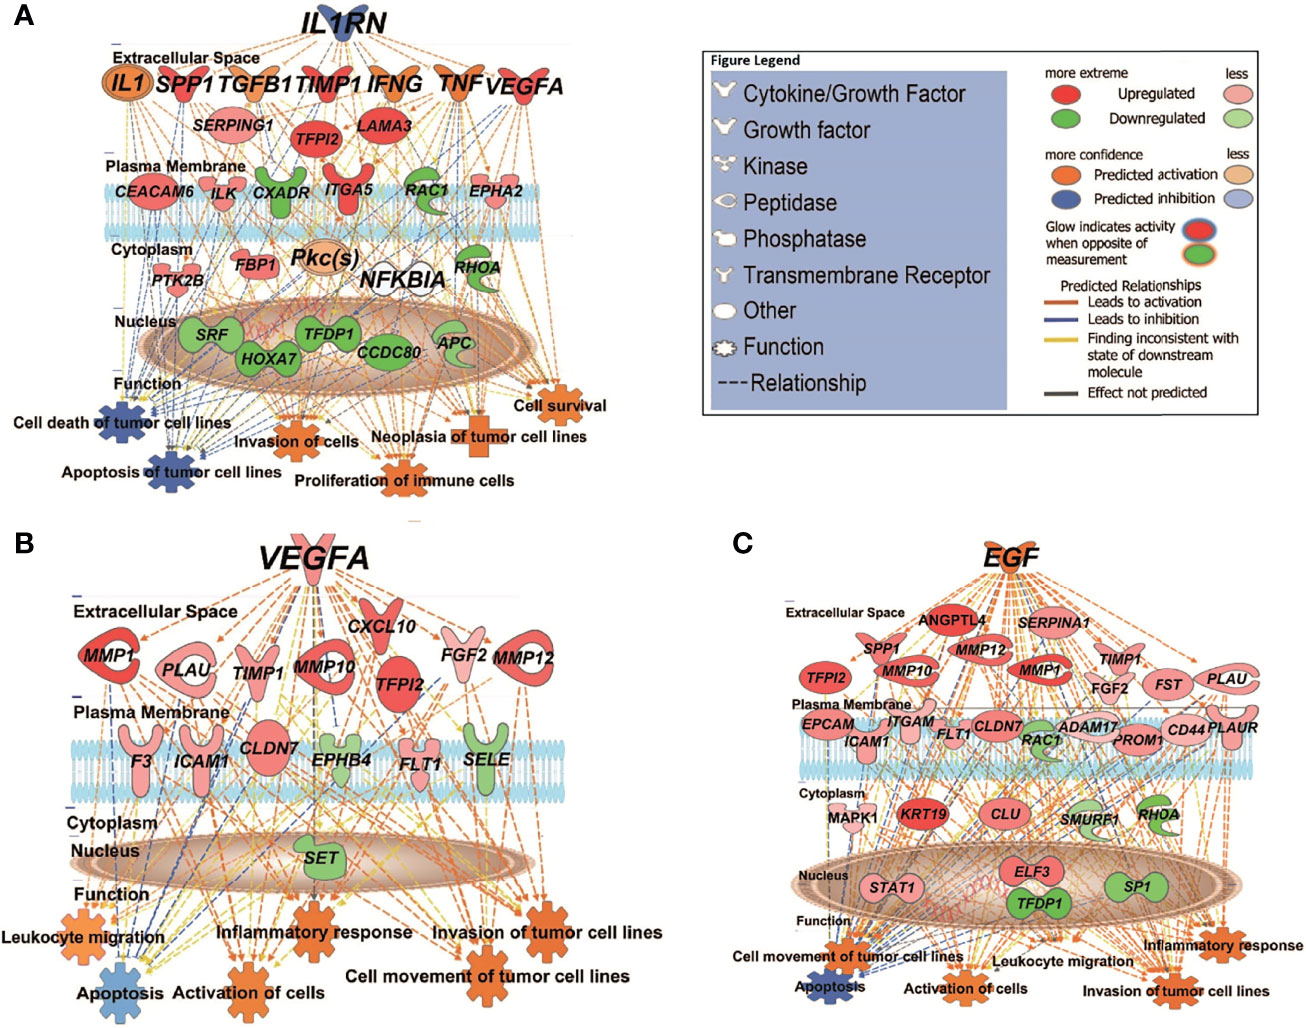
Figure 4 IPA causal network analysis depicting the interactions between upstream regulators, downstream genes, and physiological functions in cSCC. (A) MET vs. PRI+ comparison showing effect of predicted master regulator IL1RN (depth: 2). (B, C) MET vs. PRI- comparison showing predicted master regulators VEGFA (depth: 1) and EGF (depth: 1). Master regulators were predicted based on the causal paths known to influence the expression of their target genes leading to the physiological functions shown. Regulators with depth of 2 influence the expression of target genes via other regulators. Figure legend indicates whether genes were upregulated or downregulated in MET relative to PRI tumors; the predicted activation state of the upstream regulators, and the predicted relationships between these and downstream genes and functions.
VEGFA (vascular endothelial growth factor A) and EGF (epidermal growth factor) are predicted to be significantly activated master regulators driving differential gene expression in MET vs. PRI- (Supplementary Data Sheet 6). Both growth factors are known stimulators of uPAR mRNA expression (23). Figure 4B demonstrates the VEGFA-mediated upregulation of genes involved in ECM interaction and MMP remodeling (also TSK-specific genes (9)) such as MMP1, MMP10, MMP12, PLAU, and CXCL10 in MET, as well as FLT1 (encodes VEGFA receptor), which in turn promote metastatic functions such as angiogenesis, growth, migration and invasion, and evasion of apoptosis. Figure 4C demonstrates the EGF-mediated upregulation of genes of an overlapping subset of genes as well as PLAUR, VEGFA, and KRT19 and a variety of transcription factors in MET. EGFR mRNA levels were high in all cohorts, and there was no significant differential expression in any of the tumor comparison or in tumor vs. SES (Supplementary Data Sheet 2).
In PRI+ vs. PRI- analysis, JAG1 (encodes Jagged Canonical Notch Ligand 1) appeared as one of the main activated master regulators (z-score = 2.668, p = 6.43E-10) predicted to act through AKT, EGFR, ERK1/2, NOTCH1, and TCF7L2 leading to the expression of matrix remodeling genes MMP1, MMP10, ICAM1, and PLAUR (Supplementary Data Sheet 6), possibly from TSKs sampled from the leading edge of PRI+ tumors.
Given the upregulation of the genes for uPA and its receptor uPAR in metastatic tumors compared to PRI- and SES (see also Supplementary Image 4) and their contribution to tumor progression through different pathways and functions, we examined spatially localized uPAR protein levels in an extended cohort of cSCC tumors of the head and neck. Figure 5A shows an example of membranous staining typically found in MET specimens (from lymph node deposits). Interestingly, a positively stained tumor embolus was captured in-transit in a lymphatic vessel (Figure 5B), highlighting the upregulation of uPAR on invasive and metastatic tumor cells. uPAR was found to be highly tumor-specific, with increased staining in the tumor compartment, particularly at the leading edge of tumors, with absence of staining in SES (Supplementary Image 6). Analysis of the staining scores (Table S3) found significantly increased uPAR staining in MET tissues compared to PRI+ and PRI- (p = 0.0255 and <0.0001, respectively) (Figure 5C). The staining intensity was generally higher in PRI+ than in PRI-, but this was not statistically significant (Figure 5C) potentially due to the effects of an outlier in the PRI- group with high uPAR staining (Patient 37, Table S3). This specimen was characterized to be a highly invasive 160-mm-diameter × 70-mm-thick exophytic primary tumor in the scalp as opposed to other PRI- tumors with less than 20-mm depth of invasion (Figure 5C).
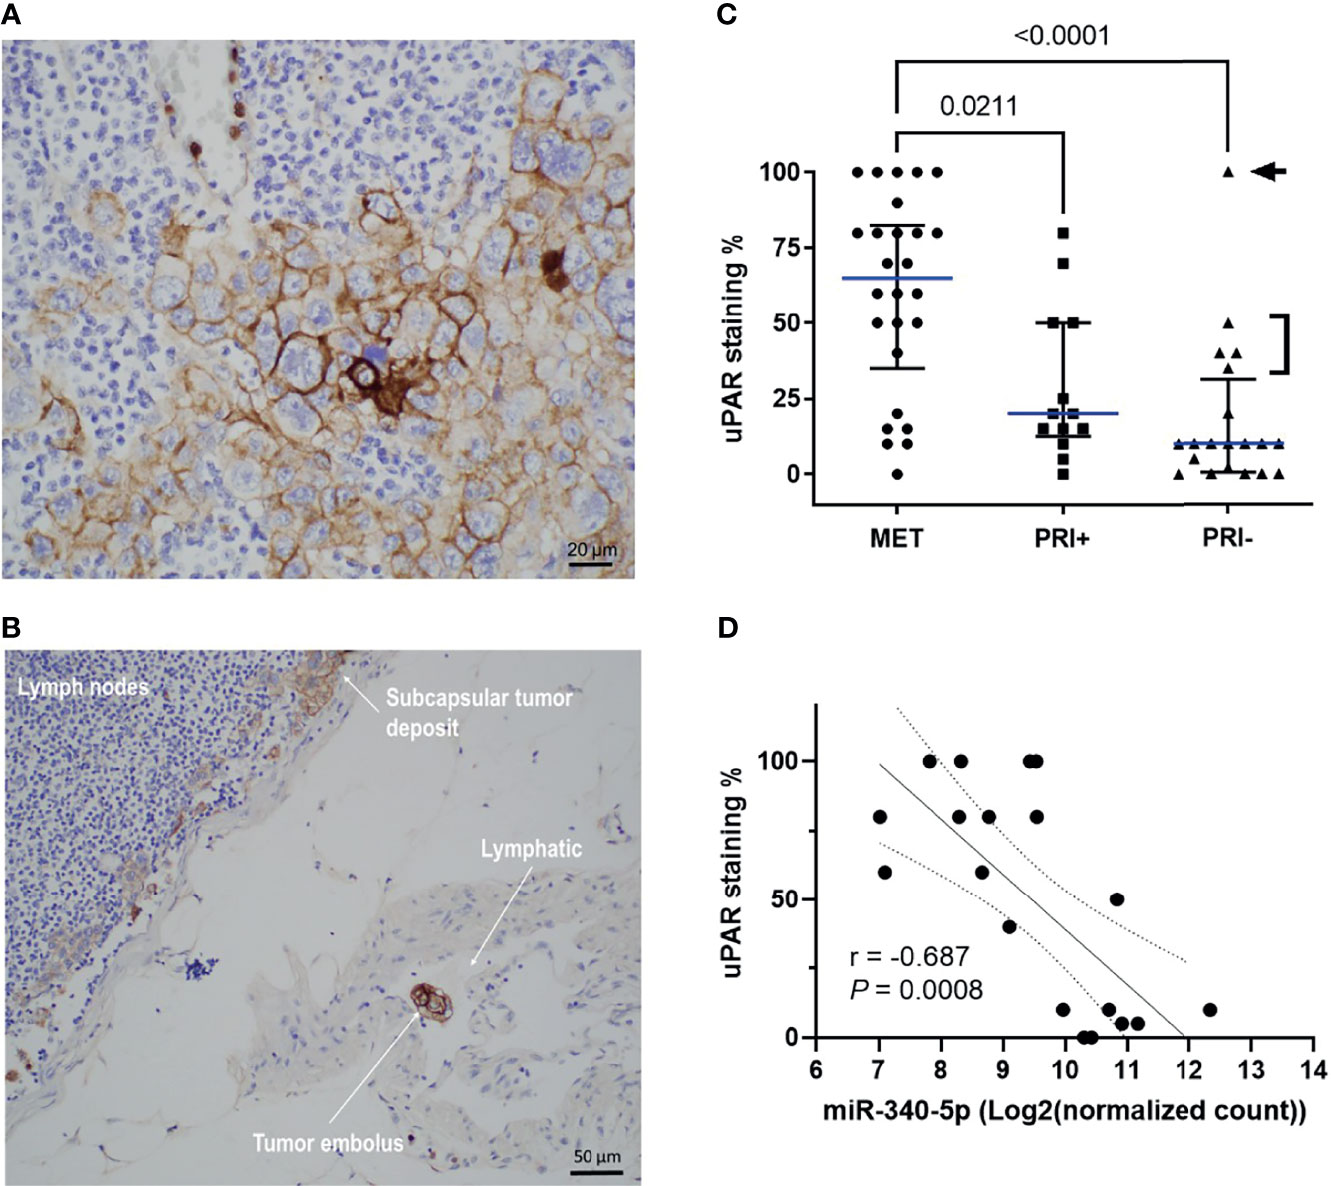
Figure 5 uPAR protein expression is increased on metastatic tumors and correlates with miRNA-340-5p expression. Representative photomicrographs showing uPAR staining in (A) a metastatic deposit in the lymph node of Patient 2 and (B) a positively stained embolus as well as staining in the subcapsular tumor deposit from the lymphatic of patient 2. (C) Scatter plot of uPAR IHC scores of all patient specimens stained (n = 58 total) showing cohort median values (blue line) with interquartile ranges (refer to Table S3 for individual patient values). p-values shown were derived using a Kruskal–Wallis test for multiple comparisons with uncorrected Dunn’s posttest. Arrowhead denotes patient 37 who had a 160 mm diameter × 70 mm thick PRI-. Bracket denotes PRI- tumors with >50-mm diameter and PNI. (D) Scatter plot showing relationship between uPAR staining scores and hsa-miR-340-5p normalized gene count (n = 20 pairs; refer to Table S6) and show Rho (Spearman’s) correlation, p-value, and interquartile range for the correlation.
To assess the potential regulation of PLAUR expression by miRNAs in cSCC, we extracted PLAUR targeting miRNAs from the miRDB based on the target prediction score of >75 (high confidence; Table S4) and then from a list of experimentally confirmed miRNA-PLAUR interactions compiled from miRTARBASE (Table S5). Of these lists, only hsa-miR-340-5p and hsa-miR-377-3p from the miRDB list showed a statistically significant differential expression between MET and combined PRI tumor cohorts with both miRNAs being significantly downregulated in MET (Table S6). By computing two-tailed Pearson correlation coefficients, the strongest significant negative correlation was found between miR-340-5p and uPAR staining intensity for our dataset (Figure 5D). No significant correlation was found between miR-340-5p and PLAUR mRNA expression (data not shown). Interestingly, the expression of both miRNAs and uPAR protein was much higher and lower, respectively, in MET04 than the remainder of the cohort (Table S6). In contrast, PRI+02, with 100% positivity for uPAR staining, expressed much lower levels of both miRNAs than the other primary tumors.
Given that uPAR levels were increased on metastatic vs. non metastatic tumors and that EGF was identified as a master regulator leading to PLAUR upregulation, we sought to confirm this relationship in vitro using a metastatic cSCC cell line derived from a lymph node deposit, UW-CSCC2 (Patient 40, Table S3) (52). These cells constitutively express EGFR (Figure 6A) (but did not harbor EGFR mutations or copy number variations, data not shown) and responded to exogenous 5–20 ng/ml EGF with increased cell migration (Figure 6B) and uPAR protein levels (Figure 6C) compared to untreated cells. Treatment with the EGFR tyrosine kinase inhibitor gefitinib, even in the presence of 20 ng/ml EGF, significantly inhibited wound closure with respect to both control and EGF-treated cells (Figure 6B). uPAR expression levels were also significantly decreased (Figure 6C). A second metastatic cSCC cell line (UW-CSCC1; Patient 17, Table S3) was found to be similarly affected by EGF/R stimulation and inhibition (data not shown).
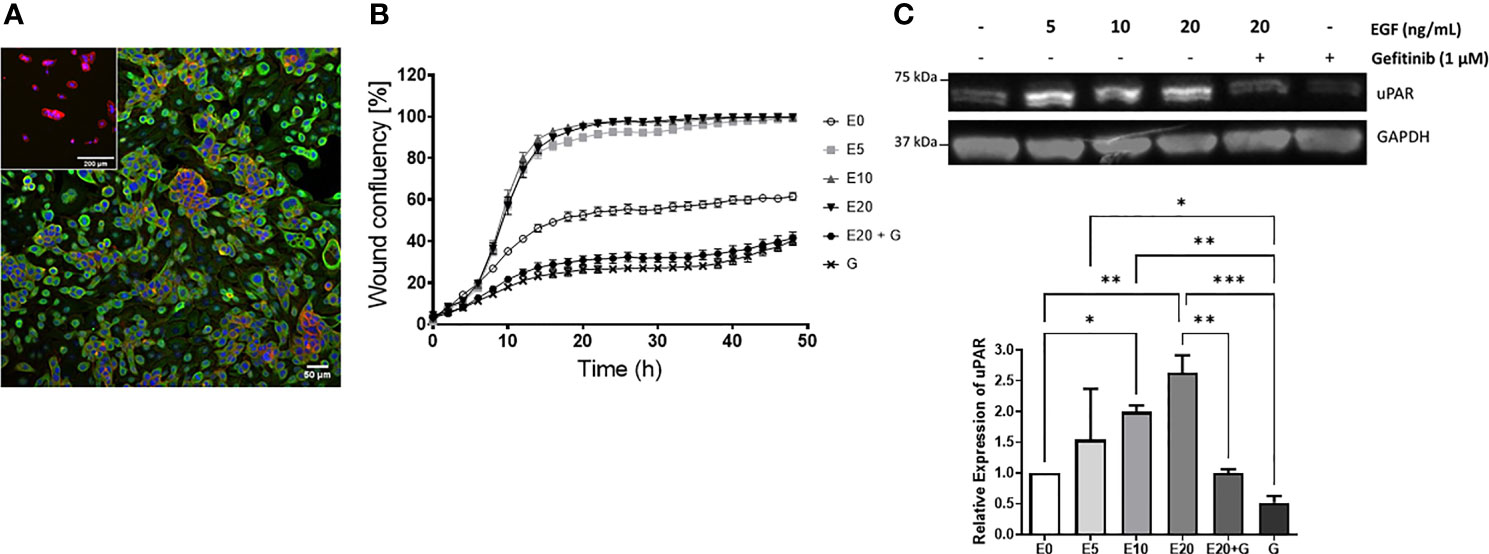
Figure 6 EGF upregulation of cSCC cell line motility and uPAR expression. (A) Immunocytochemical image of UW-CSCC2 cells stained with anti-EGFR antibody (green) or anti-mouse IgG negative control (inset) and counterstained with RedDot (blue) and ActinRed 555 (red). (B) Representative in vitro scratch wound healing assay showing effect of EGF E ± EGFR inhibitor gefitinib G on simple migration of UW-CSCC2 cells. Values shown are mean ± SEM, n = 5; all treatment groups were significantly different from untreated controls p-value < 0.05, all gefitinib treatment groups significantly different to EGF only treatment groups p-value < 0.001; ordinary one-way ANOVA with Dunnett’s post-test. (C) Representative Western blot (right panel) demonstrating UW-CSCC2 uPAR levels in response to 24-h pretreatment with EGF ± gefitinib, at concentrations shown. Panel below: densitometry analysis showing the ratios of uPAR/GAPDH (used as a total protein loading control) for each treatment relative to no EGF control. Significance values are shown with *p-value < 0.05; **p-value < 0.01; ***p-value < 0.001.
Dysregulated activation of extracellular proteolytic networks is strongly linked to mechanisms that enable tumor invasion and metastasis. Our cSCC cohort gene expression and pathway enrichment analyses using various methodologies strongly implicate ECM remodeling and interactions allowing cell motility as among the most significant activated pathways and functions, with stepwise increases in activation from SES to metastatic cSCC. Further, we identified the growth factors EGF and VEGF-A as potential master regulators that concordantly upregulate the expression of ECM remodeling genes encoding uPA/R and MMPs—well-recognized metastasis driver proteases in many cancer types. Figure 7 summarizes the key molecular alterations we found in MET/PRI+ compared to PRI-/SES which center on the urokinase plasminogen activation system.
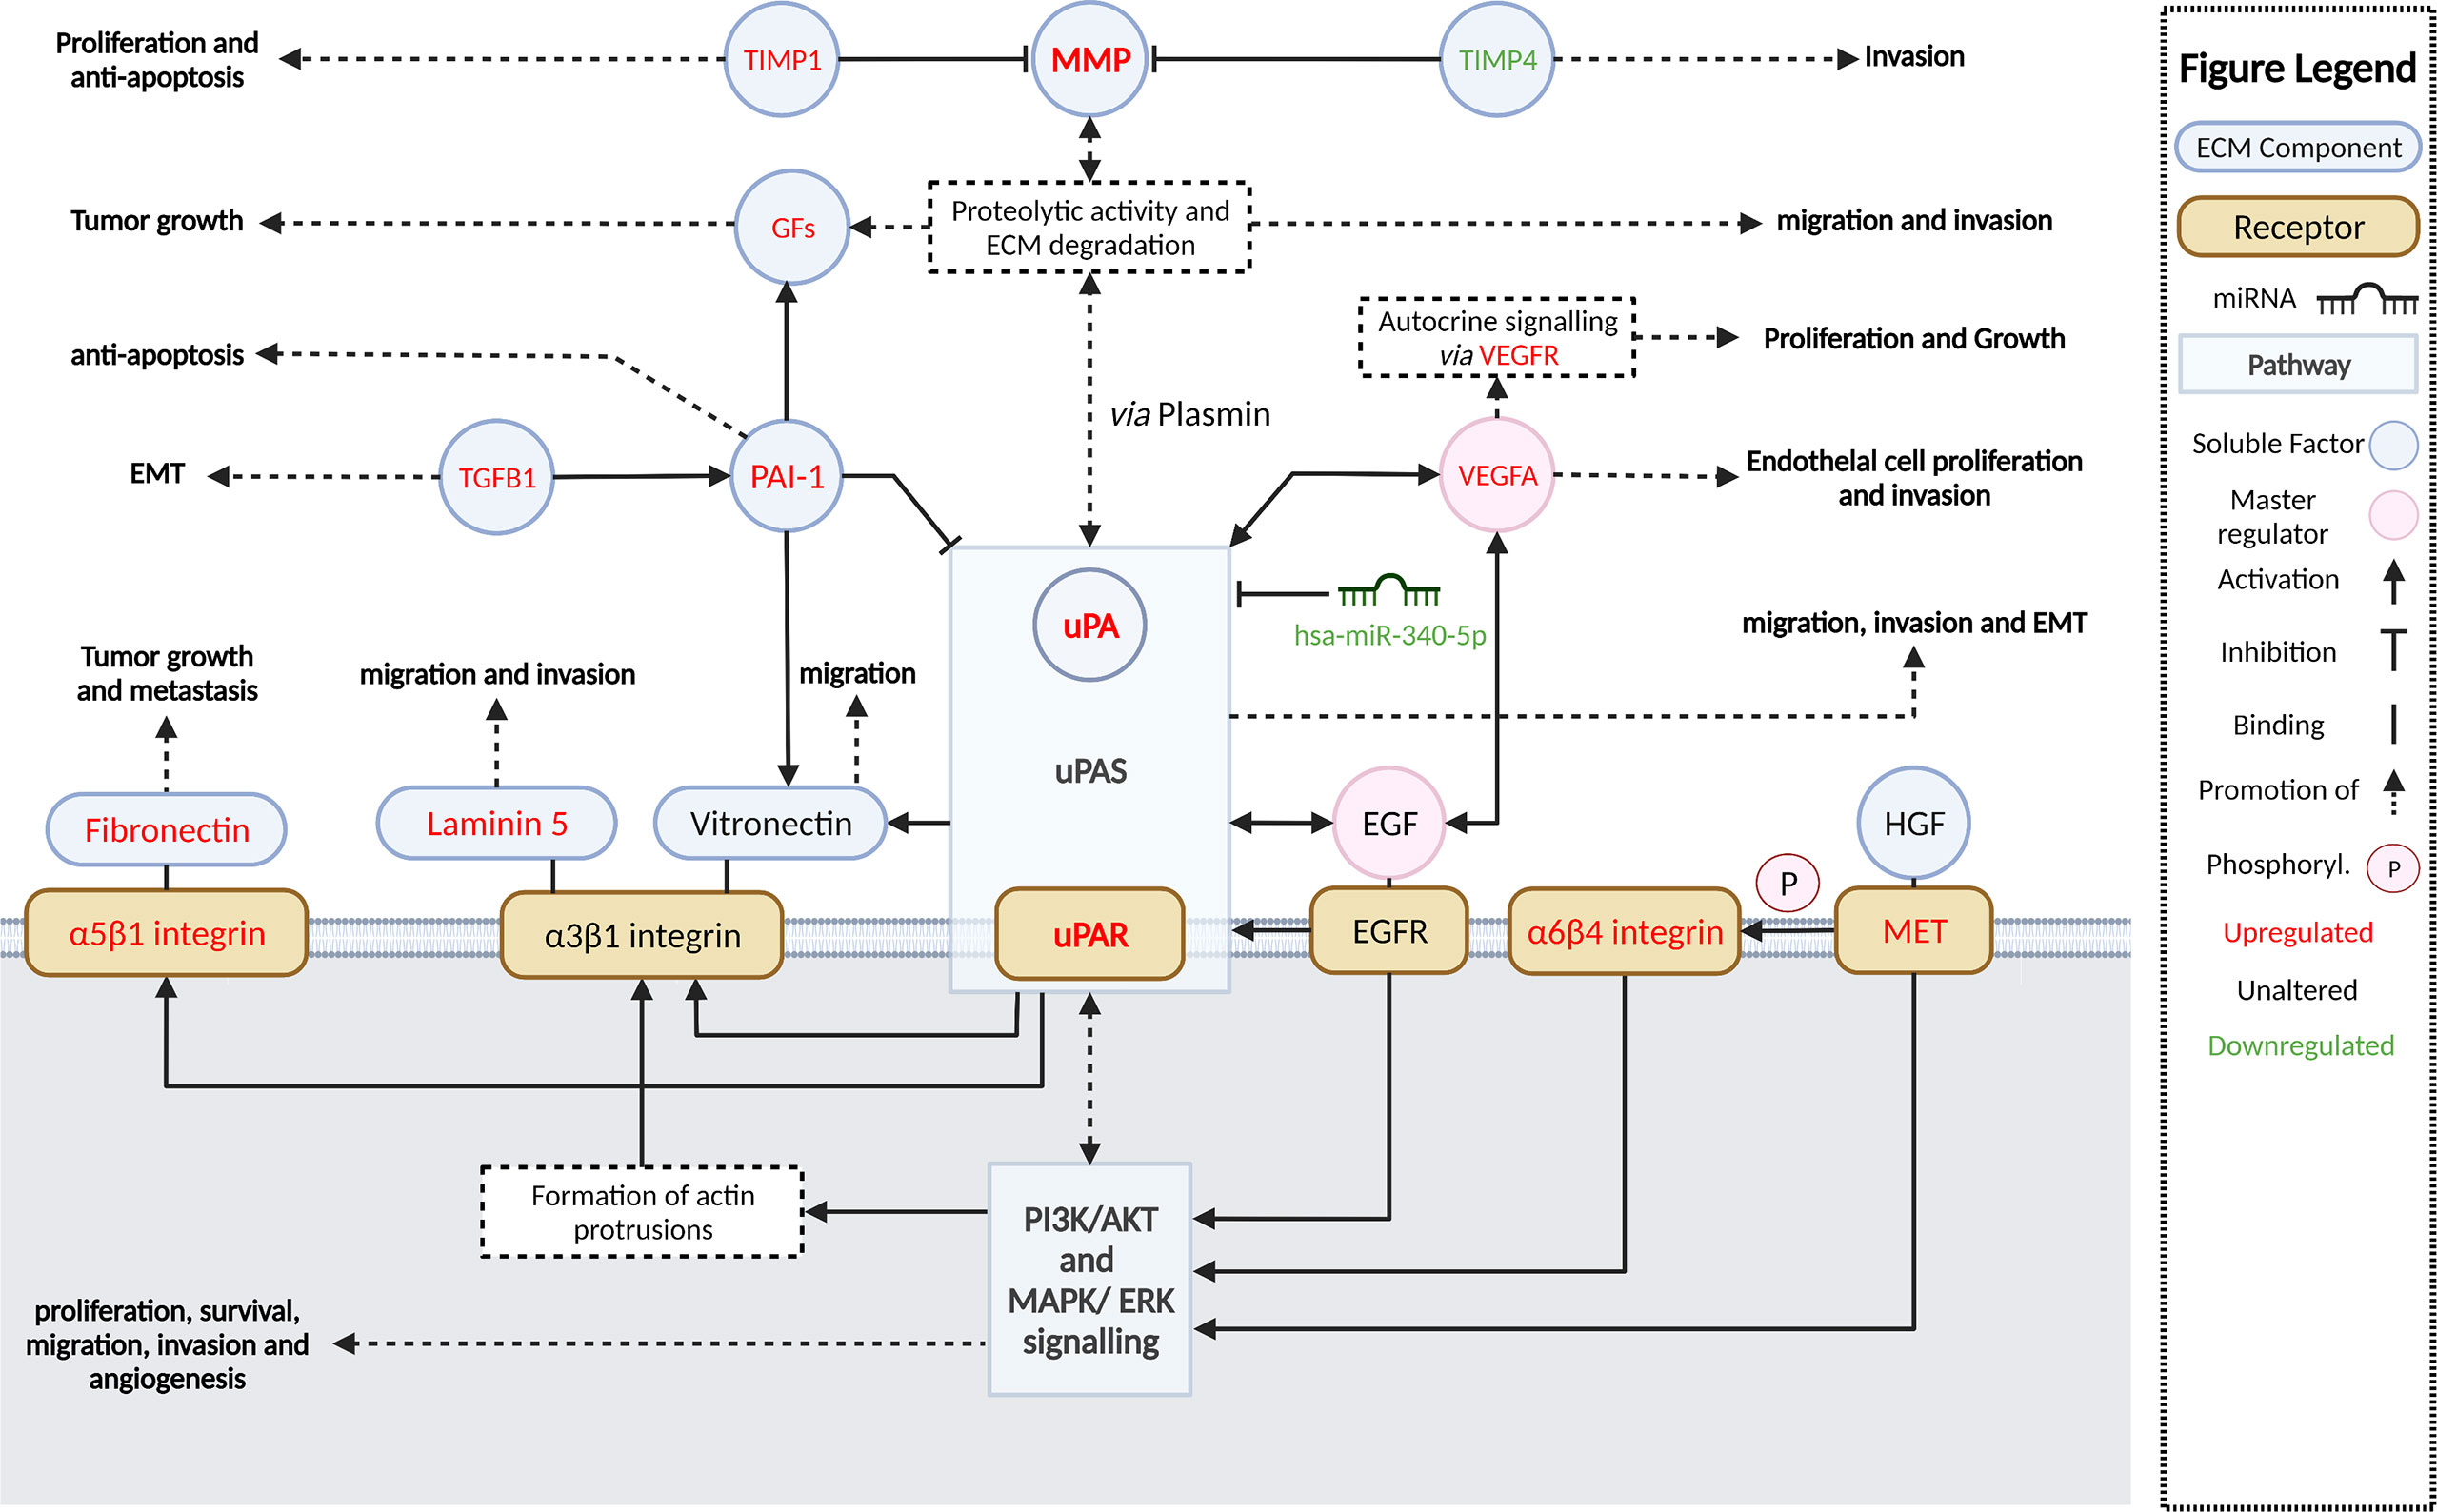
Figure 7 Summary and schematic illustration of key pathways and regulators identified as up- or downregulated in metastatic versus non-metastatic tumors or SES in this study. The urokinase plasminogen activator system (uPAS) plays a central role in remodeling the extracellular matrix (ECM) promoting metastasis. The uPAS exerts its activity by enhanced uPA-mediated conversion of co-localized plasminogen to plasmin and subsequent activation of matrix metalloproteases (MMP). PAI-1 (SERPINE1) can inhibit uPA activity but is also upregulated and contributes to cell signaling. MMPs and plasmin cleave and remodel the ECM leading to the release of latent growth factors (GFs) such as EGF, VEGF-A, TGF-β, and HGF (hepatocyte growth factor). By binding to their cognate receptors, EGFR and VEGFR (encoded by FLT1), and c-MET, these growth factors in turn act as important upregulators of the uPAS (via uPAR) and other downstream effectors, which induce large-scale cellular changes that further promote ECM remodeling, cellular migration, and invasion and, ultimately, metastasis. A few of these growth factor receptors are themselves overexpressed (i.e., MET, FLT1) and can drive invasion and metastasis regardless of growth factor activation. Aberrant miRNA expression, such as downregulated has-miR-340-5p, is also associated with upregulated uPAR expression. Direct and indirect downstream effectors of the uPAS include vitronectin, focal adhesions via integrins and focal adhesion kinase (FAK), the proliferation, and survival pathways MAPK/ERK PI3K/Akt/mTOR and VEGF-A, which facilitate increased protection against apoptosis/anoikis, increased cell proliferation, and EMT and angiogenesis; these are also important for invasion and metastasis. Created with BioRender.com.
The upregulation of plasminogen activation family members and MMPs has been reported in previous studies using squamous cell carcinomas, including those of the skin (33, 35, 51, 54, 57, 66–69) (Table S1). It was thus not surprising that PLAU and MMP genes were among the highest DEGs in all tumors vs. SES comparisons in our cSCC cohort. However, the quantifiable stepwise increase in expression from SES to PRI- to PRI+/MET has not been previously reported in cSCC derived exclusively from the head and neck. Correspondingly, uPAR protein levels were significantly increased in metastases and this was corroborated by our identification of a significant negative correlation (correlation coefficient <-0.60) between hsa-miR-340-5p and uPAR staining, suggesting that this miRNA plays a role in silencing PLAUR at a posttranscriptional level. While several miRNAs have been reported to modulate uPAR expression in a variety of diseases (Tables S4, S5), this particular miRNA–target interaction is a novel finding in cSCC and should be functionally validated in future studies. Interestingly, SERPINE1 (encodes plasminogen activator inhibitor type 1, a potent inhibitor of uPAR-bound uPA) was also upregulated in all our tumor cohorts (refer to Supplementary Data Sheet 2). This is of note because combined upregulated PLAU and SERPINE1 expression is strongly associated with poor cancer outcomes in various other cancers via mechanisms that affect cell adhesion, ECM remodeling, and signaling pathways leading to increased cell survival, migration, invasion, and angiogenesis (21, 23, 70–73).
In a study by Ji et al., single-cell RNA sequencing with spatial transcriptomics identified four subpopulations of keratinocytes within primary cSCCs with a specific TSK subpopulation localized to the leading edge (9). The gene signature of the TSKs is uniquely linked to EMT, cellular movement, and extracellular matrix disassembly, suggestive of invasive behavior and that these cells are responsible for metastasis (9). The presence of these subpopulations may explain why our bulk tumor analysis of DEG in PRI+ vs. PRI- could not effectively distinguish the two groups, despite sampling from areas of high tumor cellularity at the leading edge. While bulk tumor analysis represents a limitation of our study, nonetheless we identified significant upregulation of key TSK signature genes, in particular PLAU, MMP1 and MMP10, ITGA5 in MET vs. PRI- and PRI+ vs. PRI-. Interestingly, of these important TSK genes only MMP10 is included in a 40-gene expression profile test that was recently shown to identify cSCC patients’ risk of metastasis (74). Nevertheless, these genes together with many other genes that were upregulated in MET/PRI+ vs. PRI- have known functions in ECM adhesion and remodeling (e.g., PLAUR, SPP1, MMP12) and/or cell proliferation and motility (e.g., STAT1 and CXCL10). In concordance with the primary cytokine activation signature observed in our Reactome enrichment analyses, Ji et al. (9) and others (75) also identified elevated expression of key components of the JAK-STAT pathway (e.g., STAT1) and various inflammatory cytokine genes in invasive cSCC. We also identified upregulation of genes encoding the macrophage and CAF ligands, secreted phosphoprotein 1 (SPP1), and fibronectin (FN1) which have been shown to interact with the TSK receptors integrin subunit beta 1 (ITGB1) and subunit alpha 3 or 5 (ITGA3, ITGA5), respectively, in cSCC (9). This likely reflects the presence of stromal cells in our samples and aberrant tumor–stroma interactions. Notably, a high expression of ITGB1 and PLAU has been shown to be associated with reduced progression-free survival in clinical trials of anti-PD-1 in lung and head and neck mucosal SCC (9, 76). As both genes were upregulated in metastatic cSCC, this suggests that a similar association may occur in cSCC.
We also found that the matrix metalloproteinase inhibitor genes, TIMP1 and TIMP4, were differentially expressed in metastatic versus non-metastatic/SES tissues. Many studies have reported on the elevated expression of TIMP1 in non-cutaneous head and neck SCC (54–60), but only one of these (56) included any cSCC among their samples. While TIMP4 has been previously reported to be downregulated in non-cutaneous head and neck SCCs (77), we are the first to report the downregulation of TIMP4 in MET and PRI+ compared to SES in cSCC. Further, our finding of a positive and negative association with TIMP1 and TIMP4 expression, respectively, is in line with a previous study comparing their mRNA and protein expression in normal human brain and malignant gliomas (78). Silencing of TIMP4 via hypermethylation of its promoter has been reported in other human cancers (79), with reduced TIMP4 associated with increased angiogenesis (55, 80–82). Epigenetic regulation of TIMP4 might also possibly explain TIMP4 downregulation in metastatic cSCC and should be further explored in future studies.
The activating effects of EGF and VEGF-A on downstream genes including PLAU/R highlights the potential for anti-EGFR- and/or anti-VEGF- with anti-uPA/uPAR-targeting approaches for metastatic cSCC. EGFR inhibition as monotherapy for metastatic cSCC has had moderate success (5), even though EGFR is often overexpressed in cSCC, with one study showing an association with EGFR levels and lymph node progression and tumor cell proliferation (83). In our study, EGFR mRNA counts were generally equally high across all tumor cohorts and SES suggesting no relationship with tumor status (data not shown) but rather that the presence of high levels of active EGF (and VEGF-A) in the pericellular space of metastatic tumors may be responsible for enhanced stimulation of EGFR-mediated signaling pathways (Figure 7). This would contribute to EGFR drug resistance mechanisms through stimulation of compensatory signaling pathways (5) in metastatic cSCC and drive overexpression of downstream targets, including PLAU/R and MMP genes, promoting functions linked to cell invasion such as cell motility. The latter was functionally validated in our EGFR-expressing cell line models. Notably, gefitinib significantly inhibited uPAR expression and cell migration, further supporting EGFR tyrosine kinase activation as a mechanism driving uPAR overexpression. Further, as PLAUR overexpression was shown to induce gefitinib resistance through the EGFR/p-AKT/surviving signaling pathway in cell models of human lung adenocarcinoma (84), strategies that downregulate PLAUR could also be explored to avoid EGFR-targeted resistance mechanisms.
In conclusion, our integrated analysis of the mRNA, miRNA, and uPAR protein expression in a well-characterized spectrum of disease states provides a comprehensive evaluation of the pathways that promote metastasis in cSCC of the head and neck (Figure 7). The central role of uPA/R as a biomarker of cSCC metastasis should be further explored using larger cohort studies and with functional studies using metastasis models of cSCC in vivo. Combinations of drugs targeting uPA/R and EGFR and/or angiogenesis could be novel therapeutic strategies for metastatic cSCC.
The original contributions presented in the study are included in the article/Supplementary Material. Further inquiries can be directed to the corresponding author.
The studies involving human participants were reviewed and approved by the University of Wollongong Health and Medical Human Research Ethics Committee. Written informed consent for participation was not required for this study in accordance with the national legislation and the institutional requirements.
EM, AT, BG, and JP performed and analyzed the gene expression and cell-based experiments and wrote drafts of the manuscripts. SM, JM, and RG compiled and analyzed the clinciopath data and provided specimens. RG performed and analyzed IHC data. BA, JC, and MR conceived and designed the project. MR revised and edited the manuscript and figures. BA and JC edited the finalized the manuscript. BA, JC, RG and MR acquired funding. All authors contributed to the article and approved the submitted version.
EM was supported by a CONCERT Translational Cancer Research Centre grant 13/TRC/1-01 to MR. The Sydney Head and Neck Cancer Institute contributed toward NanoString reagents. JP was supported by a NHMRC Ideas Grant APP1181179 awarded to MR, BA, and RG.
The authors declare that the research was conducted in the absence of any commercial or financial relationships that could be construed as a potential conflict of interest.
All claims expressed in this article are solely those of the authors and do not necessarily represent those of their affiliated organizations, or those of the publisher, the editors and the reviewers. Any product that may be evaluated in this article, or claim that may be made by its manufacturer, is not guaranteed or endorsed by the publisher.
We thank the Illawarra Cancer Carers for their generous donations that helped support this research and the Sydney Head and Neck Cancer Biobank.
The Supplementary Material for this article can be found online at: https://www.frontiersin.org/articles/10.3389/fonc.2022.835929/full#supplementary-material
1. Ashford BG, Clark J, Gupta R, Iyer NG, Yu B, Ranson M. Reviewing the Genetic Alterations in High-Risk Cutaneous Squamous Cell Carcinoma: A Search for Prognostic Markers and Therapeutic Targets. Head Neck (2017) 39(7):1462–9. doi: 10.1002/hed.24765
2. Perera E, Gnaneswaran N, Staines C, Win AK, Sinclair R. Incidence and Prevalence of Non-Melanoma Skin Cancer in Australia: A Systematic Review. Australas J Dermatol (2015) 56(4):258–67. doi: 10.1111/ajd.12282
3. Pondicherry A, Martin R, Meredith I, Rolfe J, Emanuel P, Elwood M. The Burden of Non-Melanoma Skin Cancers in Auckland, New Zealand. Australas J Dermatol (2018) 59(3):210–3. doi: 10.1111/ajd.12751
4. D’Souza J, Clark J. Management of the Neck in Metastatic Cutaneous Squamous Cell Carcinoma of the Head and Neck. Curr Opin Otolaryngol Head Neck Surg (2011) 19(2):99–105. doi: 10.1097/MOO.0b013e328343e811
5. Aboul-Fettouh N, Morse D, Patel J, Migden MR. Immunotherapy and Systemic Treatment of Cutaneous Squamous Cell Carcinoma. Dermatol Pract Concept (2021) 11(Suppl 2):e2021169S. doi: 10.5826/dpc.11S2a169S
6. Brunner M, Ng BC, Veness MJ, Clark JR. Assessment of the New Nodal Classification for Cutaneous Squamous Cell Carcinoma and Its Effect on Patient Stratification. Head Neck (2015) 37(3):336–9. doi: 10.1002/hed.23602
7. Gore SM, Shaw D, Martin RC, Kelder W, Roth K, Uren R, et al. Prospective Study of Sentinel Node Biopsy for High-Risk Cutaneous Squamous Cell Carcinoma of the Head and Neck. Head Neck (2016) 38(S1):E884–9. doi: 10.1002/hed.24120
8. Moeckelmann N, Ebrahimi A, Dirven R, Liu J, Low TH, Gupta R, et al. Analysis and Comparison of the 8th Edition American Joint Committee on Cancer (AJCC) Nodal Staging System in Cutaneous and Oral Squamous Cell Cancer of the Head and Neck. Ann Surg Oncol (2018) 25(6):1730–6. doi: 10.1245/s10434-018-6340-x
9. Ji AL, Rubin AJ, Thrane K, Jiang S, Reynolds DL, Meyers RM, et al. Multimodal Analysis of Composition and Spatial Architecture in Human Squamous Cell Carcinoma. Cell (2020) 182(2):497–514.e22. doi: 10.1016/j.cell.2020.05.039
10. Lazo de la Vega L, Bick N, Hu K, Rahrig SE, Silva CD, Matayoshi S, et al. Invasive Squamous Cell Carcinomas and Precursor Lesions on UV-Exposed Epithelia Demonstrate Concordant Genomic Complexity in Driver Genes. Mod Pathol (2020) 33(11):2280–94. doi: 10.1038/s41379-020-0571-7
11. Lobl MB, Clarey D, Higgins S, Sutton A, Hansen L, Wysong A. Targeted Next-Generation Sequencing of Matched Localized and Metastatic Primary High-Risk SCCs Identifies Driver and Co-Occurring Mutations and Novel Therapeutic Targets. J Dermatol Sci (2020) 99(1):30–43. doi: 10.1016/j.jdermsci.2020.05.007
12. Pickering CR, Zhou JH, Lee JJ, Drummond JA, Peng SA, Saade RE, et al. Mutational Landscape of Aggressive Cutaneous Squamous Cell Carcinoma. Clin Cancer Res (2014) 20(24):6582–92. doi: 10.1158/1078-0432.CCR-14-1768
13. Zehir A, Benayed R, Shah RH, Syed A, Middha S, Kim HR, et al. Mutational Landscape of Metastatic Cancer Revealed From Prospective Clinical Sequencing of 10,000 Patients. Nat Med (2017) 23(6):703–13. doi: 10.1038/nm.4333
14. Zilberg C, Lee MW, Kraitsek S, Ashford B, Ranson M, Shannon K, et al. Is High-Risk Cutaneous Squamous Cell Carcinoma of the Head and Neck a Suitable Candidate for Current Targeted Therapies? J Clin Pathol (2020) 73(1):17–22. doi: 10.1136/jclinpath-2019-206038
15. Zou D-D, Xu D, Deng Y-Y, Wu W-J, Zhang J, Huang L, et al. Identification of Key Genes in Cutaneous Squamous Cell Carcinoma: A Transcriptome Sequencing and Bioinformatics Profiling Study. Ann Transl Med (2021) 9(19):1497. doi: 10.21037/atm-21-3915
16. Zilberg C, Lee MW, Yu B, Ashford B, Kraitsek S, Ranson M, et al. Analysis of Clinically Relevant Somatic Mutations in High-Risk Head and Neck Cutaneous Squamous Cell Carcinoma. Mod Pathol (2018) 31(2):275–87. doi: 10.1038/modpathol.2017.128
17. Lu P, Weaver VM, Werb Z. The Extracellular Matrix: A Dynamic Niche in Cancer Progression. J Cell Biol (2012) 196(4):395–406. doi: 10.1083/jcb.201102147
18. Ranson M, Andronicos NM. Plasminogen Binding and Cancer: Promises and Pitfalls. Front Biosci (2003) 8:s294–304. doi: 10.2741/1044
19. Puram SV, Tirosh I, Parikh AS, Patel AP, Yizhak K, Gillespie S, et al. Single-Cell Transcriptomic Analysis of Primary and Metastatic Tumor Ecosystems in Head and Neck Cancer. Cell (2017) 171(7):1611–24.e24. doi: 10.1016/j.cell.2017.10.044
20. Pavón MA, Arroyo-Solera I, Céspedes MV, Casanova I, León X, Mangues R. uPA/uPAR and SERPINE1 in Head and Neck Cancer: Role in Tumor Resistance, Metastasis, Prognosis and Therapy. Oncotarget (2016) 7:57351–66 doi: 10.18632/oncotarget.10344
21. Brungs D, Chen J, Aghmesheh M, Vine KL, Becker TM, Carolan MG, et al. The Urokinase Plasminogen Activation System in Gastroesophageal Cancer: A Systematic Review and Meta-Analysis. Oncotarget (2017) 8(14):23099–109. doi: 10.18632/oncotarget.15485
22. Madunic J. The Urokinase Plasminogen Activator System in Human Cancers: An Overview of Its Prognostic and Predictive Role. Thromb Haemost (2018) 118(12):2020–36. doi: 10.1055/s-0038-1675399
23. Tincknell G, Piper AK, Aghmesheh M, Becker T, Vine KL, Brungs D, et al. Experimental and Clinical Evidence Supports the Use of Urokinase Plasminogen Activation System Components as Clinically Relevant Biomarkers in Gastroesophageal Adenocarcinoma. Cancers (2021) 13(16):4097. doi: 10.3390/cancers13164097
24. Hundsdorfer B, Zeilhofer HF, Bock KP, Dettmar P, Schmitt M, Kolk A, et al. Tumour-Associated Urokinase-Type Plasminogen Activator (uPA) and Its Inhibitor PAI-1 in Normal and Neoplastic Tissues of Patients With Squamous Cell Cancer of the Oral Cavity - Clinical Relevance and Prognostic Value. J Craniomaxillofac Surg (2005) 33(3):191–6. doi: 10.1016/j.jcms.2004.12.005
25. Shi Z, Stack MS. Urinary-Type Plasminogen Activator (uPA) and Its Receptor (uPAR) in Squamous Cell Carcinoma of the Oral Cavity. Biochem J (2007) 407(2):153–9. doi: 10.1042/BJ20071037
26. Ghosh S, Koblinski J, Johnson J, Liu Y, Ericsson A, Davis JW, et al. Urinary-Type Plasminogen Activator Receptor/Alpha 3 Beta 1 Integrin Signaling, Altered Gene Expression, and Oral Tumor Progression. Mol Cancer Res (2010) 8(2):145–58. doi: 10.1158/1541-7786.MCR-09-0045
27. Dhanda J, Triantafyllou A, Liloglou T, Kalirai H, Lloyd B, Hanlon R, et al. SERPINE1 and SMA Expression at the Invasive Front Predict Extracapsular Spread and Survival in Oral Squamous Cell Carcinoma. Br J Cancer (2014) 111(11):2114–21. doi: 10.1038/bjc.2014.500
28. Magnussen S, Rikardsen OG, Hadler-Olsen E, Uhlin-Hansen L, Steigen SE, Svineng G. Urokinase Plasminogen Activator Receptor (uPAR) and Plasminogen Activator Inhibitor-1 (PAI-1) Are Potential Predictive Biomarkers in Early Stage Oral Squamous Cell Carcinomas (OSCC). PloS One (2014) 9(7):e101895. doi: 10.1371/journal.pone.0101895
29. Christensen A, Kiss K, Lelkaitis G, Juhl K, Persson M, Charabi BW, et al. Urokinase-Type Plasminogen Activator Receptor (uPAR), Tissue Factor (TF) and Epidermal Growth Factor Receptor (EGFR): Tumor Expression Patterns and Prognostic Value in Oral Cancer. BMC Cancer (2017) 17(1):572. doi: 10.1186/s12885-017-3563-3
30. Zou B, Li J, Xu K, Liu JL, Yuan DY, Meng Z, et al. Identification of Key Candidate Genes and Pathways in Oral Squamous Cell Carcinoma by Integrated Bioinformatics Analysis. Exp Ther Med (2019) 17(5):4089–99. doi: 10.3892/etm.2019.7442
31. Garcia-Diez I, Hernandez-Munoz I, Hernandez-Ruiz E, Nonell L, Puigdecanet E, Bodalo-Torruella M, et al. Transcriptome and Cytogenetic Profiling Analysis of Matched in Situ/Invasive Cutaneous Squamous Cell Carcinomas From Immunocompetent Patients. Genes Chromosomes Cancer (2019) 58(3):164–74. doi: 10.1002/gcc.22712
32. Mitsui H, Suarez-Farinas M, Gulati N, Shah KR, Cannizzaro MV, Coats I, et al. Gene Expression Profiling of the Leading Edge of Cutaneous Squamous Cell Carcinoma: IL-24-Driven MMP-7. J Invest Dermatol (2014) 134(5):1418–27. doi: 10.1038/jid.2013.494
33. Romer J, Pyke C, Lund LR, Ralfkiaer E, Dano K. Cancer Cell Expression of Urokinase-Type Plasminogen Activator Receptor mRNA in Squamous Cell Carcinomas of the Skin. J Invest Dermatol (2001) 116(3):353–8. doi: 10.1046/j.1523-1747.2001.01241.x
34. Edge SB, Compton CC. The American Joint Committee on Cancer: The 7th Edition of the AJCC Cancer Staging Manual and the Future of TNM. Ann Surg Oncol (2010) 17(6):1471–4. doi: 10.1245/s10434-010-0985-4
35. Bhattacharya A, Hamilton AM, Furberg H, Pietzak E, Purdue MP, Troester MA, et al. An Approach for Normalization and Quality Control for NanoString RNA Expression Data. Briefings Bioinf (2021) 22(3):bbaa163. doi: 10.1093/bib/bbaa163
36. Benjamini Y, Hochberg Y. Controlling the False Discovery Rate: A Practical and Powerful Approach to Multiple Testing. J R Stat Soc Ser B (Methodological) (1995) 57(1):289–300. doi: 10.1111/j.2517-6161.1995.tb02031.x
37. Krämer A, Green J, Pollard J Jr., Tugendreich S. Causal Analysis Approaches in Ingenuity Pathway Analysis. Bioinformatics (2014) 30(4):523–30. doi: 10.1093/bioinformatics/btt703
38. Edgar R, Domrachev M, Lash AE. Gene Expression Omnibus: NCBI Gene Expression and Hybridization Array Data Repository. Nucleic Acids Res (2002) 30(1):207–10. doi: 10.1093/nar/30.1.207
39. Ritchie ME, Phipson B, Wu D, Hu Y, Law CW, Shi W, et al. Limma Powers Differential Expression Analyses for RNA-Sequencing and Microarray Studies. Nucleic Acids Res (2015) 43(7):e47. doi: 10.1093/nar/gkv007
40. Davis S, Meltzer PS. GEOquery: A Bridge Between the Gene Expression Omnibus (GEO) and BioConductor. Bioinformatics (2007) 23(14):1846–7. doi: 10.1093/bioinformatics/btm254
41. Thind AS, Tripathi KP, Guarracino MR. RankerGUI: A Computational Framework to Compare Differential Gene Expression Profiles Using Rank Based Statistics. Int J Mol Sci (2019) 20(23):6098. doi: 10.3390/ijms20236098
42. Kolde R, Laur S, Adler P, Vilo J. Robust Rank Aggregation for Gene List Integration and Meta-Analysis. Bioinformatics (2012) 28(4):573–80. doi: 10.1093/bioinformatics/btr709
43. Jassal B, Matthews L, Viteri G, Gong C, Lorente P, Fabregat A, et al. The Reactome Pathway Knowledgebase. Nucleic Acids Res (2020) 48(D1):D498–503. doi: 10.1093/nar/gkz1031
44. Yu G, He Q-Y. ReactomePA: An R/Bioconductor Package for Reactome Pathway Analysis and Visualization. Mol Biosyst (2016) 12(2):477–9. doi: 10.1039/C5MB00663E
45. Martin M. Cutadapt Removes Adapter Sequences From High-Throughput Sequencing Reads. EMBnet J (2011) 17(1):10–2. doi: 10.14806/ej.17.1.200
46. Barturen G, Rueda A, Hamberg M, Alganza A, Lebron R, Kotsyfakis M, et al. sRNAbench: Profiling of Small RNAs and Its Sequence Variants in Single or Multi-Species High-Throughput Experiments. Methods Next Generation Sequencing (2014) 1(1):21–31. doi: 10.2478/mngs-2014-0001
47. Aparicio-Puerta E, Lebron R, Rueda A, Gomez-Martin C, Giannoukakos S, Jaspez D, et al. sRNAbench and Srnatoolbox 2019: Intuitive Fast Small RNA Profiling and Differential Expression. Nucleic Acids Res (2019) 47(W1):W530–5. doi: 10.1093/nar/gkz415
48. Love MI, Huber W, Anders S. Moderated Estimation of Fold Change and Dispersion for RNA-Seq Data With Deseq2. Genome Biol (2014) 15(12):1–21. doi: 10.1186/s13059-014-0550-8
49. McCarthy DJ, Chen Y, Smyth GK. Differential Expression Analysis of Multifactor RNA-Seq Experiments With Respect to Biological Variation. Nucleic Acids Res (2012) 40(10):4288–97. doi: 10.1093/nar/gks042
50. Chen Y, Wang X. miRDB: An Online Database for Prediction of Functional microRNA Targets. Nucleic Acids Res (2020) 48(D1):D127–D31. doi: 10.1093/nar/gkz757
51. Chou C-H, Shrestha S, Yang C-D, Chang N-W, Lin Y-L, Liao K-W, et al. miRTarBase Update 2018: A Resource for Experimentally Validated microRNA-Target Interactions. Nucleic Acids Res (2018) 46(D1):D296–302. doi: 10.1093/nar/gkx1067
52. Perry J, Ashford B, Thind AS, Gauthier ME, Minaei E, Major G, et al. Comprehensive Mutational and Phenotypic Characterization of New Metastatic Cutaneous Squamous Cell Carcinoma Cell Lines Reveal Novel Drug Susceptibilities. Int J Mol Sci (2020) 21(24):9536. doi: 10.3390/ijms21249536
53. Martincorena I, Campbell PJ. Somatic Mutation in Cancer and Normal Cells. Science (2015) 349(6255):1483–9. doi: 10.1126/science.aab4082
54. Ruokolainen H, Pääkkö P, Turpeenniemi-Hujanen T. Tissue Inhibitor of Matrix Metalloproteinase-1 Is Prognostic in Head and Neck Squamous Cell Carcinoma: Comparison of the Circulating and Tissue Immunoreactive Protein. Clin Cancer Res (2005) 11(9):3257–64. doi: 10.1158/1078-0432.CCR-04-2277
55. Cruz-Munoz W, Khokha R. The Role of Tissue Inhibitors of Metalloproteinases in Tumorigenesis and Metastasis. Crit Rev Clin Lab Sci (2008) 45(3):291–338. doi: 10.1080/10408360801973244
56. Culhaci N, Metin K, Copcu E, Dikicioglu E. Elevated Expression of MMP-13 and TIMP-1 in Head and Neck Squamous Cell Carcinomas may Reflect Increased Tumor Invasiveness. BMC Cancer (2004) 4(1):1–8. doi: 10.1186/1471-2407-4-42
57. Kurahara S, Shinohara M, Ikebe T, Nakamura S, Beppu M, Hiraki A, et al. Expression of MMPS, MT-MMP, and TIMPs in Squamous Cell Carcinoma of the Oral Cavity: Correlations With Tumor Invasion and Metastasis. Head Neck (1999) 21(7):627–38. doi: 10.1002/(SICI)1097-0347(199910)21:7<627::AID-HED7>3.0.CO;2-2
58. O-Charoenrat P, Rhys-Evans PH, Eccles SA. Expression of Matrix Metalloproteinases and Their Inhibitors Correlates With Invasion and Metastasis in Squamous Cell Carcinoma of the Head and Neck. Arch Otolaryngol Head Neck Surg (2001) 127(7):813–20.
59. Shimada T, Nakamura H, Yamashita K, Kawata R, Murakami Y, Fujimoto N, et al. Enhanced Production and Activation of Progelatinase A Mediated by Membrane-Type 1 Matrix Metalloproteinase in Human Oral Squamous Cell Carcinomas: Implications for Lymph Node Metastasis. Clin Exp Metastasis (2000) 18(2):179–88. doi: 10.1023/A:1006749501682
60. Singh RD, Nilayangode H, Patel JB, Shah FD, Shukla SN, Shah PM, et al. Combined Evaluation of Matrix Metalloproteinases and Their Inhibitors has Better Clinical Utility in Oral Cancer. Int J Biol Markers (2011) 26(1):27–36. doi: 10.5301/JBM.2011.6359
61. Ma Y, Pu Y, Peng L, Luo X, Xu J, Peng Y, et al. Identification of Potential Hub Genes Associated With the Pathogenesis and Prognosis of Pancreatic Duct Adenocarcinoma Using Bioinformatics Meta−Analysis of Multi−Platform Datasets. Oncol Lett (2019) 18(6):6741–51. doi: 10.3892/ol.2019.11042
62. Stelzer G, Rosen N, Plaschkes I, Zimmerman S, Twik M, Fishilevich S, et al. The GeneCards Suite: From Gene Data Mining to Disease Genome Sequence Analyses. Curr Protoc Bioinf (2016) 54(1):1.30.1–.33. doi: 10.1002/cpbi.5
63. Hou J, Yan D, Liu Y, Huang P, Cui H. The Roles of Integrin α5β1 in Human Cancer. Onco Targets Ther (2020) 13:13329–44. doi: 10.2147/OTT.S273803
64. Communal L, Roy N, Cahuzac M, Rahimi K, Köbel M, Provencher DM, et al. A Keratin 7 and E-Cadherin Signature Is Highly Predictive of Tubo-Ovarian High-Grade Serous Carcinoma Prognosis. Int J Mol Sci (2021) 22(10):5325. doi: 10.3390/ijms22105325
65. Lambert SR, Mladkova N, Gulati A, Hamoudi R, Purdie K, Cerio R, et al. Key Differences Identified Between Actinic Keratosis and Cutaneous Squamous Cell Carcinoma by Transcriptome Profiling. Br J Cancer (2014) 110(2):520–9. doi: 10.1038/bjc.2013.760
66. Mazzieri R, Pietrogrande G, Gerasi L, Gandelli A, Colombo P, Moi D, et al. Urokinase Receptor Promotes Skin Tumor Formation by Preventing Epithelial Cell Activation of Notch1. Cancer Res (2015) 75(22):4895–909. doi: 10.1158/0008-5472.CAN-15-0378
67. Jee BA, Lim H, Kwon SM, Jo Y, Park MC, Lee IJ, et al. Molecular Classification of Basal Cell Carcinoma of Skin by Gene Expression Profiling. Mol Carcinog (2015) 54(12):1605–12. doi: 10.1002/mc.22233
68. Marschall C, Lengyel E, Nobutoh T, Braungart E, Douwes K, Simon A, et al. UVB Increases Urokinase-Type Plasminogen Activator Receptor (uPAR) Expression. J Invest Dermatol (1999) 113(1):69–76. doi: 10.1046/j.1523-1747.1999.00631.x
69. Wu K, Mao Y-Y, Han N-N, Wu H, Zhang S. PLAU1 Facilitated Proliferation, Invasion, and Metastasis via Interaction With MMP1 in Head and Neck Squamous Carcinoma. Front Oncol (2021) 11:574260. doi: 10.3389/fonc.2021.574260
70. Ganesh S, Sier CM, Heerding M, Griffioen G, Lamers CH, Verspaget H. Urokinase Receptor and Colorectal Cancer Survival. Lancet (1994) 344(8919):401–2. doi: 10.1016/S0140-6736(94)91427-3
71. Harbeck N, Kates RE, Look MP, Meijer-Van Gelder ME, Klijn JG, Kruger A, et al. Enhanced Benefit From Adjuvant Chemotherapy in Breast Cancer Patients Classified High-Risk According to Urokinase-Type Plasminogen Activator (uPA) and Plasminogen Activator Inhibitor Type 1 (N = 3424). Cancer Res (2002) 62(16):4617–22.
72. Kubala MH, DeClerck YA. The Plasminogen Activator Inhibitor-1 Paradox in Cancer: A Mechanistic Understanding. Cancer Metastasis Rev (2019) 38(3):483–92. doi: 10.1007/s10555-019-09806-4
73. Pedersen H, Grondahl-Hansen J, Francis D, Osterlind K, Hansen HH, Dano K, et al. Urokinase and Plasminogen Activator Inhibitor Type 1 in Pulmonary Adenocarcinoma. Cancer Res (1994) 54(1):120–3.
74. Ibrahim SF, Kasprzak JM, Hall MA, Fitzgerald AL, Siegel JJ, Kurley SJ, et al. Enhanced Metastatic Risk Assessment in Cutaneous Squamous Cell Carcinoma With the 40-Gene Expression Profile Test. Future Oncol (2022) 18(7):833–47. doi: 10.2217/fon-2021-1277
75. Das Mahapatra K, Pasquali L, Sondergaard JN, Lapins J, Nemeth IB, Baltas E, et al. A Comprehensive Analysis of Coding and Non-Coding Transcriptomic Changes in Cutaneous Squamous Cell Carcinoma. Sci Rep (2020) 10(1):3637. doi: 10.1038/s41598-020-59660-6
76. Prat A, Navarro A, Paré L, Reguart N, Galván P, Pascual T, et al. Immune-Related Gene Expression Profiling After PD-1 Blockade in Non–Small Cell Lung Carcinoma, Head and Neck Squamous Cell Carcinoma, and Melanoma. Cancer Res (2017) 77(13):3540–50. doi: 10.1158/0008-5472.CAN-16-3556
77. Melendez-Zajgla J, Del Pozo L, Ceballos G, Maldonado V. Tissue Inhibitor of Metalloproteinases-4 The Road Less Traveled. Mol Cancer (2008) 7(1):85. doi: 10.1186/1476-4598-7-85
78. Groft L, Muzik H, Rewcastle N, Johnston R, Knäuper V, Lafleur M, et al. Differential Expression and Localization of TIMP-1 and TIMP-4 in Human Gliomas. Br J Cancer (2001) 85(1):55–63. doi: 10.1054/bjoc.2001.1854
79. Dammann R, Strunnikova M, Schagdarsurengin U, Rastetter M, Papritz M, Hattenhorst UE, et al. CpG Island Methylation and Expression of Tumour-Associated Genes in Lung Carcinoma. Eur J Cancer (2005) 41(8):1223–36. doi: 10.1016/j.ejca.2005.02.020
80. Bigg HF, Morrison CJ, Butler GS, Bogoyevitch MA, Wang Z, Soloway PD, et al. Tissue Inhibitor of Metalloproteinases-4 Inhibits But Does Not Support the Activation of Gelatinase A via Efficient Inhibition of Membrane Type 1-Matrix Metalloproteinase. Cancer Res (2001) 61(9):3610–8.
81. Chun T-H, Sabeh F, Ota I, Murphy H, McDonagh KT, Holmbeck K, et al. MT1-MMP–dependent Neovessel Formation Within the Confines of the Three-Dimensional Extracellular Matrix. J Cell Biol (2004) 167(4):757–67. doi: 10.1083/jcb.200405001
82. Hiraoka N, Allen E, Apel IJ, Gyetko MR, Weiss SJ. Matrix Metalloproteinases Regulate Neovascularization by Acting as Pericellular Fibrinolysins. Cell (1998) 95(3):365–77. doi: 10.1016/S0092-8674(00)81768-7
83. Canueto J, Cardenoso E, Garcia JL, Santos-Briz A, Castellanos-Martin A, Fernandez-Lopez E, et al. Epidermal Growth Factor Receptor Expression Is Associated With Poor Outcome in Cutaneous Squamous Cell Carcinoma. Br J Dermatol (2017) 176(5):1279–87. doi: 10.1111/bjd.14936
Keywords: cutaneous squamous cell carcinoma (cSSC), urokinase plasminogen activator receptor (uPAR), urokinase plasminogen activator (uPA), metastasis, matrix metalloproteinase (MMP), extracellular matrix (ECM), tumor stroma, transcriptomics
Citation: Minaei E, Mueller SA, Ashford B, Thind AS, Mitchell J, Perry JR, Genenger B, Clark JR, Gupta R and Ranson M (2022) Cancer Progression Gene Expression Profiling Identifies the Urokinase Plasminogen Activator Receptor as a Biomarker of Metastasis in Cutaneous Squamous Cell Carcinoma. Front. Oncol. 12:835929. doi: 10.3389/fonc.2022.835929
Received: 15 December 2021; Accepted: 03 March 2022;
Published: 11 April 2022.
Edited by:
Xunwei Wu, Shandong University, ChinaCopyright © 2022 Minaei, Mueller, Ashford, Thind, Mitchell, Perry, Genenger, Clark, Gupta and Ranson. This is an open-access article distributed under the terms of the Creative Commons Attribution License (CC BY). The use, distribution or reproduction in other forums is permitted, provided the original author(s) and the copyright owner(s) are credited and that the original publication in this journal is cited, in accordance with accepted academic practice. No use, distribution or reproduction is permitted which does not comply with these terms.
*Correspondence: Marie Ranson, bXJhbnNvbkB1b3cuZWR1LmF1
Disclaimer: All claims expressed in this article are solely those of the authors and do not necessarily represent those of their affiliated organizations, or those of the publisher, the editors and the reviewers. Any product that may be evaluated in this article or claim that may be made by its manufacturer is not guaranteed or endorsed by the publisher.
Research integrity at Frontiers
Learn more about the work of our research integrity team to safeguard the quality of each article we publish.