 Tamotsu Sugai1*†
 Mitsumasa Osakabe1†Takeshi Niinuma2
 Ryo Sugimoto1Makoto Eizuka1Yoshihito Tanaka1
 Naoki Yanagawa1Koki Otsuka2Akira Sasaki2Takayuki Matsumoto3
 Hiromu Suzuki2
- 1Department of Molecular Diagnostic Pathology, School of Medicine, Iwate Medical University, Shiwagun’yahabachou, Japan
- 2Department of Molecular Biology, Sapporo Medical University, School of Medicine, Sapporo, Japan
- 3Division of Gastroenterology, Department of Internal Medicine, Shiwagun’yahabachou, Japan
- 4Department of Surgery, School of Medicine, Iwate Medical University, Shiwagun’yahabachou, Japan
Background: Although MicroRNAs (miRNAs) play important roles in various biological processes, the biological functions of miRNAs are achieved through mRNAs. The aim of this study is to identify dysregulated miRNA/mRNA expression patterns in colorectal tumors.
Methods: We examined 42 colorectal tumors [15 adenomas, 8 intramucosal cancers (IMCs), and 19 invasive colorectal cancers (CRCs)] with the microsatellite stable (MSS) phenotype (first cohort). The first cohort was used for genome-wide miRNA and mRNA expression arrays, whereas the second cohort (37 colorectal neoplasias) was used for validation analyses. Finally, we used 15 cases of “adenoma in/with carcinoma” to identify network patterns of miRNAs/mRNAs that were directly associated with neoplastic progression. In addition, simple regression analysis for array-based and RT-PCR analyses was performed to select candidate miRNA–mRNA pairs. Transfection of miRNA mimics was also performed to confirm whether target mRNA expression is affected by specific miRNAs.
Results: Specific paired miRNA/mRNA networks, including hsa-miR-34a-5p/SLC12A2, hsa-miR-15b-5p/SLC12A2, hsa-miR-195-5p/SLC12A2, hsa-miRNA-502-3p/OLFM4, hsa-miRNA-6807-5p/ZG16, and hsa-miRNA 3064-5p/SH3BGRL3, were identified in samples of adenoma, IMC, and CRC with the MSS phenotype. In adenomatous lesions obtained from the same tumor with a carcinomatous lesion, we identified pairs of miRNA-130a-3p/HSPA8 and miRNA-22-3p/RP53 that were linked to multiple pathways. On the other hand, 2 pairs of miRNA/mRNA (miRNA-660-5p and miRNA-664a-5p/APP) were found in isolated carcinomatous glands. Ectopic expression of miRNA 3064-5p suppressed SH3BGRL3 expression.
Conclusions: We found that networks based on specific pairs of miRNAs/mRNAs contribute to progression from adenomatous and carcinomatous lesions. Our results provide insights into the molecular tumorigenesis of colorectal tumors.
Introduction
Fearon and Vogelstein proposed a novel hypothesis, designated the adenoma-carcinoma sequence of the colorectum, that describes transformation of normal colorectal epithelium to an adenoma and finally to an invasive and metastatic cancer (1). Based on this hypothesis, chromosomal instability, microsatellite instability, and CpG island methylator phenotype pathways contribute to genetic alterations occurring in colorectal cancer (2–4). Moreover, the adenoma-carcinoma progression is characterized by a chromosomal instability pathway that activates proto-oncogenes (KRAS) and inactivates at least 3 tumor suppression genes, including loss of APC, TP53, and DPC4 (5–7). Mutation of the PIK3CA gene has also been recently described (7).
MicroRNAs (miRNAs) are small, noncoding RNAs that cannot be translated into proteins (8, 9). Notably, miRNAs have many essential roles in multiple biological processes. (8, 9). For example, miRNAs have been shown to modulate the expression of greater than 30% of genes in the human genome (10, 11). Moreover, dysregulation of miRNA expression has been shown to be related to various biological functions, such as cell differentiation, apoptosis, and carcinogenesis (12, 13). Many studies have shown that miRNAs play central roles in the occurrence and development of a variety of cancers, including lung cancer (14), breast cancer (15), and colon cancer (9). Most of the effects of miRNAs on biological functions occur via modulation of messenger RNAs (mRNAs), which are transcribed into proteins (16). Thus, the link between dysregulated expression of miRNA and altered expression of mRNA is important for human carcinogenesis and should be carefully evaluated.
Here, we aimed to evaluate dysregulated mRNA–miRNA pairs contributing to colorectal carcinogenesis. To this end, we carried out integrative analyses of the interactions between miRNAs and target genes by applying high-throughput molecular profiling of isolated colorectal adenoma and cancerous samples, including colorectal intramucosal cancer (IMC) and invasive CRC. We also validated additional isolated tumor samples. In addition, we used samples of intramucosal neoplasia (intramucosal adenocarcinoma accompanied by an adenoma component, equivalent to pT1 carcinoma) to identify molecular alterations of direct progression from adenomatous to cancerous lesions within the same tumor.
Methods
Patients
In total, 42 patients were enrolled as the first cohort in this study; these patients included 15 cases of colorectal adenoma (both tubular and tubulovillous adenomas), 8 cases of IMC, and 19 cases of CRC (with invasion beyond the muscular layer without metastasis). Adenoma and IMC were diagnosed histologically based on the World Health Organization (WHO; 2019) criteria, with some modifications (7). The adenomas evaluated in this study consisted of both low-grade adenomas (LGAs) and high-grade adenomas (HGAs). The clinicopathological findings for the patients were described based on the General Rules for Management of the Japanese Colorectal Cancer Association (17). Furthermore, we performed a validation analysis using 37 colorectal tumors (15 adenomas, 8 IMCs, and 14 invasive CRCs) as the second cohort. Table 1-a shows the clinicopathological findings of the patients. All samples, including those from cohorts 1 and 2, were obtained from Iwate Medical University from 2018 to 2020. Therefore, samples from cohorts 1 and 2 were independently collected from the same hospital (Iwate Medical University).
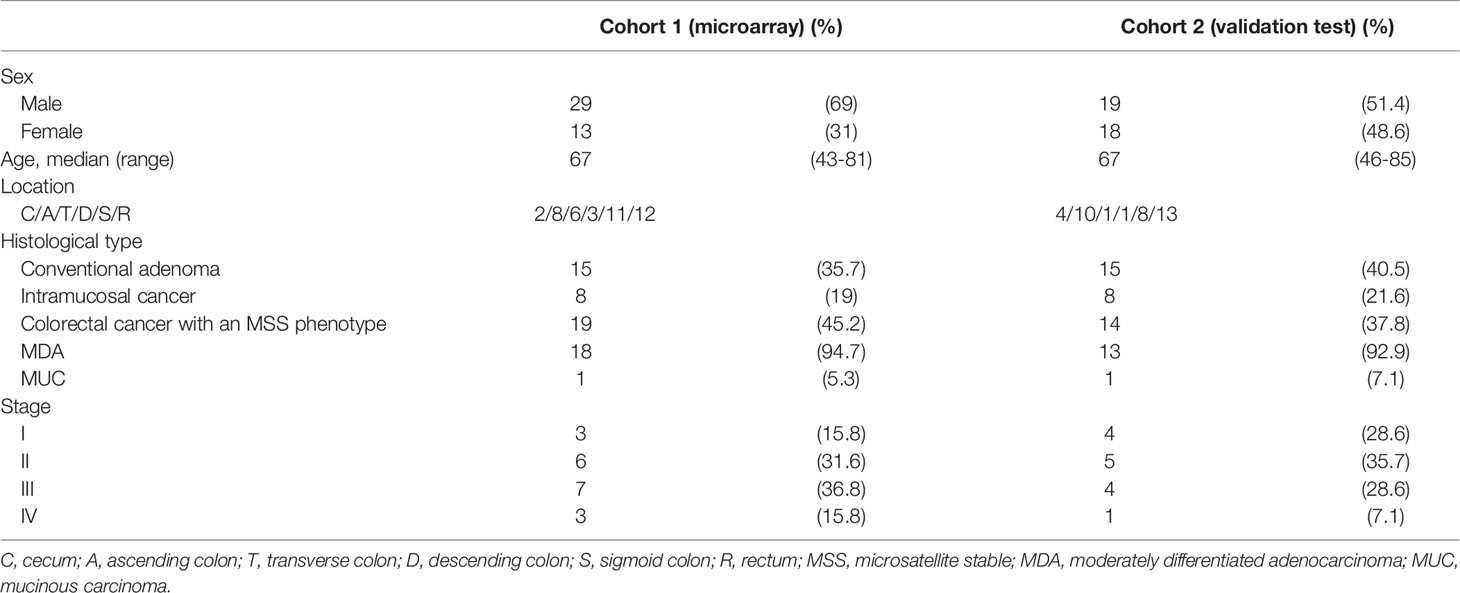
Table 1-A Clinicopathological findings of the colorectal lesions.
We examined 15 cases of “adenoma in/with carcinoma” (within the same tumor) to identify network patterns of miRNAs/mRNAs that were directly associated with neoplastic progression. Histological diagnosis of the second cohort was made using the same criteria as the first cohort. The detailed clinicopathological findings which were described in accordance with the General Rules for Management of the Japanese Colorectal Cancer Association are summarized in Table 1-B. Overall, two types including lesions separately examined in each lesion (adenomas, IMCs, and CRCs with the microsatellite stable (MSS) phenotype; type A) and two lesions consisted with adenomatous and carcinomatous lesions within the same tumor (type B) were investigated in the present study.
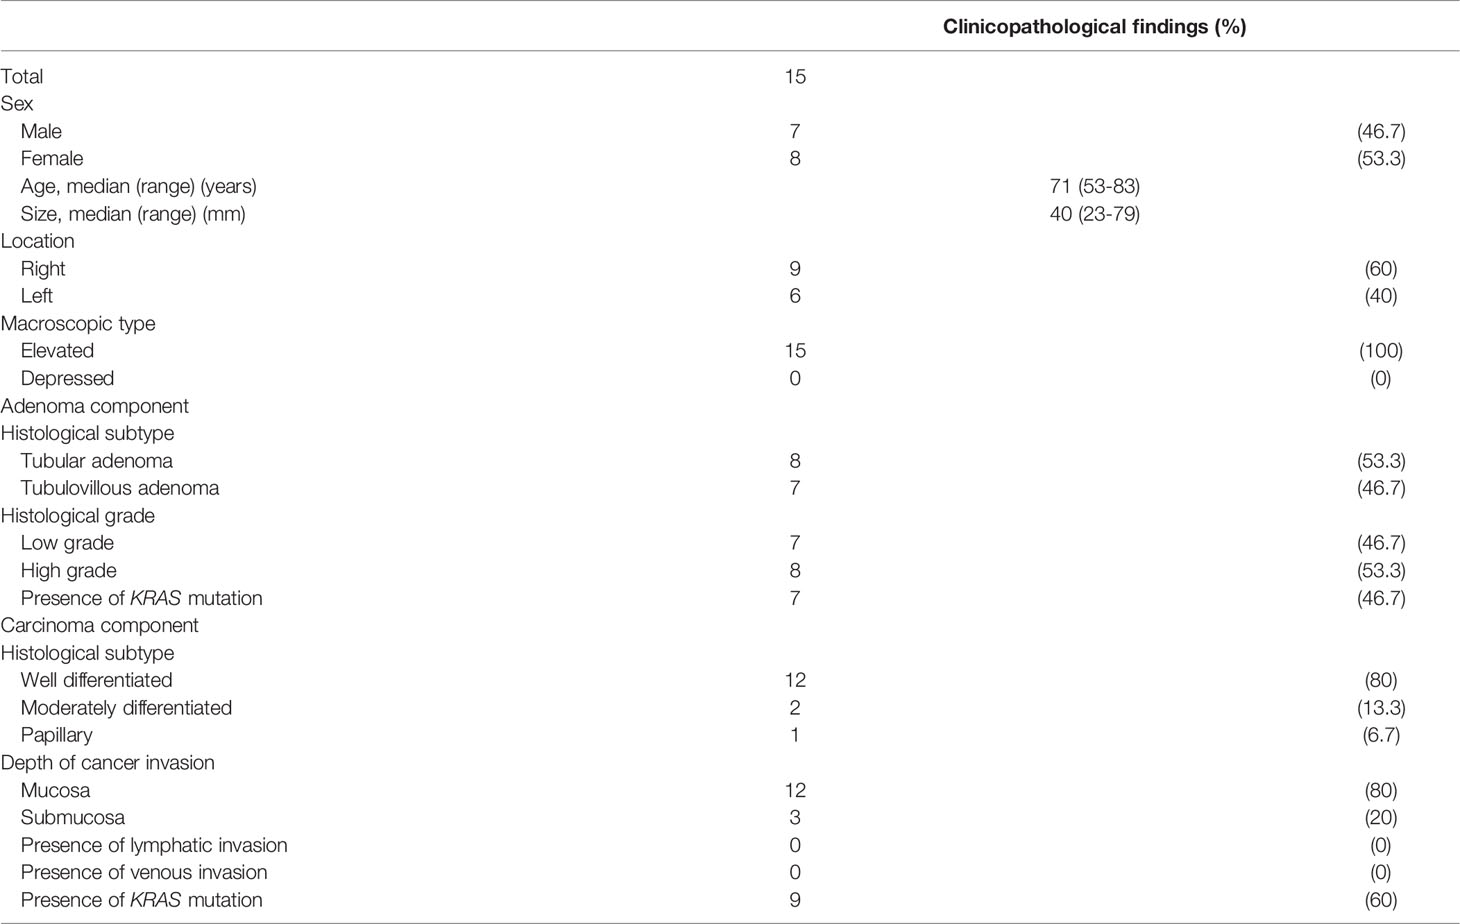
Table 1-B Clinicopathological findings of the colonic adenocarcinomas in/with adenoma.
This study was approved by the local ethics committee of Iwate Medical University (approval number MH2020-066), and all patients provided informed consent.
Crypt Isolation Method
Crypts were isolated in the current study (18). Briefly, we obtained tumor glands (adenomatous and intramucosal carcinomatous glands) from suspected target lesions based on analysis of magnified observations. By contrast, we collected cancer glands in invasive CRC from the invasive front. Crypt isolation from the tumors and normal mucosa (for surgical specimens, this was the distal site of the colon) was described in previous studies (18, 19). After isolation, crypts were fixed in 70% ethanol and then stored at 4°C until DNA/RNA extraction. After fixation, a dissecting microscope (SZ60; Olympus, Tokyo, Japan) was used to visualize the isolated crypts. A portion of the isolated crypts was subjected to routine processing for histopathological analysis. The samples applied to array-based analyses and validation tests showed no contamination by interstitial cells. Representative images of adenoma, IMC, and invasive cancer are shown in Figure 1.

Figure 1 Representative image of isolated crypts. (A–C) Isolated glands under a dissecting microscope. (D–F) Hematoxylin–eosin staining of isolated crypts. Isolated crypts of low grade tubular adenoma (A, D), intramucosal cancer (B, E), and invasive cancer (C, F).
Nucleic Acid Extraction
DNA Extraction
DNA was extracted from tumors and normal glands isolated from each patient by applying a classical phenol-chloroform extraction method. RNeasy Mini kits (Qiagen, Valencia, CA, USA) were to isolate total RNA from tumors and normal glands based on the instructions provided by the manufacturer. Nucleic acid concentrations were measured using a Nanodrop1000 spectrophotometer (Thermo Fisher Scientific, Waltham, MA, USA), and 1.5% denaturing agarose gels were used to determine the purity of the isolated RNA.
RNA Extraction
Isolation of total RNA was performed using RNeasy Mini kits (Qiagen, Valencia, CA, USA) according to the manufacturer’s instructions. The nucleic acid concentration was determined using the Nanodrop1000 spectrophotometer (Thermo Fisher Scientific; Waltham, MA, USA), and RNA purity was verified on 1.5% agarose denaturing gels.
Analysis of Microsatellite Instability
We evaluated the MSI status of the tumor samples using a consensus panel containing five reference microsatellite markers (BAT25, BAT26, D2S123, D3S546, and D17S250) (20). MSI-high was defined as two or more markers being unstable, whereas MSI-low was defined as one marker being unstable; MSS was defined as the absence of instability (21). Normal alleles were typically represented by a major peak accompanied by a few minor peaks. The mobility shift of PCR products from tumor DNA was compared with that obtained from corresponding non-neoplastic crypts. MSI-low was included in MSS status in the present study.
MiRNA Microarray Analysis
For microarray analysis, we performed polyadenylation and labeling of RNA (200 ng) using a FlashTag Biotin HSR RNA Labeling kit. The RNA was then treated with DNA ligase, hybridized to GeneChip miRNA 4.0 microarrays (Thermo Fisher Scientific) by incubation for 16 h at 48°C, washed, and stained using streptavidin-PE solution. Next, scanning of the stained arrays was carried out using a GeneChip Scanner 3000 7G System (Thermo Fisher Scientific). The Affymetrix miRNA 4.0 microarray used in this study contained 6,631 probes, with 2,570 mature miRNA probes. The methods used here were described in detail in a previous study (22).
To identify candidate miRNAs associated with colorectal tumorigenesis, we then assessed miRNA expression based on the following criteria: less than or greater than 1.5 fold-change in expression compared with normal glands and a p value less than 0.05 based on Student’s t-test (without multiple comparison tests).
Clariom S Human Array and Gene Expression Analysis
Total RNA (500 ng) was applied to a Clariom S Human Array (Thermo Fisher Scientific), which included 21,453 mRNAs. The process, which included probe labeling, chip hybridization, and scanning, was carried out as recommended by the manufacturer. Probe sets (gene-exon) were determined as reported previously (22, 23). Transcriptome Analysis Console (TAC, version 4.0.1.36) was used to generate array data, and Affymetrix Chromosome Analysis Suite v.4.1 (Affymetrix Inc., USA) was used for analysis. mRNA expression was evaluated using low statistical stringency (without multiple comparison tests), as described above for the evaluation of miRNA expression (23).
Ingenuity Pathways Analysis
IPA (Ingenuity System Inc., USA, http://www.ingenuity.com) is an approach for identifying interactions between miRNAs and their mRNA targets. The “microRNA target filter” function in IPA was used to build graphical models of the molecular relationships between mRNAs and miRNAs showing significant changes in expression in isolated tumor glands of each colorectal tumor compared with isolated normal glands. miRNA/mRNA interactions with high confidence (predicted), moderate confidence (predicted), or confirmed experimental observations were selected.
Simple Linear Regression Analysis
Simple linear regression analysis was used to further analyze candidate mRNAs and their targeting miRNAs along with corresponding expression profiles from microarray analyses. The significance of regression coefficients was tested based on 95% confidence intervals (CIs). If the 95% CI for a coefficient did not include zero, there was less than a 5% chance that the coefficient was zero (p < 0.05). Thus, such coefficients were considered significant in the model.
RT- Quantitative PCR for Validation Analyses
Microarray results were validated using RT-qPCR. First-strand cDNA was generated by reverse transcription of 1 μg total RNA using the Qiagen cDNA Synthesis Kit (Qiagen). The resulting cDNA was then applied as a template for qPCR using gene-specific primers, using β-actin as the housekeeping control gene (control of each mRNA). RT-qPCR was performed using Power SYBR Green PCR Master Mix (Thermo Fisher Scientific) on the CFX96 Touch Real-Time PCR Detection System (Bio-Rad, Hercules, CA, USA). The 2−ΔCt method was used to calculate relative gene expression levels based on the Livak and Schmittgen method (24). The expression levels of each miRNA were compared with that of RNU6B. β-actin and RNU6B are used as a control of mRNA and miRNA standardly. The primer sequences are listed in Supplementary Table 1.
Transfection With miRNA Mimics
CRC cells (CaCO2, Colo320, DLD1, HCT116, HT29, RKO, SW48, SW480, and SW620 cell lines) at 5 × 10⁵/well in 6-well plates were transfected with 40 pmol of the following mirVana miRNA mimics (Thermo Fisher Scientific): miRNA-6078-5p (assay ID: MC28605), miRNA 3064-5p (assay ID: MC20900), and Negative Control #1. Transfection was performed using Lipofectamine RNAiMAX (Thermo Fisher Scientific) according to the manufacturer’s instructions. After incubation for 72 h, total RNA was extracted using the RNeasy Mini kit (Qiagen) according to the manufacturer’s instructions.
Statistical Analysis
Differences in miRNA and mRNA expression levels were evaluated using limma (p values without adjusted Benjamini–Hochberg FDR correction to identify candidate miRNAs and mRNAs from array-based analyses). The correlation of miRNA with mRNA was examined using a single regression analysis. We used statistical software for analysis (JMP pro 13.0 software package for Windows (SAS Institute Inc., Cary, NC, USA). Results with a p value less than 0.05 were considered significant.
Work Flow (Supplementary Figure 1)
First, we examined the differences in mature miRNA expression levels between the colorectal tumors examined (adenoma, IMC, and MSS CRC) and normal glands using the following criteria: fold-change expression > |1.5| and p < 0.05 for the GeneChip miRNA 4.0 microarray and Clariom S human array data. Second, we assessed the interactions between miRNAs and mRNAs using the microRNA Target Filter in IPA to identify potential candidate mRNA/miRNA pairs based on the arrays. Third, simple regression analysis was performed. Fourth, validation analyses including RT-qPCR were performed in cohort 2. In addition, transfection assays were also conducted. Finally, the expression of candidate mRNAs and miRNAs in TCGA database was evaluated.
To examine the associations between dysregulated miRNAs and mRNAs, we evaluated the inverse correlations between miRNAs and mRNAs in adenomatous and carcinomatous lesions within the same tumor using the same method as above. However, validation analyses were not performed.
Results
Microsatellite Analyses of Colorectal Adenomas, IMCs, and Invasive CRC
In cohort 1, only three tumors were classified as MSI-low and the remaining as MSS. Thus, all of the samples were categorized as MSS based on previously reported criteria (20). Representative Figure is depicted in Supplementary Figure 2.
Analyses of Comprehensive Expression Patterns of miRNAs and mRNAs in Colorectal Tumors (Adenomas, IMCs, and CRC) Having an MSS Phenotype
We examined 15 adenomas, 8 IMCs, and 19 CRCs using array-based analysis.
miRNA Expression Profiling in Colorectal Tumors
In our analysis of expression levels in isolated adenomatous and normal crypts, we identified 133 miRNAs showing differential expression (31 upregulated and 102 downregulated miRNAs). Then, we evaluated the expression levels of miRNAs in isolated IMC glands and compared the results with those from normal isolated crypts; the results identified a total of 135 differentially expressed miRNAs, including 21 upregulated miRNAs and 114 downregulated miRNAs. Finally, we compared the expression levels of miRNAs in isolated cancer (CRC with an MSS phenotype) and corresponding normal glands and found 32 differential expressions (29 upregulated and 3 downregulated). The detailed data are displayed in a Venn diagram in Figure 2-A.
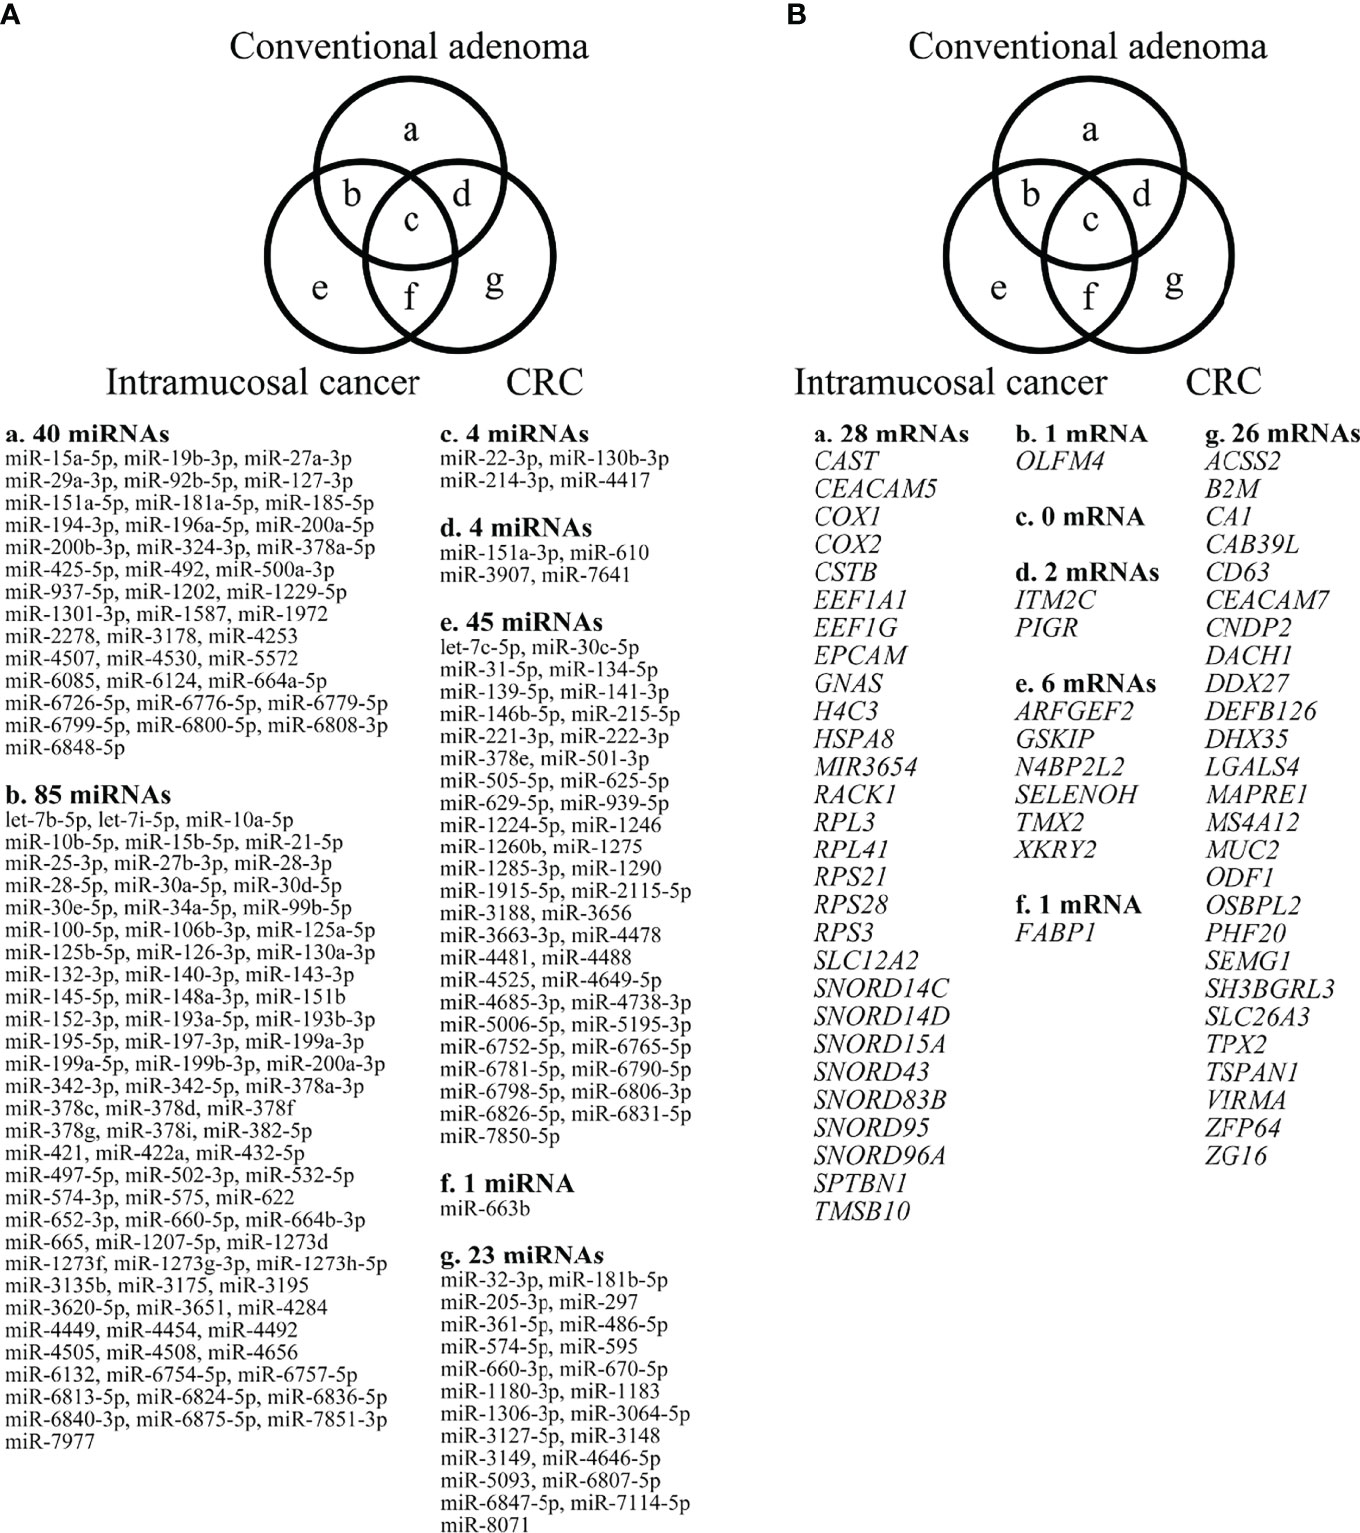
Figure 2 Differential expression of miRNAs, comparing adenomas, IMCs, and CRCs having the MSS phenotype, as depicted by Venn diagram analysis. The numbers of miRNAs identified in adenomas, IMCs, and CRCs having the MSS phenotype were 40, 45 and 23, respectively. Among the three lesions, a considerable number of miRNAs overlapped with each other (adenoma and IMC, 85 miRNAs; adenoma and CRC with an MSS phenotype, 4 miRNAs; IMCs and CRCs having the MSS phenotype, 1 miRNA; adenomas, IMCs, and CRCs having the MSS phenotype, 4 miRNAs). 1-B. Differential expression of mRNAs between adenomas, IMCs, and CRCs having the MSS phenotype, as depicted by Venn diagram analysis. The numbers of mRNAs identified in adenomas, IMCs, and CRCs having the MSS phenotype were 28, 6, and 26. Among the three lesions, few mRNAs overlapped (adenoma and IMC, 1 mRNA; adenoma and CRC with an MSS phenotype, 2 mRNAs; IMCs and CRCs having the MSS phenotype, 1 mRNA; adenomas, IMCs, and CRCs having the MSS phenotype, none).
mRNA Expression Profiling of Colorectal Tumors
First, we assessed differences in mRNA expression levels between isolated neoplastic and normal glands. Consequently, we found 31 differentially upregulated mRNAs in isolated adenomatous samples. Similarly, we identified 21 upregulated mRNAs and 114 downregulated mRNAs from isolated IMC glands. Finally, we found changed expression levels in 32 mRNAs in isolated invasive cancer glands (29 upregulated and 3 downregulated). The detailed data based on a Venn diagram were previously described (Figure 2-B) (23).
Integrative Analysis of miRNA and mRNA Expression Levels and Simple Regression Analysis for Array-Based Assay Samples
We then evaluated the associations between opposite expression levels of miRNA/mRNA using IPA. Fifty-seven miRNA/mRNA pairs had inverse expression patterns in the adenoma samples (Supplementary Figure 3-A). Moreover, 12 and 23 miRNA/mRNA pairs showed inverse expression patterns in IMC (Supplementary Figure 3-B) and CRC with the MSS phenotype (Supplementary Figure 3-C), respectively.
Simple regression analysis of the array data was performed to select candidate miRNA/mRNA pairs. According to these criteria, the following five pairs of miRNAs/mRNAs were retained among 57 pairs in the adenoma samples (Supplementary Figure 4-A; Supplementary Table 2-A): hsa-miRNA-34a-5p/SLC12A2 (solute carrier family 12 member 2), hsa-miRNA-15b-5p/SLC12A2, hsa-miRNA-195-5p/SLC12A2, hsa-miRNA-15a-5p/SLC12A2, and hsa-miRNA-3907/EEF1A1. Moreover, in the IMC samples (Supplementary Figure 4-B; Supplementary Table 2-B), among 12 pairs of miRNA/mRNA networks, we identified 2 pairs of miRNA/mRNA, including hsa-miRNA-664b-3/GSKIP (glycogen synthase kinase 3 Interacting Protein) and hsa-miRNA-502-3p/olfactomedin 4 (OLFM4). On the other hand, among 23 pairs of miRNA/mRNA in CRC with an MSS phenotype, 3 pairs were selected. They included hsa-miRNA-5093/SLC26A3, hsa-miRNA-6807-5p/ZG16 (Zymogen granule protein 16) and hsa-miRNA- 3064-5p/SH3BGRL3 (Src homolog 3 Domain Binding Glutamate Rich Protein Like 3) (Supplementary Figure 4-C; Supplementary Table 2-C).
Simple Regression Analysis of the Validation Cohort
We validated the results that were obtained from the first cohort (array-based assays) using a real-time PCR method in 37 colorectal tumors (15 adenomas, 8 IMCs, and 14 CRCs with an MSS phenotype). In isolated adenoma samples, among 5 paired miRNAs/mRNAs, 3 pairs (hsa-miR-34a-5p/SLC12A2, hsa-miR-15a-5p/SLC12A2, and hsa-miR-195-5p/SLC12A2) were retained in single regression analysis (Figure 3-A; Table 2-a). Among the 2 miRNA/mRNA pairs in the IMC samples, the expression level of hsa-miRNA-502-3p was inversely correlated to that of OLFM4 (Figure 3-B; Table 2-b). In isolated invasive carcinomatous gland samples, 2 pairs were retained (Figure 3-C; Table 2-c): hsa-miRNA-6807-5p/ZG16 (zymogen granule protein 16) and hsa-miRNA 3064-5p/SH3BGRL3.
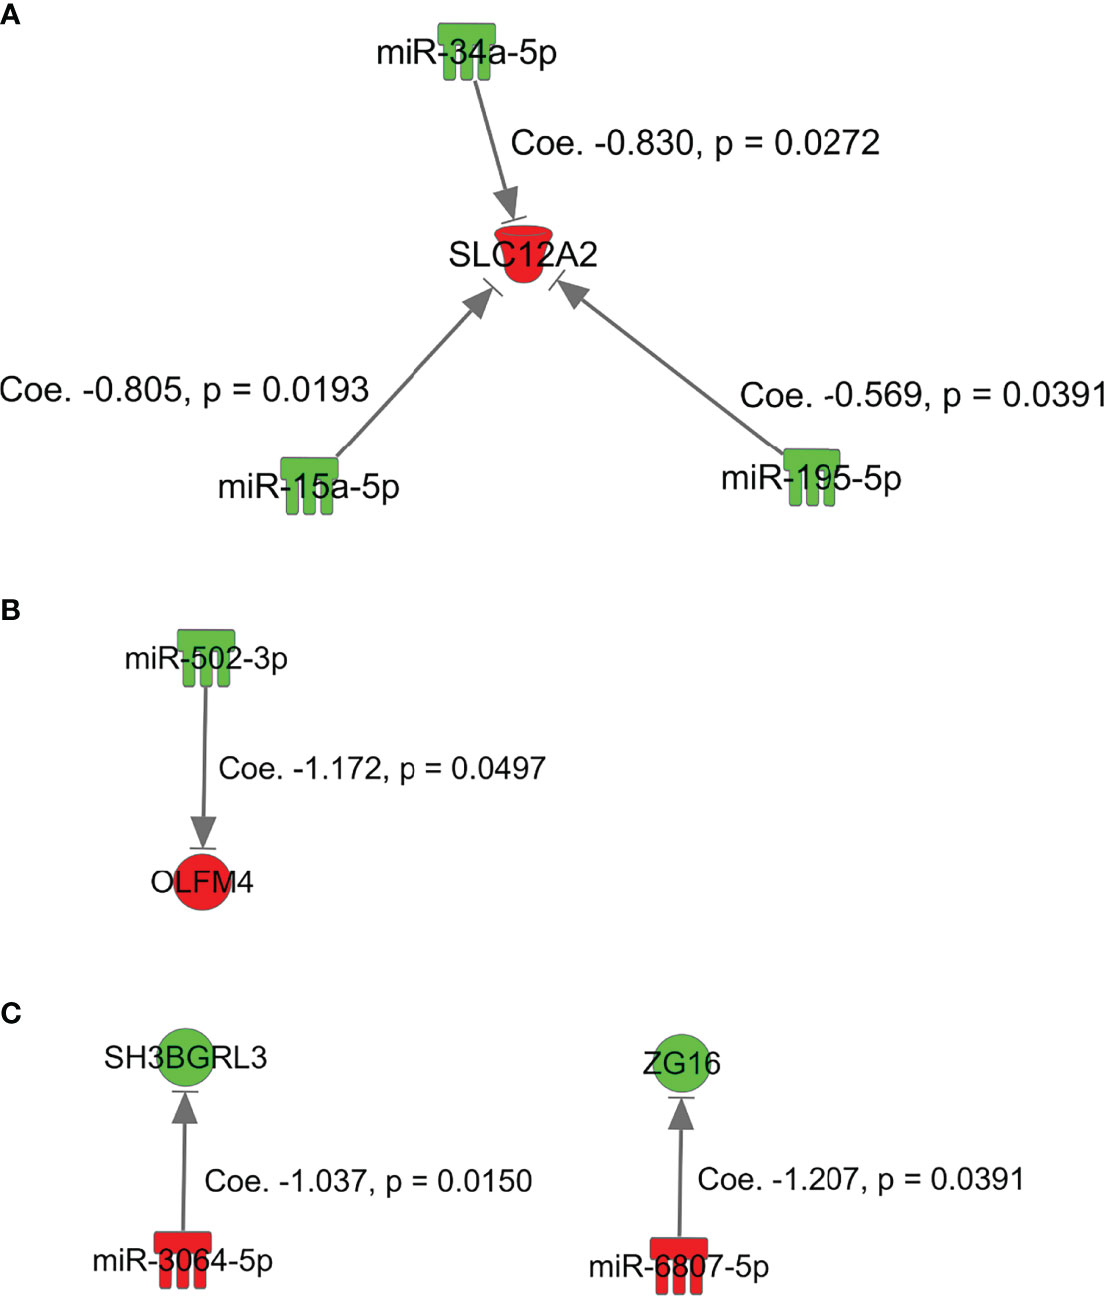
Figure 3 miRNAs and mRNAs with inverse expression patterns in array-based assays in the first cohort of adenoma, intramucosal cancer, and CRC with MSS. (A), SKC12A2/miRNA-15a-5p, miRNA-34a-5p, and miRNA-195-5p in adenoma. (B) GSKIP/miRNA-664b-3p and OLFM4/miRNA-502-3p in IMC. (C) hsa-miRNA-6807-5p/ZG16 and hsa-miRNA 3064-5p/SH3BGRL3 in MSS CRC.
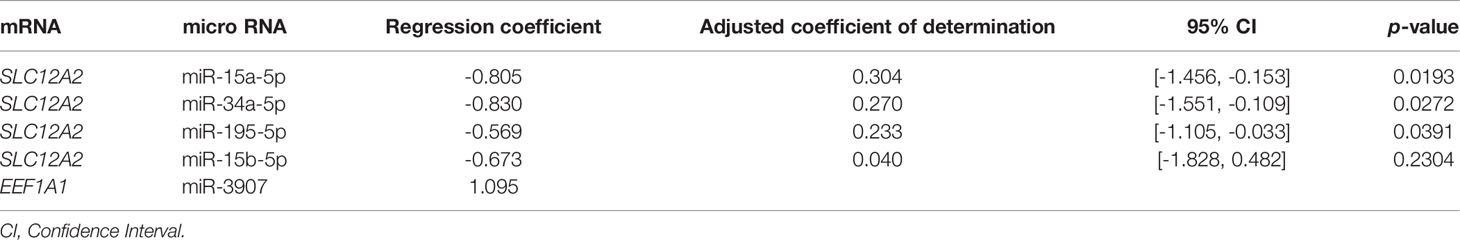
Table 2-A Simple regression analysis between micro RNA and mRNA in conventional adenoma in validation cohort (cohort 2).
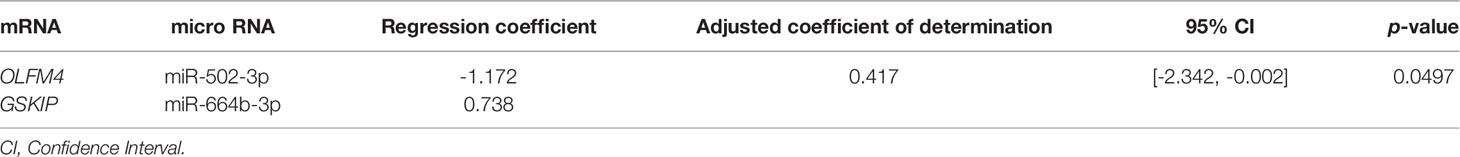
Table 2-B Simple regression analysis between micro RNA and mRNA in intramucosal cancer in validation cohort (cohort 2).
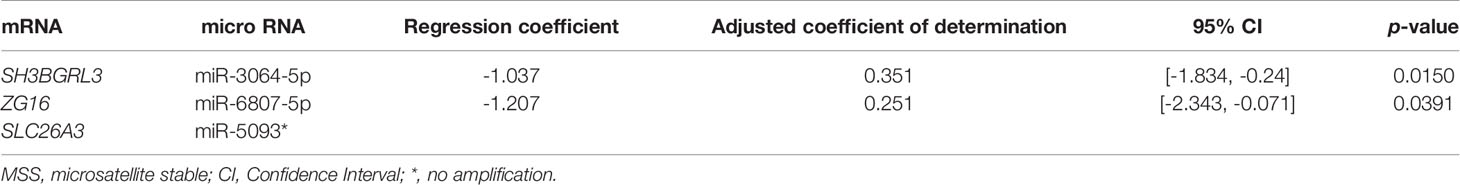
Table 2-C Simple regression analysis between micro RNA and mRNA in colorectal cancer with an MSS phenotype in validation cohort (cohort 2).
Comprehensive Analysis of Expression Pattern of Micro RNA and Messenger RNA Within the Same Tumor
We aimed to identify genome-wide miRNA/mRNA expression patterns occurring within the same tumor during neoplastic progression according to the adenoma–carcinoma sequence.
miRNA Expression Profiling Within the Same Tumor
Using a similar method, we also investigated the expression profiles of miRNAs occurring in isolated carcinomatous glands within the same tumor. First, in a comparison of expression levels between isolated adenomatous/carcinomatous tumors and normal crypts, we found that 75 miRNAs were differentially expressed (32 upregulated and 43 downregulated) in isolated adenomatous glands and 101 differentially expressed miRNA (37 upregulated and 64 downregulated) in isolated carcinomatous glands (Figure 4-A).
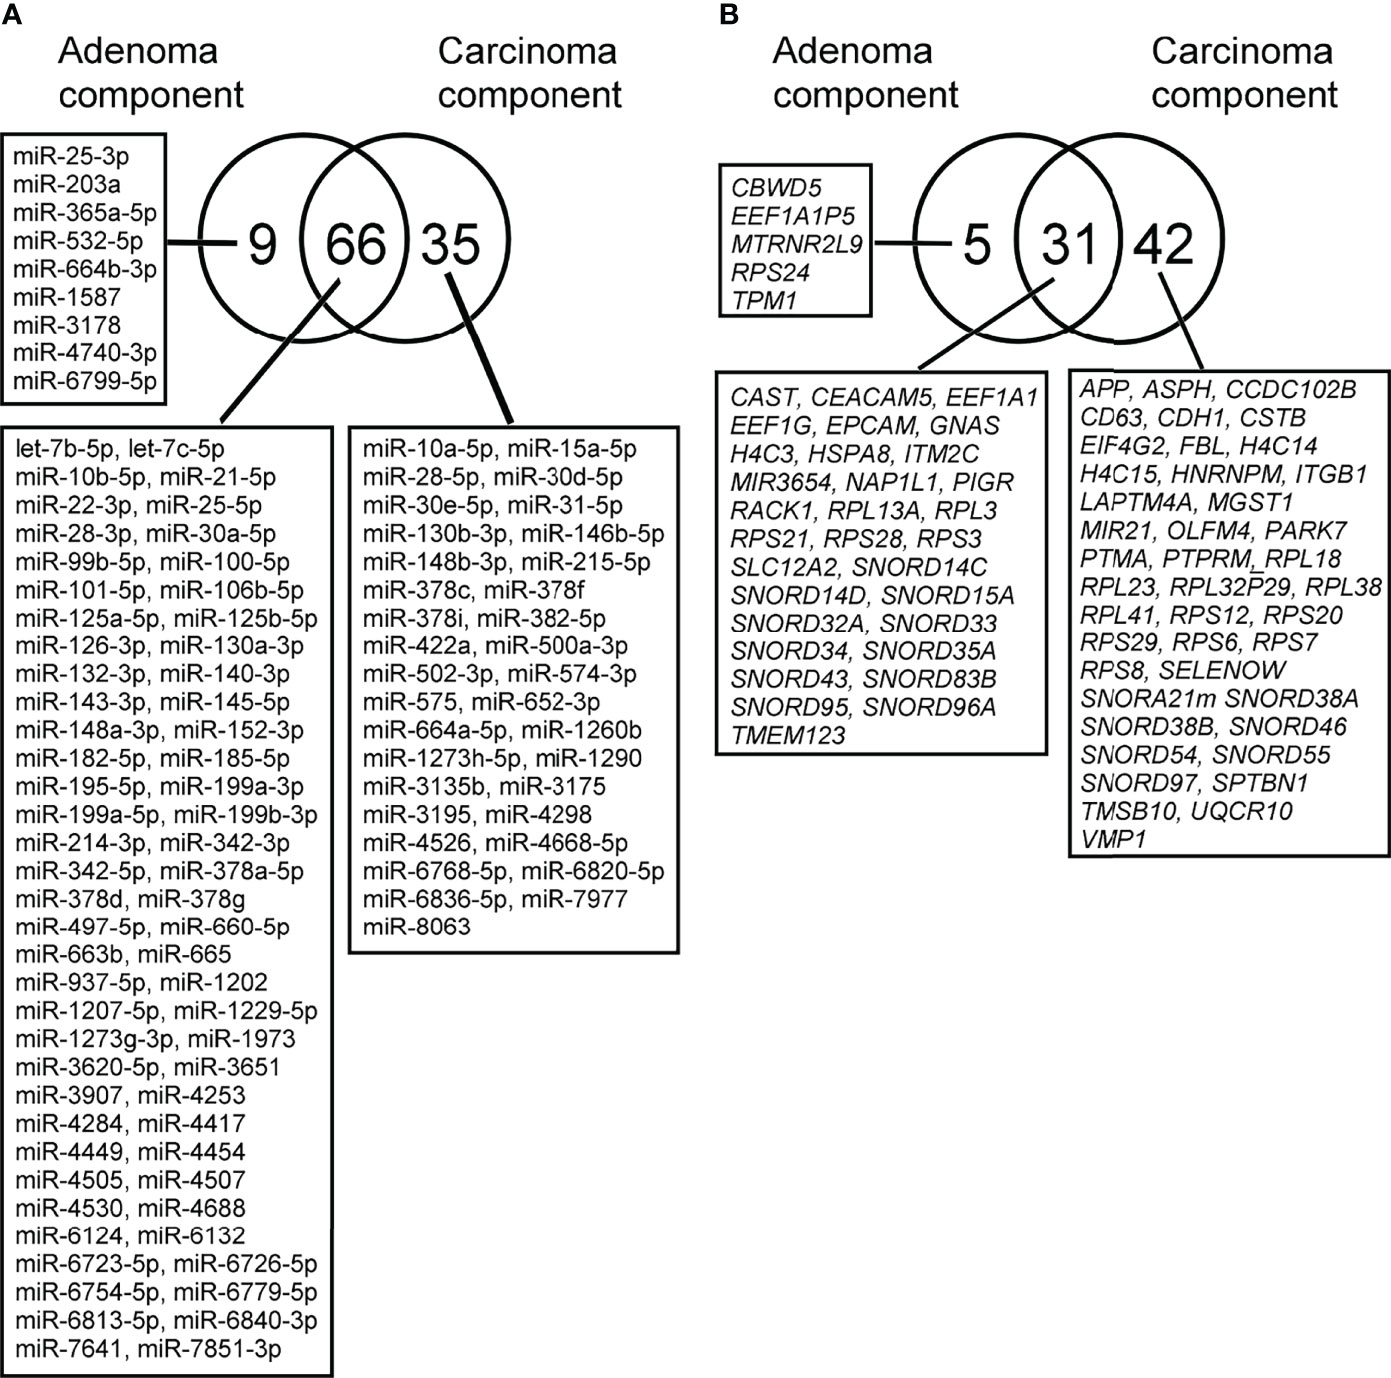
Figure 4 (A). Differential expression of miRNAs between isolated adenoma and carcinomatous glands samples obtained from “cancer in/with adenoma” case, as depicted by Venn diagram analysis. The numbers of miRNAs identified in adenoma, and cancer glands were 9 and 35, respectively. Among the two lesions, a considerable number of miRNAs overlapped with each other (adenoma and cancer, 31 miRNAs). 2-B. Differential expression of mRNAs between isolated adenoma and carcinomatous glands samples obtained from “cancer in/with adenoma” case, as depicted by Venn diagram analysis. The numbers of mRNAs identified in adenoma and cancer samples were 5, 31, and 42. Among the two lesions, a considerable number of mRNAs were overlapped (adenoma and cancer samples, 31 mRNAs).
mRNA Expression Profiling in Isolated Adenomatous and Carcinomatous Glands Within the Same Tumor
Global mRNA expression profiles of 15 isolated colorectal adenomatous and carcinomatous glands within a tumor were evaluated and compared with those of normal isolated gland samples. In isolated adenomatous samples, 36 mRNAs showed differential upregulation, and 71 upregulated and 2 downregulated mRNAs were then set from isolated carcinomatous glands within a tumor. The detailed data and a Venn diagram were previously reported (Figure 4-B) (24).
Integrated Analysis of miRNA and mRNA Expression Within the Same Tumor and Simple Regression Analysis of Array-Based Samples
Next, IPA was used to identify functional miRNA-mRNA patterns by evaluating the inverse expression of miRNAs and their targeted mRNAs. Of 75 aberrantly expressed miRNAs identified in isolated adenomatous glands, 39 miRNA-mRNA pairs showed opposite expression patterns (Supplementary Figure 5-A; Supplementary Table 3-A). Of 101 aberrantly expressed miRNAs set from isolated carcinomatous glands, 123 miRNA-mRNA pairs with opposite expression patterns were suggested (Supplementary Figure 5-B; Supplementary Table 3-B).
Simple regression analysis for array-based assays was performed to select candidate pairs of miRNA-mRNA networks (Figures 5-A and -B). According to these criteria, we found 6 miRNA/mRNA pairs, including miRNA-132-3p/CBWD5 (cobalamin synthase W domain-5), miRNA-3907/EEF1A1, miRNA-130a-3p/HSPA8 (heat shock protein family A [Hsp70] member 8), miRNA-132-3p/NAP1L1 (nucleosome assembly protein 1 like 1), miRNA-125b-5p/PIGR (polymeric immunoglobulin receptor), and miRNA-22-3p/RP53 (retinitis pigmentosa 53) in isolated adenomatous glands (Figure 5-A). We also identified 2 miRNA/mRNA pairs, including miRNA-660-5p and miRNA-664a-5p/APP (amyloid beta precursor protein), in isolated carcinomatous glands (Figure 5-B).
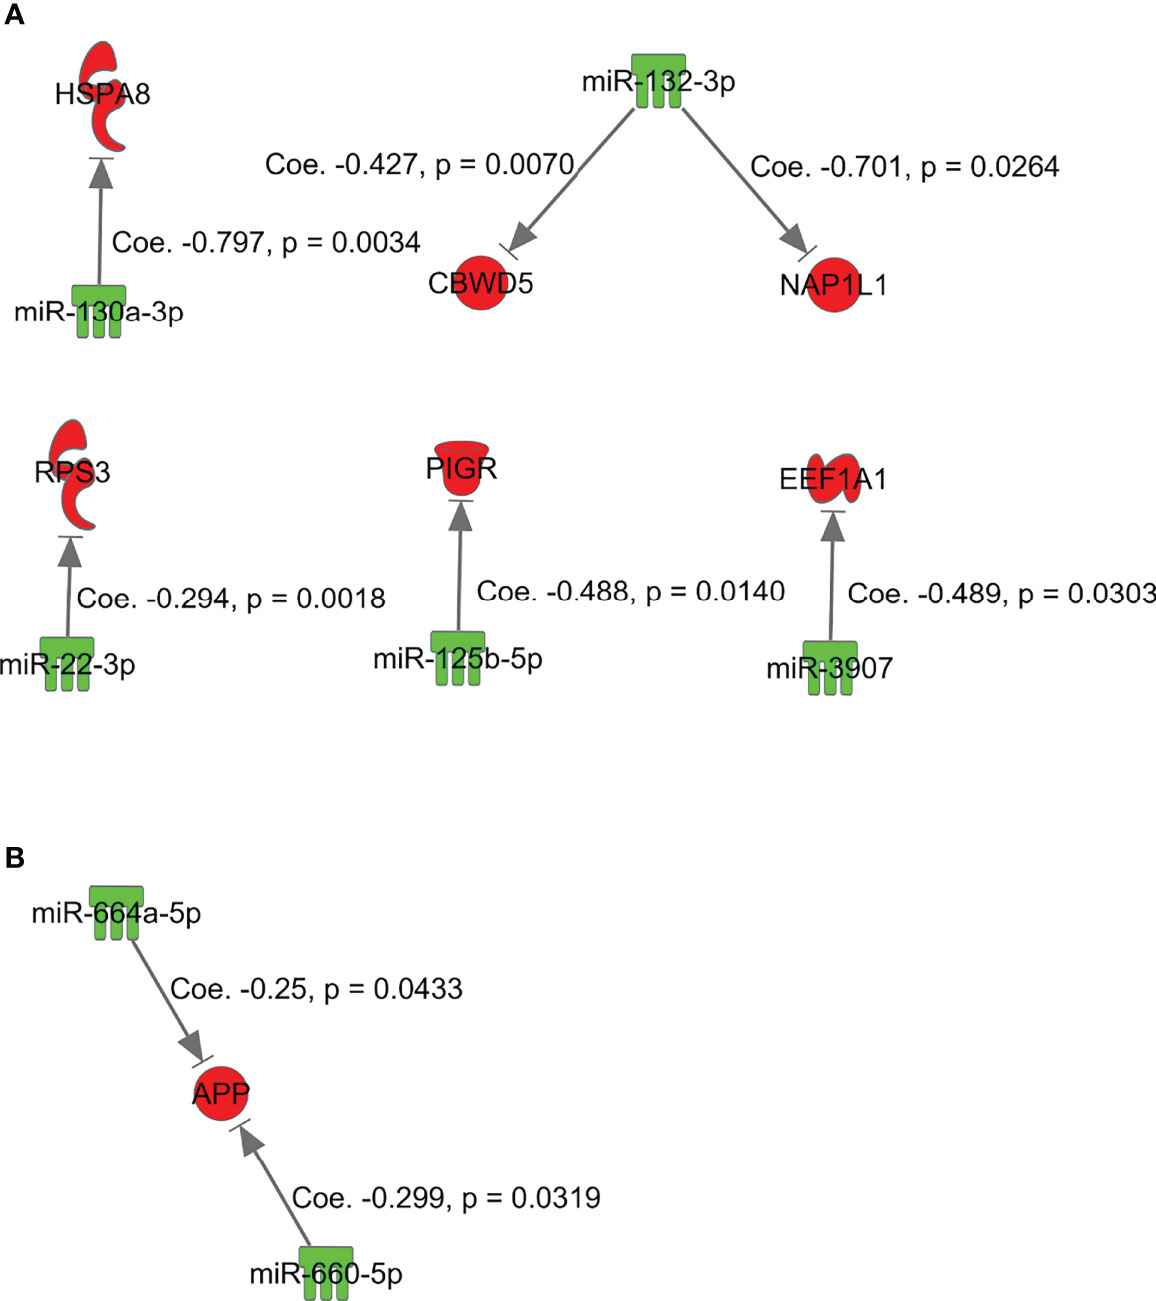
Figure 5 miRNAs and mRNAs with inverse expression patterns in the adenoma component in the array-based assays. (A) miRNA-132-3p/CBWD5, miRNA-3907/EEF1A1, miRNA-130a-3p/HSPA8, miRNA-132-3p/NAP1L1, miRNA-125b-5p/PIGR, and miRNA-22-3p/RP53. (B) miRNA-660-5p and miRNA-664a-5p/APP.
Effects of the Transfected miRNA Mimics miRNA-6078-5p and miRNA 3064-5p on SH3BGRL3 and ZG16 Expression
We transfected CRC cells with the miRNA mimics miRNA-6078-5p and miRNA 3064-5p and assessed their effects on the expression of candidate target genes (Figure 6). We found that ectopic expression of miRNA 3064-5p suppressed SH3BGRL3 expression. On the other hand, ectopic expression of miRNA-6078-5p had no effect on ZG16 expression; however, this result does not necessarily imply that ZG16 is not a potential target gene of miRNA-6807-5p in CRC cells.
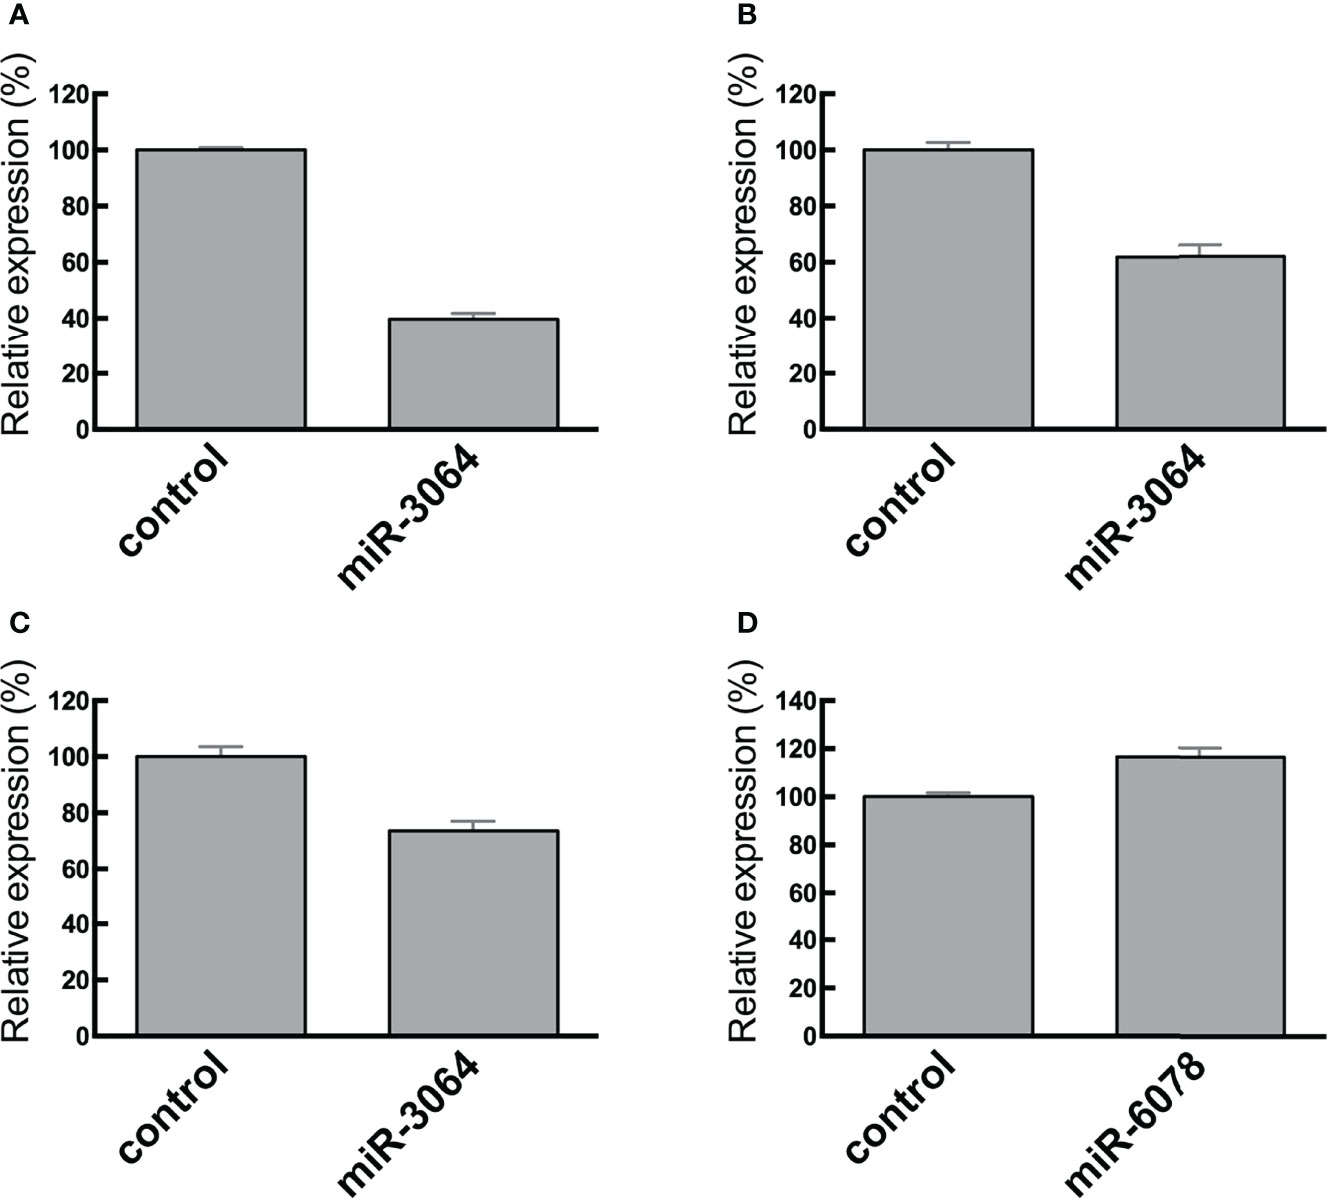
Figure 6 RT-qPCR analysis of SH3BGRL3 (A–C) and ZG16 (D) in normal colon tissues and CRC cell lines. Relative reduced expression of SH3BGRL3 in DLD1 cells after transfection of the miR-3064 mimic. (B) Relative reduced expression of SH3BGRL3 in RKO cells after transfection of the miR-3064 mimic. (C) Relative reduced expression of SH3BGRL3 in Colo320 cells after transfection of the miR-3064 mimic. (D) Relative high expression of ZG16 in CaCO2 cells after transfection of the miR-6078 mimic.
Associations Between ZG16 and hsa-miRNA 3064-5p and Between SH3BGRL3 and hsa-miRNA-6807 Expression in The Cancer Genome Atlas Database
We attempted to explore miRNA and mRNA expression data from the portal site of the TCGA-colon adenocarcinoma project database (RNA-Seq data, HTSeq-Counts and miRNA-Seq data, and British Canadian’s Genome Science Center miRNA profiling data). However, in this database, we could not find public data examining the association between ZG16 and hsa-miRNA-6807 or between SH3BGRL3 and hsa-miRNA 3064-5p expression.
Discussion
Bioinformatics and data mining are rapidly advancing, thereby allowing a multi-omics approach to the investigation of the biological alterations underlying disease (25). New technologies now enable the use of large-scale data bases. The Cancer Genome Atlas is a huge database of cancer-related results and has been used as a reference for studies performed worldwide (6). By contrast, MiRTarBase provides data for experimentally confirmed miRNA-mRNA pairs in several diseases (26). However, relatively few studies have targeted pairs of miRNAs/mRNAs identified in the “adenoma-carcinoma sequence”. Therefore, we examined potential network patterns of miRNAs/mRNAs occurring in adenomas, IMCs, and CRCs having the MSI phenotype based on a comprehensive genome-wide method.
In the present study, two approaches were adopted to evaluate neoplastic progression from adenomatous to carcinomatous lesions. First, comprehensive expression analyses of miRNAs and mRNAs were separately performed in each lesion, including adenomas, IMCs, and CRCs having the MSS phenotype (model A). Second, using a similar method, expressions of miRNA and mRNA were examined separately in isolated adenomatous and carcinomatous glands obtained from the same tumor (model B). Similar pairs of miRNAs/mRNAs are expected to be found in both models. However, the patterns of miRNAs/mRNAs found differed between models A and B. In model B, this finding is very important in that molecular alterations occurring in the adenoma component without carcinomatous lesions (adenoma only lesion) differ from those derived from the adenoma component with carcinomatous lesions within a single tumor. This theory may be supported by the finding that multiple networks of miRNAs/mRNAs are closely associated with model B lesions, unlike the network pattern in model A (27, 28).
In the present study, some mRNA/miRNA pairs with an inverse correlation were found to be closely associated with the initial stage of colorectal carcinogenesis. The translocation of substrates through biological membranes is regulated by transporter proteins (29), including ATP-binding cassette and solute carrier (SLC) proteins, which are expressed in most tissues (29). Importantly, SLC proteins have been shown to exhibit differential expression in gastrointestinal neoplasms (29). In gastrointestinal tumors, including colorectal adenomas, the functions of SLC12A2 have not been fully elucidated. Here, the expression of SLC12A2 was upregulated due to downregulation of several miRNAs, including hsa-miR-34a-5p, hsa-miR-15b-5p, and hsa-miR-195-5p, in isolated adenomatous glands derived from model A lesions. These results suggest that SLC12A2 could contribute to the initial stages of colorectal tumorigenesis.
In the present study, expression of hsa-miRNA-502-3p was inversely correlated to that of OLFM4 in IMC. OLFM4 is an evolutionarily conserved glycoprotein that belongs to the OLFM family and is abundantly expressed in intestinal crypts (30). A recent study also demonstrated that OLFM4 plays an important role in preserving intestinal Lgr5-positive stem cells (31). This result suggests that reduced expression of OLFM4, which is regulated by high expression of miRNA-502-3p, may be closely associated with early colorectal carcinogenesis.
In the advanced stage of colorectal carcinogenesis, there was an inverse correlation between miRNA-6807-5p and ZG16 and between miRNA 3064-5p and SH3BGRL3. ZG16 is one of the most significantly downregulated genes in colorectal cancer (CRC) tissues (32, 33). Previous studies showed that reduced expression of ZG16 may play an important role in cancer progression (32, 33). In addition, ZG16 may serve as a potential biomarker for CRC diagnosis and prognosis (33). According to the transfection assay in our study, however, we did not find that downregulation of ZG16 was correlated with upregulation of miRNA-6807-5p. There are a couple of explanations for this result. First, ZG16 may not be a direct target of miRNA-6807-5p, and another mechanism may play an important role in ZG16 regulation. Second, the results of our in vitro experiment may not reflect what occurs in vivo. On the other hand, we identified that ectopic expression of miRNA 3064-5p suppressed SH3BGRL3 expression. We suggest that the inverse relationship between miRNA 3064-5p and SH3BGRL3 plays an important role in colorectal carcinogenesis.
Our findings suggested inverse correlations between paired mRNAs and miRNAs necessary for progression of a tumor from adenoma to IMC (model B). In adenomatous lesions isolated from the same tumor, we observed two inverse correlations of paired mRNAs/miRNAs, including RP53/miRNA-3907 or miRNA22-3p and HSPA8/miRNA-130a-3p. First, ribosomal protein (RP) expression has been shown to be higher in tumor cells than in normal cells (21, 34). RPs are differentially expressed in tumors, and the expression levels vary among the different stages of cancer. RPs may promote tumor development in CRC (21, 34). Second, HSPA8 protein is a constitutively expressed molecular chaperone that assists the conformational folding or unfolding of other macromolecular structures (35). A previous study showed that upregulation of HSPA8 plays a vital role in the development of endometrial carcinoma (36). According to the present results, however, such transcripts may act as tumor suppressors in adenoma development. We suggest that the mRNA/miRNA pairs HSPA8/miRNA-130a-3p and RP53/miRNA-3907 or miRNA22-3p play an important role in the development of the adenomatous component of a tumor.
We also identified two miRNA/mRNA pairs, including miRNA-660-5p and miRNA-664a-5p/APP, in isolated carcinomatous glands from the same tumor (model B). APLP2 shows a broad expression pattern, whereas APLP1 is expressed primarily in neural tissues (37, 38). APP protein and APLP2 mRNA are overexpressed in many tumors (37), including cancers of the prostate, breast, colon, thyroid, lung, nasopharynx, and gastrointestinal tract (37). Both in vitro and in vivo studies have demonstrated the roles of APP in promoting colon cancer growth and proliferation (39). In the present study, however, APP expression was downregulated by high expression of miRNA-660-5p and miRNA-664a-5p, suggesting that the associations of miRNA-660-5p and miRNA-664a-5p with APP may promote tumor progression from adenoma to carcinoma.
This study had some limitations. First, we evaluated only a small number of samples in this study. However, we used isolated tumor glands, thereby excluding interstitial cells that could otherwise obscure molecular alterations within tumor cells. Isolated tumor glands are essential in the search for molecular alterations in the target tissue. Thus, our data may provide new insights into the evaluation of colorectal carcinogenesis, especially at the early stage, which has not been fully identified previously. Second, we could not perform a validation test in model B lesions. Importantly, obtaining isolated adenomatous and carcinomatous glands from the same tumor is quite challenging when analyzing clinical samples. As far as we know, the analysis of the expression of miRNA and mRNA was first reported in model B. We provided additional information elucidating neoplastic progression within the same tumor.
In conclusion, we examined the relationship between miRNA and mRNA expression in isolated adenomatous and carcinomatous glands, including IMC and CRC with an MSS phenotype. In addition, we identified miRNA/mRNA networks in the progression from adenomatous to carcinomatous lesions by analyzing the association between miRNA and mRNA expression in the same tumor. It is particularly interesting that network patterns of miRNA/mRNA in adenoma and IMC were different from those of adenomatous and carcinomatous lesions within a single tumor. These results indicated that there are two types of adenomas (molecularly stable and unstable). Further studies are needed to identify network patterns of miRNA/mRNA expression and function in colorectal tumors.
Data Availability Statement
The datasets presented in this study can be found in online repositories. The names of the repository/repositories and accession number(s) can be found in the article/Supplementary Material.
Ethics Statement
The studies involving human participants were reviewed and approved by The ethics committee of Iwate Medical University Hospital (reference number: HG2020-067). The patients/participants provided their written informed consent to participate in this study. Written informed consent was obtained from the individual(s) for the publication of any potentially identifiable images or data included in this article.
Author Contributions
TS (first and corresponding author) contributed to manuscript preparation, including data collection and analysis. MO and RS carried out data collection and statistical analyses. ME and YT collected isolated tumors and normal glands. NY assisted with data preparation. KO, AS, and TM gave clinical support during manuscript preparation. TN and HS supported the molecular analyses. All authors contributed to the article and approved the submitted version.
Conflict of Interest
The authors declare that the research was conducted in the absence of any commercial or financial relationships that could be construed as a potential conflict of interest.
Publisher’s Note
All claims expressed in this article are solely those of the authors and do not necessarily represent those of their affiliated organizations, or those of the publisher, the editors and the reviewers. Any product that may be evaluated in this article, or claim that may be made by its manufacturer, is not guaranteed or endorsed by the publisher.
Acknowledgments
We thank Ms. E. Sugawara and Mrs. Ishikawa for technical assistance. We also appreciate the support of members of the Department of Molecular Diagnostic Pathology, Iwate Medical University.
Supplementary Material
The Supplementary Material for this article can be found online at: https://www.frontiersin.org/articles/10.3389/fonc.2022.831100/full#supplementary-material
Supplementary Figure 1 | Work flow of the present study.
Supplementary Figure 2 | (A). Histological feature (HE). (B). Isolated glands under a dissecting microscope. (C). Hematoxylin–eosin staining of isolated crypts. (D). Normal gland (BAT25). (E). Tumor gland (BAT25). (F). Normal gland (BAT26). (G). Tumor gland (BAT26).
Supplementary Figure 3 | Candidate connection of paired miRNAs/mRNAs with reciprocal expression in adenoma (A), IMC (B), and CRC with the MSS phenotype (C) (type A).
Supplementary Figure 4 | Significant miRNA/mRNA pairs with inverse relationships in adenoma (A)components (A), IMC (B), and CRC with the MSS phenotype (C).
Supplementary Figure 5 | miRNA/mRNA pairs with inverse relationships based on the adenoma–carcinoma sequence within the same tumor. (A) Adenoma and (B) IMC components.
References
1. Vogelstein B, Fearon ER, Hamilton SR, Kern SE, Preisinger AC, Leppert M, et al. Genetic Alterations During Colorectal-Tumor Development. N Engl J Med (1988) 319(9):525–32. doi: 10.1056/NEJM198809013190901
2. Pino MS, Chung DC. The Chromosomal Instability Pathway in Colon Cancer. Gastroenterology (2010) 138(6):2059–72. doi: 10.1053/j.gastro.2009.12.065
3. Lengauer C, Kinzler KW, Vogelstein B. Genetic Instability in Colorectal Cancers. Nature (1997) 386(6625):623–7. doi: 10.1038/386623a0
4. Leggett B, Whitehall V. Role of the Serrated Pathway in Colorectal Cancer Pathogenesis. Gastroenterology (2010) 138(6):2088–100. doi: 10.1053/j.gastro.2009.12.066
5. Ogino S, Goel A. Molecular Classification and Correlates in Colorectal Cancer. J Mol Diagn (2008) 10(1):13–27. doi: 10.2353/jmoldx.2008.070082
6. Cancer Genome Atlas Network. Comprehensive Molecular Characterization of Human Colon and Rectal Cancer. Nature (2012) 487(7407):330–7. doi: 10.1038/nature11252
7. Hamilton SR, Sekine S. Conventional Colorectal Adenoma. WHO Classification of Tumours of the Digestive System. Lyon: International Agency for Research on Cancer (2019) p. 170–3.
8. Ye JJ, Cao J. MicroRNAs in Colorectal Cancer as Markers and Targets: Recent Advances. World J Gastroenterol (2014) 20(15):4288–99. doi: 10.3748/wjg.v20.i15.4288
9. Schetter AJ, Okayama H, Harris CC. The Role of microRNAs in Colorectal Cancer. Cancer J (2012) 18(3):244–52. doi: 10.1097/PPO.0b013e318258b78f
10. Chen X, Yin J, Qu J, Huang L. MDHGI: Matrix Decomposition and Heterogeneous Graph Inference for miRNA-Disease Association Prediction. PloS Comput Biol (2018) 14:e1006418. doi: 10.1371/journal.pcbi.1006418
11. Zhu J, Xu Y, Liu S, Qiao L, Sun J, Zhao Q. MicroRNAs Associated With Colon Cancer: New Potential Prognostic Markers and Targets for Therapy. Front Bioeng Biotechnol (2020) 8:176. doi: 10.3389/fbioe.2020.00176
12. Su J, Lu E, Lu L, Zhang C. MiR-29a-3p Suppresses Cell Proliferation in Laryngocarcinoma by Targeting Prominin 1. FEBS Open Bio (2017) 7:645–51. doi: 10.1002/2211-5463.12199
13. Truong AD, Rengaraj D, Hong Y, Hoang CT, Hong YH, Lillehoj HS. Differentially Expressed JAK-STAT Signaling Pathway Genes and Target microRNAs in the Spleen of Necrotic Enteritis-Afflicted Chicken Lines. Res Vet Sci (2018) 115:235–43. doi: 10.1016/j.rvsc.2017.05.018
14. Santos RM, Moreno C, Zhang WC. Non-Coding RNAs in Lung Tumor Initiation and Progression. Int J Mol Sci (2020) 21(8):2774. doi: 10.3390/ijms21082774
15. Abdalla F, Singh B, Bhat HK. MicroRNAs and Gene Regulation in Breast Cancer. J Biochem Mol Toxicol (2020) 34(11):e22567. doi: 10.1002/jbt.22567
16. Vidigal JA, Ventura A. The Biological Functions of miRNAs: Lessons From In Vivo Studies. Trends Cell Biol (2015) 25(3):137–47. doi: 10.1016/j.tcb.2014.11.004
17. Japanese Society for Cancer of the Colon and Rectum. Japanese Classification of Colorectal Carcinoma, Second English Edition. Tokyo: Kanehara Co (2009) p. 30–63.
18. Habano W, Sugai T, Nakamura S, Yoshida T. A Novel Method for Gene Analysis of Colorectal Carcinomas Using a Crypt Isolation Technique. Lab Invest (1996) 74(5):933–40.
19. Takahashi H, Sugai T, Habano W, Nakamura S. Application of the Crypt Isolation Technique to the Assessment of Genetic Alterations of Colorectal Carcinomas. Pathol Int (2002) 52(10):628–35. doi: 10.1046/j.1440-1827.2002.01395.x
20. Boland CR, Thibodeau SN, Hamilton SR, Sidransky D, Eshleman JR, Burt RW, et al. A National Cancer Institute Workshop on Microsatellite Instability for Cancer Detection and Familial Predisposition: Development of International Criteria for the Determination of Microsatellite Instability in Colorectal Cancer. Cancer Res (1998) 58(22):5248–57.
21. Lai MD, Xu J. Ribosomal Proteins and Colorectal Cancer. Curr Genomics (2007) 8(1):43–9. doi: 10.2174/138920207780076938
22. Sato C, Osakabe M, Nagasawa T, Suzuki H, Itamochi H, Baba T, et al. Genome-Wide Analysis of microRNA to Evaluate Prognostic Markers in Isolated Cancer Glands and Surrounding Stroma in High-Grade Serous Ovarian Carcinoma. Oncol Lett (2020) 20(6):338. doi: 10.3892/ol.2020.12198
23. Sugai T, Osakabe M, Sugimoto R, Eizuka M, Tanaka Y, Yanagawa N, et al. A Genome-Wide Study of the Relationship Between Chromosomal Abnormalities and Gene Expression in Colorectal Tumors. Genes Chromosomes Cancer (2021) 60(4):250–62. doi: 10.1002/gcc.22924
24. Sugai T, Osakabe M, Habano W, Tanaka Y, Eizuka M, Sugimoto R, et al. A Genome-Wide Analysis of the Molecular Alterations Occurring in the Adenomatous and Carcinomatous Components of the Same Tumor Based on the Adenoma–Carcinoma Sequence. Pathol Int (2021) 71(9):582–93. doi: 10.1111/pin.13129
25. Hasin Y, Seldin M, Lusis A. Multi-Omics Approaches to Disease. Genome Biol (2017) 18(1):83. doi: 10.1186/s13059-017-1215-1
26. Chou CH, Shrestha S, Yang CD, Chang NW, Lin YL, Liao KW, et al. Mirtarbase Update 2018: A Resource for Experimentally Validated microRNA-Target Interactions. Nucleic Acids Res (2018) 46(D1):D296–302. doi: 10.1093/nar/gkx1067
27. Haigis KM, Caya JG, Reichelderfer M, Dove WF. Intestinal Adenomas can Develop With a Stable Karyotype and Stable Microsatellites. Proc Natl Acad Sci USA (2002) 99(13):8927–31. doi: 10.1073/pnas.132275099
28. Hermsen M, Postma C, Baak J, Weiss M, Rapallo A, Sciutto A, et al. Colorectal Adenoma to Carcinoma Progression Follows Multiple Pathways of Chromosomal Instability. Gastroenterology (2002) 123(4):1109–19. doi: 10.1053/gast.2002.36051
29. Xie J, Zhu XY, Liu LM, Meng ZQ. Solute Carrier Transporters: Potential Targets for Digestive System Neoplasms. Cancer Manag Res (2018) 10:153–66. doi: 10.2147/CMAR.S152951
30. Zhang J, Liu WL, Tang DC, Chen L, Wang M, Pack SD, et al. Identification and Characterization of a Novel Member of Olfactomedin-Related Protein Family, hGC-1, Expressed During Myeloid Lineage Development. Gene (2002) 283(1-2):83–93. doi: 10.1016/s0378-1119(01)00763-6
31. van der Flier LG, Haegebarth A, Stange DE, van de Wetering M, Clevers H. OLFM4 is a Robust Marker for Stem Cells in Human Intestine and Marks a Subset of Colorectal Cancer Cells. Gastroenterology (2009) 137(1):15–7. doi: 10.1053/j.gastro.2009.05.035
32. Chen X, Du P, She J, Cao L, Li Y, Xia H. Loss of ZG16 is Regulated by miR-196a and Contributes to Stemness and Progression of Colorectal Cancer. Oncotarget (2016) 7(52):86695–703. doi: 10.18632/oncotarget.13435
33. Meng H, Li W, Boardman LA, Wang L. Loss of ZG16 is Associated With Molecular and Clinicopathological Phenotypes of Colorectal Cancer. BMC Cancer (2018) 18(1):433. doi: 10.1186/s12885-018-4337-2
34. Slimane SN, Marcel V, Fenouil T, Catez F, Saurin JC, Bouvet P, et al. Ribosome Biogenesis Alterations in Colorectal Cancer. Cells (2020) 9(11):2361. doi: 10.3390/cells9112361
35. Santos TG, Martins VR, Hajj GNM. Unconventional Secretion of Heat Shock Proteins in Cancer. Int J Mol Sci (2017) 18(5):946. doi: 10.3390/ijms18050946
36. Shan N, Zhou W, Zhang S, Zhang Y. Identification of HSPA8 as a Candidate Biomarker for Endometrial Carcinoma by Using iTRAQ-Based Proteomic Analysis. Onco Targets Ther (2016) 9:2169–79. doi: 10.2147/OTT.S97983
37. Pandey P, Sliker B, Peters HL, Tuli A, Herskovitz J, Smits K, et al. Amyloid Precursor Protein and Amyloid Precursor-Like Protein 2 in Cancer. Oncotarget (2016) 7(15):19430–44. doi: 10.18632/oncotarget.7103
38. Venkataramani V, Rossner C, Iffland L, Schweyer S, Tambol IY, Walter J, et al. Histone Deacetylase Inhibitor Valproic Acid Inhibits Cancer Cell Proliferation via Down-Regulation of the Alzheimer Amyloid Precursor Protein. J Biol Chem (2010) 285(14):10678–89. doi: 10.1074/jbc.M109.057836
Keywords: adenoma, adenoma-carcinoma sequence, array-based analysis, microRNA, messenger RNA
Citation: Sugai T, Osakabe M, Niinuma T, Sugimoto R, Eizuka M, Tanaka Y, Yanagawa N, Otsuka K, Sasaki A, Matsumoto T and Suzuki H (2022) Genome-Wide Analysis of microRNA and mRNA Expression in Colorectal Intramucosal Neoplasia and Colorectal Cancer With a Microsatellite-Stable Phenotype Based on Adenoma-Carcinoma Sequences. Front. Oncol. 12:831100. doi: 10.3389/fonc.2022.831100
Received: 08 December 2021; Accepted: 10 June 2022;
Published: 07 July 2022.
Edited by:
Simona Gurzu, George Emil Palade University of Medicine, Pharmacy, Sciences and Technology of Târgu Mureş, RomaniaReviewed by:
Kuei-Yang Hsiao, National Chung Hsing University, TaiwanEmanuela Bostjancic, University of Ljubljana, Slovenia
Copyright © 2022 Sugai, Osakabe, Niinuma, Sugimoto, Eizuka, Tanaka, Yanagawa, Otsuka, Sasaki, Matsumoto and Suzuki. This is an open-access article distributed under the terms of the Creative Commons Attribution License (CC BY). The use, distribution or reproduction in other forums is permitted, provided the original author(s) and the copyright owner(s) are credited and that the original publication in this journal is cited, in accordance with accepted academic practice. No use, distribution or reproduction is permitted which does not comply with these terms.
*Correspondence: Tamotsu Sugai, dHN1Z2FpQGl3YXRlLW1lZC5hYy5qcA==
†These authors have contributed equally to this work