 Xiongdong Zhong
 Xianchang Yu1
 Hao Chang
- 1Department of Cardiothoracic Surgery, Zhuhai People’s Hospital (Zhuhai Hospital Affiliated with Jinan University), Zhuhai, China
- 2Department of Protein Modification and Cancer Research, Hanyu Biomed Center Beijing, Beijing, China
Background: The initiation and progression of tumors were due to variations of gene sets rather than individual genes. This study aimed to identify novel biomarkers based on gene set variation analysis (GSVA) in hepatocellular carcinoma.
Methods: The activities of 50 hallmark pathways were scored in three microarray datasets with paired samples with GSVA, and differential analysis was performed with the limma R package. Unsupervised clustering was conducted to determine subtypes with the ConsensusClusterPlus R package in the TCGA-LIHC (n = 329) and LIRI-JP (n = 232) cohorts. Differentially expressed genes among subtypes were identified as initial variables. Then, we used TCGA-LIHC as the training set and LIRI-JP as the validation set. A six-gene model calculating the risk scores of patients was integrated with the least absolute shrinkage and selection operator (LASSO) and stepwise regression analyses. Kaplan–Meier (KM) and receiver operating characteristic (ROC) curves were performed to assess predictive performances. Multivariate Cox regression analyses were implemented to select independent prognostic factors, and a prognostic nomogram was integrated. Moreover, the diagnostic values of six genes were explored with the ROC curves and immunohistochemistry.
Results: Patients could be separated into two subtypes with different prognoses in both cohorts based on the identified differential hallmark pathways. Six prognostic genes (ASF1A, CENPA, LDHA, PSMB2, SRPRB, UCK2) were included in the risk score signature, which was demonstrated to be an independent prognostic factor. A nomogram including 540 patients was further integrated and well-calibrated. ROC analyses in the five cohorts and immunohistochemistry experiments in solid tissues indicated that CENPA and UCK2 exhibited high and robust diagnostic values.
Conclusions: Our study explored a promising prognostic nomogram and diagnostic biomarkers in hepatocellular carcinoma.
Introduction
Hepatocellular carcinoma (HCC) is the most common liver cancer and the fourth leading cause of tumor-induced death worldwide (1). Based on recent cancer reports, mortality due to hepatocellular carcinoma has been rising rapidly compared with other cancer-related deaths in both men and women (2). Due to the insidious onset of HCC and the need for viable treatment strategies, the prognosis of HCC remains very poor, and the 5-year relative survival rate is no more than 10% (3). In this manner, there is an urgent need to recognize robust and accurate biomarkers for HCC. Multifactor models have performed extraordinary potential for future applications. In one investigation on an expansive breast cancer meta-dataset, straightforward multigene models reliably outflanked single-gene biomarkers in all segments (4). In another survey on classifiers to predict breast cancer recurrences, integrated classifiers were much better than routine biomarkers (ER, PR, HER2, Ki67) (5).
Gene set variation analysis (GSVA) is an enrichment strategy for quantifying the activities of gene sets in an unsupervised way for microarray or RNA-sequencing data (6). It has become an effective method for cancer subtype discovery or other biological issues. For instance, one investigation on the microenvironment of lung cancer conducted this algorithm to quantify the variations of relative gene sets in malignant and non-malignant cells, which led to a deeper understanding of cell subtypes and heterogeneities (7). In another investigation on the exploration of subtypes foreseeing the responses to immune checkpoint inhibitors, this method was also used to quantify the activity of a gene set controlling DNA damage and repair (8).
In this study, we quantified and differentially analyzed the activities of 50 hallmark pathways in five cohorts with GSVA (9). Patients could be separated into two subtypes with significant prognostic differences in two RNA-sequencing datasets based on the 10 identified differential hallmark pathways. Differentially expressed genes between subtypes were identified as initial variables. Then, an accurate and robust prognostic six-gene model estimating risk scores of HCC patients was constructed with the least absolute shrinkage and selection operator (LASSO) and stepwise regression analyses (10). Six prognostic genes (ASF1A, CENPA, LDHA, PSMB2, SRPRB, UCK2) were included, and the risk score was indicated to be an independent prognostic factor. Then, a well-calibrated nomogram including 540 patients was integrated (11). Receiver operating characteristic (ROC) curve analyses in the five cohorts and immunohistochemistry experiments in solid tissues indicated that CENPA and UCK2 exhibited high and robust diagnostic values. In summary, our study explored a promising GSVA-based prognostic nomogram and diagnostic biomarkers in hepatocellular carcinoma.
Materials and Methods
Data Resources
There were five datasets selected for our work. GSE57957 (counting 39 paired tissues), GSE39791 (counting 72 paired tissues), and GSE14520 (counting 247 cancer and 241 paired adjacent tissues) were obtained from the GEO database (https://www.ncbi.nlm.nih.gov/geo). These three microarray datasets were utilized to identify differential hallmark gene sets of overlap and for diagnostic analysis. The TCGA-LIHC dataset was downloaded from The Cancer Genome Atlas (TCGA) database (https://cancergenome.nih.gov/). The LIRI-JP dataset was downloaded from the International Cancer Genome Consortium (ICGC) database (https://www.icgc.org). These two RNA-sequencing datasets were for prognostic and diagnostic analyses.
Data Processing
The overall processing progress of this study is shown in Supplementary Figure 1. The expression data of the three microarray datasets were normalized with the limma R package in R 4.0.3. RNA-sequencing data of the TCGA-LIHC and LIRI-JP datasets were analyzed using fragments per kilobase per million (FPKM). Batch effect correction was removed with the SVA R package. Log2(x + 1) transformation was conducted. TCGA-LIHC (named as the TCGA cohort in this study) was used as the training cohort (n = 329), and LIRI-JP (designated as the ICGC cohort in this study) was used as the external validation cohort (n = 232). Patient characteristics in the training and the independent external validation cohorts are shown in Table 1.
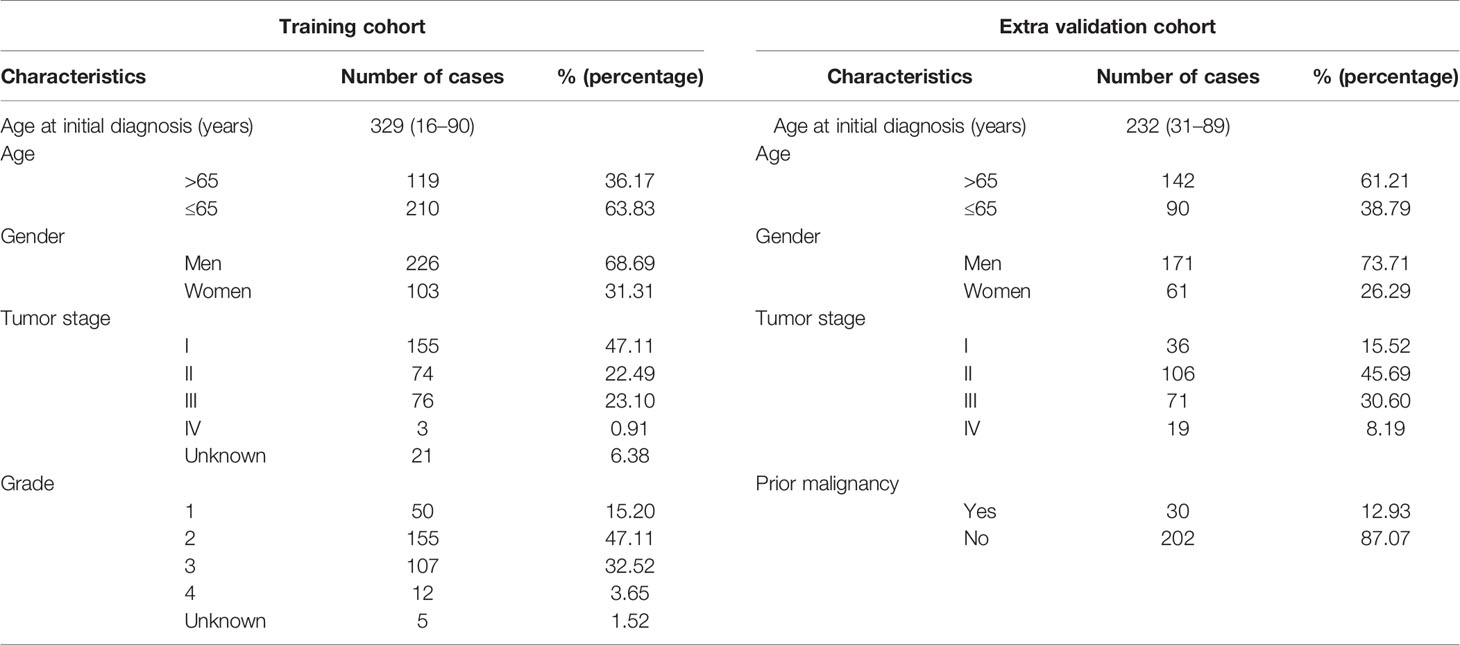
Table 1 Patient characteristics in the training and the independent extra validation cohorts.
Identification of Differential Gene Sets
Considering the technical differences between microarray and RNA sequencing (12), we used the three microarray datasets with paired tissues to select differential gene sets. The activities of the 50 hallmark pathways were quantified with the GSVA R package, and differential analyses were performed with the limma R package. The cutoff values were selected as false discovery ratio (FDR) <0.05 and |fold change| >0.3. Common differential gene sets were identified with the Venn diagram.
Tumor Subtypes and Differentially Expressed Genes
The overlapping differential gene sets were considered to play important roles in oncogenesis and advancement of HCC. Based on the activity profiles of differential gene sets in the TCGA and ICGC cohorts, tumor subtypes were determined with the ConsensusClusterPlus R package. Survival analyses were subsequently performed between subtypes with the survival R package. As expected, the identified hallmark gene sets contributed to different prognoses. Then, differentially expressed genes (DEGs) between subtypes were screened in the two cohorts separately. The cutoff values were selected as FDR <0.05 and absolute fold change >1. The identified differentially expressed genes were chosen as initial variables.
Exploration of the Prognostic Signature
The LASSO and stepwise regression analyses were finally applied, and a multigene prognostic signature estimating risk scores of HCC patients was explored. Based on the median risk score value of the TCGA cohort, patients were separated into high-risk and low-risk groups. The predictive performances at 1, 2, 3, 4, and 5 years were verified using the time-dependent ROC curves. Then, the univariate and multivariate Cox regression analyses were conducted to select the independent prognostic factors. The hazard ratios (HR) and P-values were calculated. The area under the curve (AUC) values of the ROC curves were calculated to reveal the prediction ability with the survivalROC R package. Moreover, estimations of responses to commonly used drugs (IC50) and tumor immune dysfunction and exclusion (TIDE) scores were conducted with the pRRophetic R package (13) and TIDE webtool (http://tide.dfci.harvard.edu/) (14). Wilcoxon tests were implemented to reveal the clinical relevance between risk score and clinical characteristics.
Integration of the Nomogram
The independent prognostic factors were integrated into a Cox model with the multivariate Cox regression analysis. A novel prognostic nomogram including 540 patients from the TCGA and ICGC cohorts was generated with the rms R package. The predictive performances at 1, 2, 3, 4, and 5 years were tested using the time-dependent ROC curves and calibration curves.
Exploration of the Diagnostic Values and Immunohistochemistry
The diagnostic values of the identified prognostic genes within the signature in RNA expression levels were explored by using the pROC R package. The differential expressions were also confirmed in clinical tissues by immunohistochemistry. We collected paired HCC and non-tumor tissues from 30 patients treated in our hospital with the agreement of the ethics committee and obtained informed consent from each patient. The details of the clinical samples are shown in Table 2. The experiments were performed according to the Helsinki Declaration. Primary antibodies (rabbit anti-CENPA, 1:100, Invitrogen, Carlsbad, USA, MA1-20832; rabbit anti-UCK2, 1:100, Invitrogen, Carlsbad, USA, PAS-14010) were used for staining. Images of each section were obtained at magnifications of ×100 and ×400. The mean integral optical density (IOD/Area) values were used for the quantitative analyses with Image-Pro Plus 6.0. Differential analyses were performed in GraphPad Prism 8 software with the paired t-test. The ROC analyses were further performed to explore the diagnostic efficacy in the protein levels with the pROC R package.
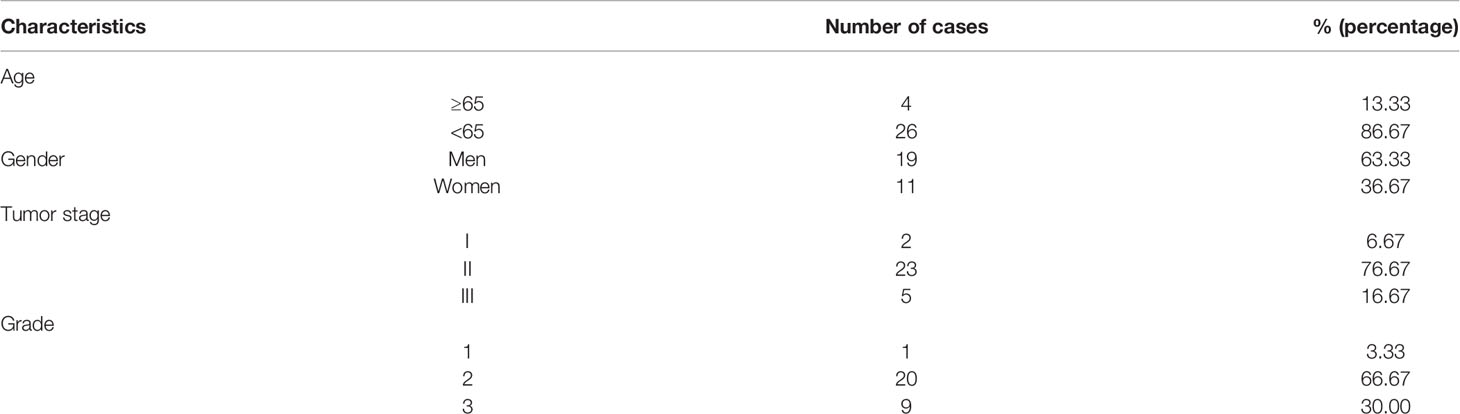
Table 2 Clinicopathological characteristics.
Results
Identification of the Differential Gene Sets
The GSVA scores of 50 hallmark pathways in GSE57957 (Figure 1A), GSE39791 (Figure 1B), and GSE14520 (Figure 1C) were visualized in bar plots. The Venn diagram identified six upregulated and four downregulated (Figure 1D) pathways. The GSVA scores and differential analysis results were provided (Supplementary Table 1).
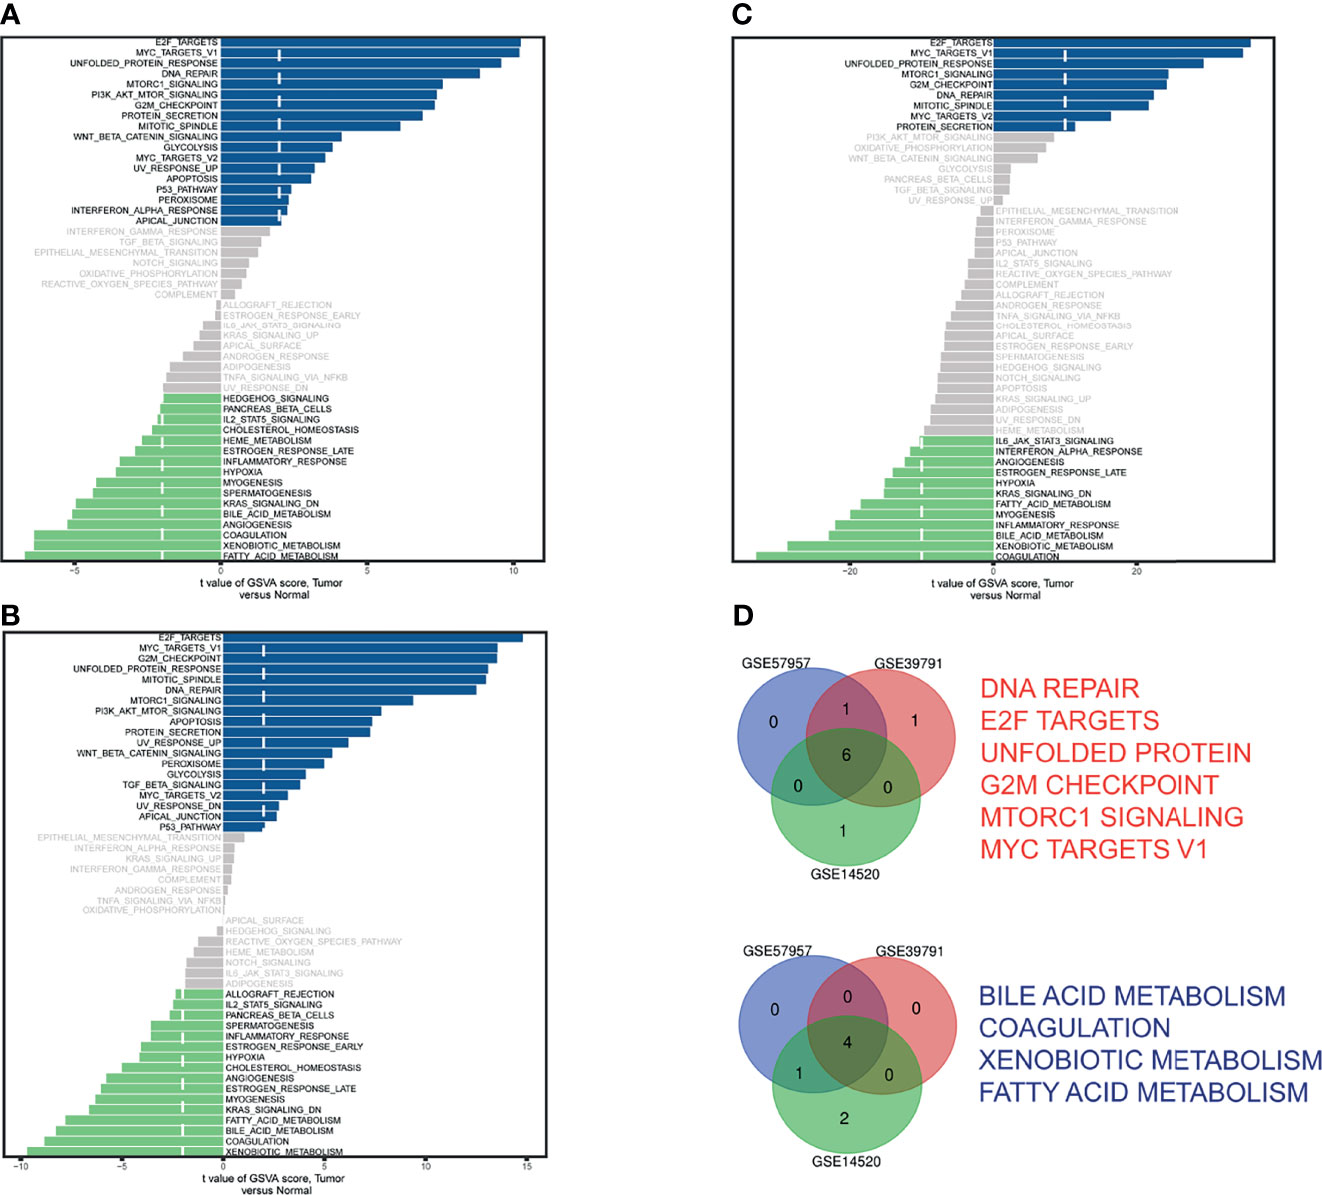
Figure 1 Identification of differential hallmark pathways in (A) GSE57957, (B) GSE39791, and (C) GSE14520. (D) Venn diagram of upregulated pathways (red) and downregulated pathways (blue).
Tumor Subtypes and Differentially Expressed Genes
Based on the activity profiles of the 10 differential gene sets, patients could be grouped into cluster A and cluster B in the TCGA and ICGC cohorts (Figure 2A). Interestingly, significant differences in prognosis were found in both cohorts (Figure 2B). Differential analyses of 1,368 background genes within the differential gene sets were conducted between cluster B and cluster A. The volcano maps of DEGs were plotted (Figure 2C). Seventy-four upregulated and 57 downregulated DEGs were screened by the Venn diagram (Figure 2D). These survival-related DEGs were selected as the initial variables for the following LASSO regression analysis. The GSVA scores, clustering information, and differential analysis results were provided (Supplementary Table 2).
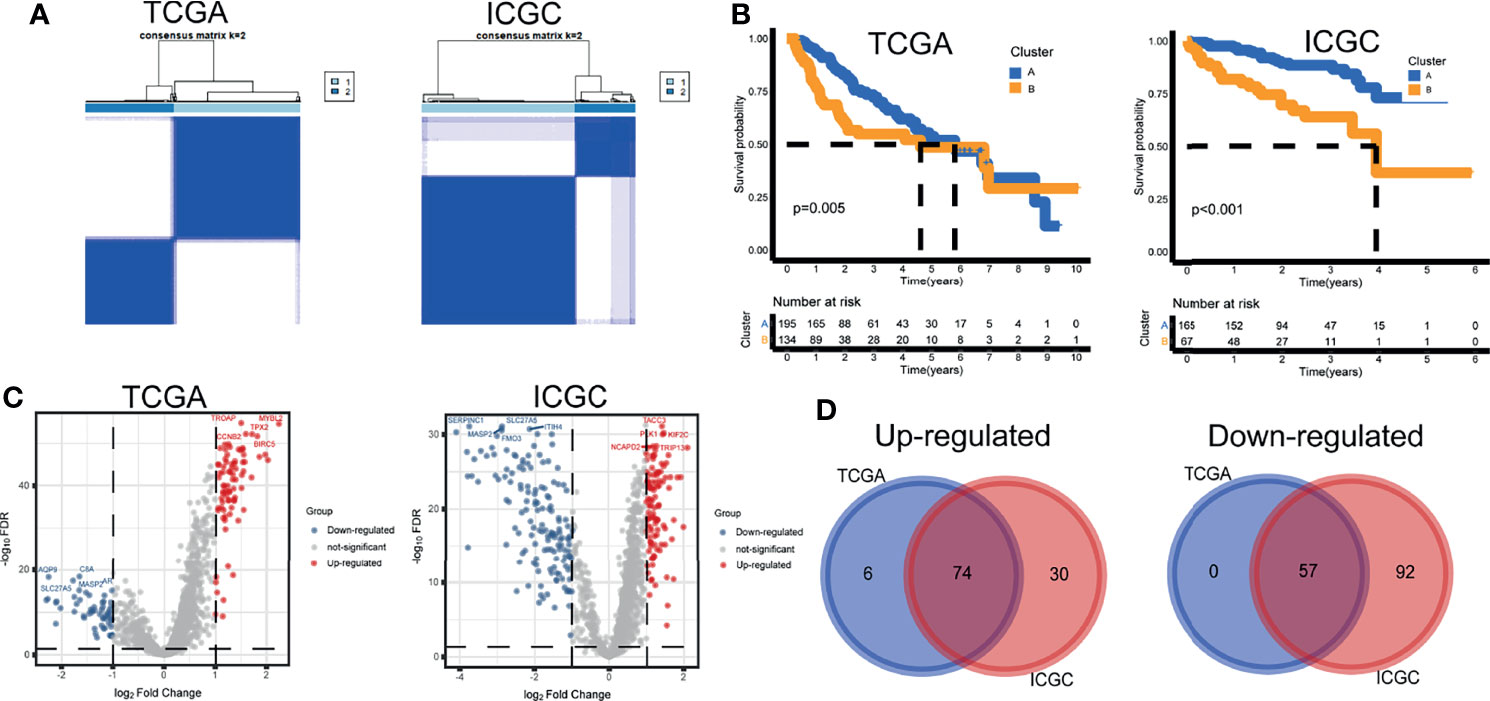
Figure 2 Tumor subtypes and differentially expressed genes. (A) Unsupervised clustering. (B) Kaplan–Meier curves. (C) Volcano maps of differentially expressed genes. (D) Venn diagram of upregulated and downregulated genes.
Exploration of the Prognostic Signature
Ten prognostic genes were identified with the LASSO regression analysis in the TCGA cohort (Figure 3A), and the expression profile with survival data was provided (Supplementary Table 3). Then, a six-gene signature was finally explored with the concordance index = 0.76 (Figure 3B). The formula calculating risk scores was as follows: risk score = (0.372283552 × expression level of ASF1A) + (0.247238902 × expression level of CENPA) + (0.487191218 × expression level of LDHA) + (0.325756023 × expression level of PSMB2) + (0.443769932 × expression level of SRPRB) + (0.270784173 × expression level of UCK2). Based on the median risk score of 0.8832469 in the TCGA cohort, patients were separated into high-risk and low-risk groups, and the risk scores of all patients in the two cohorts were provided (Supplementary Table 3). The high-risk group had a significantly worse prognosis in both cohorts (P < 0.001) (Figure 3C). The AUC values of the ROC curves were 0.842, 0.789, 0.776, 0.748, and 0.729 in the TCGA cohort and 0.741, 0.760, 0.755, 0.736, and 0.736 in the ICGC cohort from 1 to 5 years (Figure 3D). Then, the univariate and multivariate Cox regression analyses were conducted to select the independent prognostic factors. There were 214 patients with integral clinical data from the TCGA cohort, and 228 patients from the ICGC cohort were included (Supplementary Table 4). According to the results of the univariate and multivariate Cox regression analyses, risk score and stage were the two independent variables with P < 0.05 in the TCGA (Figures 4A, B) and ICGC (Figures 4D, E) cohorts. Moreover, risk score showed the highest AUC value of 0.839 and 0.731 within the 5-year ROC curves of the TCGA (Figure 4C) and ICGC (Figure 4F) cohorts. The distributions of gene expression levels and survival data along with increasing risk were visualized in the TCGA (Figure 5A) and ICGC (Figure 5B) cohorts. Risk score was not associated with age, gender, or metastasis (P > 0.05). However, group N1 had higher risk scores than group N0 (P < 0.05), and group G4 and group G3 had higher risk scores than group G1 and group G2 (P < 0.01). Patients in group T1 had lower risk scores than those in groups T2, T3, and T4. Patients in stage I showed lower risk scores than those in stages II and III (P < 0.001) (Figure 6A). Drug sensitivity estimation results showed that the low-risk group was more sensitive to cisplatin (P = 0.01) and less sensitive to sorafenib (P = 0.032), gemcitabine (P < 0.001), and 5-fluorouracil (P < 0.001) (Figure 6B). However, the high-risk group had significantly (P = 0.0091) higher TIDE scores (Figure 6C, Supplementary Table 5).
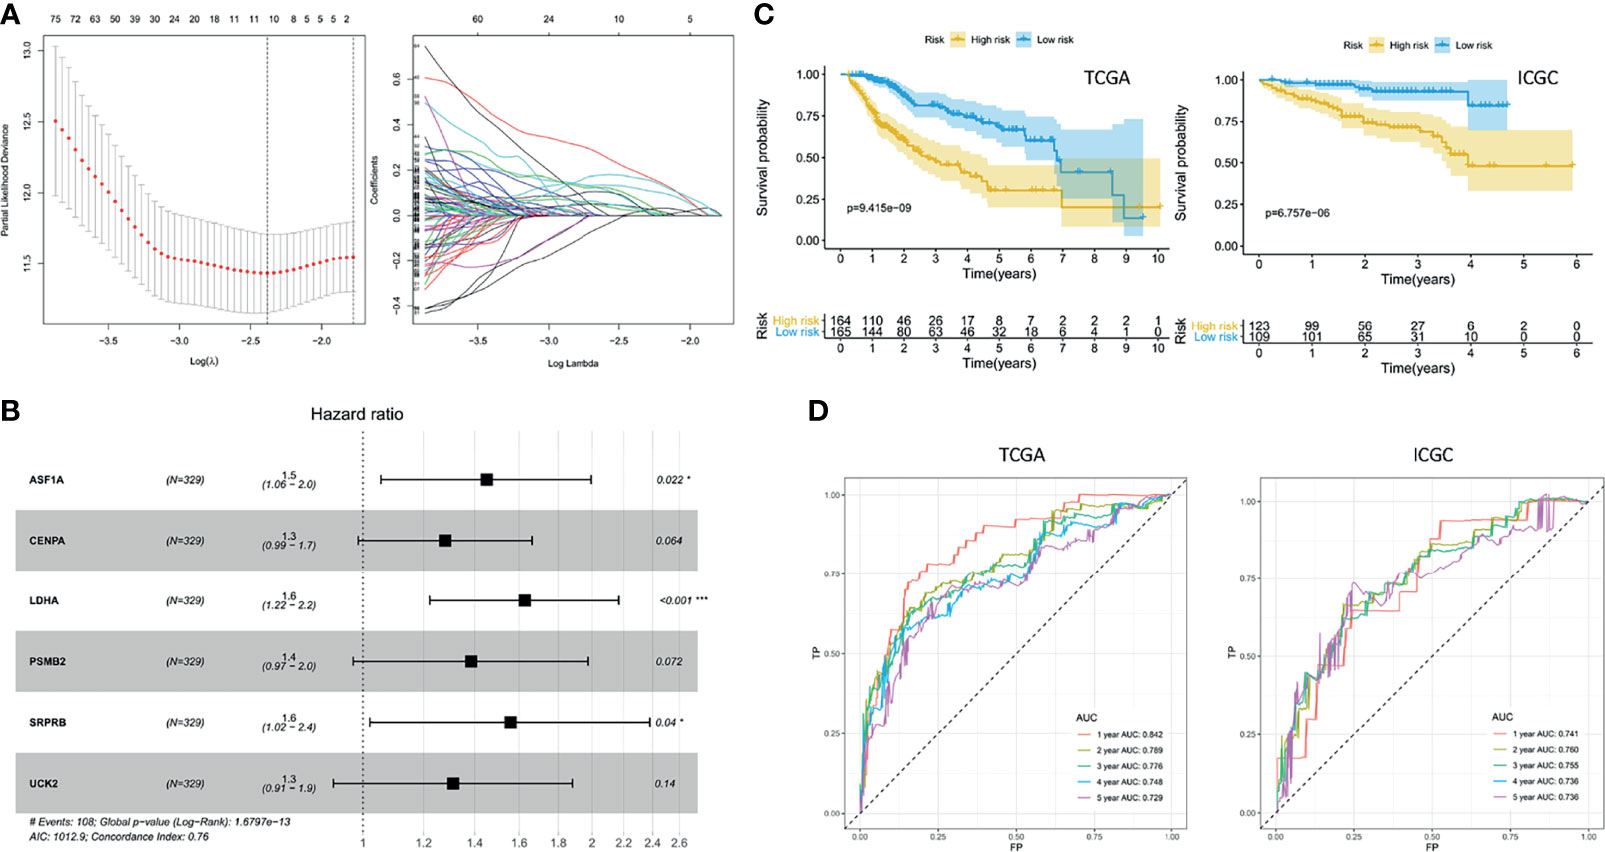
Figure 3 Exploration of the prognostic signature. (A) Least absolute shrinkage and selection operator analysis. Determination of lambda (left); variations of coefficients (right). (B) Hazard ratios. (C) Kaplan–Meier curves. (D) Receiver operating characteristic curve (ROC) curves.
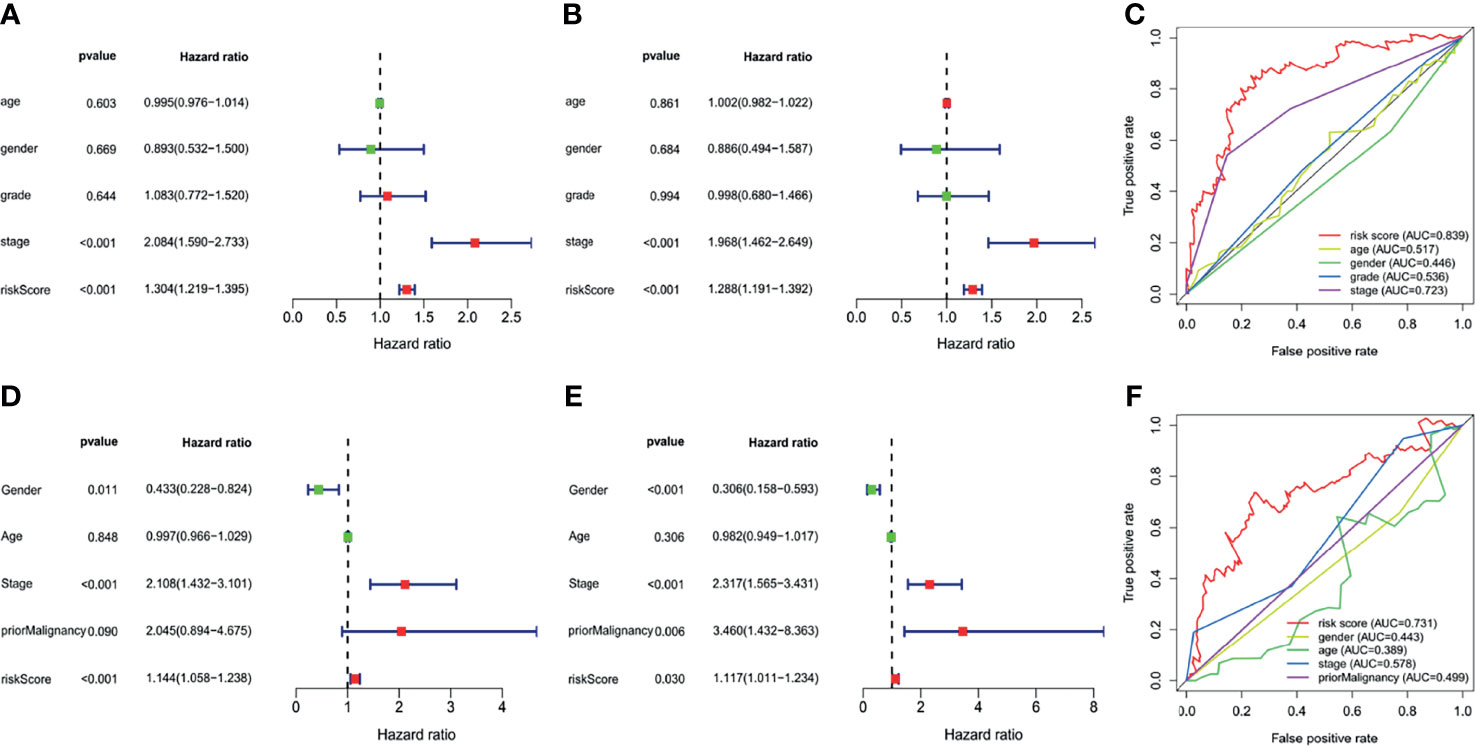
Figure 4 Independent prognostic analyses. (A) Univariate analysis of The Cancer Genome Atlas (TCGA). (B) Multivariate analysis of the TCGA. (C) Multifeature ROC curve in the TCGA. (D) Univariate analysis of the International Cancer Genome Consortium (ICGC). (E) Multivariate analysis of the ICGC. (F) Multifeature ROC curve in the ICGC.
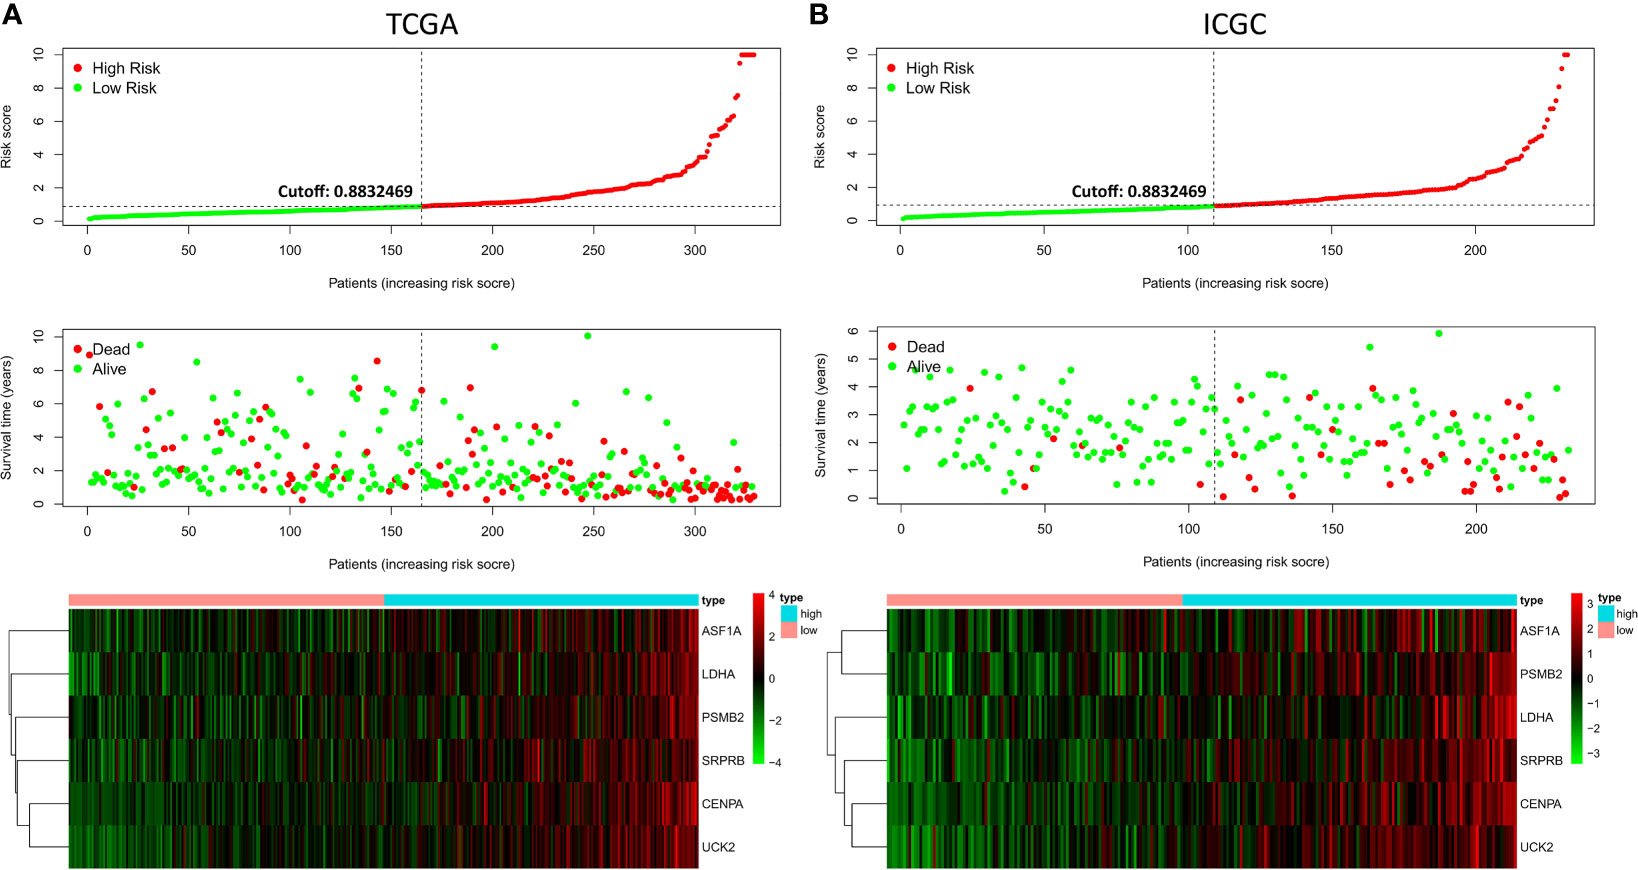
Figure 5 Risk factor correlation curve. (A) Risk scores, survival status, and gene expressions in the TCGA. (B) Risk scores, survival status, and gene expressions in the ICGC.
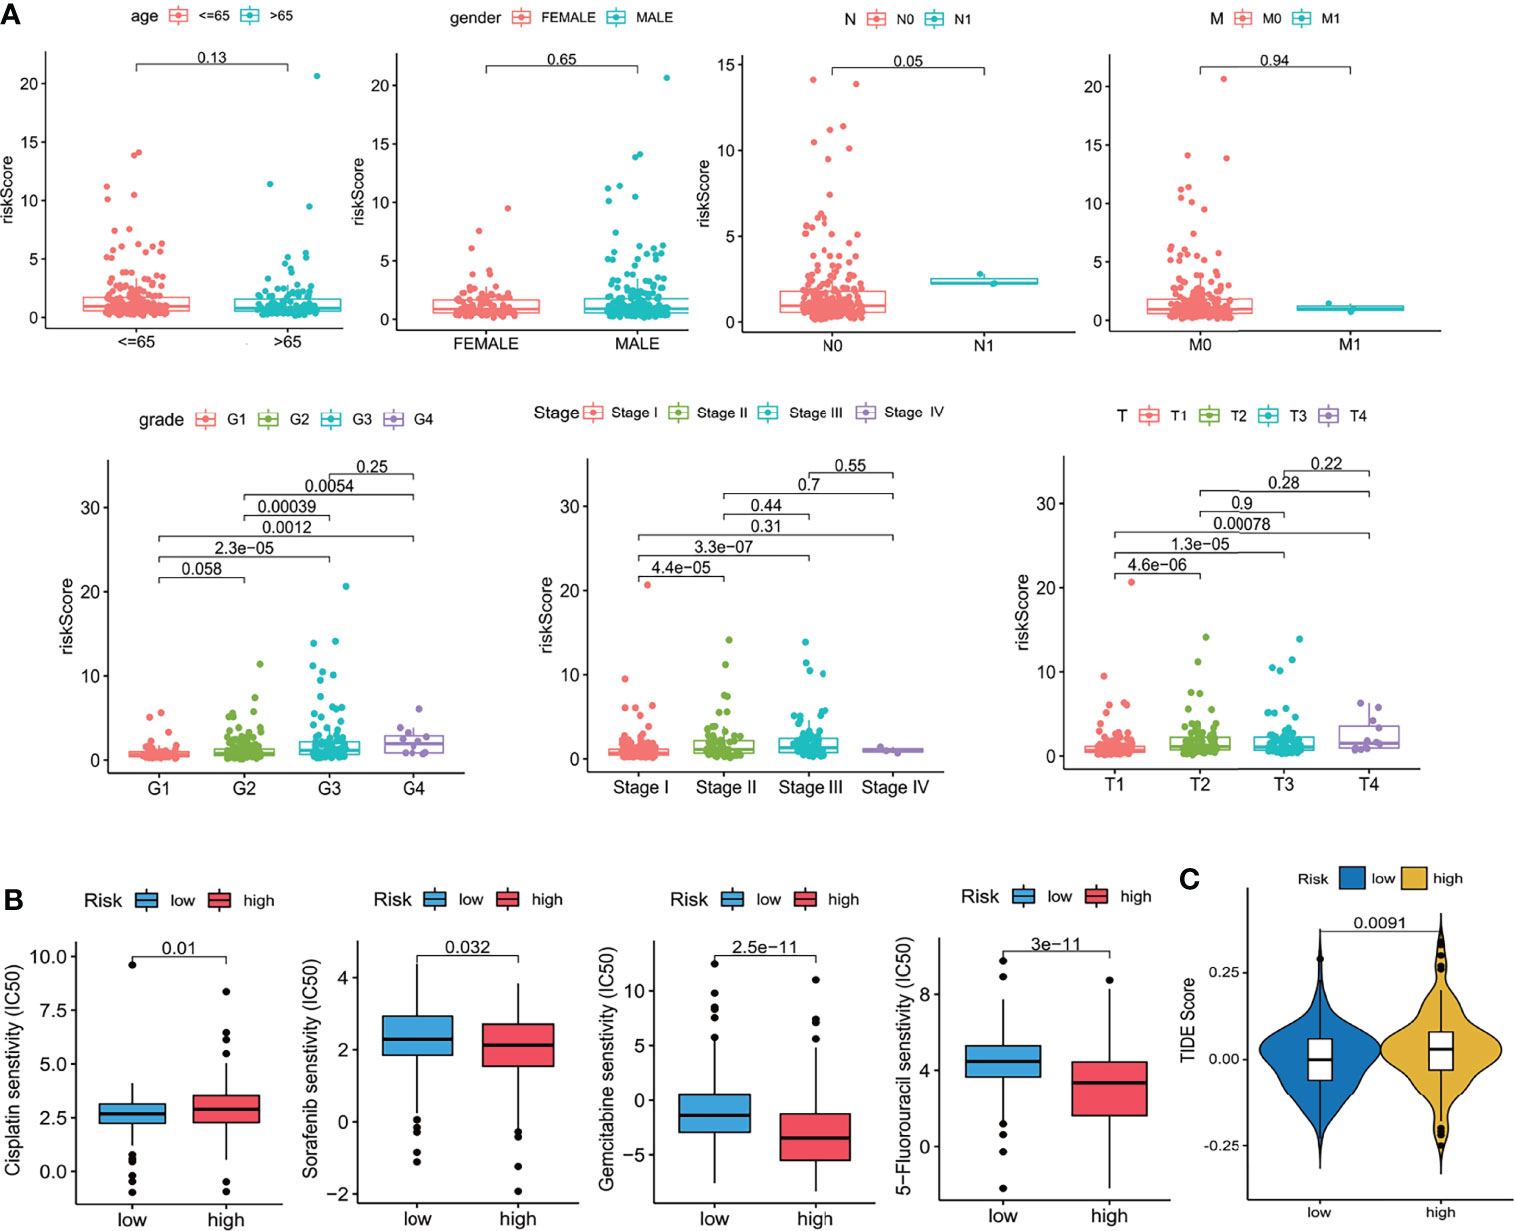
Figure 6 Clinical relevance. (A) Clinical relevance with age, gender, grade, and TNM stages. (B) Drug sensitivity scores (IC50 estimations). (C) TIDE scores. Wilcoxon test.
Integration of the Nomogram
The independent factors (stage and risk score) were integrated into a novel prognostic nomogram by the multivariate Cox regression analysis (Figure 7A). The AUC values of the ROC curves were all over 0.7 from 1 to 5 years (Figure 7B), and the integrated nomogram was well-calibrated (Figure 7C).
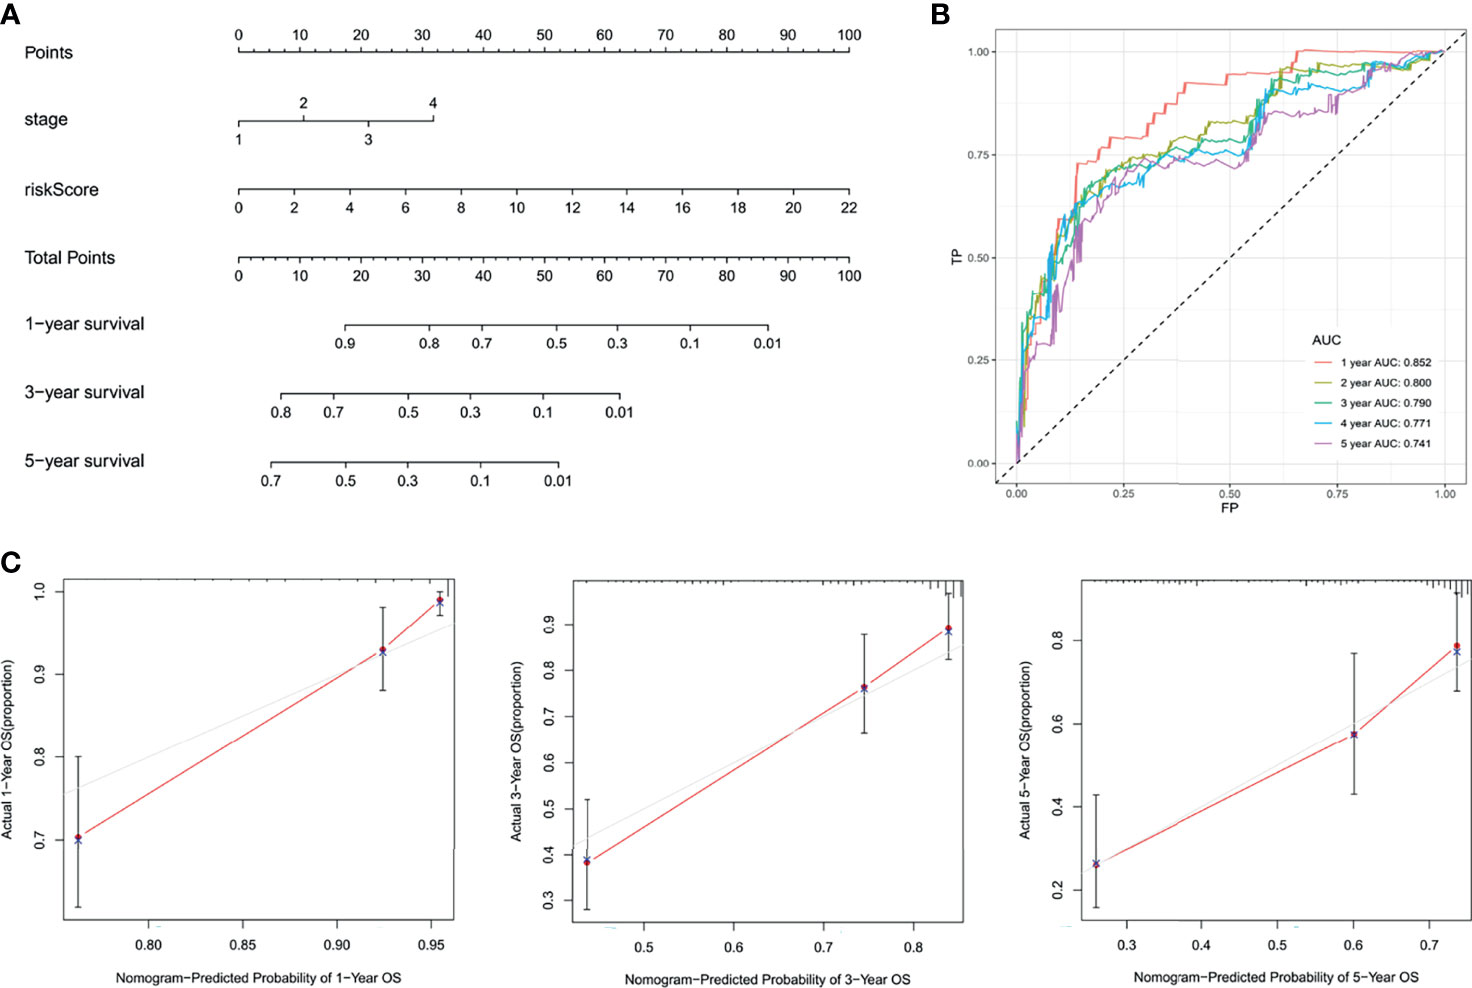
Figure 7 Integration of the nomogram. (A) Nomogram display. (B) The ROC curves. (C) The calibration curves.
Exploration of the Diagnostic Values and Immunohistochemistry
In the five cohorts included in our study, the AUC values of CENPA in the RNA expression levels were 0.92 (GSE57957), 0.88 (GSE39791), 0.92 (GSE14520), 0.97 (TCGA), and 0.95 (ICGC) (Figure 6A). The AUC values of UCK2 in the RNA expression levels were 0.92 (GSE57957), 0.93 (GSE39791), 0.98 (TCGA), and 0.93 (ICGC) separately (Figure 8A, Supplementary Table 6). Among the six genes, CENPA and UCK2 exhibited more robust and better predictive performances, which was verified in the immunohistochemistry experiment. Representative pictures of tumor and adjacent non-tumor sections were shown, and brown indicated positive immunohistochemical staining (Figure 8B). The mean integral optical density (IOD/Area) values of CENPA and UCK2 (Supplementary Table S7) were significantly upregulated in the tumor tissues (P < 0.0001) (Figure 8C). The AUC values of the ROC curves in protein levels reached 0.957 for CENPA and 0.971 for UCK2 (Figure 8C).
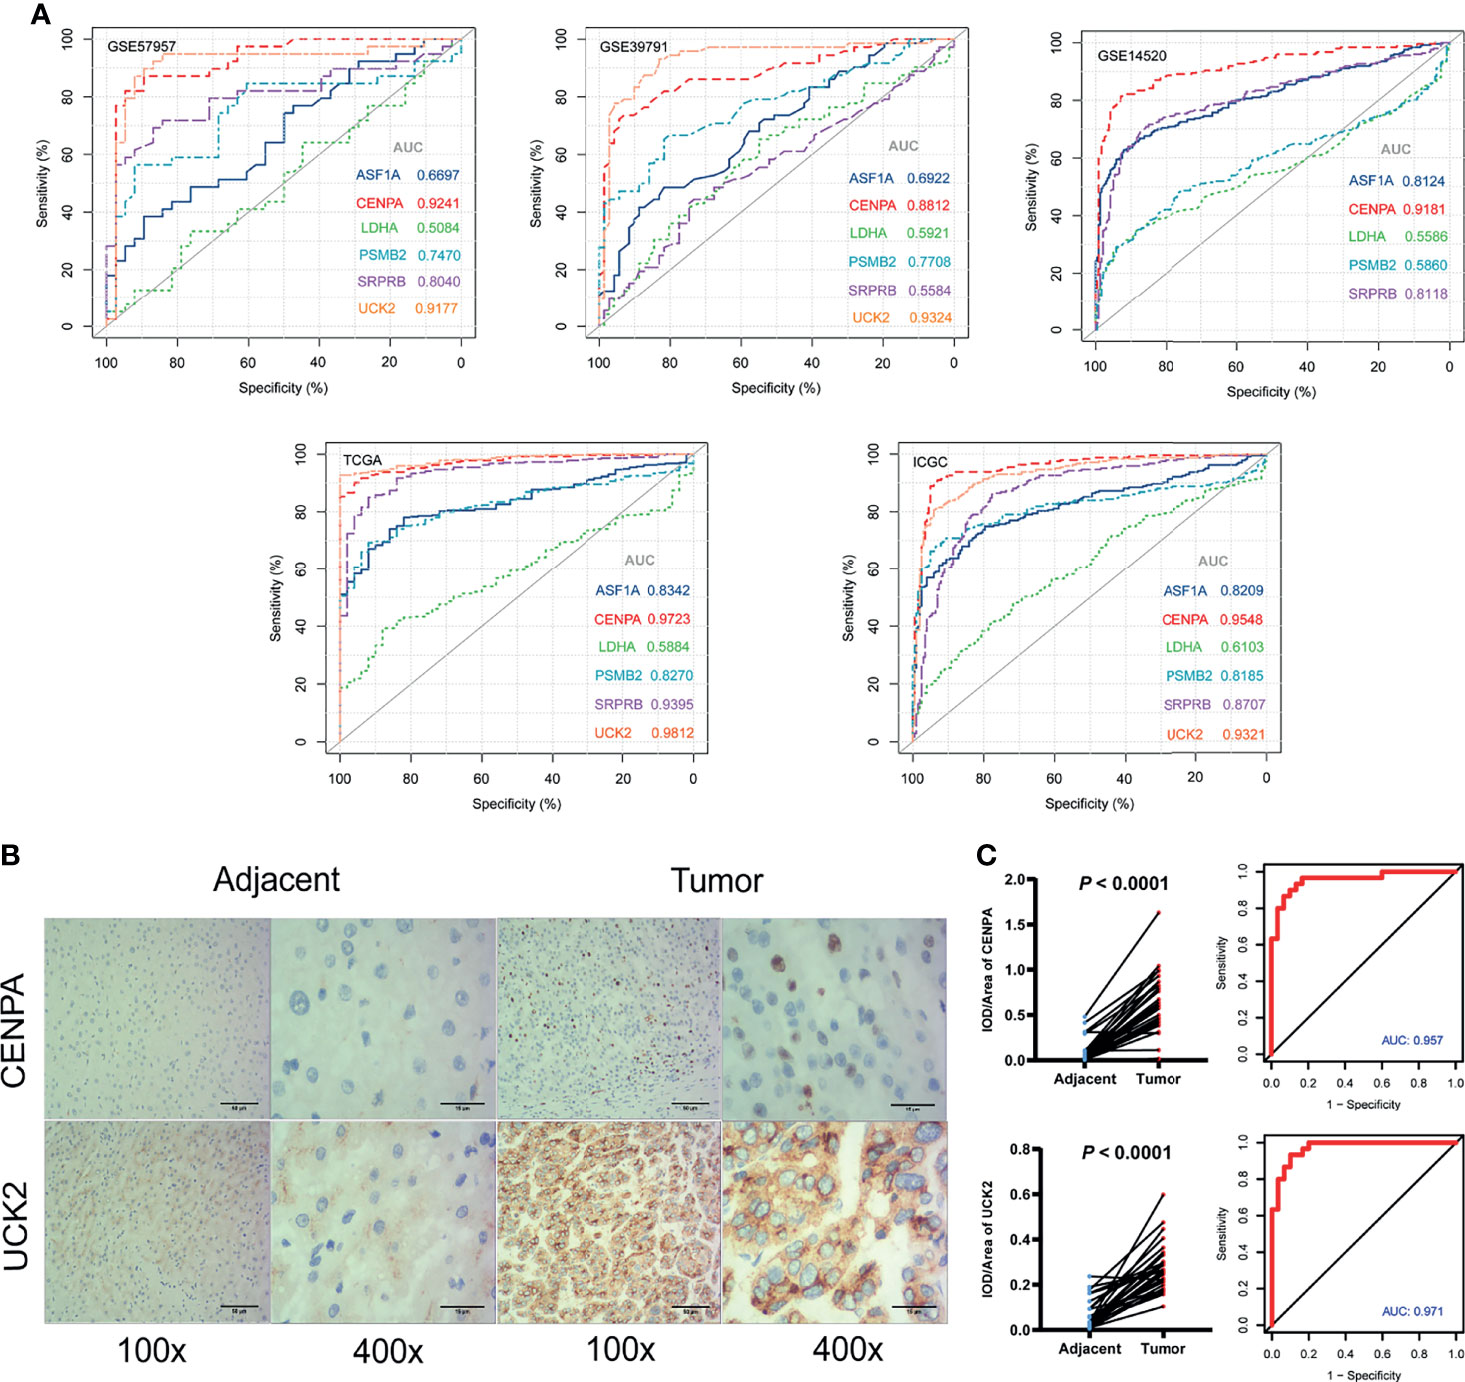
Figure 8 Diagnostic values of the identified prognostic genes. (A) The diagnostic ability assessment was based on the area under the curve (AUC) values. AUC over 0.9 means high predictive ability and AUC from 0.7 to 0.9 means medium predictive ability. Note: UCK2 was not available in GSE14520. (B) Immunohistochemistry. Representative images of CENPA and UCK2 in tumor and adjacent non-tumor tissues. Brown color means positive staining areas. Length of the scale bars are 50 and 15 µm. (C) Statistical results. (Left) The mean integral optical density (IOD/Area) values and statistical results. Paired t-test. (Right) The diagnostic ROC curves of CENPA and UCK2.
Discussion
Alterations of signaling pathways play a pivotal role in tumorigenesis and cancer progression (15). With advantages in genome-sequencing innovation, important molecular pathways were identified to be responsible for the occurrence and progress of HCC (16). Critical pathways, for instance, RAF/MEK/ERK, PI3K/AKT/mTOR, WNT/β-catenin, HGF/c-MET, and angiogenesis pathways, have been found, and relative treatments have been investigated (17). Despite the advantages of small-molecule targeted therapy and immunotherapy, the survival of HCC patients is far from ideal (18, 19). Conventional biomarkers like AFP and TNM stages show limited predictive ability (20). Utilizing the strategy of mathematical and statistical modeling, prediction models based on gene expression profiles have incredible application potential (21). To date, many efforts have been made to reach this point. For example, the prognostic roles of N6-methyladenosine (m6A)-related genes in the TCGA cohort were discovered (22). Hypoxia-related genes and the relative signature were explored to predict survival in HCC (23). Immune-related and ferroptosis-related signatures were also conducted by researchers (24–26). However, all of these studies focused on one specific function or pathway initially. Whether they play critical roles in the prognosis of cancer or a specific cancer type is a concern that needs further study. In addition, there were complex cross talks or interactions among different pathways working together to influence the occurrence and development of HCC (27, 28).
Our study quantified and differentially analyzed the activities of 50 hallmark pathways in five cohorts with GSVA. Based on the activities of the 10 identified differential hallmark pathways, patients could be separated into two subtypes with significant prognostic differences. Differentially expressed genes between subtypes were identified as the initial variables associated with overall survival. Then, an accurate and robust prognostic six-gene model estimating the risk scores of HCC patients was constructed with the LASSO and stepwise regression analyses. Six prognostic genes (ASF1A, CENPA, LDHA, PSMB2, SRPRB, UCK2) were included, and risk score was indicated to be an independent prognostic factor for the prognosis of HCC. In addition, ROC analyses in the five cohorts and immunohistochemistry experiments in solid tissues indicated that CENPA and UCK2 exhibited high and robust diagnostic values. All the six genes were unfavorable factors with hazard ratios over 1.2 in the Cox model. Patients with higher risk scores reflected worse clinical phenotypes, especially higher pathological grades and TNM stages. Also, higher TIDE scores demonstrated that patients in the high-risk group might be restricted with more serious immune evasion of cancer cells (29). The drug sensitivity (IC50 scores) results in our study indicated that patients in the low-risk group were more sensitive to cisplatin and less sensitive to sorafenib, gemcitabine, and 5-fluorouracil. This phenomenon suggests that immunotherapy might be more suitable for low-risk patients and chemotherapy might be more suitable for high-risk patients. However, it is known that the majority of HCC cells were tolerant to chemotherapy drugs (30), so further explorations in the drug responses are needed. Nomograms are gradually utilized as predictive tools for clinicians (31). For clinical practices, the independent factors (stage and risk score) were integrated into a prognostic nomogram including up to 540 patients by multivariate Cox regression analysis in our study.
Besides prognostic values, CENPA and UCK2 also exhibited robust and accurate diagnostic values in our study. The AUC values of the two genes in RNA expression levels reached over 0.9 in four of the five independent cohorts and reached over 0.95 in protein levels in the immunohistochemistry validation cohort. The role of CENPA in some cancer types like prostate cancer (32), colon cancer (33), breast cancer (34), gastric cancer (35), and head and neck cancer (36) was widely reported. Although the carcinogenicity of CENPA in HCC has been explored by a few bioinformatic analyses (37, 38), the CENPA-mediated molecular mechanisms in HCC remain not so clear. Particularly, the diagnostic value of CENPA in HCC was also not well explored. As for UCK2, it was reported to be related to unfavorable prognosis and metastasis in HCC (39, 40). In-vitro and in-vivo experiments also proved the high association with HCC malignant behavior (41). However, the role of UCK2 in the diagnosis of HCC was not fully studied. These pieces of evidence jointly indicated the potential application values of CENPA and UCK2 in the diagnosis and prognosis of HCC.
For better clinical applications, we transformed the prognostic nomogram into a web tool with Shiny (https://shiny.rstudio.com/). In brief, clinicians can calculate the risk score of each patient with the previously mentioned formula based on the gene expressions of the six prognostic genes. Then, the risk score and stage can be entered into the web tool (https://survival-prediction.shinyapps.io/prognostic-nomogram-hcc/), and the survival predictions can be easily performed. On the other hand, the mRNA or protein expression levels of CENPA or UCK2 can also be applied in the early diagnosis of HCC.
This study has some limitations. First, there were merely two datasets included based on next-generation sequencing technology to integrate the prognostic nomogram within 540 patients in our study. Larger samples and more independent cohorts based on the same sequencing technique are expected to validate predictability. Second, this study did not provide insight into in-depth mechanisms, which we will make as the focus in our future studies.
Conclusions
In this study, six prognostic genes (ASF1A, CENPA, LDHA, PSMB2, SRPRB, UCK2) were identified, and a novel six-gene signature was constructed to predict the prognosis of HCC patients. The signature and clinical features were further integrated into a well-calibrated nomogram which showed an accurate and robust performance. In addition, ROC analyses in the five cohorts and immunohistochemistry experiments in solid tissues indicated that CENPA and UCK2 exhibited high and robust diagnostic values.
Data Availability Statement
The raw data supporting the conclusions of this article will be made available by the authors, without undue reservation.
Ethics Statement
The studies involving human participants were reviewed and approved by the Ethics Committee of Zhuhai People’s Hospital. The patients/participants provided their written informed consent to participate in this study.
Author Contributions
XZ and HC designed the study. XZ, HC, and XY collected and analyzed the data. XZ and HC wrote the article. All authors contributed to the article and approved the submitted version.
Funding
This study was supported by Guangdong Basic and Applied Basic Research Foundation (2019A1515011763).
Conflict of Interest
The authors declare that the research was conducted in the absence of any commercial or financial relationships that could be construed as a potential conflict of interest.
Publisher’s Note
All claims expressed in this article are solely those of the authors and do not necessarily represent those of their affiliated organizations, or those of the publisher, the editors and the reviewers. Any product that may be evaluated in this article, or claim that may be made by its manufacturer, is not guaranteed or endorsed by the publisher.
Supplementary Material
The Supplementary Material for this article can be found online at: https://www.frontiersin.org/articles/10.3389/fonc.2022.830362/full#supplementary-material
Supplementary Figure 1 | The design and data processing progress of this study.
Supplementary Table 1 | The GSVA scores and differentially analysis results of GSE57957, GSE39791 and GSE14520.
Supplementary Table 2 | The GSVA scores, clustering information and differentially analysis results of the TCGA and ICGC cohorts.
Supplementary Table 3 | The risk scores of all the patients in the TCGA and ICGC cohorts.
Supplementary Table 4 | The clinical data for the independent prognostic analyses.
Supplementary Table 5 | The tumor immune dysfunction and exclusion (TIDE) scores.
Supplementary Table 6 | The expression profiles of the identified genes in the five cohorts.
Supplementary Table 7 | The mean integral optical density (IOD/Area) values of CENPA and UCK2.
Abbreviations
GSVA, gene set variation analysis; DEGs, differentially expressed genes; FPKM, fragments per kilobase per million; FDR, false discovery ratio; HR, hazard ratio; ROC, receiver operating characteristic curve; AUC, area under the curve; TIDE, tumor immune dysfunction and exclusion.
References
1. Tang A, Hallouch O, Chernyak V, Kamaya A, Sirlin CB. Epidemiology of Hepatocellular Carcinoma: Target Population for Surveillance and Diagnosis. Abdom Radiol (NY) (2018) 43(1):13–25. doi: 10.1007/s00261-017-1209-1
2. Siegel RL, Miller KD, Jemal A. Cancer Statistics, 2019. CA Cancer J Clin (2019) 69(1):7–34. doi: 10.3322/caac.21551
3. Cronin KA, Lake AJ, Scott S, Sherman RL, Noone AM, Howlader N, et al. Annual Report to the Nation on the Status of Cancer, Part I: National Cancer Statistics. Cancer (2018) 124(13):2785–800. doi: 10.1002/cncr.31551
4. Grzadkowski MR, Sendorek DH, P’ng C, Huang V, Boutros PC. A Comparative Study of Survival Models for Breast Cancer Prognostication Revisited: The Benefits of Multi-Gene DEGs. BMC Bioinf (2018) 19(1):400. doi: 10.1186/s12859-018-2430-9
5. Naoi Y, Noguchi S. Multi-Gene Classifiers for Prediction of Recurrence in Breast Cancer Patients. Breast Cancer (2016) 23(1):12–8. doi: 10.1007/s12282-015-0596-9
6. Hänzelmann S, Castelo R, Guinney J. GSVA: Gene Set Variation Analysis for Microarray and RNA-Seq Data. BMC Bioinf (2013) 14:7. doi: 10.1186/1471-2105-14-7
7. Lambrechts D, Wauters E, Boeckx B, Aibar S, Nittner D, Burton O, et al. Phenotype Molding of Stromal Cells in the Lung Tumor Microenvironment. Nat Med (2018) 24(8):1277–89. doi: 10.1038/s41591-018-0096-5
8. Sun H, Liu SY, Zhou JY, Xu JT, Zhang HK, Yan HH, et al. Specific TP53 Subtype as Biomarker for Immune Checkpoint Inhibitors in Lung Adenocarcinoma. EBioMedicine (2020) 60:102990. doi: 10.1016/j.ebiom.2020.102990
9. Liberzon A, Birger C, Thorvaldsdóttir H, Ghandi M, Mesirov JP, Tamayo P. The Molecular Signatures Database (MSigDB) Hallmark Gene Set Collection. Cell Syst (2015) 1(6):417–25. doi: 10.1016/j.cels.2015.12.004
10. Tibshirani R. The Lasso Method for Variable Selection in the Cox Model. Stat Med (1997) 16(4):385–95. doi: 10.1002/(SICI)1097-0258(19970228)16:4<385::AID-SIM380>3.0.CO;2-3
11. Iasonos A, Schrag D, Raj GV, Panageas KS. How to Build and Interpret a Nomogram for Cancer Prognosis. J Clin Oncol (2008) 26(8):1364–70. doi: 10.1200/JCO.2007.12.9791
12. Nazarov PV, Muller A, Kaoma T, Nicot N, Maximo C, Birembaut P, et al. RNA Sequencing and Transcriptome Arrays Analyses Show Opposing Results for Alternative Splicing in Patient Derived Samples. BMC Genomics (2017) 18(1):443. doi: 10.1186/s12864-017-3819-y
13. Geeleher P, Cox N, Huang RS. Prrophetic: An R Package for Prediction of Clinical Chemotherapeutic Response From Tumor Gene Expression Levels. PloS One (2014) 9(9):e107468. doi: 10.1371/journal.pone.0107468
14. Lu X, Jiang L, Zhang L, Zhu Y, Hu W, Wang J, et al. Immune Signature-Based Subtypes of Cervical Squamous Cell Carcinoma Tightly Associated With Human Papillomavirus Type 16 Expression, Molecular Features, and Clinical Outcome. Neoplasia (2019) 21(6):591–601. doi: 10.1016/j.neo.2019.04.003
15. Caruso S, O’Brien DR, Cleary SP, Roberts LR, Zucman-Rossi J. Genetics of HCC: Novel Approaches to Explore Molecular Diversity. Hepatology (2020) 73:14–26. doi: 10.1002/hep.31394
16. Llovet JM, Montal R, Sia D, Finn RS. Molecular Therapies and Precision Medicine for Hepatocellular Carcinoma. Nat Rev Clin Oncol (2018) 15(10):599–616. doi: 10.1038/s41571-018-0073-4
17. Dimri M, Satyanarayana A. Molecular Signaling Pathways and Therapeutic Targets in Hepatocellular Carcinoma. Cancers (Basel) (2020) 12(2):491. doi: 10.3390/cancers12020491
18. Zongyi Y, Xiaowu L. Immunotherapy for Hepatocellular Carcinoma. Cancer Lett (2020) 470:8–17. doi: 10.1016/j.canlet.2019.12.002
19. Chen S, Cao Q, Wen W, Wang H. Targeted Therapy for Hepatocellular Carcinoma: Challenges and Opportunities. Cancer Lett (2019) 460:1–9. doi: 10.1016/j.canlet.2019.114428
20. Duan J, Wu Y, Liu J, Zhang J, Fu Z, Feng T, et al. Genetic Biomarkers For Hepatocellular Carcinoma In The Era Of Precision Medicine. J Hepatocell Carcinoma (2019) 6:151–66. doi: 10.2147/JHC.S224849
21. Ternès N, Rotolo F, Michiels S. Empirical Extensions of the Lasso Penalty to Reduce the False Discovery Rate in High-Dimensional Cox Regression Models. Stat Med (2016) 35(15):2561–73. doi: 10.1002/sim.6927
22. Wang P, Wang X, Zheng L, Zhuang C. Gene Signatures and Prognostic Values of m6A Regulators in Hepatocellular Carcinoma. Front Genet (2020) 11:540186. doi: 10.3389/fgene.2020.540186
23. Zhang B, Tang B, Gao J, Li J, Kong L, Qin L. A Hypoxia-Related Signature for Clinically Predicting Diagnosis, Prognosis and Immune Microenvironment of Hepatocellular Carcinoma Patients. J Transl Med (2020) 18(1):342. doi: 10.1186/s12967-020-02492-9
24. Hong W, Liang L, Gu Y, Qi Z, Qiu H, Yang X, et al. Immune-Related lncRNA to Construct Novel Signature and Predict the Immune Landscape of Human Hepatocellular Carcinoma. Mol Ther Nucleic Acids (2020) 22:937–47. doi: 10.1016/j.omtn.2020.10.002
25. Dai Y, Qiang W, Lin K, Gui Y, Lan X, Wang D. An Immune-Related Gene Signature for Predicting Survival and Immunotherapy Efficacy in Hepatocellular Carcinoma. Cancer Immunol Immunother (2021) 70(4):967–79. doi: 10.1007/s00262-020-02743-0
26. Liang JY, Wang DS, Lin HC, Chen XX, Yang H, Zheng Y, et al. A Novel Ferroptosis-Related Gene Signature for Overall Survival Prediction in Patients With Hepatocellular Carcinoma. Int J Biol Sci (2020) 16(13):2430–41. doi: 10.7150/ijbs.45050
27. Giakoustidis A, Giakoustidis D, Mudan S, Sklavos A, Williams R. Molecular Signalling in Hepatocellular Carcinoma: Role of and Crosstalk Among WNT/ß-Catenin, Sonic Hedgehog, Notch and Dickkopf-1. Can J Gastroenterol Hepatol (2015) 29(4):209–17. doi: 10.1155/2015/172356
28. Khan S, Zaki H. Crosstalk Between NLRP12 and JNK During Hepatocellular Carcinoma. Int J Mol Sci (2020) 21(2):496. doi: 10.3390/ijms21020496
29. George JT, Levine H. Implications of Tumor-Immune Coevolution on Cancer Evasion and Optimized Immunotherapy. Trends Cancer (2021) 7(4):373–83. doi: 10.1016/j.trecan.2020.12.005
30. Zhang L, Ding J, Li HY, Wang ZH, Wu J. Immunotherapy for Advanced Hepatocellular Carcinoma, Where Are We? Biochim Biophys Acta Rev Cancer (2020) 1874(2):188441. doi: 10.1016/j.bbcan.2020.188441
31. Balachandran VP, Gonen M, Smith JJ, DeMatteo RP. Nomograms in Oncology: More Than Meets the Eye. Lancet Oncol (2015) 16(4):e173–80. doi: 10.1016/S1470-2045(14)71116-7
32. Saha AK, Contreras-Galindo R, Niknafs YS, Iyer M, Qin T, Padmanabhan K, et al. The Role of the Histone H3 Variant CENPA in Prostate Cancer. J Biol Chem (2020) 295(25):8537–49. doi: 10.1074/jbc.RA119.010080
33. Liang YC, Su Q, Liu YJ, Xiao H, Yin HZ. Centromere Protein A (CENPA) Regulates Metabolic Reprogramming in the Colon Cancer Cells by Transcriptionally Activating Karyopherin Subunit Alpha 2 (KPNA2). Am J Pathol (2021) 191(12):2117–32. doi: 10.1016/j.ajpath.2021.08.010
34. Rajput AB, Hu N, Varma S, Chen CH, Ding K, Park PC, et al. Immunohistochemical Assessment of Expression of Centromere Protein-A (CENPA) in Human Invasive Breast Cancer. Cancers (Basel) (2011) 3(4):4212–27. doi: 10.3390/cancers3044212
35. Xu Y, Liang C, Cai X, Zhang M, Yu W, Shao Q. High Centromere Protein-A (CENP-A) Expression Correlates With Progression and Prognosis in Gastric Cancer. Onco Targets Ther (2020) 13:13237–46. doi: 10.2147/OTT.S263512
36. Verrelle P, Meseure D, Berger F, Forest A, Leclère R, Nicolas A, et al. CENP-A Subnuclear Localization Pattern as Marker Predicting Curability by Chemoradiation Therapy for Locally Advanced Head and Neck Cancer Patients. Cancers (Basel) (2021) 13(16):3928. doi: 10.3390/cancers13163928
37. Zhang Y, Yang L, Shi J, Lu Y, Chen X, Yang Z. The Oncogenic Role of CENPA in Hepatocellular Carcinoma Development: Evidence From Bioinformatic Analysis. BioMed Res Int (2020) 2020:3040839. doi: 10.1155/2020/3040839
38. Long J, Zhang L, Wan X, Lin J, Bai Y, Xu W, et al. A Four-Gene-Based Prognostic Model Predicts Overall Survival in Patients With Hepatocellular Carcinoma. J Cell Mol Med (2018) 22(12):5928–38. doi: 10.1111/jcmm.13863
39. Cai J, Sun X, Guo H, Qu X, Huang H, Yu C, et al. Non-Metabolic Role of UCK2 Links EGFR-AKT Pathway Activation to Metastasis Enhancement in Hepatocellular Carcinoma. Oncogenesis (2020) 9(12):103. doi: 10.1038/s41389-020-00287-7
40. Yu S, Li X, Guo X, Zhang H, Qin R, Wang M. UCK2 Upregulation Might Serve as an Indicator of Unfavorable Prognosis of Hepatocellular Carcinoma. IUBMB Life (2019) 71(1):105–12. doi: 10.1002/iub.1941
Keywords: prognosis, diagnosis, GSVA, nomogram, hepatocellular carcinoma
Citation: Zhong X, Yu X and Chang H (2022) Exploration of a Novel Prognostic Nomogram and Diagnostic Biomarkers Based on the Activity Variations of Hallmark Gene Sets in Hepatocellular Carcinoma. Front. Oncol. 12:830362. doi: 10.3389/fonc.2022.830362
Received: 07 December 2021; Accepted: 10 February 2022;
Published: 10 March 2022.
Edited by:
Nadia M. Hamdy, Ain Shams University, EgyptReviewed by:
Di Gu, First Affiliated Hospital of Guangzhou Medical University, ChinaMarco Vacante, University of Catania, Italy
Copyright © 2022 Zhong, Yu and Chang. This is an open-access article distributed under the terms of the Creative Commons Attribution License (CC BY). The use, distribution or reproduction in other forums is permitted, provided the original author(s) and the copyright owner(s) are credited and that the original publication in this journal is cited, in accordance with accepted academic practice. No use, distribution or reproduction is permitted which does not comply with these terms.
*Correspondence: Xiongdong Zhong, emhvbmd4aW9uZ2Rvbmd6eGRAeWVhaC5uZXQ=; Hao Chang, Y2hhbmdoYW9AaGFueXUtYmlvbWVkLm9yZw==