- 1Department of Nuclear Medicine, First Affiliated Hospital of Anhui Medical University, Hefei, China
- 2Department of Nuclear Medicine, Ruijin Hospital, Shanghai Jiao Tong University School of Medicine, Shanghai, China
Objective: We sought to explore the feasibility of shorter acquisition times using two short dynamic scans for a multiparametric PET study and the influence of quantitative performance in shortened dynamic PET.
Methods: Twenty-one patients underwent whole-body dynamic 18F-FDG PET/CT examinations on a PET/CT (Siemens Biograph Vision) with a total scan time of 75 min using continuous bed motion for Patlak multiparametric imaging. Two sets of Patlak multiparametric images were produced: the standard MRFDG and DVFDG images (MRFDG-std and DVFDG-std) and two short dynamic MRFDG and DVFDG images (MRFDG-tsd and DVFDG-tsd), which were generated by a 0–75 min post injection (p.i.) dynamic PET series and a 0–6 min + 60–75 min p.i. dynamic PET series, respectively. The maximum, mean, and peak values of the standard and two short dynamic multiparametric acquisitions were obtained and compared using Passing–Bablok regression and Bland–Altman analysis.
Results: High correlations were obtained between MRFDG-tsd and MRFDG-std, and between DVFDG-tsd and DVFDG-std for both normal organs and all lesions (0.962 ≦ Spearman’s rho ≦ 0.982, p < 0.0001). The maximum, mean, and peak values of the standard and two short dynamic multiparametric acquisitions were also in agreement. For normal organs, the Bland–Altman plot showed that the mean bias of MRFDG-max, MRFDG-mean, and MRFDG-peak was -0.002 (95% CI: -0.032–0.027), -0.002 (95% CI: -0.026–0.023), and -0.002 (95% CI: -0.026–0.022), respectively. The mean bias of DVFDG-max, DVFDG-mean, and DVFDG-peak was -3.3 (95% CI: -24.8–18.2), -1.4 (95% CI: -12.1–9.2), and -2.3 (95% CI: -15–10.4), respectively. For lesions, the Bland–Altman plot showed that the mean bias of MRFDG-max, MRFDG-mean, and MRFDG-peak was -0.009 (95% CI: -0.056–0.038), -0.004 (95% CI: -0.039–0.031), and -0.004 (95% CI: -0.036–0.028), respectively. The mean bias of DVFDG-max, DVFDG-mean, and DVFDG-peak was -8.4 (95% CI: -42.6–25.9), -4.8 (95% CI: -20.2–10.6), and -4.0 (95% CI: -23.7–15.6), respectively.
Conclusions: This study demonstrates the feasibility of using two short dynamic scans that include the first 0–6 min and 60–75 min scans p.i. for Patlak multiparametric images, which can increase patient throughout for parametric analysis.
Introduction
Positron emission tomography/computed tomography (PET/CT) is widely used in clinical oncology for diagnosis, staging, and therapy monitoring (1–3). 18F-fluorodeoxyglucose (FDG) has been the dominant PET tracer in oncology for over 40 years (4). In current clinical practice, FDG PET/CT imaging is performed at a predefined time point, usually 60 min post FDG injection (5, 6). The acquired data are reconstructed to produce a conventional (static) PET image. Static PET images are quantified by the standardized uptake value (SUV), which is a semi-quantitative measure of glucose uptake (7, 8). However, PET tracer distribution is a dynamic process while the SUV is derived from a static single snapshot of FDG after it is equilibrated between the blood plasma and tissue. Therefore, the SUV does not allow any conclusions regarding the rate of irreversible uptake to observed tracer uptake to be drawn. Static PET imaging captures not only FDG-6-P retained in glucose metabolizing tissue but also the substantial activity of unbound or free FDG in tissue and blood vessels. Thus, the SUV does not provide a reliable measurement of the kinetics of FDG in lesions, and it cannot differentiate malignant tumors from physiological or benign processes such as inflammation (9–11).
The dynamic course of the FDG spatial distribution in the targeted tissues may reveal highly useful clinical information about the tissue’s metabolic properties (12, 13). The streamlined graphical analysis called the Patlak method coupled with a plasma input function to estimate the tracer uptake rate Ki (slope) and the total blood distribution volume V (intercept) was invented in 1983 (14). Patlak modeling has been validated and developed for the generation of parametric images (15, 16). With the rapid development of PET/CT scanners, a fully automated multiparametric whole-body (WB)-PET based on FlowMotion workflow and direct Patlak reconstruction from list-mode data was developed by Siemens. The parameters are the Ki, which is the rate of irreversible uptake, and the Patlak intercept (DV), which is the apparent distribution volume of the non-metabolized FDG. In recent studies, dynamic multiparametric images may achieve equivalent or superior lesion detectability with reduced false-positive rates when complementing SUV imaging (17, 18), which highlighted the potential role in the initial tumor diagnosis and characterization (19, 20). The Patlak model requires tissue time–activity curves (TACs) after equilibrium of FDG between blood plasma and tissue, and knowledge of the input function from the start of injection (21–23). Therefore, a Patlak dynamic scanning protocol typically starts from the radiotracer injection until after FDG equilibrium. Accordingly, the patients need to be injected on the scanner bed and remain motionless for as long as 75 min. The clinical application of multiparametric dynamic WB-PET is therefore limited due to the long scanning time, especially for oncology patients who cannot lie prostrate for long periods of time. Shorter scan times can, in addition to improving patient comfort, increase patient throughout, in turn increasing cost-effectiveness. To our knowledge, a scan duration optimization of multiparametric dynamic WB-PET has not yet been fully explored. The influence of quantitative performance in shortened dynamic PET was not investigated.
The first two silicon photomultiplier (SiPM)-based detectors with a time resolution of 214 ps time-of-flight (TOF) Biograph Vision PET/CT systems (Siemens Healthineers) in China were installed at Ruijing Hospital of Shanghai Jiaotong University and First Affiliated Hospital of Anhui Medical University, simultaneously. Furthermore, a multicenter retrospective study about Patlak parametric imaging was conducted at these two hospitals. Two different datasets were used to generate the multiparametric images: (i) 0–75 min dynamic PET series; (ii) 0–6 min + 60–75 min two short dynamic PET series. The 75-min continuous PET scan set (i) was noted as a standard acquisition protocol. The two-short-dynamic-scanning protocol contains two parts of data: the input function (0–6 min p.i.) and equilibrium activity (60–75 min p.i.). We evaluated the harmonization of Patlak parametric images generated from two short dynamic acquisitions and the standard scan protocol. The aim of this study was to explore the feasibility of shorter acquisition times for multiparametric imaging using the Biograph Vision PET/CT system.
Methods
Patient Population
Retrospective clinical studies about multiparametric dynamic WB-PET imaging were conducted in two hospitals in China from May 2020 to July 2021. Patients were scheduled for the dynamic WB scan protocol if they were deemed fit to lie still for 75 min while in the PET/CT scanner. Patients were required to fast for more than 6 h prior to scanning. Patients with a blood glucose level of greater than or equal to 198 mg/dl before 18F-FDG administration were excluded from participation in this study. All procedures performed in studies involving human participants were approved by the ethics committee of First Affiliated Hospital of Anhui Medical University and Ruijing Hospital of Shanghai Jiaotong University, and informed consent was obtained from all participants. Patient characteristics are outlined in Table 1.
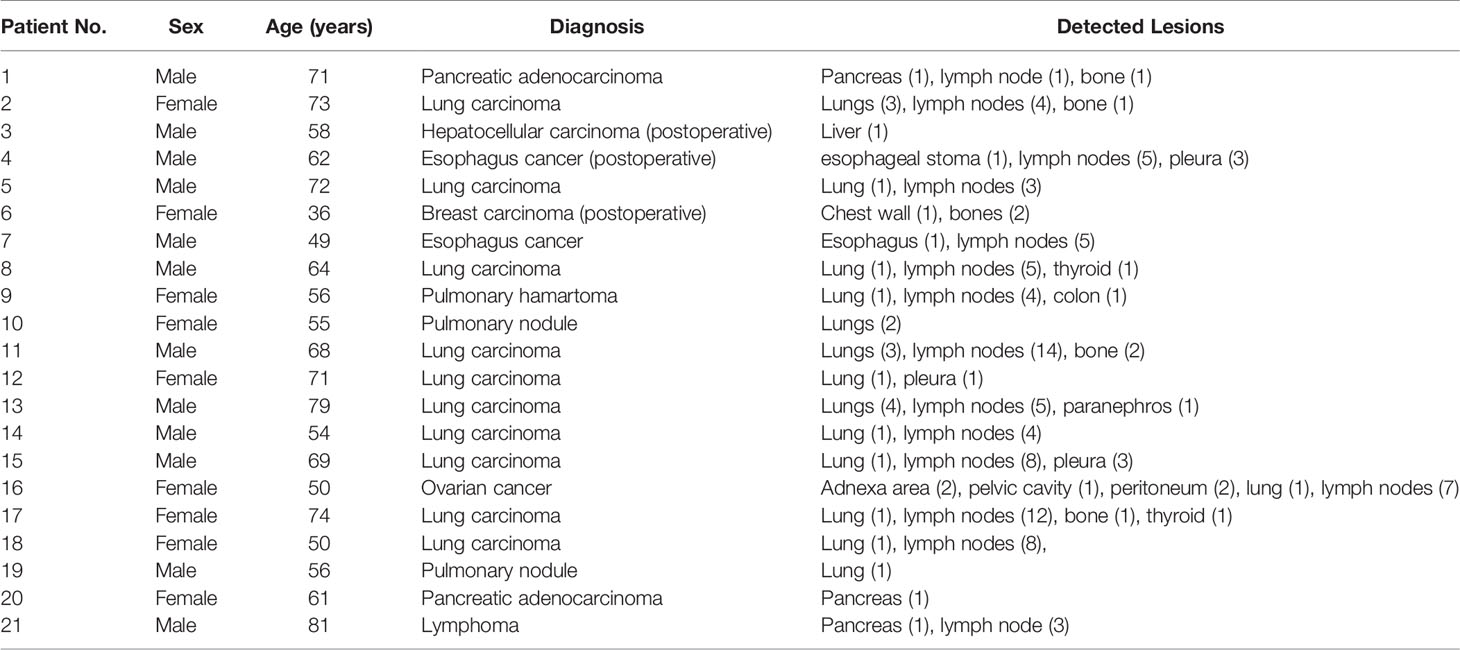
Table 1 Clinical characteristics of the patient population and anatomical locations of the detected lesions.
Imaging Protocol
Dynamic PET/CT scans were performed on a Siemens Biograph Vision scanner (Siemens Healthineers, Germany). First, a low-dose WB CT (an x-ray tube current of 43 mAs, a tube voltage of 100 kV, and a spiral pitch factor of 1) was performed from vertex to mid-thigh for acquisition correction. Then, PET data were acquired starting simultaneously with the injection of a weight-based dose of 18F-FDG (3.71 ± 1.05 MBq/kg). Patients underwent a scan protocol consisting of the following steps (Figure 1): (i) a 6-min dynamic single-bed list-mode PET acquisition centered over the cardiac region; (ii) a subsequent set of 16 WB-PET scans in continuous bed motion of 2 min/pass for the first 5 passes and 5 min/pass for the next 11 passes, in order to capture the late dynamics of the tracer in both the blood plasma and the tissues. The total PET scan time was about 75 min.
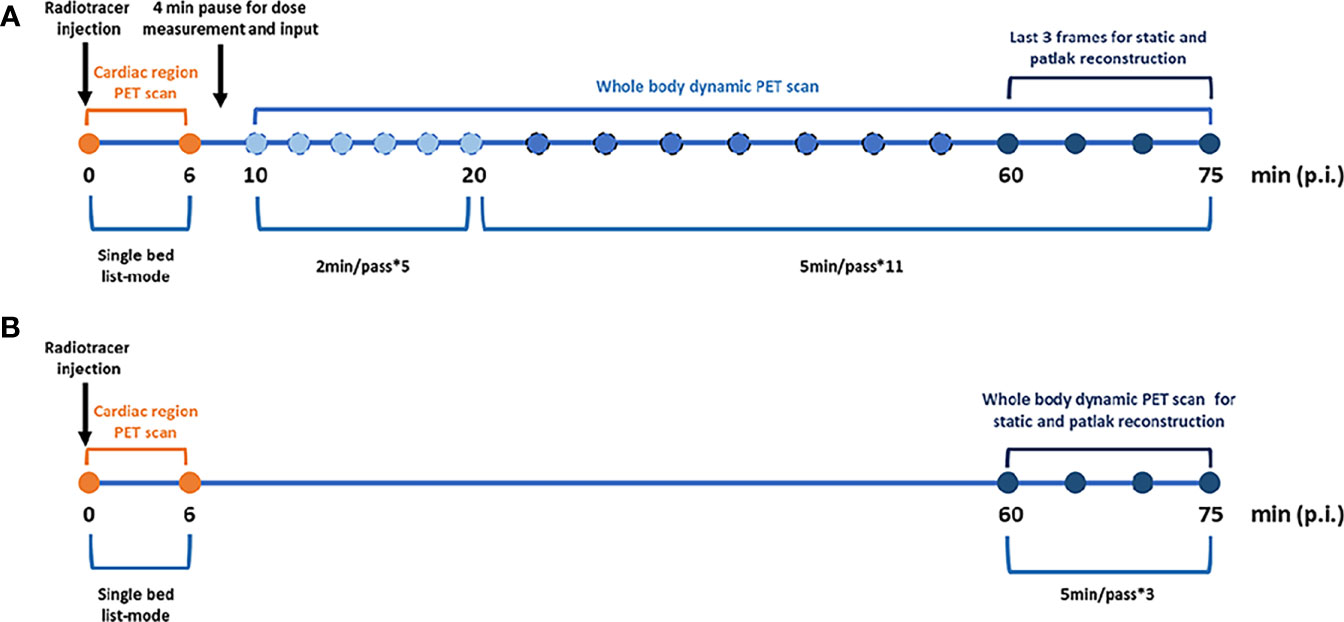
Figure 1 Imaging protocols. (A) Standard dynamic whole body Patlak parametric PET imaging (last 7 5min). (B) Two short dynamic whole body Patlak parametric PET imaging (0–6 min + 60–75 min post-injection).
Image Reconstruction
Parametric images of metabolic rate of FDG (MRFDG) and Patlak intercept (DVFDG) were generated using the nested directed Patlak reconstruction method on Siemens Biograph Vision workstation. After dynamic PET data acquisition, the automated multiparametric scan protocol automatically identified the descending aorta and placed a VOI from which an arterial image-derived input function (IDIF) was extracted from the selected dynamic PET series. The Patlak reconstruction (performs the Patlak transformation) to form the parametric images MRFDG and DVFDG used the last three frames of PET sinograms and used the IDIF acquired from the two datasets (Figure 2)—(i) the standard dataset (MRFDG-std and DVFDG-std): IDIF was automatically generated from proximal descending aorta using dynamic PET series (0–75 min); (ii) the two-short-dynamic dataset (MRFDG-tsd and DVFDG-tsd): TACs of proximal descending aorta were acquired from 0–6 min single bed list-mode PET images and the last three frames (60–75 min) of the dynamic PET series in TrueD (Siemens Healthineers) and were merged into one TAC in comma-separated values (CSV) files. The IDIF was then generated by importing these CSV files. Then, a straight line was fitted automatically by Siemens workstation using the Patlak method, and the slope of the fitted line was the Patlak Ki value applied to generate the Patlak Ki images. The patient’s blood glucose was obtained to calculate the metabolic rate of FDG (MRFDG), MRFDG = Ki × blood glucose. Reconstruction parameters: Patlak recon method, OSEM True X + TOF, 4 iterations, 5 subsets, 220 matrices, with relative scatter correction and no Gaussian post filtering.
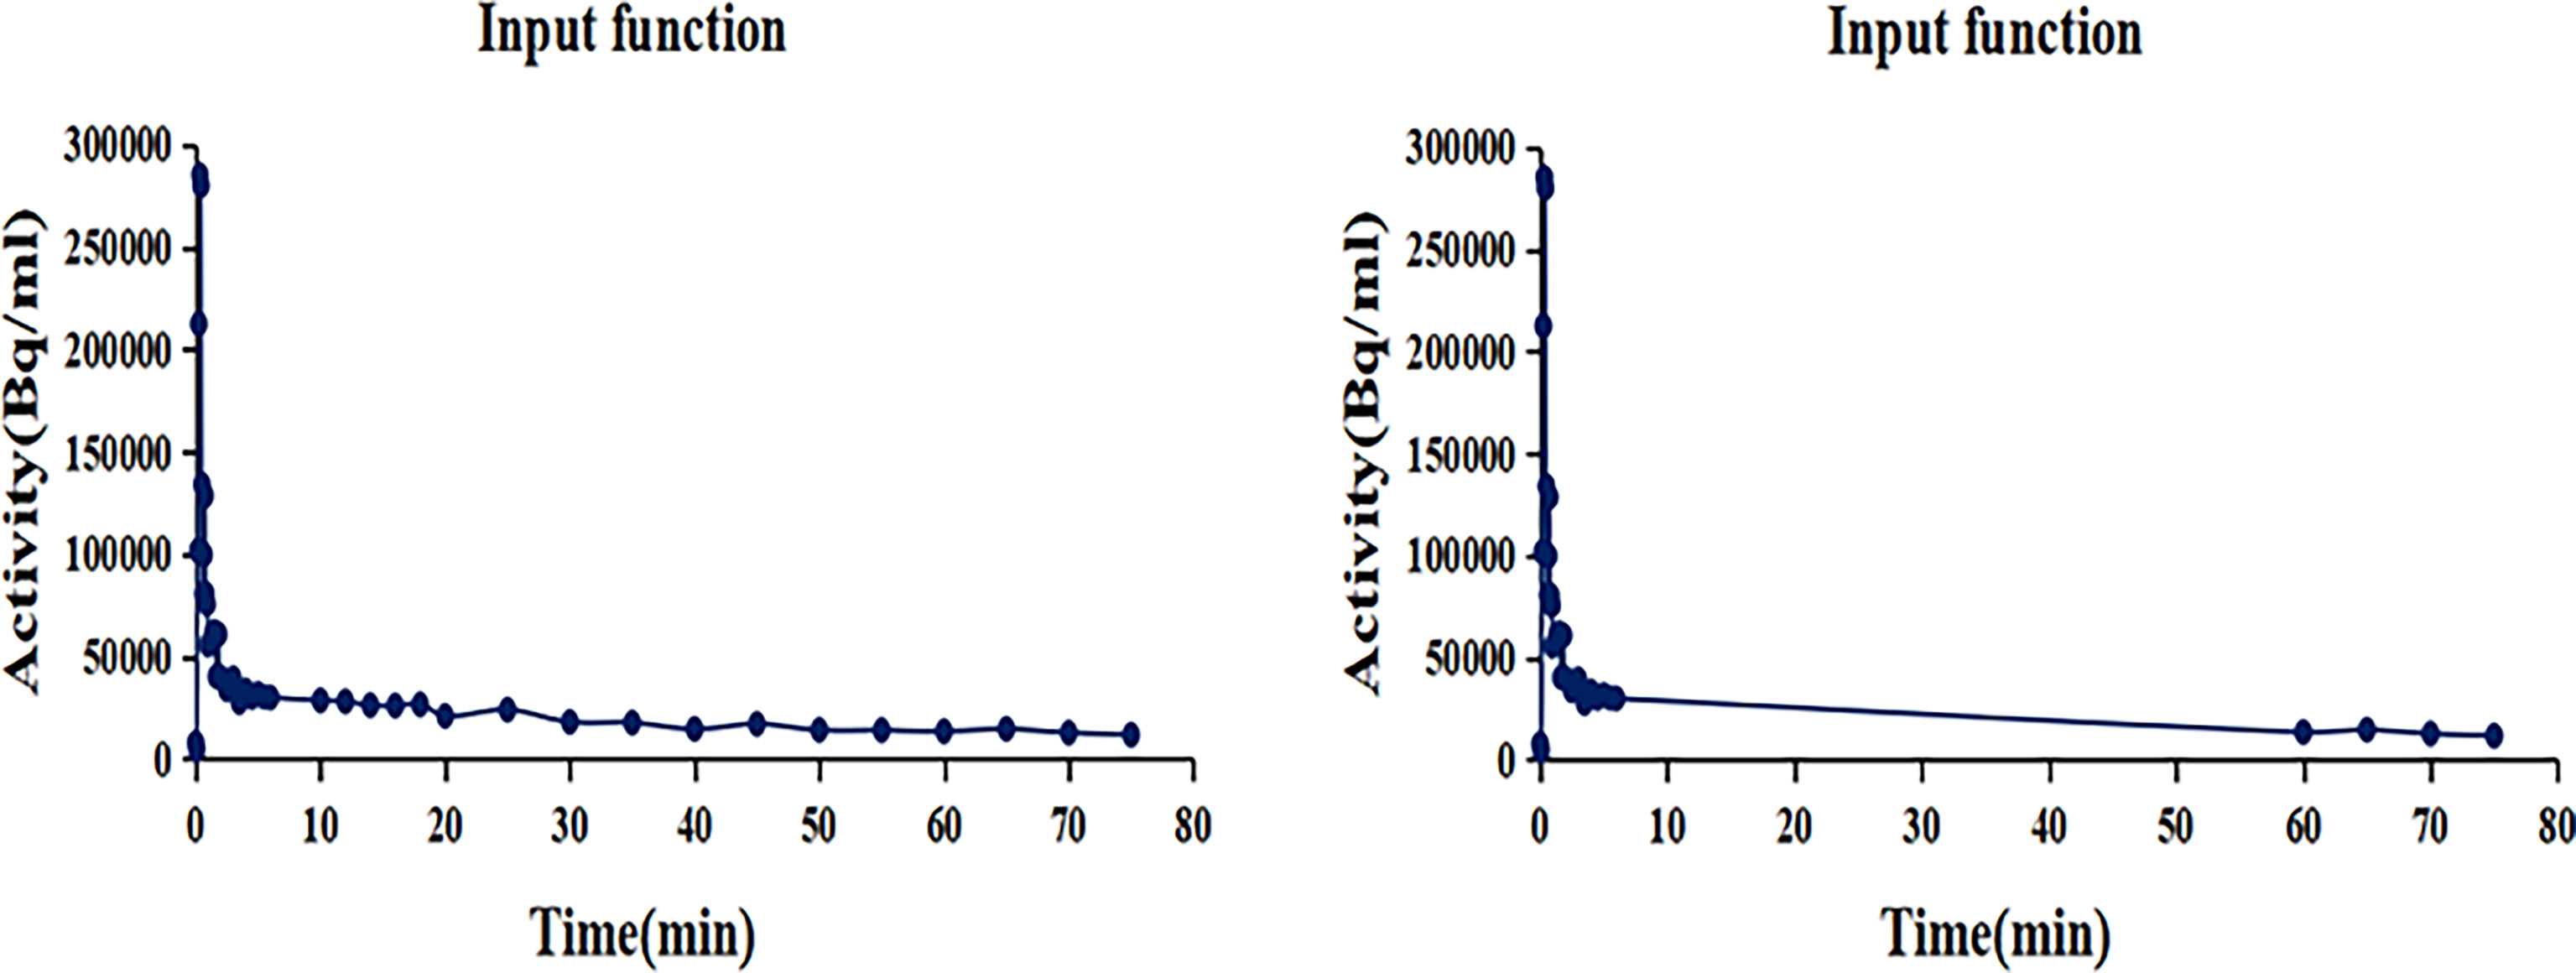
Figure 2 The input function TACs. (Left) IDIF was automatically generated from proximal descending aorta using dynamic PET series (0–75 min). (Right) TACs of proximal descending aorta were acquired from 0 to 6 min single bed list-mode PET images and the last three frames (60–75 min) dynamic PET series and were merged into one TAC in comma-separated values (CSV) files. The IDIF was then generated by importing these CSV files.
The conventional static clinical PET images were reconstructed using the last three dynamic PET frames (60 to 75 min) for SUV calculation (SUVFDG). Reconstruction parameters are as follows: OSEM True X + TOF, 4 iterations, 5 subsets, 220 matrices, with relative scatter correction and no Gaussian post filtering.
Image Analysis
SUVFDG, MRFDG, and DVFDG images were visually compared on workstation (syngo.via, Siemens Healthineers) by two nuclear medicine physicians. A volume of interest (VOI) was drawn over the target regions to obtain SUVFDG, MRFDG, and DVFDG values. The VOIs of each lesion or normal organs on the standard MRFDG-std and DVFDG-std images were copied to the two short dynamic MRFDG-tsd and DVFDG-tsd images. Lesion VOIs were drawn using an automated delineation method with 41% of the maximum pixel value as segmentation threshold, while VOIs of normal organs were drawn using a sphere with a fixed diameter. Consistency of MRFDG and DVFDG from two different Patlak reconstructions was analyzed.
Statistical Analysis
The statistical and graphical analysis of the extracted data were performed using MedCalc 20.03 (MedCalc Software, Ostend, Belgium). For inter-method correlation, Passing–Bablok regression was used including cusum test for linearity. Furthermore, inter-method agreement of MRFDG and DVFDG was analyzed using Bland–Altman plots. In all the tests, a p-value < 0.05 was considered statistically significant.
Results
Clinical and Multiparametric Image Characteristics
Twenty-one patients were enrolled in this study (9 female and 12 male patients; mean age = 62.3 ± 11.4 years). Table 1 summarizes the clinical indications and the anatomical locations of the lesions assessed for each patient. In this study, two different reconstruction methods were used to generate the multiparametric images of the standard MRFDG and DVFDG images (MRFDG-std and DVFDG-std) and two short dynamic MRFDG and DVFDG images (MRFDG-tsd and DVFDG-tsd). Both methods produced good-quality MRFDG images and DVFDG images, and there is no visual distinction of images between the two reconstruction methods (Figures 3, 4). Compared with the static SUVFDG images, the suppression of blood pool was found in several MRFDG images for organs that have non-negligible fraction of blood pool compartment, such as the liver, spleen, large vessels, and renal pelvises. Due to the long scan time, the drawback of intestinal peristalsis artifacts in MRFDG image and DVFDG image that affected the diagnosis of intestinal lesions cannot be ignored.
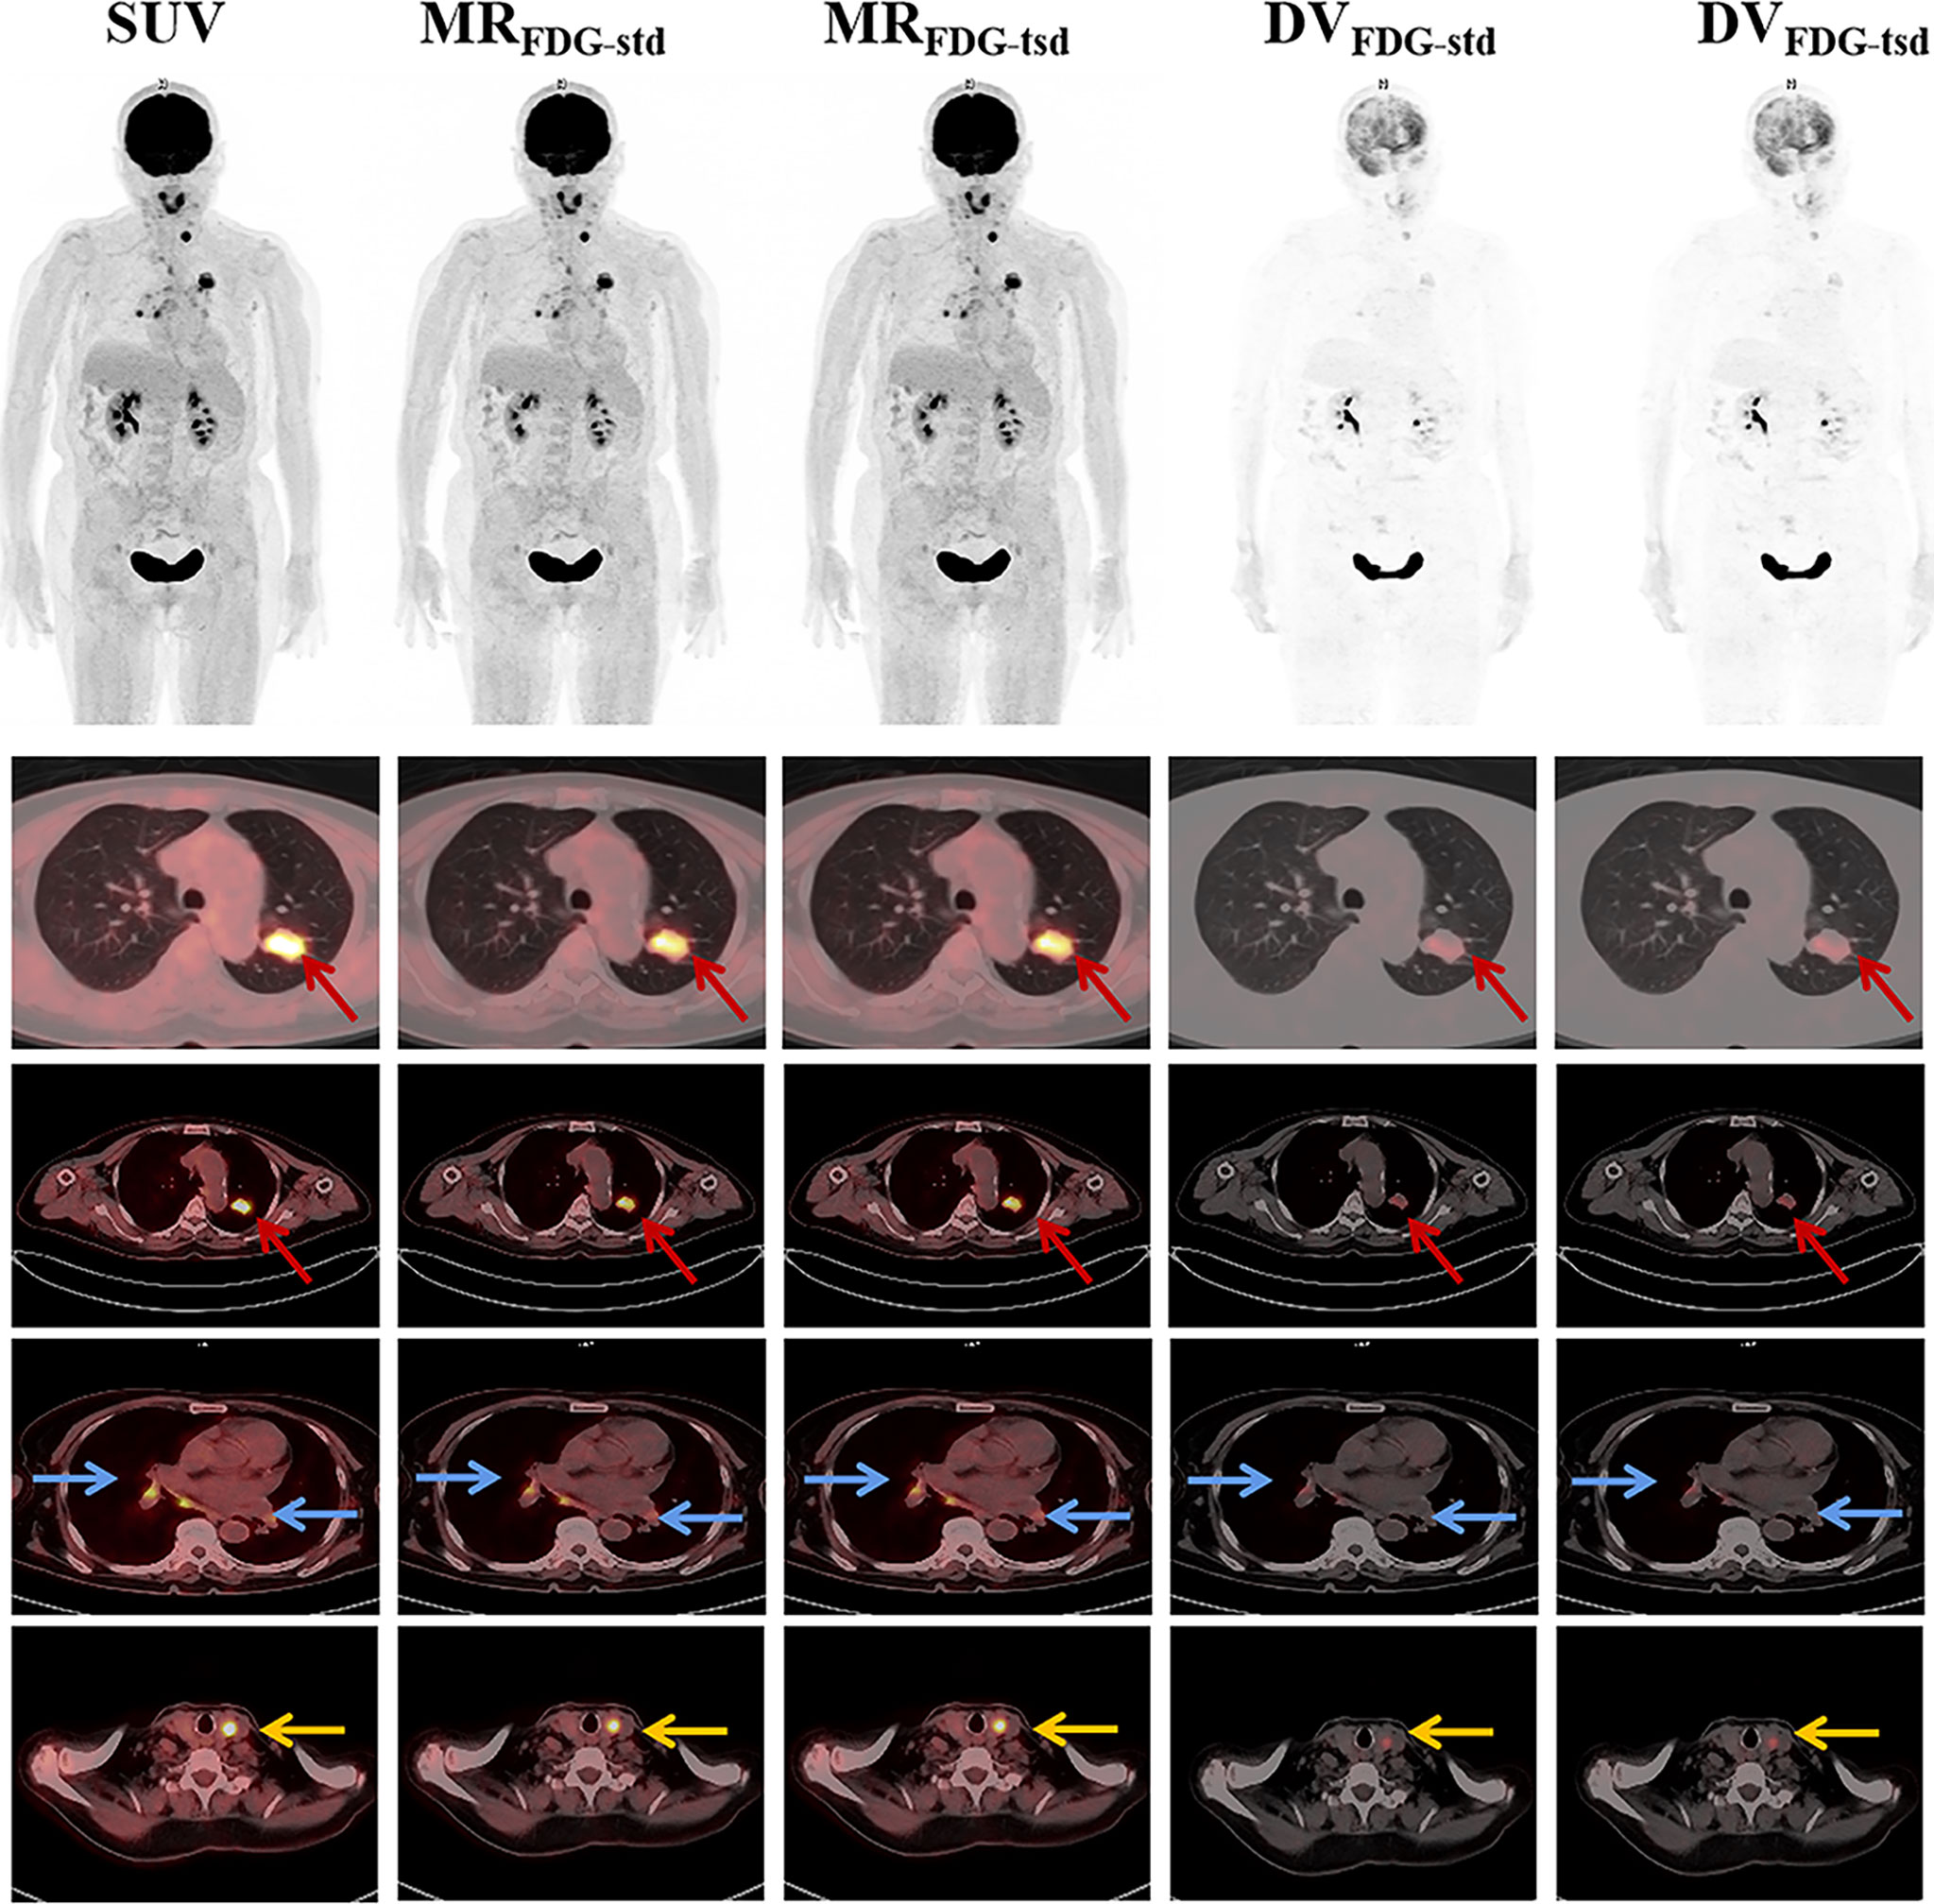
Figure 3 Representative static SUVFDG images, and MRFDG and DVFDG images of standard and two short dynamic reconstruction groups. MRFDG and DVFDG images generated from both groups were found with good quality, and showed no visual distinction between the two reconstruction methods. The patient was diagnosed with pulmonary adenocarcinoma (red arrows). The PET scan revealed FDG uptake in multiple lymph nodes in the mediastinum and hilar(blue arrows). Incidental uptake of FDG in the thyroid gland was shown (yellow arrows).
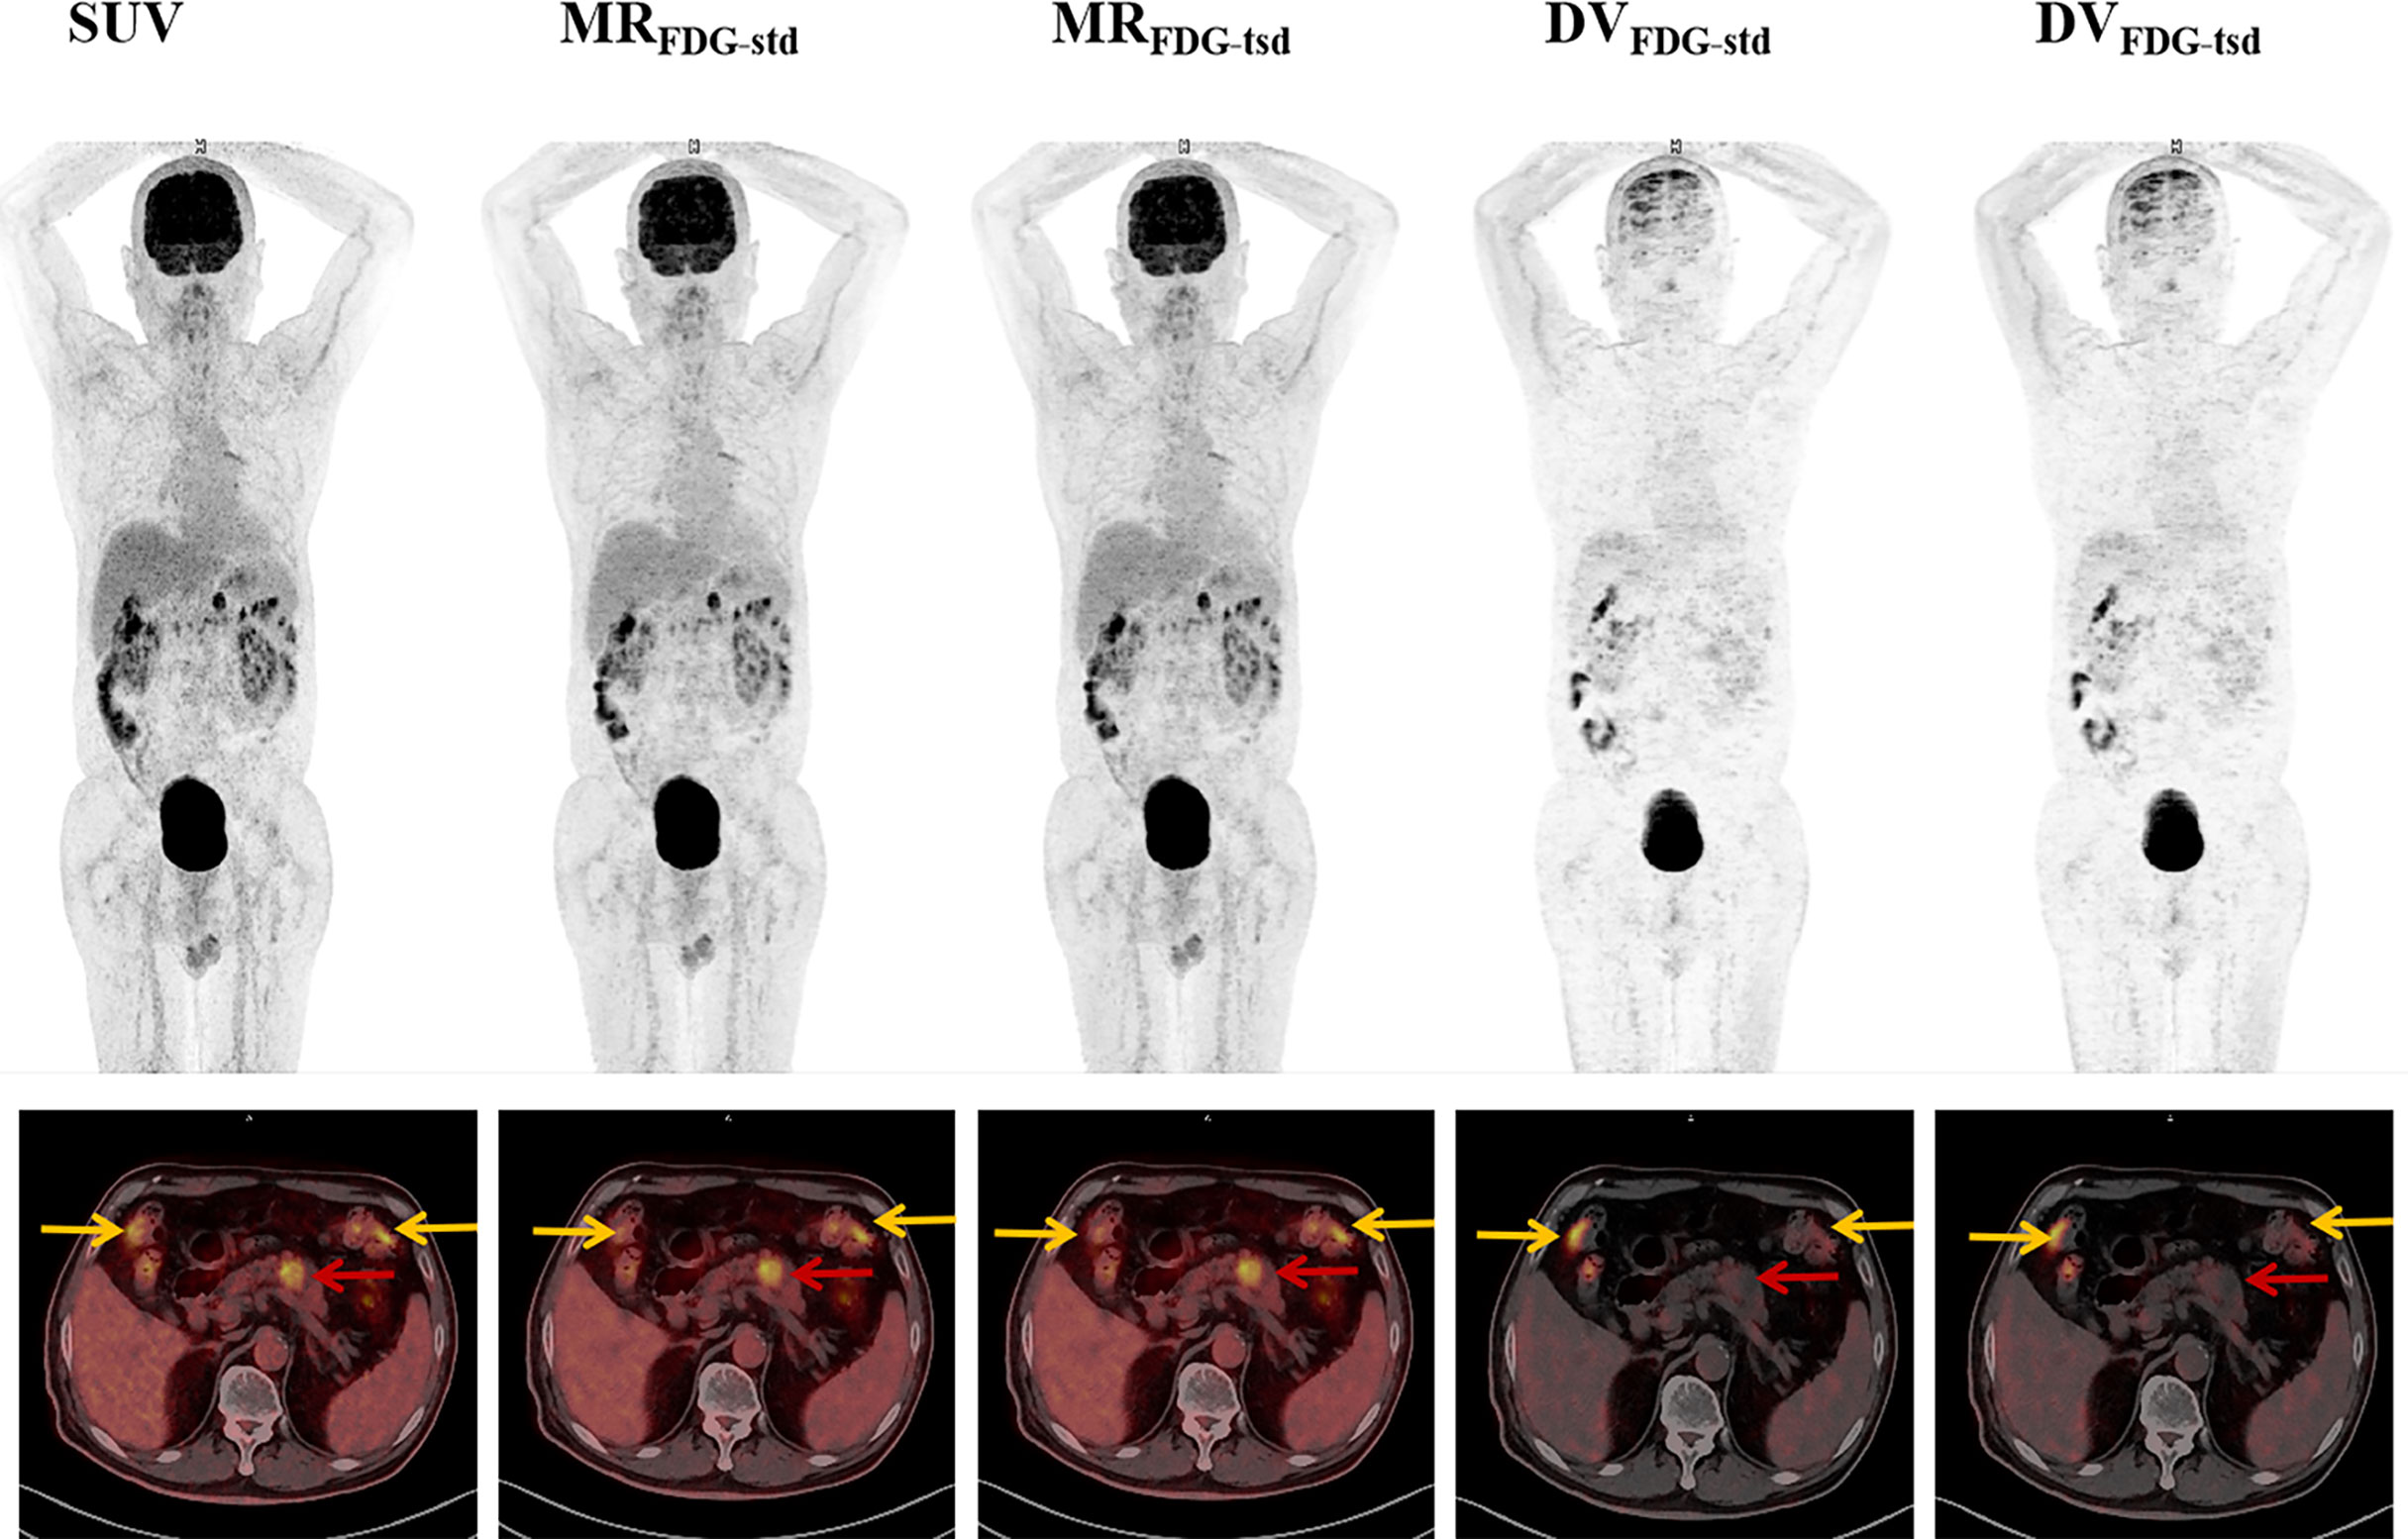
Figure 4 Representative MRFDG and DVFDG images of standard and two short dynamic reconstruction groups. The patient was diagnosed with pancreatic adenocarcinoma (red arrows). Intense focal tumoral uptake of FDG was shown on SUV and MRFDG images, while there was no significant increased uptake on DVFDG image. High physiological FDG uptake of colon was also found in types of images (yellow arrows).
Comparison of MRFDG and DVFDG Values of Normal Organs in Different Reconstruction Groups
As summarized in Table 2, MRFDG and DVFDG showed a wide range of values among different organs with significant differences. The maximum, peak, or mean values of MRFDG and DVFDG in the brain and heart wall were relatively high, while those of the lung were the lowest. When comparing MRFDG and DVFDG values of normal organs between the standard group and the two-short-dynamic group, no significant difference was observed. The null hypothesis assuming non-linearity was rejected in MRFDG and DVFDG values. There is almost no difference between MRFDG-tsd and MRFDG-std; the intercept A was 0 and the Slope B was 1. There is a slight variation between DVFDG-tsd and DVFDG-std. The value 0 was included in the confidence interval of intercept A in DVFDG values; however, the value 1 in the confidence interval of Slope B was not included. The Bland–Altman plot showed that the mean bias of MRFDG-max, MRFDG-mean, and MRFDG-peak was -0.002 (95% CI: -0.032–0.027), -0.002 (95% CI: -0.026–0.023), and -0.002 (95% CI: -0.026–0.022), respectively. The mean bias of DVFDG-max, DVFDG-mean, and DVFDG-peak was -3.3 (95% CI: -24.8–18.2), -1.4 (95% CI: -12.1–9.2), and -2.3 (95% CI: -15–10.4), respectively (Table 3 and Figure 5).

Table 3 Passing–Bablok regression of MRFDG and DVFDG of normal organs between different reconstruction groups.
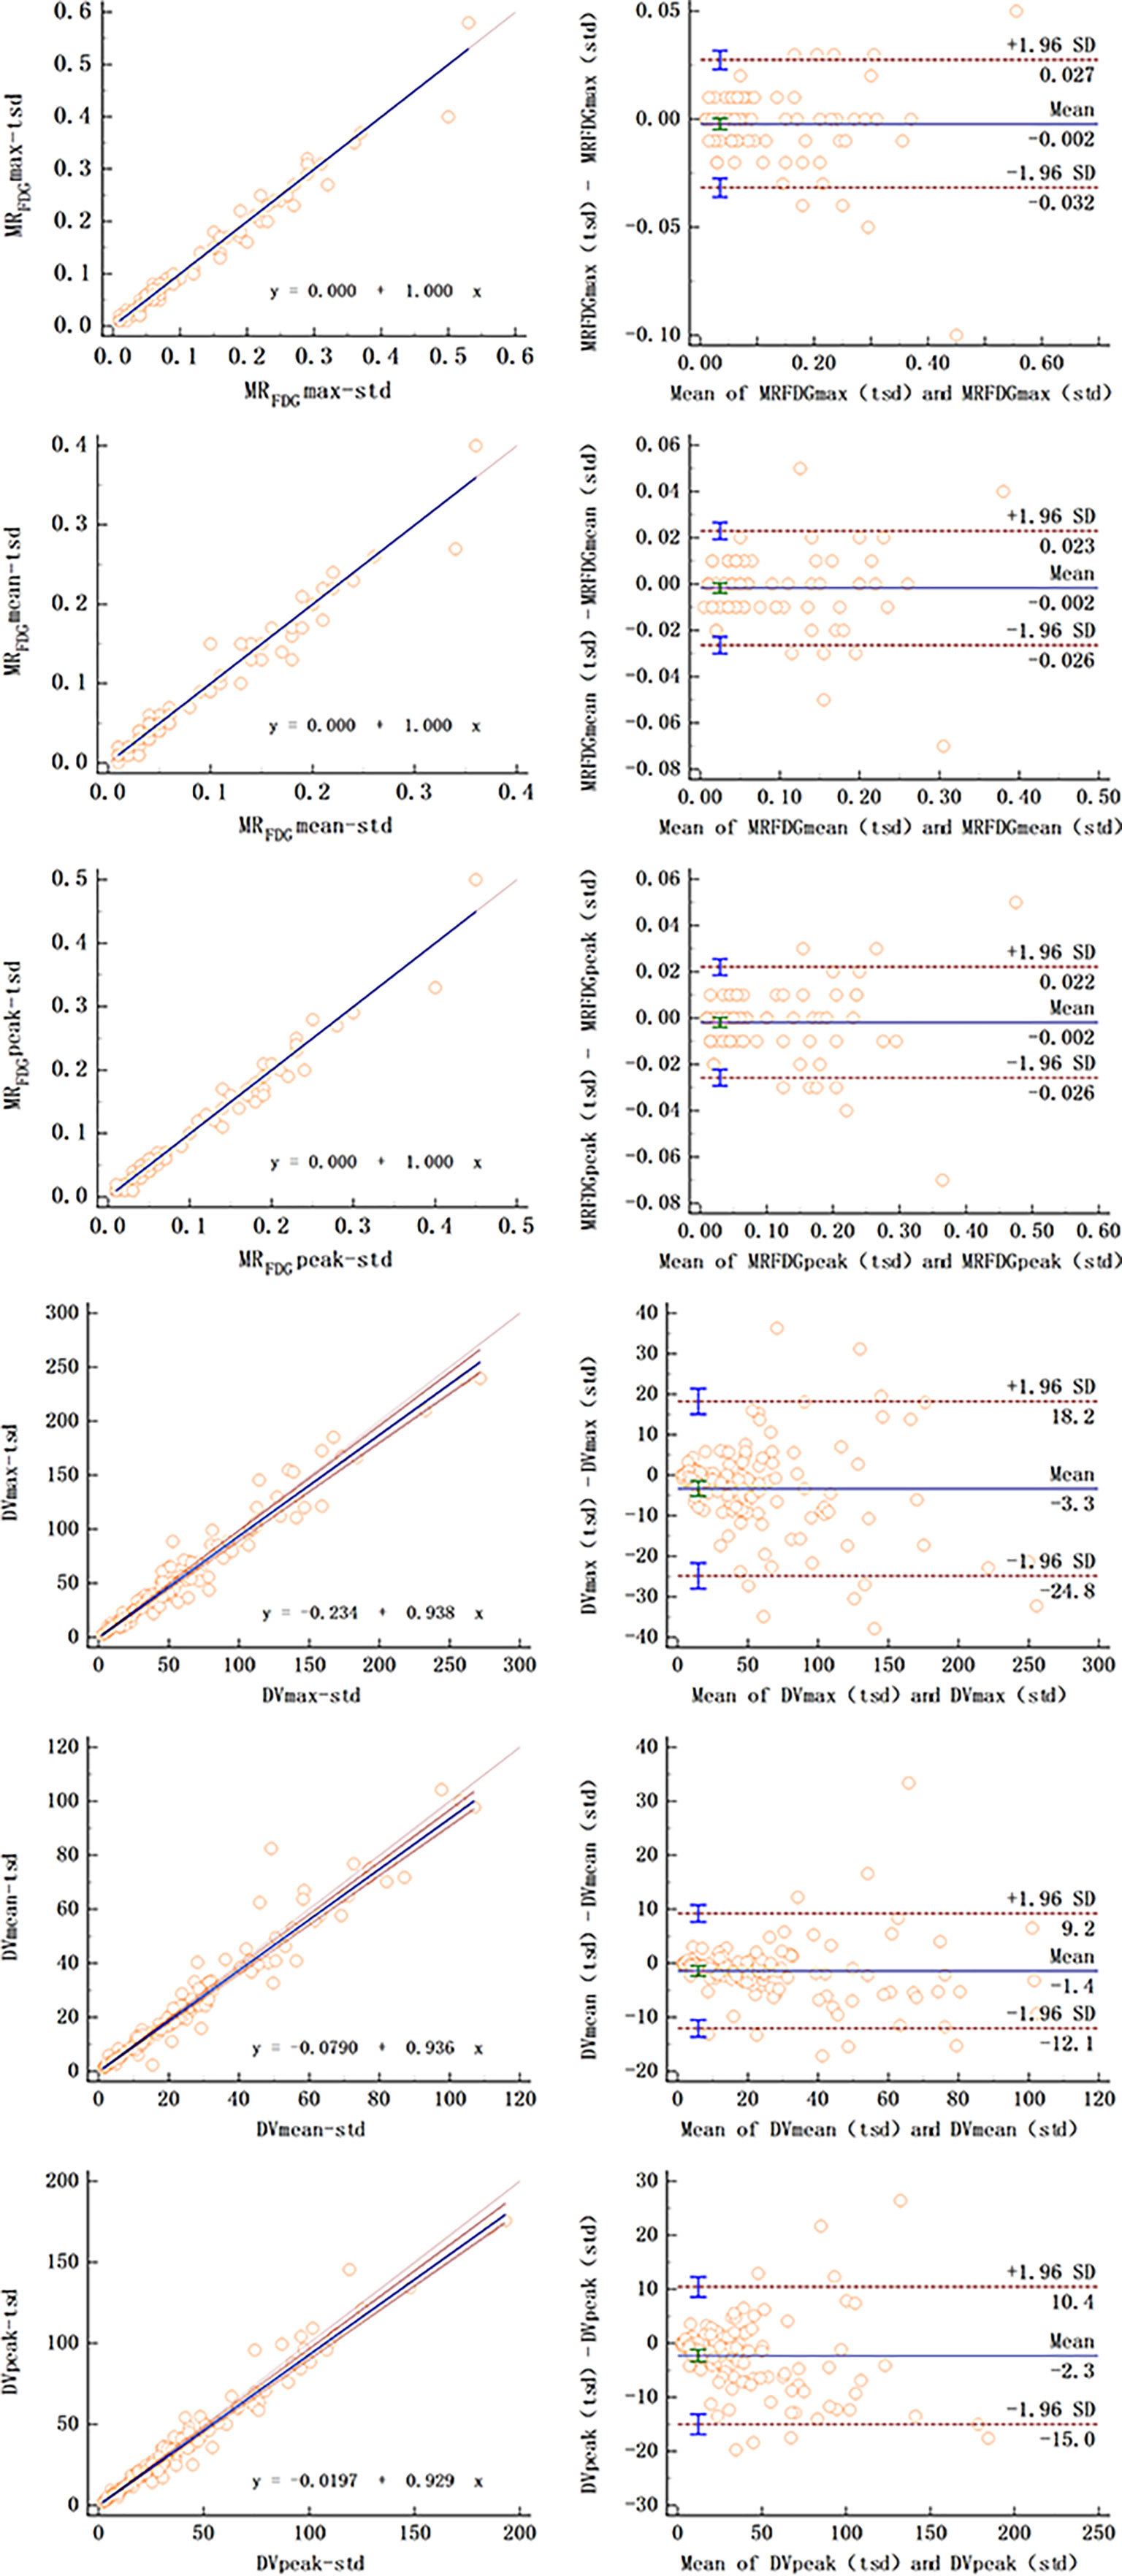
Figure 5 Passing–Bablok regression (left column) and Bland–Altman plot (right column) of MRFDG and DVFDG values of normal organs between standard and two short dynamic multiparametric images.
Comparison of MRFDG and DVFDG Values of Lesions in Different Reconstruction Groups
For MRFDG and DVFDG values of lesions, there was substantial correlation between two reconstruction groups. Passing–Bablok regression and Bland–Altman plots demonstrate the inter-method agreement and show that differences of MRFDG and DVFDG were acceptably small in the cohort (Table 4 and Figure 6).

Table 4 Passing–Bablok regression of MRFDG and DVFDG of lesions between different reconstruction groups.
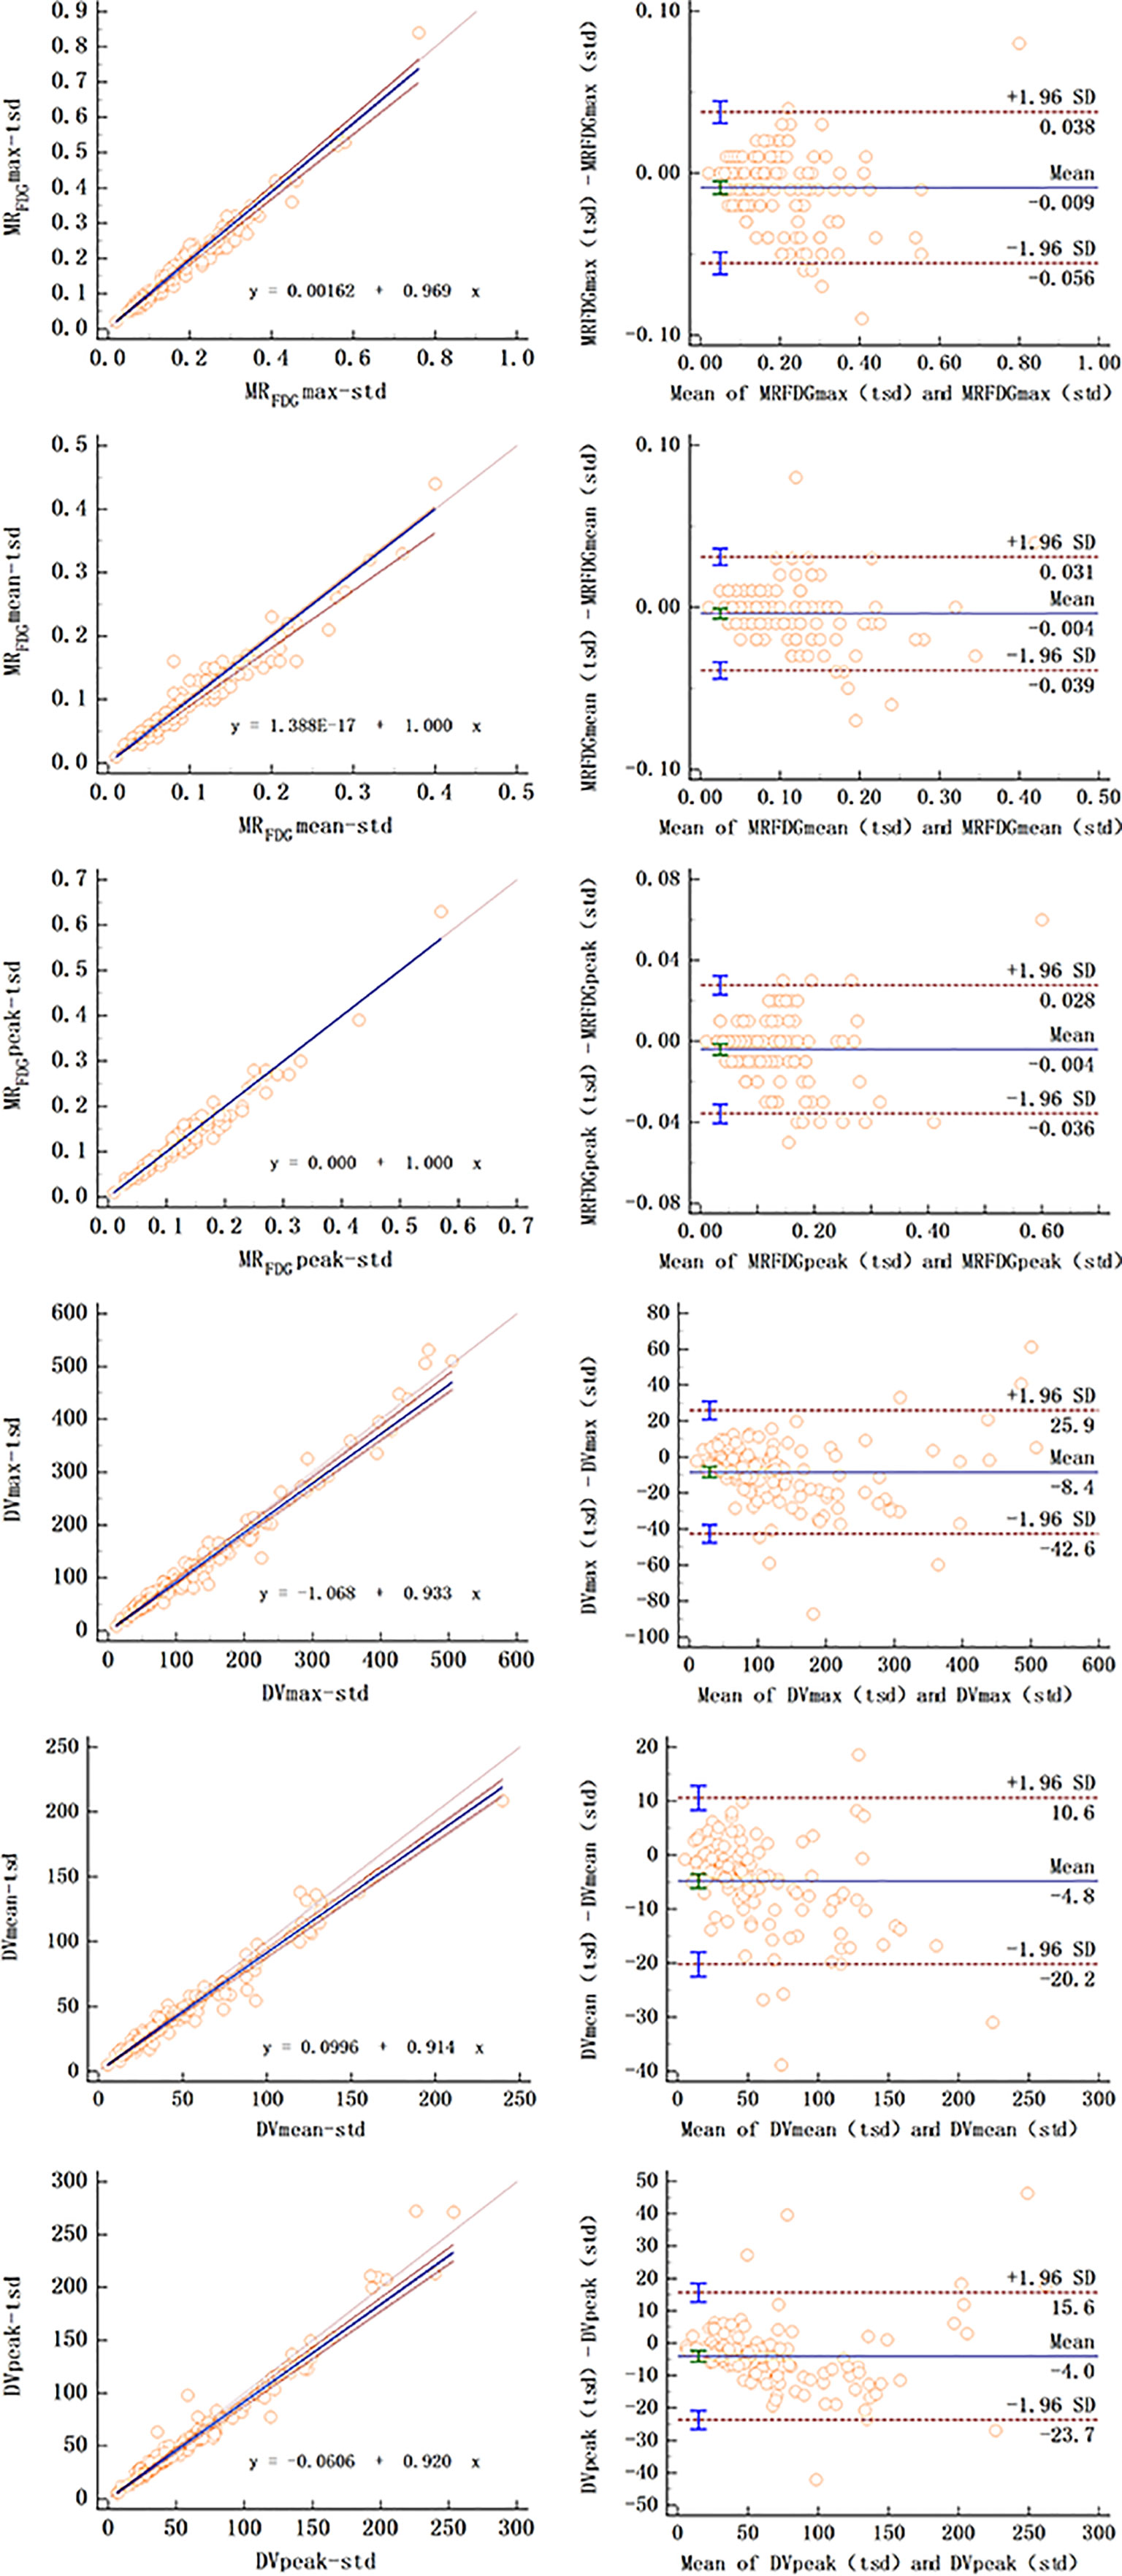
Figure 6 Passing–Bablok regression (left column) and Bland–Altman plot (right column) of MRFDG and DVFDG values of lesions between standard and two short dynamic multiparametric images.
The null hypothesis assuming non-linearity was rejected in all cases. The Bland–Altman plot showed that the mean bias of MRFDG-max, MRFDG-mean, and MRFDG-peak was -0.009 (95% CI: -0.056–0.038), -0.004 (95% CI: -0.039–0.031), and -0.004 (95% CI: -0.036–0.028), respectively. The mean bias of DVFDG-max, DVFDG-mean, and DVFDG-peak was -8.4 (95% CI: -42.6–25.9), -4.8 (95% CI: -20.2–10.6), and -4.0 (95% CI: -23.7–15.6), respectively.
Discussion
Dynamic PET enables full quantitative imaging (as opposed to SUV, which is semi-quantitative) by producing additional multiparametric images: the MRFDG image, which is the rate of irreversible uptake, and the Patlak intercept (DV) image, which is the apparent distribution volume of the non-metabolized FDG (24). The clinical application of multiparametric dynamic WB-PET is seriously limited due to the long scanning time. Our study evaluated the harmonization of Patlak parametric images reconstructed using two short dynamic subsets including the first 0–6 min and 60–75 min scans post injection compared to the standard parametric images derived from the complete 0–75 min dynamic scans. The feasibility of shorter acquisition times on multiparameter collection was investigated.
The results showed that both reconstruction groups produced MRFDG images and DVFDG images with good quality, and without visual distinction of images between the two reconstruction methods. Compared with the static SUVFDG images, the suppression of blood pool is obvious in MRFDG images for organs that have non-negligible fraction of blood pool compartment, such as the liver, spleen, large vessels, and renal pelvises. This feature of MRFDG images commonly results in higher contrast for lesions located close to these anatomical structures as reported in previous studies (21, 25). Due to the long scanning time, the only drawback of MRFDG image and DVFDG image was the deviation caused by intestinal peristalsis artifacts, which affected the diagnosis of intestinal lesions, which is consistent with the previous research (26). The visual performance of normal organs and lesions was similar in MRFDG images and DVFDG images of two reconstruction groups. For quantification evaluation, the overall maximum, mean, and peak values of MRFDG and DVFDG of normal organs and lesions between two reconstruction groups showed significant linear correlation, while no significant differences were found in Passing–Bablok regression analysis. The uniformity of MRFDG, DVFDG, and SUVFDG values between the group with two short dynamic acquisitions and the group with standard 0–75 min continuous dynamic scans was visualized using Bland–Altman plots. This indicates that our proposed method might have potential to improve clinical workflow for WB Patlak parametric imaging.
Several attempts have been made to reduce duration of dynamic PET scans. Yao et al. (27) proposed a simplified WB scanning protocol that utilizes both population-based input function and model-based input function for WB Patlak image reconstruction. Feng et al. (28) demonstrated that with the use of an ultrahigh-sensitivity total-body PET scanner, it is possible to achieve WB parametric image reconstruction using only the early stage of the scan (within the first 2 min post injection). Wu et al. (29) explored and proved the possibility of shortened acquisition time for parametric imaging of Ki in FDG PET scan employing the nonlinear estimation approach with 7 patients scanned on a total-body PET scanner. Wu et al. (30) generated parametric Ki images of FDG PET using two 5-min scans, which showed higher quantification accuracy with respect to standard Ki than relative SUV change. In any case, the influence of quantitative performance in shortened dynamic PET was not investigated. In this study, the two short dynamic scans were obtained from complete 75-min dynamic sets with the patient remaining in the same position in the scanner. The dataset between the early and late scans was cut off. The obliteration of data during the intermediate period was a big perturbation for IDIF, which could influence the quantitative parameters. The aim of the present study was to investigate whether two short dynamic scans can achieve reliable multiparametric images without sacrificing quantitative performance.
One of the limitations of two-short-dynamic scanning is the patient motion artifact. Tomohito Kaji et al. (31) suggested to eliminate the frames with motion, which seems to be particularly useful for motion artifact. In this study, the two short dynamic scans were obtained from complete 75-min dynamic sets with the patient remaining in the same position in the scanner. In clinical two-short-dynamic imaging, the patient would leave the scanner between the early and late scans, which can increase patient throughout. This means that two aorta VOIs will need to be used to generate the full IDIF from the two scans, and two CT scans would be required for accurate attenuation correction of the two PET images, with the first scan only requiring an axial FOV that covers the cardiac region (e.g., single bed acquisition). Input VOIs can be acquired using the reconstruct images of the early and late scans drawn over a large arterial vessel, like the descending aorta. The second CT covering the whole body (from vertex to mid-thigh) will be performed before the static PET scanning in order to avoid misalignment. Note that the WB dynamic CBM scan is only needed for the second PET/CT scan to generate the tissue TACs.
Conclusion
This study shows that two short dynamic scans for multiparametric PET image collection enable a reduction of scan time duration without sacrificing quantitative performance. The maximum, mean, and peak values of MRFDG and DVFDG reconstructed using standard and two-short-dynamic-scanning data are statistically consistent.
Data Availability Statement
The original contributions presented in the study are included in the article/supplementary material. Further inquiries can be directed to the corresponding authors.
Ethics Statement
All procedures performed in studies involving human participants were approved by the ethics committee of First Affiliated Hospital of Anhui Medical University and Ruijing Hospital of Shanghai Jiaotong University, and informed consent was obtained from all participants. The patients/participants provided their written informed consent to participate in this study. Written informed consent was obtained from the individual(s) for the publication of any potentially identifiable images or data included in this article.
Author Contributions
HW and HX conceived the idea of the study. HW, YM, and WY collected the data. HW, YM, GZ, TW, GY, and XZ performed image analysis. HW wrote the manuscript and performed the statistical analysis. HX and BL edited the manuscript. All authors contributed to the article and approved the submitted version.
Funding
The study was funded by the National Natural Science Foundation of China (Nos. 81801736 and 81971643).
Conflict of Interest
The authors declare that the research was conducted in the absence of any commercial or financial relationships that could be construed as a potential conflict of interest.
Publisher’s Note
All claims expressed in this article are solely those of the authors and do not necessarily represent those of their affiliated organizations, or those of the publisher, the editors and the reviewers. Any product that may be evaluated in this article, or claim that may be made by its manufacturer, is not guaranteed or endorsed by the publisher.
Acknowledgments
We gratefully acknowledge valuable discussions and comments from Yue Wu Ph.D., and Puyun Chen Ph.D., from Siemens Healthineers.
References
1. Hou G, Jiang Y, Li F, Cheng X. Use of 18F-FDG PET/CT to Differentiate Ectopic Adrenocorticotropic Hormone-Secreting Lung Tumors From Tumor-Like Pulmonary Infections in Patients With Ectopic Cushing Syndrome. Front Oncol (2021) 11:762327. doi: 10.3389/fonc.2021.762327
2. Hicks RJ, Roselt PJ, Kallur KG, Tothill RW, Mileshkin L. FAPI PET/CT: Will It End the Hegemony of 18F-FDG in Oncology? J Nucl Med (2021) 62(3):296–302. doi: 10.2967/jnumed.120.256271
3. Kuhnl A, Roddie C, Kirkwood AA, Menne T, Cuadrado MM, Marzolini MAV, et al. Early FDG PET Response Predicts CAR-T Failure in Large B-Cell Lymphoma. Blood Adv (2022) 6:321–6. doi: 10.1182/bloodadvances.2021005807
4. Som P, Atkins HL, Bandoypadhyay D, Fowler JS, MacGregor RR, Matsui K, et al. A Fluorinated Glucose Analog, 2-Fluoro-2-Deoxy-D-Glucose (F-18): Nontoxic Tracer for Rapid Tumor Detection. J Nucl Med (1980) 21:670–5. doi: 10.1097/00004728-198012000-00045
5. Tomasi G, Turkheimer F, Aboagye E. Importance of Quantification for the Analysis of PET Data in Oncology: Review of Current Methods and Trends for the Future. Mol Imaging Biol (2012) 14:131–46. doi: 10.1007/s11307-011-0514-2
6. Pietrzak AK, Kazmierska J, Marszalek A, Golusinski P, Heydrych A, Wiechec K, et al. Dual-Time-Point PET/CT Study Protocol can Improve the Larynx Cancer Diagnosis. Rep Pract Oncol Radiother (2020) 25:533–8. doi: 10.1016/j.rpor.2020.04.013
7. Lodge MA. Repeatability of SUV in Oncologic 18f-FDG PET. J Nucl Med (2017) 8:523–32. doi: 10.2967/jnumed.116.186353
8. Wang G, Rahmim A, Gunn RN. PET Parametric Imaging: Past, Present, and Future. IEEE Trans Radiat Plasma Med Sci (2020) 4:663–75. doi: 10.1109/trpms.2020.3025086
9. Metser U, Even-Sapir E. Increased (18)F-Fluorodeoxyglucose Uptake in Benign, Nonphysiologic Lesions Found on Whole-Body Positron Emission Tomography/Computed Tomography (PET/CT): Accumulated Data From Four Years of Experience With PET/CT. Semin Nucl Med (2007) 37:206–22. doi: 10.1053/j.semnuclmed.2007.01.001
10. Rahman WT, Wale DJ, Viglianti BL, Townsend DM, Manganaro MS, Gross MD, et al. The Impact of Infection and Inflammation in Oncologic 18F-FDG PET/CT Imaging. BioMed Pharmacother (2019) 117:109168. doi: 10.1016/j.biopha.2019.109168
11. Shreve PD, Anzai Y, Wahl RL. Pitfalls in Oncologic Diagnosis With FDG PET Imaging: Physiologic and Benign Variants. Radiographics (1999) 19:61–77. doi: 10.1148/radiographics.19.1.g99ja0761
12. Karakatsanis NA, Lodge MA, Tahari AK, Zhou Y, Wahl RL, Rahmim A. Dynamic Whole-Body PET Parametric Imaging: I. Concept, Acquisition Protocol Optimization and Clinical Application. Phys Med Biol (2013) 58:7391–418. doi: 10.1088/0031-9155/58/20/7391
13. Karakatsanis NA, Lodge MA, Zhou Y, Wahl RL, Rahmim A. Dynamic Whole-Body PET Parametric Imaging: II. Task-Oriented Statistical Estimation. Phys Med Biol (2013) 58:7419–45. doi: 10.1088/0031-9155/58/20/7419
14. Patlak CS, Blasberg RG, Fenstermacher JD. Graphical Evaluation of Blood-to-Brain Transfer Constants From Multiple-Time Uptake Data. J Cereb Blood Flow Metab (1983) 3:1–7. doi: 10.1038/jcbfm.1983.1
15. Zaker N, Kotasidis F, Garibotto V, Zaidi H. Assessment of Lesion Detectability in Dynamic Whole-Body PET Imaging Using Compartmental and Patlak Parametric Mapping. Clin Nucl Med (2020) 45:e221–31. doi: 10.1097/RLU.0000000000002954
16. Cheebsumon P, Velasquez LM, Hoekstra CJ, Hayes W, Kloet RW, Hoetjes NJ, et al. Measuring Response to Therapy Using FDG PET: Semi-Quantitative and Full Kinetic Analysis. Eur J Nucl Med Mol Imaging (2011) 38:832–42. doi: 10.1007/s00259-010-1705-9
17. Fahrni G, Karakatsanis NA, Di Domenicantonio G, Garibotto V, Zaidi H. Does Whole-Body Patlak 18f-FDG PET Imaging Improve Lesion Detectability in Clinical Oncology? Eur Radiol (2019) 29:4812–21. doi: 10.1007/s00330-018-5966-1
18. Grkovski M, Kohutek ZA, Schöder H, Brennan CW, Tabar VS, Gutin PH, et al. 18f-Fluorocholine PET Uptake Correlates With Pathologic Evidence of Recurrent Tumor After Stereotactic Radiosurgery for Brain Metastases. Eur J Nucl Med Mol Imaging (2020) 47:1446–57. doi: 10.1007/s00259-019-04628-6
19. Dias AH, Pedersen MF, Danielsen H, Munk OL, Gormsen LC. Clinical Feasibility and Impact of Fully Automated Multiparametric PET Imaging Using Direct Patlak Reconstruction: Evaluation of 103 Dynamic Whole-Body 18F-FDG PET/CT Scans. Eur J Nucl Med Mol Imaging (2021) 48:837–50. doi: 10.1007/s00259-020-05007-2
20. Ye Q, Wu J, Lu Y, Naganawa M, Gallezot JD, Ma T. Improved Discrimination Between Benign and Malignant LDCT Screening-Detected Lung Nodules With Dynamic Over Static 18F-FDG PET as a Function of Injected Dose. Phys Med Biol (2018) 63:175015. doi: 10.1088/1361-6560/aad97f
21. Chen K, Bandy D, Reiman E, Huang SC, Lawson M, Feng D, et al. Noninvasive Quantification of the Cerebral Metabolic Rate for Glucose Using Positron Emission Tomography, 18F-Fluoro-2-Deoxyglucose, the Patlak Method, and an Image-Derived Input Function. J Cereb Blood Flow Metab (1998) 18:716–23. doi: 10.1097/00004647-199807000-00002
22. Naganawa M, Gallezot JD, Shah V, Mulnix T, Young C, Dias M, et al. Assessment of Population-Based Input Functions for Patlak Imaging of Whole Body Dynamic 18F-FDG PET. EJNMMI Phys (2020) 7:67. doi: 10.1186/s40658-020-00330-x
23. Schildt A, de Vries EFJ, Willemsen ATM, Moraga-Amaro R, Lima-Giacobbo B, Sijbesma JWA, et al. Modeling of [18F]FEOBV Pharmacokinetics in Rat Brain. Mol Imaging Biol (2020) 22:931–39. doi: 10.1007/s11307-019-01466-8
24. Kajáry K, Lengyel Z, Tőkés AM, Kulka J, Dank M, Tőkés T. Dynamic FDG-PET/CT in the Initial Staging of Primary Breast Cancer: Clinicopathological Correlations. Pathol Oncol Res (2020) 26:997–1006. doi: 10.1007/s12253-019-00641-0
25. Liu G, Xu H, Hu P, Tan H, Zhang Y, Yu H. Kinetic Metrics of 18F-FDG in Normal Human Organs Identified by Systematic Dynamic Total-Body Positron Emission Tomography. Eur J Nucl Med Mol Imaging (2021) 48:2363–72. doi: 10.1007/s00259-020-05124-y
26. Merlin T, Visvikis D, Fernandez P, Lamare F. Dynamic PET Image Reconstruction Integrating Temporal Regularization Associated With Respiratory Motion Correction for Applications in Oncology. Phys Med Biol (2018) 63:045012. doi: 10.1088/1361-6560/aaa86a
27. Yao S, Feng T, Zhao Y, Wu R, Wang R, Wu S. Simplified Protocol for Whole-Body Patlak Parametric Imaging With 18 F-FDG PET/CT: Feasibility and Error Analysis. Med Phys (2021) 48:2160–9. doi: 10.1002/mp.14187
28. Feng T, Zhao Y, Shi H, Li H, Zhang X, Wang G. Total-Body Quantitative Parametric Imaging of Early Kinetics of 18F-FDG. J Nucl Med (2021) 62:738–44. doi: 10.2967/jnumed.119.238113
29. Wu Y, Feng T, Zhao Y, Xu T, Fu F, Huang Z, et al. Whole-Body Parametric Imaging of FDG PET Using uEXPLORER With Reduced Scan Time. J Nucl Med (2022) 63:622–8. doi: 10.2967/jnumed.120.261651
30. Wu J, Liu H, Ye Q, Gallezot JD, Naganawa M, Miao T, et al. Generation of Parametric Ki Images for FDG PET Using Two 5-Min Scans. Med Phys (2021) 48:5219–31. doi: 10.1002/mp.15113
Keywords: dynamic PET, whole-body parametric imaging, Patlak, 18F-FDG, positron emission tomography/computed tomography (PET/CT)
Citation: Wang H, Miao Y, Yu W, Zhu G, Wu T, Zhao X, Yuan G, Li B and Xu H (2022) Improved Clinical Workflow for Whole-Body Patlak Parametric Imaging Using Two Short Dynamic Acquisitions. Front. Oncol. 12:822708. doi: 10.3389/fonc.2022.822708
Received: 26 November 2021; Accepted: 30 March 2022;
Published: 28 April 2022.
Edited by:
Kuang Gong, Harvard Medical School, United StatesCopyright © 2022 Wang, Miao, Yu, Zhu, Wu, Zhao, Yuan, Li and Xu. This is an open-access article distributed under the terms of the Creative Commons Attribution License (CC BY). The use, distribution or reproduction in other forums is permitted, provided the original author(s) and the copyright owner(s) are credited and that the original publication in this journal is cited, in accordance with accepted academic practice. No use, distribution or reproduction is permitted which does not comply with these terms.
*Correspondence: Biao Li, bGIxMDM2M0ByamguY29tLmNu; Huiqin Xu, aGZodWlxaW54dUAxNjMuY29t
 Hui Wang
 Ying Miao2
 Biao Li
 Huiqin Xu