 Hongyu Deng1,2
 Xingyu Chen
 Ke Cao
94% of researchers rate our articles as excellent or good
Learn more about the work of our research integrity team to safeguard the quality of each article we publish.
Find out more
ORIGINAL RESEARCH article
Front. Oncol., 02 March 2022
Sec. Genitourinary Oncology
Volume 12 - 2022 | https://doi.org/10.3389/fonc.2022.820242
This article is part of the Research TopicBiomarkers in Genitourinary Cancers, Volume IIView all 25 articles
N6-methyladenosine (m6A) has emerged as one of the most important modifications of RNA. Based on the expression of 23 different modes of m6A regulatory factors, we identified three different m6A modification patterns in bladder cancer. The effects of the three different modes of m6A modification on clinicopathological characteristics, immune cell infiltration levels and expression levels of immune checkpoint genes were comprehensively analyzed. In addition, the effects of different modes of m6A modification on the therapeutic efficacy of anti-PD-L1 immunotherapy (atezolizumab) are also discussed. Our results confirm that m6A methylation plays an important role in immune cell recruitment in the tumor microenvironment of bladder cancer, which influences the efficacy of anti-PD-L1 therapy for bladder cancer. We further confirmed the important role of FTO protein in the biological function of bladder cancer cells by performing in vitro experiments. FTO functions as an oncogene in bladder cancer cells, and upon FTO knockdown, the level of m6A enzyme activity in bladder cancer cells was significantly increased, apoptosis was increased, and cell proliferation and cell invasion were reduced. In addition, our study also confirmed that K216H and K216E are probably important targets for regulating FTO. We provide new insights into the regulatory pathways of the immune microenvironment and the methylation function of m6A in bladder cancer, which will help in designing novel diagnostic methods, prognostic tools, and therapeutic targets.
Bladder cancer is the most common cancer of the urinary system and is characterized by a difficult early diagnosis, rapid metastasis, and resistance to treatment. Immune checkpoint therapy (ICT) targets immune pathway effectors such as cytotoxic lymphocyte antigen-4 (CTLA-4), programmed cell death protein 1 (PD-1), or programmed death-ligand 1 (PD-L1) (1). Anti PD-L1 immunotherapy has been approved by the Food and Drug Administration (FDA) for the treatment of metastatic bladder cancer (2, 3). Immunotherapeutics that target PD-1 or PD-L1 have significantly improved the survival outcomes for some patients, showing an astonishing effect in a small number of patients with sustained efficacy. The improved clinical efficacy for the detection of cancer of the urinary system including advanced-stage bladder cancer has changed the intervention measures used (4); however, some patients with bladder cancer undergoing immunotherapy show no response to ICT or display resistance to drugs, and this scenario does not meet the clinical needs of these patients (5, 6). At present, multiple studies have confirmed that the immune response resulting due to many tumors, including those found in bladder cancer, is related to the level of immune cell infiltration in the tumor microenvironment, the expression of PD-1/PD-L1, and the tumor mutation burden (TMB) (7, 8).
The microenvironment in which tumor cells grow and survive is called the tumor microenvironment (TME), which includes stromal cells such as cancer-related fibroblasts and macrophages, immune infiltrating cells (myeloid cells and lymphocytes), bone marrow-derived cells (BMDCs) such as endothelial progenitor cells and hematopoietic progenitor cells, and secretory factors such as cytokines (9). There is mounting evidence that TME plays a crucial role in tumor progression, immune escape, and has an impact on the response to immunotherapy (10, 11). A comprehensive analysis of the heterogeneity and complexity of the TME is a key step in improving the success rate of existing ICTs and the development of new immunotherapy strategies. Further exploration of the regulatory mechanisms underlying TME cell infiltration will improve the ability to guide and predict the response to immunotherapy, and may help identify new therapeutic targets.
N6-methyladenosine (m6A) is the most common and abundant RNA modification in eukaryotes. As a reversible epigenetic modification, m6A is found in almost all types of RNAs, including mRNAs, ribosomal RNAs (rRNAs), long noncoding RNAs (lncRNAs), microRNAs (miRNAs), small nuclear RNAs (snRNAs), and circular RNAs (circRNAs), and are dynamically regulated in many physiological processes (12, 13). The m6A modification is a dynamic and reversible process in mammalian cells and is regulated by various methyltransferases, demethylases, and binding proteins, also known as writers, erasers, and readers, respectively. The process of m6A methylation is catalyzed by methyltransferases such as RBM15, ZC3H13, METTL3, METTL14, WTAP, and KIAA1429, and the removal process is mediated by demethylases such as FTO and ALKBH5 (14). Further, a group of specific RNA binding proteins, such as YTHDF1/2/3, YTHDC1/2, HNRNPA2B1, and IGF2BP1/2/3 can recognize the m6A motif, thus affecting the function of m6A (15). Results from various studies have shown that the abnormal expression and changes to gene expression for m6A regulatory factors are related to the dysregulation of multiple biological processes essential for the initiation, progression, metastasis, drug resistance, recurrence, and immune regulation of cancer (16).
Many studies have confirmed the special correlation between m6A modification and changes in the TME. Li et al. (17) observed that when METTL3 was depleted, the steady-state growth of T cells was blocked and was maintained at a slow rate. Further, their research showed that METTL3 deletion resulted in a decrease in the level of m6A, and an increase in the mRNA stability and protein levels of SOCS1, SOCS3, and CISH, thus negatively regulating the IL-7 signal production in CD4+T cells. Results from another study (18) revealed the role of m6A in dendritic cell activation, in which METTL3 mediated the m6A modification of the transcripts for the adaptor Tirap for CD40, CD80, and TLR4. Signal adaptors enhanced the translation of METTL3 in dendritic cells, thereby enhancing TLR4/NF-κB signal transduction, producing cytokines, and stimulating T cell activation. From the perspective of immune checkpoint therapy, the m6A binding protein YTHDF1 can be used to modulate antitumor immunity and improve immunotherapy, as it can regulate the expression of lysosomal proteinase in an m6A dependent manner. YTHDF1 can recognize the transcription of m6A modified transcripts and encodes a lysosomal protease to increase translation in dendritic cells. Moreover, the deletion of YTHDF1 enhances the cross-presentation of tumor antigens and the cross initiation of CD8+T cells in vivo. Further, Wang et al. confirmed that the deletion of YTHDF1 enhances the therapeutic effect of the PD-L1 checkpoint blockade (19).In melanoma, elevated FTO expression levels promote tumor growth by reducing the methylatin of m6A in the mRNA for PD-1 (PDCD1), CXCR4, and SOX10 and preventing their RNA decay mediated by YTHDF2. Knockout of FTO in melanoma cells induces tumor cells to become sensitive to interferon-gamma (IFNγ) in vitro and promotes a sensitizing response of melanoma cells to anti-PD-1 antibody in mice (20). Together, these data prove that the m6A modification plays an important role in regulating the tumor immune microenvironment, and the combined use of m6A modulators and PD-1/PD-L1 drugs may prove to be a new strategy to enhance the clinical efficacy of tumor immunotherapy.
In this study, we examined the effect of the m6A methylation modification on the invasion characteristics of immune microenvironment cells and the effect of anti-PD-L1 therapy on bladder cancer. Our study helps elucidate the molecular mechanism underlying the regulation of the immune microenvironment in bladder cancer and provides new predictors, potential auxiliary targets, and directions for more effective immunotherapy strategies for combating bladder cancer.
The gene expression profile was measured experimentally using the Illumina HiSeq 2000 RNA Sequencing platform at the University of North Carolina The Cancer Genome Atlas (TCGA) genome characterization center. Level 3 data were downloaded from the TCGA data coordination center. This dataset shows the gene-level transcription estimates, i.e., the log2 (x+1) transformed RSEM normalized counts, and somatic mutation data was downloaded from the site https://portal.gdc.cancer.gov/. IMvigor 210 cohort is a multicenter, single-arm phase II clinical study for evaluating the safety and efficacy of Tecentriq, a PD-L1 inhibitor, in patients with advanced urothelial carcinoma (21, 22). The complete processed expression data, detailed clinical annotations, and somatic mutation data were obtained from IMvigor210CoreBiologies, which is a complete documentation software and data package for the R statistical computing environment. The software package is available free of charge under the Creative Commons 3.0 License.
We identified 23 m6A regulators from published literature (23, 24), including 2 erasers (ALKBH5, FTO), 13 readers (FMR1, HNRNPA2B1, HNRNPC, IGF2BP1, IGF2BP2, IGF2BP3, YTHDC1, YTHDC2, YTHDF1, YTHDF2, YTHDF3, ELAVL1, LRPPRC), and 8 writers (KIAA1429, METTL14, METTL3, RBM15, RBM15B, WTAP, ZC3H13, CBLL1). The consensus clustering algorithm determined the optimal number of clusters (K value) as 3. Based on the expression of the 23 m6A modulators, different m6A modification patterns were identified by using k-means (based on Euclidean distance), and the patients were classified into three groups for further analysis. We used the consusclusterplus R package to perform the above steps, and performed 1000 iterations (50 iterations, resampling rate of 80%) to ensure the stability of the classification (25).
We used several published subtype classification systems for bladder cancer, including the Baylor subtype described by Mo et al. (26), who defined urothelial differentiation based on 18 gene markers, thus dividing the muscle-invasive bladder cancers (MIBC) and non-MIBCs (NMIBC) into basal and differentiated subgroups. Damrauer et al. (27) identified basal and luminal cancer subtypes by consensus cluster analysis and further identified 47 genes as predictors of these subtypes. The MDA subtype (28) was analyzed by using 2252 genes (2697 probes) from 73 freshly frozen primary MIBC samples, including p53 like, luminal, and basal cancer. The Lund group (29) presented a six-class system based on global mRNA expression, including the urothelial-like, genomically unstable, epithelial infiltrated, SCC-like/Mes-like, SCC-like/UroB, and Sc/NE-like cancer. TCGA genotyping (30) used 2707 genes to conduct unsupervised cluster analysis on 129 patients with MIBC. The patients were classified into four subtypes (I, II, III, and IV), using the Cartes d’Identitédes Tumeurs (CIT)-Curie subtypes (31). These classifiers were combined into an R package (BLCA subtyping) (32), which can be found at https://github.com/cit-BioInfo/BLCAsubtype. We applied these classifiers independently to the TCGA-BLCA cohort and the IMvigor210 cohort to analyze the relationship between the subtypes of different classification methods and three different m6A modification patterns. Further, we interpreted the differences among the three different m6A modified subtypes.
We used the single-sample gene set enrichment analysis (ssGSEA) algorithm to quantify the relative abundance of cell infiltration in TME. We obtained gene sets from the data of Qingzhu Jia et al. (33) to label the different types of TME infiltrating immune cell types. As demonstrated by Jia et al. (33), we calculated the antitumor-immunity-score as the sum of the immune cell scores of various antitumor cells. Further, the pro-tumor-immunity-score is the sum of the scores of tumor-promoting immune cells, and we define the tumor immunity score as the difference between the pro-tumor-immunity score and the antitumor-immunity-score for unified analysis. In addition, we also used the ESTIMATE algorithm (34) to estimate the ratio of the immune matrix components of each sample in the TME to further explore the differences of TME components including immune cells and stromal cells scores among different m6A modification patterns. The results were presented in three forms: immune score, stromal score, and the ESTIMATE score; the higher the score from the immune score or stromal score, the more immune or matrix components in TME. The ESTIMATE score is the sum of the immune score and stromal score, which represents the level of the two components in TME.
DEGs were identified via the Bayesian method between different m6A modification patterns using the limma R package (35), the absolute value of logFC > 1 as the significance criteria. We used the ssGSEA method to score the samples based on the 23 m6A regulatory factors. Based on the median value of the m6A score, the patients were classified into a high m6A score group or a low m6A score group. The difference between the two groups was analyzed by the empirical Bayes method using the limma R package, taking the corrected p-value < 0.05, and the absolute value of logFC > 1 as the significant criteria and 647 DEGs were obtained for subsequent signal pathway analysis.
The enrichment of signaling pathways for the DEGs expressed relative to the different phenotypes of m6A were analyzed using the metascape website (36) http://metascape.org. We determined the statistically rich terms, accumulated hypergeometric p values, and enrichment factors, and used these in a filtering step. Next, according to the Kappa statistical similarity between the gene members, the remaining important terms were clustered in a hierarchical structure, and the kappa score of 0.3 was used as a threshold to convert the terms to clusters (36). We selected the genes with the best p-value in each cluster as its representative term and displayed them in the heatmap. The databases for the KEGG pathway, GO biological processes, Reactor gene sets, Canonical pathways, and the CORE resources were used for pathway and process enrichment analysis applying a p-value < 0.01, a minimum count of 3, and an enrichment factor > 1.5 (the enrichment factor is the ratio between the observed count and the chance expected count). The GSEA analysis (37) evaluates the skewness of the two distributions for the selected gene set in the gene list sorted by a specific phenotype. The analysis gene set was obtained from the hallmark gene sets provided by the Molecular Signatures Database (https://www.gsea-msigdb.org/). In this study, we used the clusterProfiler R package to implement the GSEA analysis (38).
To quantify the m6A modification pattern in a single patient. Based on the mRNA expression level of the 23 identified m6A regulatory molecules in each sample, we constructed a scoring system called m6Ascore by single sample Gene Set Enrichment Analysis (ssGSEA, based on GSVA R package).
For copy number variation analysis, we used the GISTIC.2 to identify significantly amplified or missing parts of the genome. The burden of copy number loss or gain was calculated as the total number of genes with copy number changes at the focal and arm level.
We analyze a set of gene sets for storing genes related to certain biological processes, and further, to reveal the association between the m6A gene signature and some related biological pathways, including: (1) the immune-checkpoint; (2) antigen processing machinery; (3) CD8 T-effector signature; (4) epithelial-mesenchymal transition (EMT) markers including EMT1, EMT2, and EMT3; (5) the angiogenesis signature; (7) pan-fibroblast TGF-β response signature (Pan-F-TBRS); (8) WNT targets; (9) DNA damage repair; (10) mismatch repair; (11) Nucleotide excision repair; (12) DNA replication; (13) and antigen processing and presentation.
The differential gene expression of the core biological pathway genes between the different m6A phenotypes of the IMvigor210 cohort was displayed in the form of a heatmap, including: (A) FGFR3 gene signature; (B) CD8 Teff signature; (C) antigen-processing machinery; (D) immune checkpoint signature; (E) MKI67 and cell cycle genes; (F) DNA replication-dependent histones; (G) DNA damage-repair genes; (H) TGFβ receptor and ligand; (I) F-TBRS genes; (J) EMT markers; (K) angiogenesis signature.
The human bladder cancer cell lines were obtained from the Oncology Institute of Central South University. The cell lines were incubated at 37°C under a humidified atmosphere with 5% CO2 and cultured in DMEM (Invitrogen, CA), supplemented with 10% fetal bovine serum (FBS) (GIBCO, NY), 1 mmol/L glutamine, and 1% penicillin/streptomycin.
Cell proliferation was analyzed using a commercial CCK-8 assay kit (#C0038, Beyotime). We employed fluorescence-activated Cell Sorting (FACS) to assess apoptosis with the Annexin V-FITC/PI staining kit (Mbchem). According to the manufacturer, the transwell assay was used to measure cell invasion with the 6-well insert devices (8 μm pore size; Corning Life Sciences, Bedford, MA) and Biocoat Matrigel (BD Biosciences). We counted the cells from the middle and surrounding 5 fields of view and averaged the counts.
Western blotting was performed as described previously (39). Briefly, total protein was extracted with RIPA lysis buffer and estimated using the bicinchoninic acid (BCA) Protein Assay Reagent Kit. The proteins were separated using 10% SDS-PAGE and electrophoretically transferred on a polyvinylidene fluoride (PVDF) membrane. The membranes were blocked with 5% skimmed milk and incubated overnight at 4°C with primary antibodies targeting FTO (27226-1-AP) and β-actin (1:2000, Ptgcn, 66009-1-Ig) and anti‐GAPDH (Abcam, ab125247), followed by incubation with the appropriate secondary antibodies for one hour. Positive bands were visualized using an enhanced chemiluminescence system.
Total m6A content was measured in the aliquots of 200-ng of total RNA extracted from cells using an m6A RNA methylation quantification kit (cat. no. P-9005; Epigentek) according to the manufacturer’s instructions.
The non-paired t-test was used to compare the normally distributed variables between the two groups; the Mann-Whitney U test (also known as the Wilcoxon rank-sum test) was used to estimate the statistical significance of the non-normal distribution variables. The Kruskal-Wallis test and a one-way ANOVA were used as nonparametric and parametric analysis methods (40). The correlation coefficient between TME infiltrating immune cells and the expression of m6A regulatory genes was calculated using the Pearson correlation method. We used the univariate Cox regression model to calculate the risk ratio (HR) for the m6A regulatory genes. The survminer R software package was used to determine the cut-off point for the correlation between the m6A scores and patient survival in each data set subgroup. The “surv-cut point” function of the maximum rank statistic was used to double score the m6A score by repeatedly testing all possible cut-off points, and further, the patients were classified into “high” and “low” subgroups, according to the maximum selected log-rank statistic, to reduce the batch effect in the calculations. The Kaplan-Meier method was used to plot the survival curve for prognosis analysis, and a log-rank test was used to determine the significance of the difference. The waterfall diagram of the maftools software package was used to show the mutations in the 23 m6A regulatory factors in the TCGA-BLCA cohort. The thermograms of the 23 mutations for the m6A regulatory factors were plotted. All statistical P-values were bilateral, and P < 0.05 was considered to be statistically significant.
In this study, we analyzed 23 m6A regulatory factors related to bladder cancer, including 2 erasers (ALKBH5, FTO), 13 readers (FMR1, HNRNPA2B1, HNRNPC, IGF2BP1, IGF2BP2, IGF2BP3, YTHDC1, YTHDC2, YTHDF1, YTHDF2, YTHDF3, ELAVL1, LRPPRC), and 8 writers (KIAA1429, METTL14, METTL3, RBM15, RBM15B, WTAP, ZC3H13, CBLL1). We first mapped the network for the 23 m6A regulatory factors in bladder cancer (Figure 1A), and examined the interactions and their significance for the prognosis of bladder cancer patients. We found that there were significant correlations between the expression of m6A regulatory factors in writers, erasers, and readers, and most of the correlations were positive (Supplementary Table 1). Based on these correlations, the 23 m6A regulatory factors were divided into four categories (Clusters A-D). Figure 1B summarizes the somatic mutation frequency of the 23 m6A regulators. In 116 out of 412 patient samples, a mutation in m6A regulators was observed, with a frequency of 28.16%. Most of the mutations were missense mutations, and the regulators KIAA1429, METTL3, and ZC3H13 had the highest mutation frequency (4%), while HNRNPC, YTHDF3, and FMR1 did not harbor any mutations. Subsequently, we found that FMR1 and YTHDF2, YTHDF1 and KIAA1429, YTHDF2 and KIAA1429, WTAP, and METTL3, ZC3H13 and LRPPRC, and ZC3H13 and YTHDC2 had significant symbiotic relationships (Figure 1C, P < 0.05). The differential expression analysis for the 23 m6A regulatory factors in bladder cancer and its adjacent tissues is shown in Figure 1D. The expression of ALKBH5, FTO, METTL14, WTAP, YTHDC1, YTHDF3, and ZC3H13 in adjacent cancer tissues was significantly higher than that in cancer tissues, while the expression of METTL3, YTHDF1, YTHDF2, ELAVL1, IGF2BP1, IGF2BP3, and HNRNPA2B1 in cancer tissues were significantly higher than those in non-cancerous tissues. However, due to the small sample size of the paracancerous tissues, this result needs further verification. A univariate Cox regression analysis was performed to study the effect of the 23 m6A regulatory factors on the overall survival (OS) of bladder cancer patients (Figure 1E). It was observed that six m6A regulatory factors had a significant effect on the prognosis for bladder cancer patients. YTHDC1 and WTAP may be protective factors (HR < 1, P < 0.05), while IGF2BP2, ALKBH5, IGF2BP3, and FTO are risk factors for bladder cancer (HR > 1, P < 0.05).
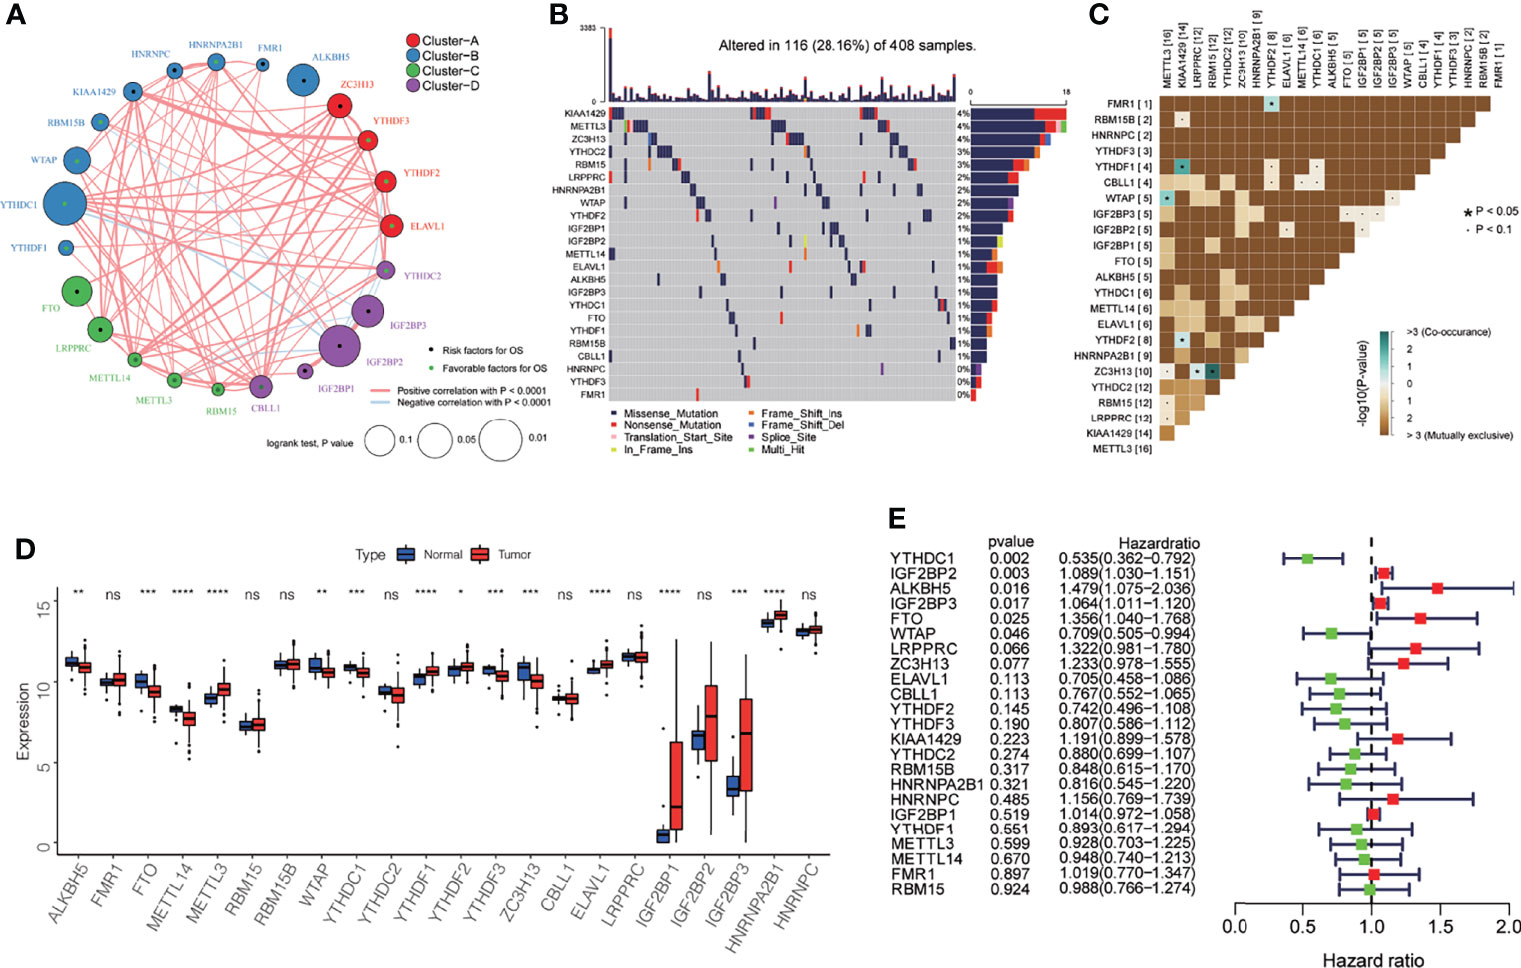
Figure 1 Genetic and expression characteristics of the 23 m6A regulatory genes in bladder cancer. (A) Depending on the correlation among the 23 m6A regulatory genes, these were divided into four groups: Cluster A, red; Cluster B, blue; Cluster C, green; Cluster D, purple. The dot in the middle of each circle represents the influence of the m6A regulator on OS, the favorable factors for OS are shown in green, and the risk factors are shown in black. The size of each circle represents the log-rank test p-value of the influence of the m6A regulator on OS (expressed as log10 value). The line connecting the two m6A regulatory factors represents the interaction between the factors; the red connection represents the positive correlation, and the light blue represents the negative correlation between the two factors. (B) Waterfall diagram showing 23 mutations of m6A regulator in bladder cancer. Each column represents the patient, each color represents the mutation type, and gray indicates that there is no mutation in the gene in the sample. The bar graph above shows the TMB, and the number on the right shows the mutation frequency of each regulator. (C) The mutation mode of 23 m6A regulatory factors; azure represents co-occurring mutations, brown represents mutually exclusive mutations, * P < 0.05, · P < 0.1. (D) The expression levels of 23 m6A regulatory factors in cancer and normal tissues. Tumor, red; normal, blue. The top and bottom of the box indicate the quartile range of the value, the lines in the box represent the median value, and the black dot represents the abnormal value. *P < 0.05; **P < 0.01; ***P < 0.001; ****P < 0.0001; ns P > 0.05. (E) The forest map shows the univariate Cox analysis results for the impact of 23 m6A regulatory factors on the OS of bladder cancer patients. Red represents risk factors, and the green represents protective factors.
Based on the gene expression of the 23 m6A regulatory factors, 407 patients with bladder cancer were classified using the R-package ConsensusClusterPlus. Our analysis showed that 3 clusters were optimal (Figures 2A, B and Supplementary Figure 1A–D) and the principal component analysis showed that all patients could be well classified into three subtypes (Figure 2C), and we identified three different m6A modification patterns in 407 patients with bladder cancer, which we named Cluster 1-3. We plotted a heatmap (Figure 2D) and boxplot (Figure 3A) for the expression of the 23 m6A regulatory factors in Cluster 1-3 and found that the expression of IGF2 BP1, IGF2BP2, IGF2BP3, KIAA1429, and RBM15 in Cluster 2 was lower than in the other clusters (P < 0.01), while the expression of METTL3, RBM15B, YTHDC1, YTHDC2, YTHDF1, YTHDF2, YTHDF3, and ELAVL1 was higher in Cluster 2 than the other clusters. Significantly higher overall survival was observed in the patients who had m6A modifications from cluster 2 (Figure 3B). To better understand the potential differences between the three m6A modification patterns, we compared them with the published molecular typing of bladder cancers, including Baylor, MDA, CIT-Curie, and UNC (Figure 3C). Using the CIT classification, Cluster 1 and Cluster 3 showed more of MC7 subtypes; whereas, more MC1 subtypes were seen in Cluster 2; Using the Baylor classification, Cluster 1 and Cluster 3 had more basal subtypes, and Cluster 2 contained more differentiated subtypes; based on the UNC classification, the basal subtype was more frequent in Cluster 1 and Cluster 3 than the luminal subtype, while Cluster 2 showed the opposite result. To further characterize the molecular differences between the RNA based subtypes, we analyzed the expression of 23 regulatory genes associated with bladder cancer (41–47), including the steroid hormone receptors ESR1/2, AR, and PGR, the nuclear receptors PPARG, three RARs (A/B/G), and three RXRs (A/B/G), the receptor tyrosine kinases ERBB2/3 and FGFR1/3, and the transcription factors FOXA1, FOXM1, GATA3/6, HIF1A, KLF4, STAT3, and TP63, We found significant differences in the expression of most regulators between Cluster 2 and the other two m6A subtypes. The expression of RARG, FGFR3, RXR3, FOXA1, ERBB3, AR, ERBB2, PPARG, GATA3, ESER2, and RXRB in Cluster 2 was significantly higher than that in Cluster 1 and Cluster 3, while the opposite relation was found for STAT3, FOXM1, EGFR, HIF1A, GATA6, FGFR1, and RARB (Figure 3D). Further, we identified differences in the mutation of 20 genes in the three m6A modification patterns as shown in the waterfall diagram (Supplementary Figure 1E). and we analyzed the difference in Copy number alterations across three m6A modification patterns. (Supplementary Figures 2, 3).
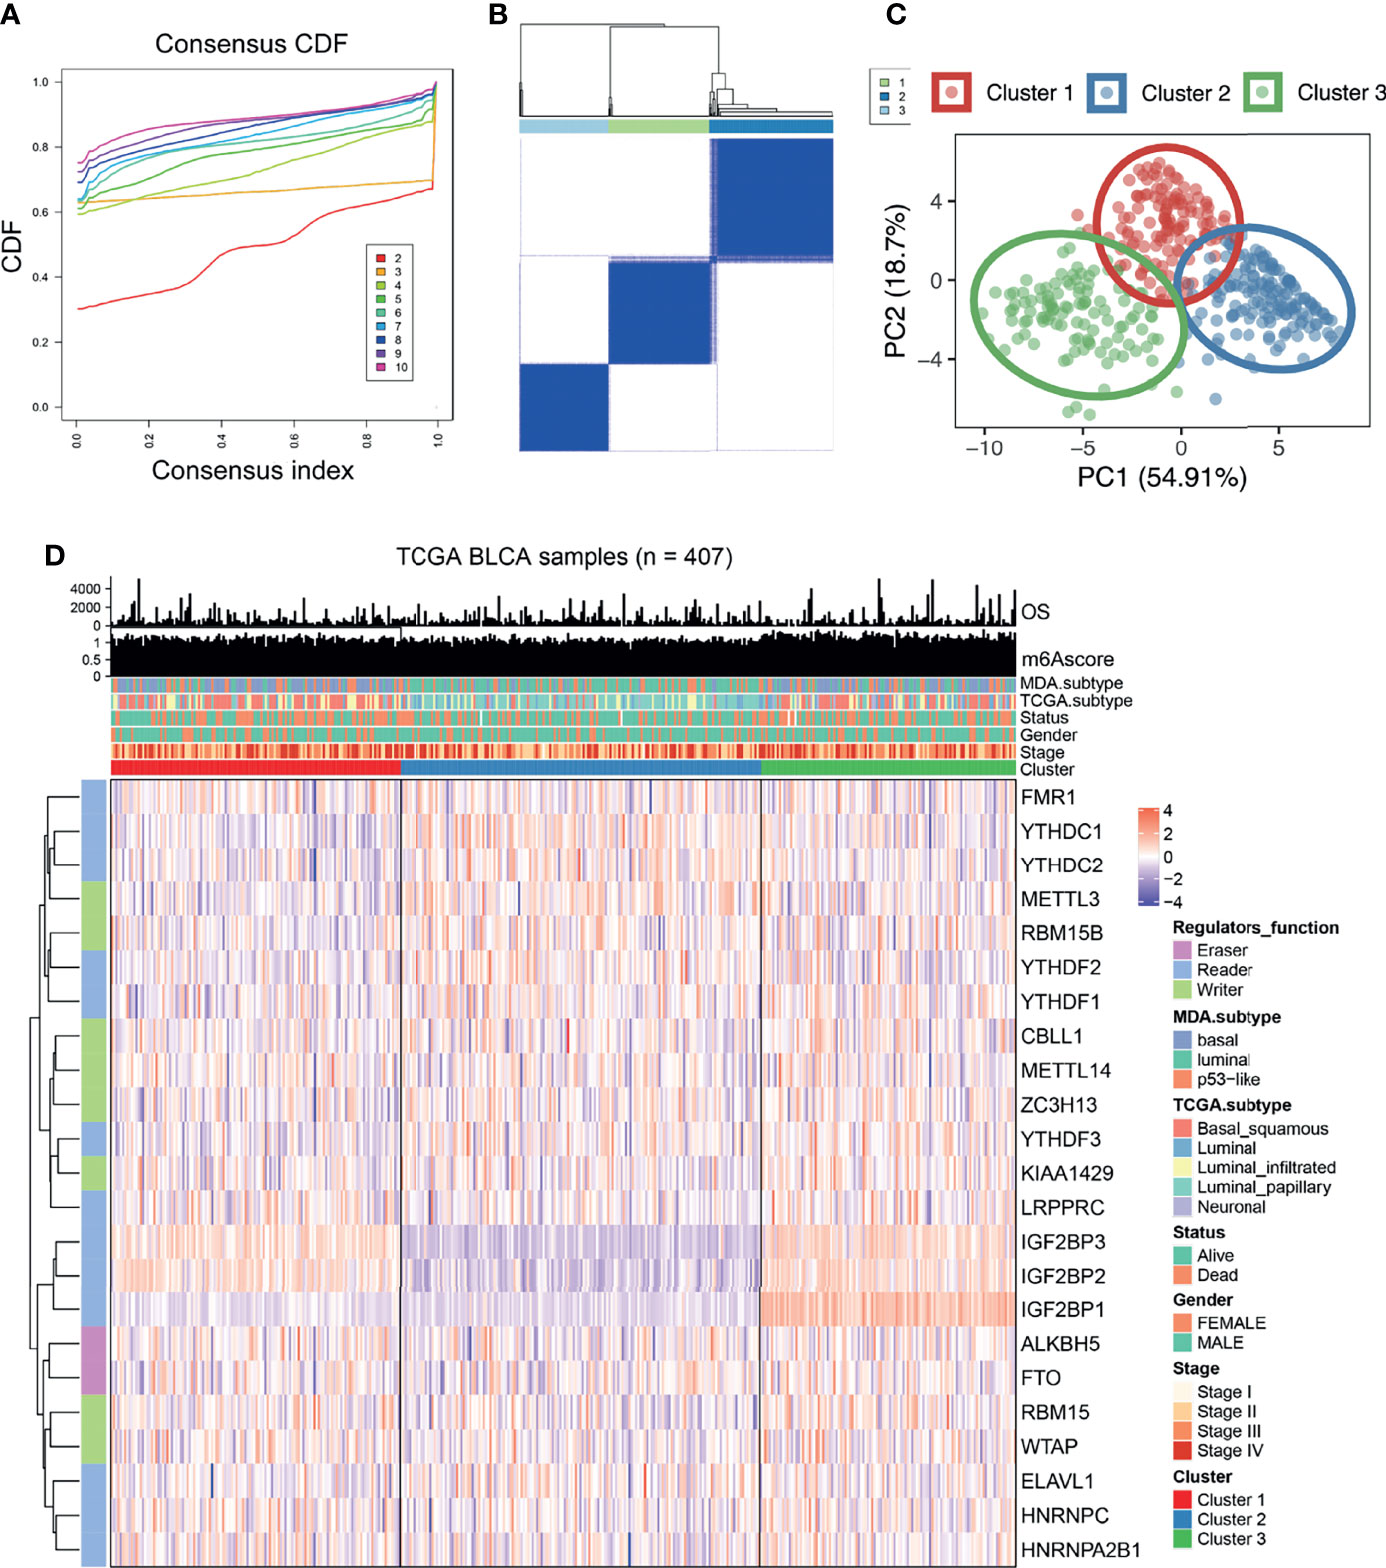
Figure 2 The expression of 23 kinds of m6A regulatory factors identified three different methylation patterns. (A, B) According to the expression of 23 m6A regulatory factors, we classified 407 bladder cancer patients, and 3 was the optimal cluster number. (C) Principal component analysis showed that that all patients could be well classified into three subtypes. (D) Heatmap display showing the expression of 23 m6A regulatory factors among three different m6A modification patterns. The relationship between different m6A modification patterns and clinical features such as OS, m6Ascore, MDA typing, TCGA typing, status, gender, stage, etc.
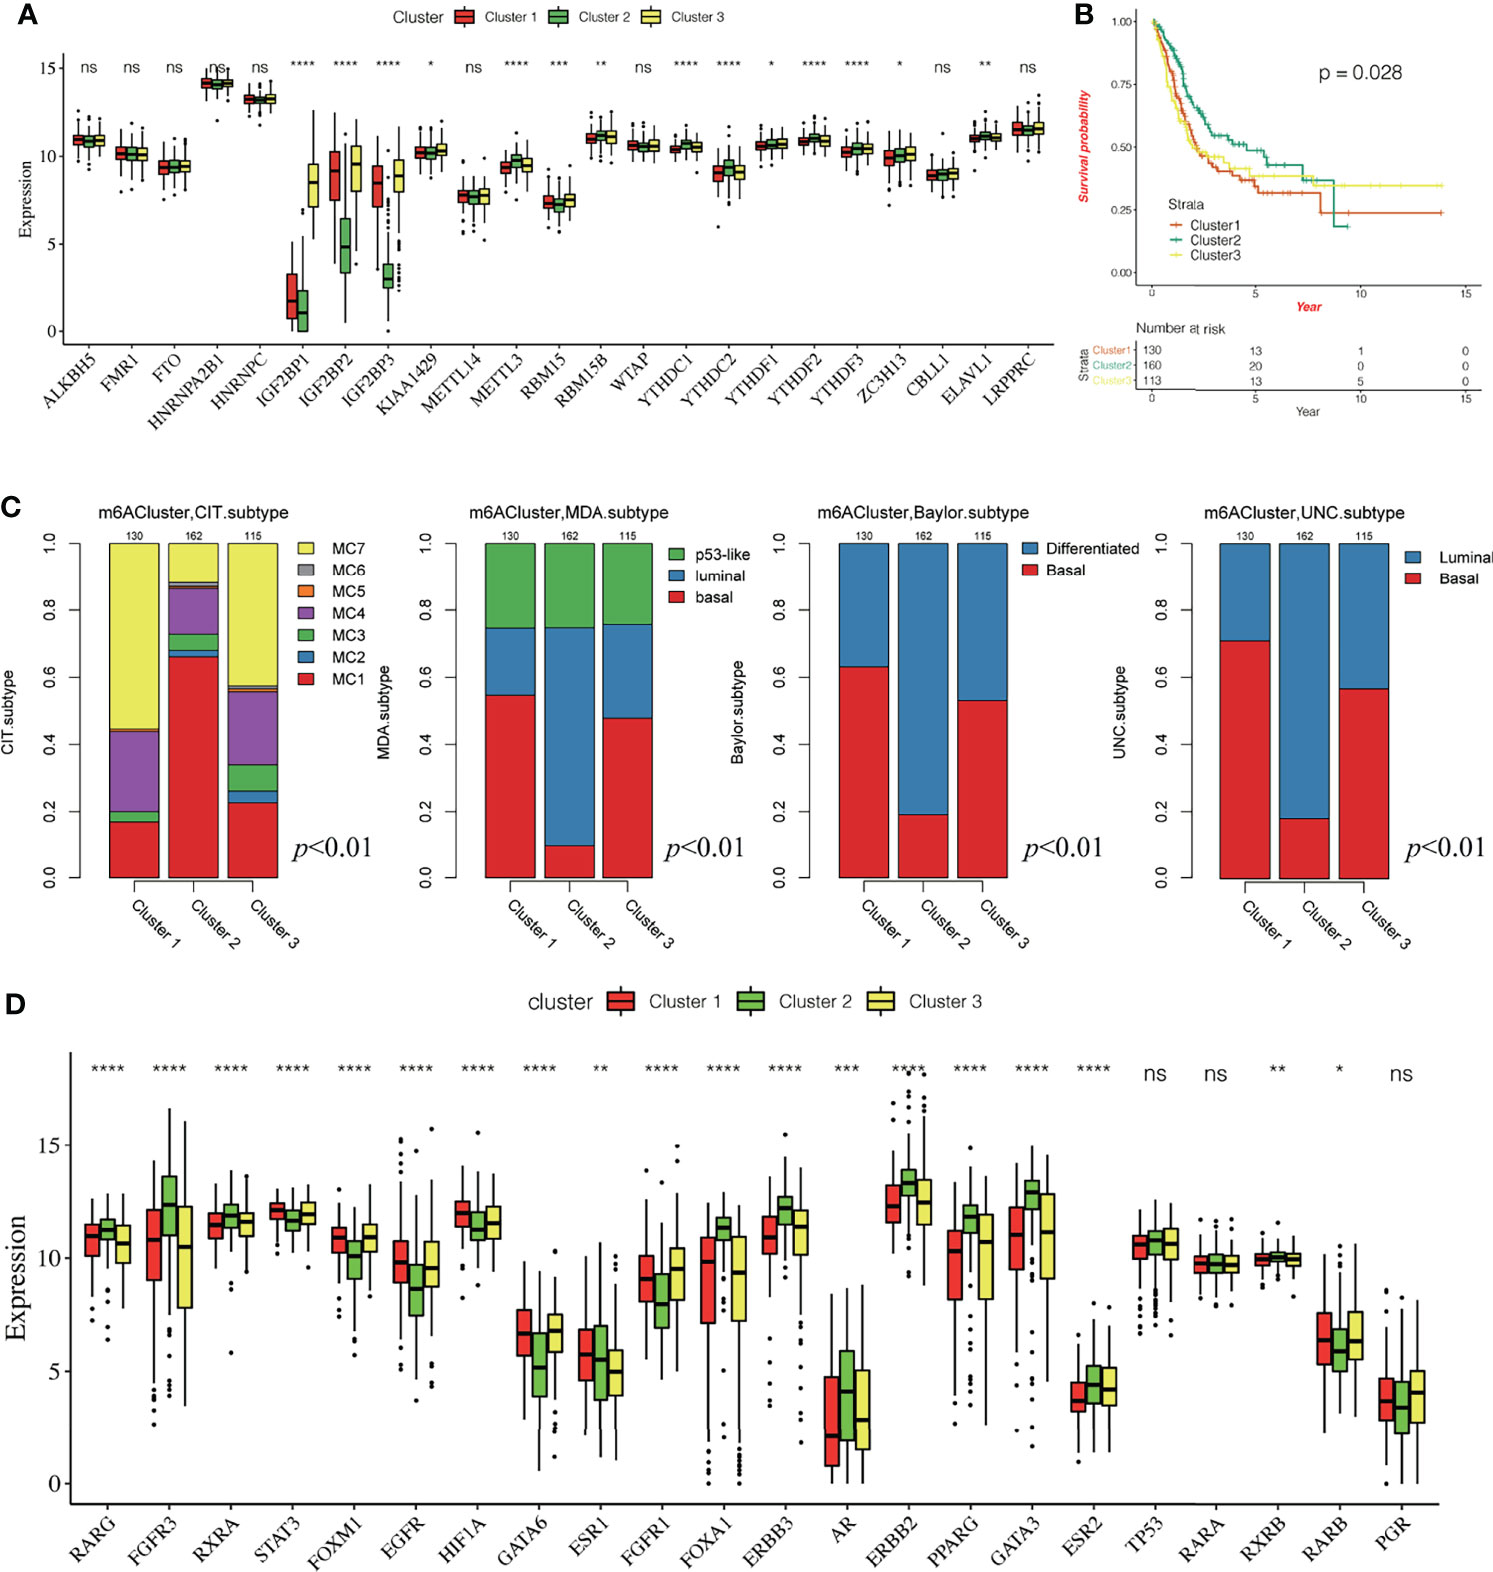
Figure 3 Characteristics of three different methylation patterns of m6A. (A) The expression of 23 m6A regulatory factors varied among the three different m6A modification patterns. The upper and lower end of the box indicates the quartile range of the value, the lines in the box represents the median value, the black dot represents the abnormal value, and the asterisk represents the statistical p-value, *P < 0.05; **P < 0.01; **P < 0.001, ***P < 0.0001, ****P < 0.0001. (B) The KM curve shows the difference in the effects of the three m6A modification patterns on OS. (C) Comparative analysis of three different m6A modification patterns and molecular typing of bladder cancer, including Bayol classification, MDA typing, CIT Curie typing, and UNC typing. (D) The upper and lower ends of the box represent the quartile range of values, the lines in the box represent the median value, and the black dots represent the abnormal values. The asterisk represents the statistical p-value, *P < 0.05; **P < 0.01; *P < 0.001, ***P < 0.0001, ****P < 0.0001, ns P > 0.05.
To reveal the role of m6A modification patterns in TME immunoregulation, we calculated the abundance of 28 cellular subsets in each patient sample. The heatmap shows the average difference in the infiltration level of 28 types of immune cells in the three different m6A modification patterns (Figure 4A, Supplementary Tables 2, 3), We found significant differences in the characteristics of cellular infiltration in the TME; Cluster 2 is characterized by immunosuppression, and most of the infiltrating cells are immune cells. The infiltration level was significantly lower than that of cluster1 and cluster3 (Supplementary Figure 4A). In addition, the anti-tumor immunity score and the pro-tumor immunity score of Cluster 2 were significantly lower than that of Cluster 1 and Cluster 3 (Supplementary Figures 4B, C), and the pro-tumor score of Cluster 2 is significantly higher than in Cluster 1 and Cluster 3 (Figure 4B). The ESTIMATE algorithm can estimate the ratio of the immune and matrix components of each sample in the TME, which is presented in the form of three scores: the immune score, stromal score, and the ESTIMATE score. We found that the three scores in Cluster 2 were significantly lower than those in Cluster 1 and Cluster 3 (Figure 4C), suggesting that m6A methylation may be involved in regulating the type of TME infiltrating cells and play a central role in immune regulation. However, the mechanism for how m6A modification affects the immunophenotype is unclear. Therefore, we analyzed the correlation between the 23 m6A regulatory factors and the 28 types of immune cells (Figure 4D). A heatmap of the correlation showed that the m6A regulators were highly correlated with most of the immune cells, and WTAP, IGF2BP2, and IGF2BP3 showed the most significant correlation with most immune cells. Further, YTHDF2, YTHDC1, METTL3, and ELAVL1 showed a high negative correlation with most immune cells, indicating that these regulators may play an important role in the differentiation and recruitment of immune cells. To further explore the possible role of m6A related phenotypes in immunotherapy, we studied the difference in the expression of the immune checkpoint related genes CD274, PDCD1LG2, CTLA4, LAG3, PDCD1, HAVCR2, TIGIT, and the CD8+T cell marker genes including CD8A, GZMB, CXCL9, CXCL10, PRF1, TBX21, and CD8B in the three different m6A modification patterns (Figure 4E, F). Our results showed that the expression of these genes in Cluster 2 was significantly lower than that in Cluster 1 and Cluster 3 (P < 0.0001). The results suggest that m6A methylation affects the type of TME infiltrating cells, and Cluster 2 had a significantly lower level of immune cell infiltration related to the immune checkpoint than the other two modification patterns. The gene expression in Cluster 2 is significantly low, and we speculated that the response to immunotherapy in patients showing Cluster 2 type m6A modifications may be worse than that of Cluster 1 and Cluster 3.
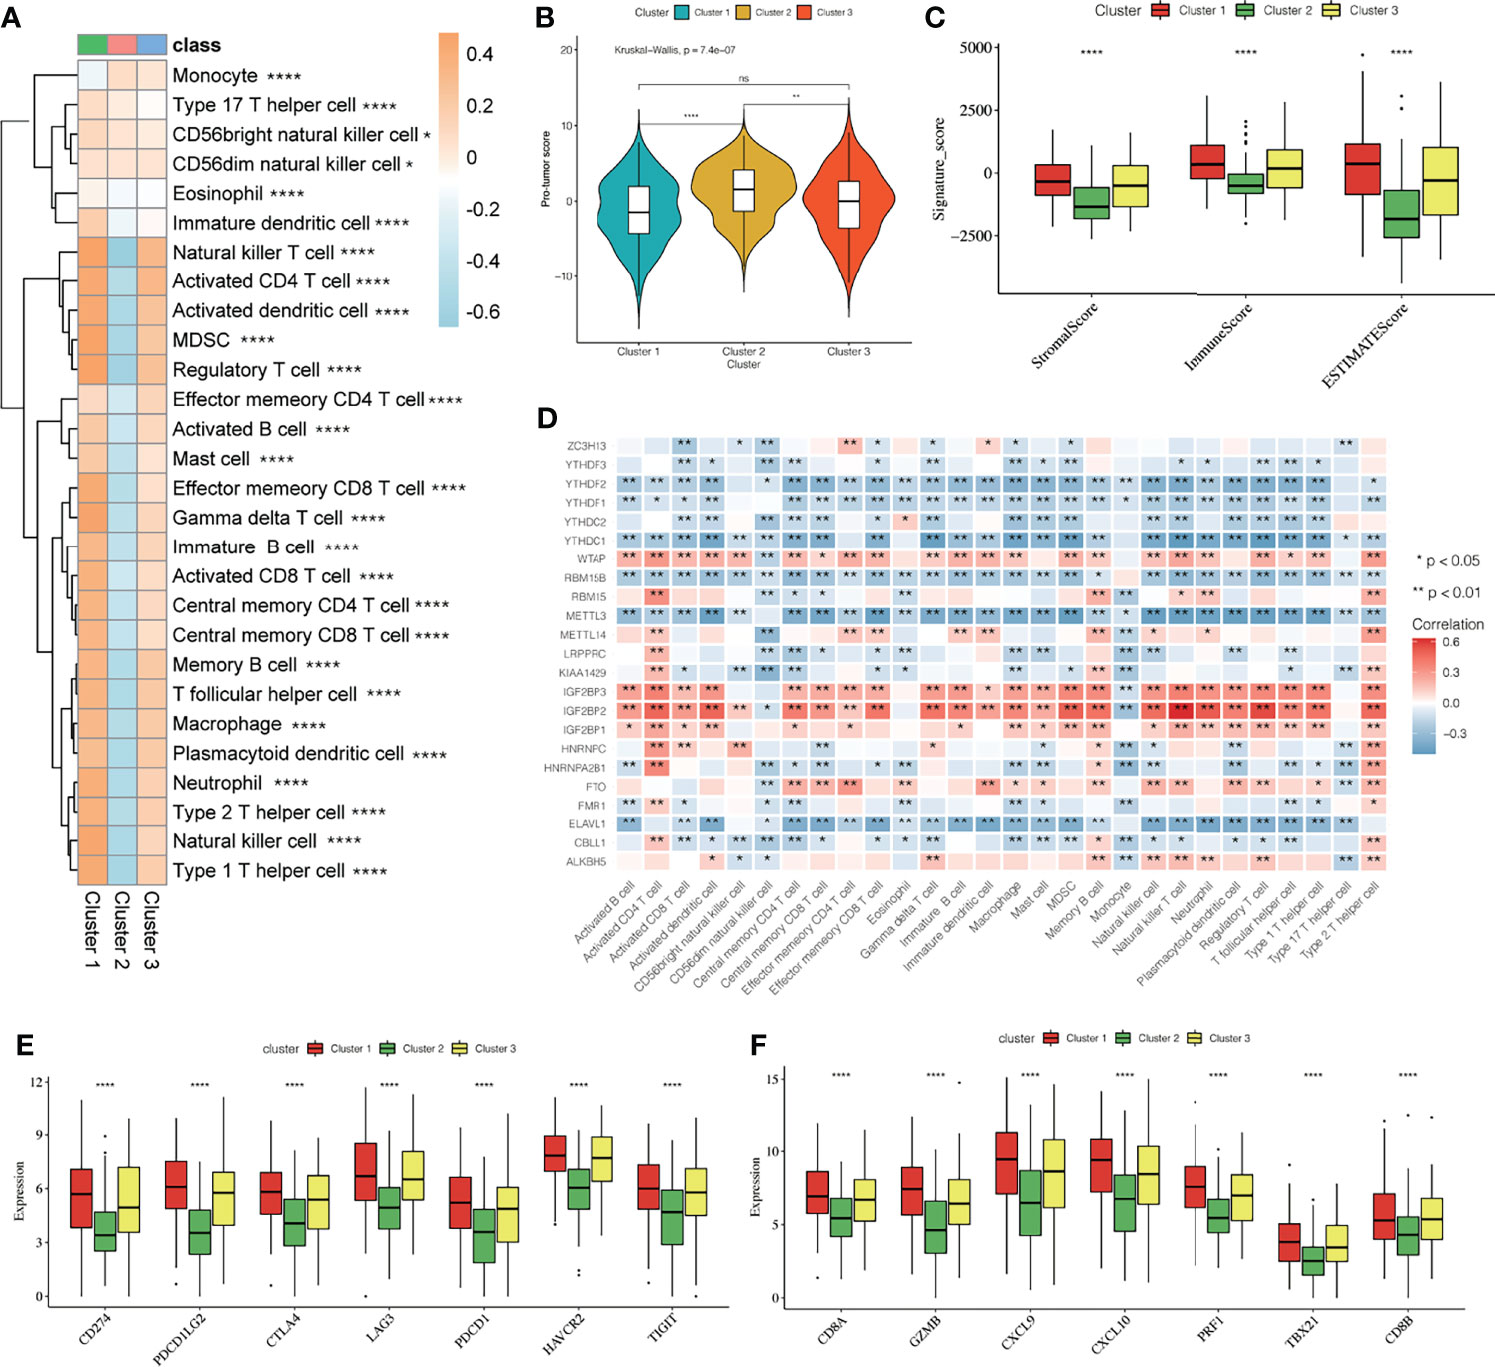
Figure 4 Effect of m6A modification on immune cell infiltration and immune checkpoint expression in the tumor immune microenvironment. (A) The thermogram shows the difference in the average level of 28 kinds of immune cell infiltration among three different m6A modification patterns, the asterisk represents the statistical p-value (*P < 0.05; **P < 0.01; ****P < 0.0001). (B) The violin box chart shows the difference in Pro-tumor score, the asterisk represents the statistical p-value (*P < 0.05; **P < 0.01; ****P < 0.0001, ns P > 0.05). (C) The ESTIMATE algorithm estimates the ratio of immune and matrix components of each sample in TME. The histogram shows the difference in immune score, stromal score, and the ESTIMATE score among the three different m6A modification patterns. The asterisk represents the statistical p-value (*P < 0.05; **P < 0.01; ****P < 0.0001). (D) Thermogram showing the 23 m6A regulatory factors that were correlated with 28 kinds of immune cells. The darker color indicates a higher correlation. The asterisk represents the statistical p-value (*P < 0.05, **P < 0.01). (E, F) The Box plot shows the immune checkpoint-related gene (E) and the CD8+T cell marker gene (F) among the three different m6A modification patterns.
To reveal the biological differences among the three different m6A modification patterns, we undertook expression profiling of the patient tissue samples and identified 403 DEGs (Figure 5A). The Circos diagram shows the overlap of the DEGs obtained by pairwise comparison of the three different m6A modification patterns. Cluster 2 had more DEGs than did Cluster 1, and there are more common genes in the list of DEGs obtained for Cluster 1 than that obtained for Cluster 2, and between Cluster 3 and Cluster 2 (Figure 5B). In Figure 5B, the blue lines connect genes belonging to the same ontology term showing the number of functional overlaps between different groups.
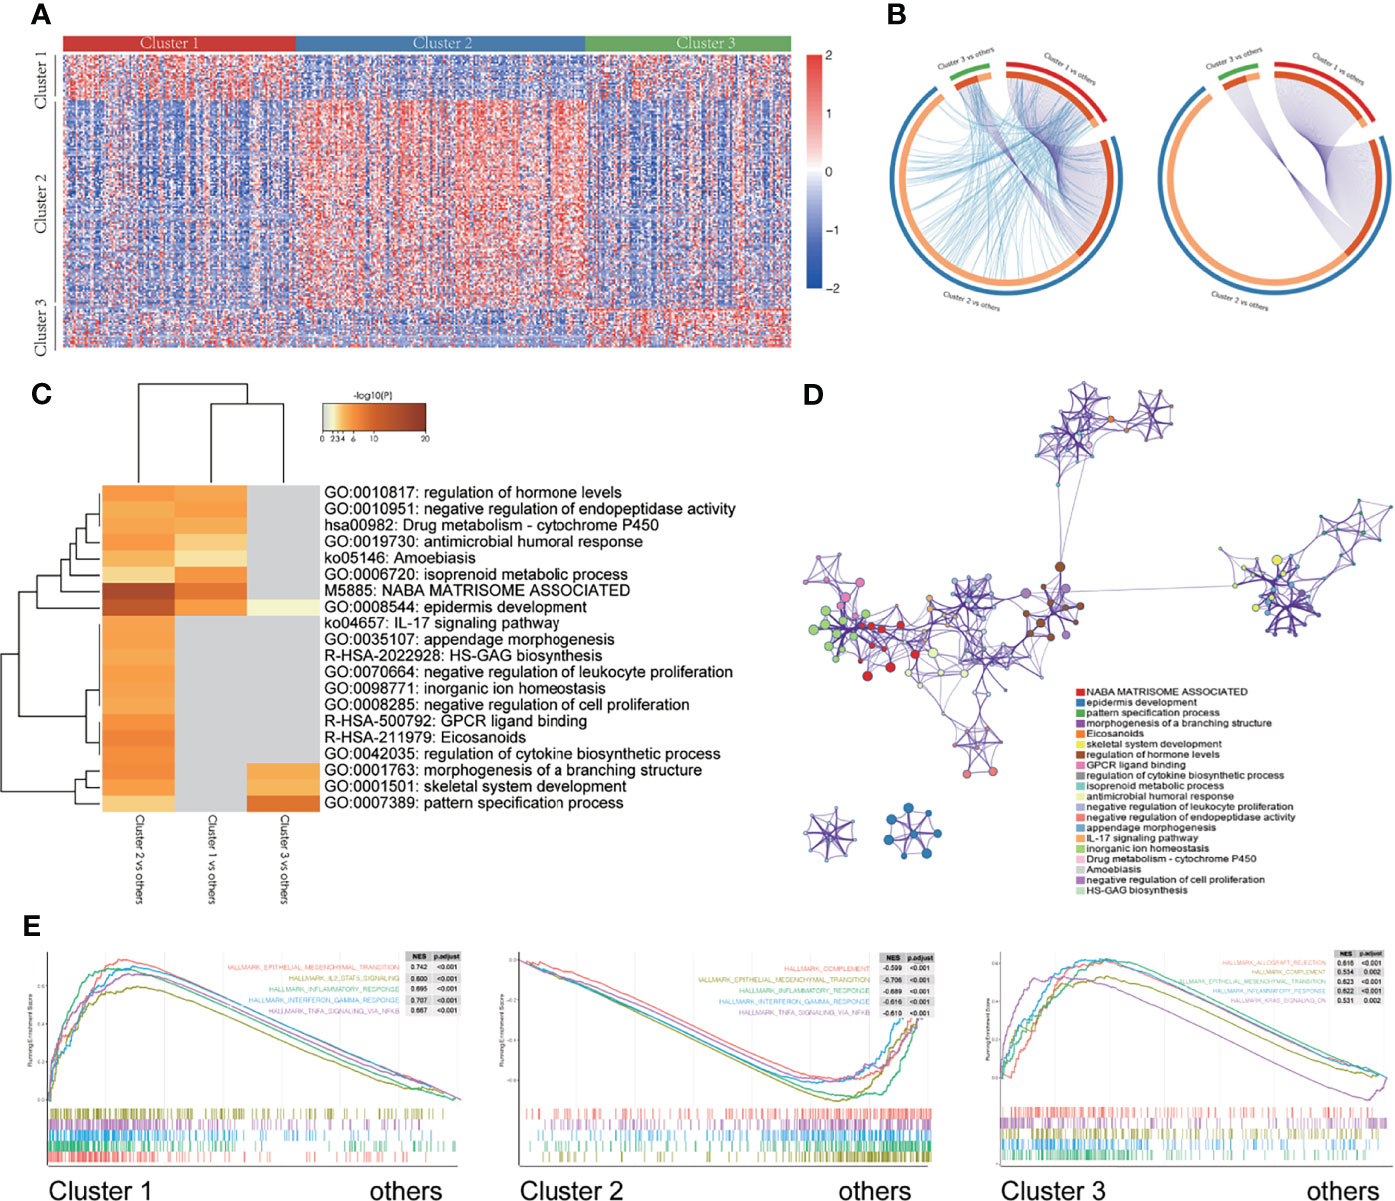
Figure 5 Enrichment of different gene signaling pathways in different m6A modification patterns. (A) Heatmap showing the expression of different genes in three different m6A modification patterns. (B) Circos diagram showing the overlap of differentially expressed genes by pairwise comparison of three different m6A modification patterns. Each arc in the outer circle represents the comparison group, and each arc in the inner circle represents a gene list. Each gene has a point on the arc. Dark orange represents the genes that appear in multiple lists, and light orange represents the only gene in the list. The purple line indicates the overlap between genes. The more purple links and the longer the dark orange arc, the higher the overlap between input gene lists, where they fall into the same ontology term (the term has to be statistically significantly enriched and with a size no larger than 100). (C) The thermogram shows the enrichment of gene signaling pathways with different m6A modification patterns. The heat map cells are colored by their p-values, and the white cells indicate that the term lacks enrichment in the corresponding gene list. (D) Selected representative signal paths shown in a network layout. Each signal path is represented by a circular node, whose size is directly proportional to the number of input genes in the term. The color represents the cluster identity, i.e., nodes with the same color belong to the same cluster. Terms with similarity score > 0.3 are linked by edges (the thickness of the edge represents the similarity score). The network was visualized using Cytoscape (v3.1.2). (E) GSEA of the marker gene set downloaded from the MSigDB database. All transcripts were sequenced according to the multiple variations (log2) obtained using the different analyses among three different m6A modification patterns. GSEA analysis evaluated the skewness of the two distributions of the selected gene set in the sequenced gene list.
We used Metascape (36) to analyze the enrichment of signaling pathways between the different m6A modification classes. The results are shown in the heatmap which is colored by p-values, and the white cells indicate a lack of enrichment of the term in the corresponding gene list (Figures 5C, D, and Supplementary Figures 5A, B). Additionally, a GSEA was performed for further signaling pathway enrichment analysis (Figure 5E), IL2/STAT5 signaling, EMT, inflammatory response, interferon-gamma response, and TNFα signaling via NFκB were enriched in Cluster 1. Allograft rejection, complement, EMT transition, inflammatory response, kras signaling are enriched in Cluster 3. These signaling pathways involve different core biological processes, most of which are related to the regulation of immunity, and some of them have been confirmed to have a correlation in immunotherapy (48–50), which provides a basis for further exploration of the effect of m6A modifications on the immunophenotype.
We constructed and evaluated a scoring system called the m6Ascore to quantify the level of m6A modification in each patient sample by ssGSEA, taking into account the individual differences and complexity of the m6A modification. First, we conducted a survival analysis using the m6Ascore and found that patients with high m6Ascore had a poor prognosis (p = 0.036, Figure 6A). There were also significant differences in the m6Ascore among the three different m6A modification patterns, with the lowest and highest m6Ascores being assigned to Cluster 3 and Cluster 2, respectively (Figure 6B). Next, we analyzed the differences in m6Ascore in the MDA cancer subtype and found the highest score for the basal subtype, followed by the luminal subtype, with the lowest expression level observed in the p53-like subtype (Figure 6C). To explore the potential biological relevance of m6Ascore, we classified 407 patients into a high m6Ascore group and a low m6Ascore group based on the expression level of the 23 m6A regulators. We first examined the difference in the composition of immune cells between the two patient groups (Figure 6D). Our results showed that CD56dim natural killer cells, central memory CD4T cells, eosinophils, mast cells, monocytes, and type 17 T helper cells showed a significantly low enrichment in the high m6Ascore group. Further, the activated CD4+ T cells, memory B cells, natural killer T cells, neutrophils, and type 2 T helper cells showed highly significant enrichment in the low m6Ascore group. We analyzed the DEGs, and additionally examined the signaling pathways showing enrichment via GO and KEGG pathway analysis between the two groups. The pathways showing enrichment for molecular function (MF), cellular component (CC), and biological process (BP) via GO analysis were examined. Signaling pathways enriched for BP include the xenobiotic metabolic process, hormone metabolic process, epidermis development, etc.; pathways enriched for CC included the apical part of the cell, apical plasma membrane, cornified envelope, etc.; and pathways enriched for MF include monooxygenase activity, serine-type endopeptidase activity, and other signaling pathways (Supplementary Figures 5C–E). A KEGG pathway analysis showed that the DEGs were mainly enriched in glutathione metabolism, ether lipid metabolism, and other signaling pathways (Supplementary Figure 5F). A GSEA analysis (Figures 6E, F) showed that pathways for the inflammatory response, interferon-gamma response, myc targets V1, TNFα signaling via NFκB, and other genes were concentrated in the high m6Ascore group. These results strongly suggest a significant correlation between a high m6Ascore and immune activation. The results also demonstrate the central role of m6A methylation in different biological processes in bladder cancer, including different aspects of immune regulation. The m6Ascore may be used to evaluate the characteristics of immune cell infiltration in bladder cancer tissue to predict the clinical response of patients to immunotherapy. Thus, the m6Ascore may have the potential to be used as an independent prognostic biomarker to predict the OS rate of patients, guiding more effective clinical practice.
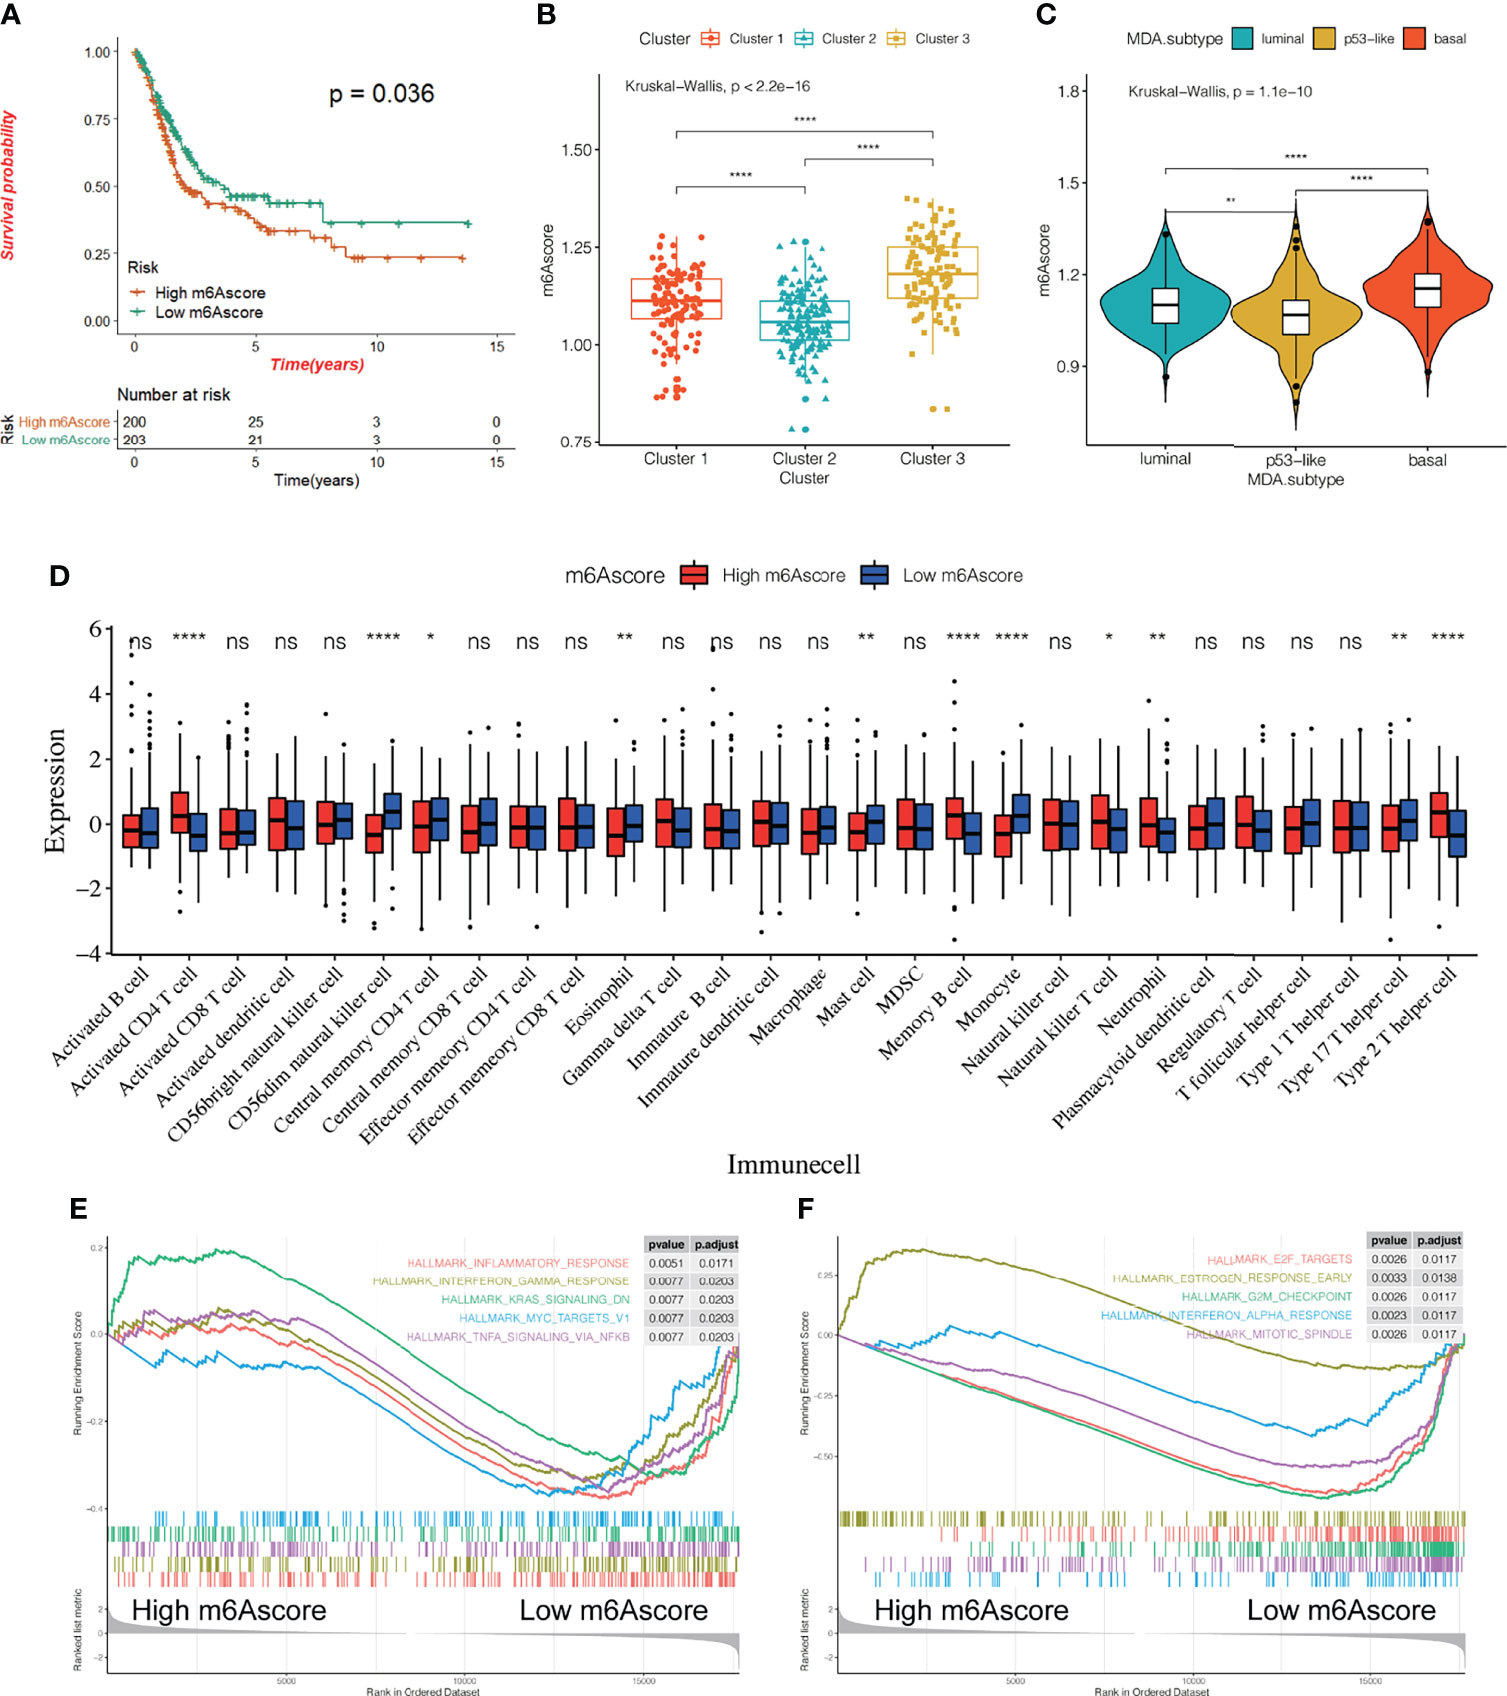
Figure 6 Relationship between m6Ascore and the characteristics of bladder cancer. (A) KM survival curve showing the effect of m6Ascore on OS in the TCGA-BLCA cohort. (B, C) The difference of m6A score among three different m6A modification patterns (B) and MDA typing (C). The asterisk represents the statistical p-value (*P < 0.05; **P < 0.01; ****P < 0.0001). (D) According to the expression of the m6Ascore,407 patients were classified into a high m6Ascore group and a low m6Ascore group. The histogram shows the expression difference of 28 kinds of immune cells between the two groups. (E, F) All transcripts were sequenced according to the multiple variations (log2) obtained by the two groups in the analysis. GSEA analysis evaluated the skewness of the two distributions of the selected gene set in the sequenced gene list.
To explore the potential effect and mechanism of m6A methylation on immunotherapy for bladder cancer, we obtained data for the IMvigor210 cohort, which is an open-label, multicenter, single-arm phase II clinical study to evaluate the safety and efficacy of Tecentriq, an anti-PD-L1 agent, in patients with advanced urothelial cancer (Supplementary Table 4). Patients who responded in whole or in part were classified as responders and were compared with non-responders who showed the incidence of stable or progressive disease. We performed an unsupervised clustering using data for mRNA expression for the 23 m6A regulatory factors from all patients. We identified three different m6A modification patterns and calculate the m6Ascore for subsequent analysis. Additionally, we performed a combined heatmap-based analysis (Figure 7) to find the correlation between the different m6A methylation modes and the Lund and TCGA molecular typing for the anti-PD-L1 based immunotherapy. Further, for the three groups of m6A modification patterns, we also analyzed the differences in PD-L1 expression in immune cells (IC) and tumor cells (TC), patients’ response to anti-PDL1 efficacy, TMB, m6Ascore, and the important gene mutations prevalent in bladder cancer. We also analyzed the differences in the expression of genes in important biological pathways for bladder cancer (51), including the FGFR3 gene signature; CD8 Teff signature; antigen-processing machinery; immune checkpoint signature; MKI67 and cell cycle genes; DNA replication-dependent histones; DNA damage-repair genes; TGFβ receptor and ligand; F-TBRS genes; EMT markers; and the angiogenesis signature. In the comparison between the different m6A modification patterns and the TCGA and Lund classification using a heat map-based analysis, we found that most genes in Cluster 1 were classified as subtype I and the least as subtype IV. For the Lund classification, we observed that the UroA subtype had the highest proportion in Cluster 1, the Inf type has the highest proportion in Cluster 2, and the SCCL subtype was more enriched in Cluster 1. Additionally, we found that the Cluster 3 modification mode had higher levels of PD-L1 expression in immune cells and tumor cells, a higher proportion of CR/PR (Figure 7 and Figure 8A). These results suggest that m6A methylation may be involved in the response to anti-PDL1 therapy. Additionally, among the three different m6A methylation patterns in bladder cancer, there were differences in gene mutations (51) for TP53, RB1, FGFR3, CDKN2A, ERBB2, and PIK3CA. Patients had a greater number of FGFR3 and CDKN2A mutations in Cluster 1 than in Cluster 2 or Cluster 3, while the converse was true for TP53 mutations. There were significant differences among the three m6A modification patterns in most gene sets. The expression of the FGFR3 gene signature (FGFR3, TP63, WNT7B) in Cluster 1 was significantly higher than in the other two groups, while the CD8 Teff signature (CD8A, GZMA, GZMB, PRF1, CXCL9, CXCL10, TBX21),antigen-processing machinery (TAP1, TAP2, B2M, HLA-A, HLA-B, HLA-C), and the immune checkpoint signature (CD274, PDCD1LG2, CTLA4, PDCD1, LAG3, HAVCR2, and TIGIT) are less expressed in Cluster 1 than the other two modification patterns, and are highly expressed in the Cluster 3 subgroup. The CD8 Teff and the immune checkpoint signatures are often used to predict the efficacy of immunosuppression in patients with immune checkpoint suppression; a higher expression level is linked to better clinical outcomes (5, 52). Additionally, our results indicated that the expression of MKI67 and cell cycle genes; DNA replication-dependent histones; DNA-repair genes are significantly higher in Cluster 3; TGFβ receptor and ligand; F-TBRS genes; EMT markers; angiogenesis signature show significantly increased gene expression in Cluster 2. We have observed that there are more compact types and fewer read types in Cluster 1. Compared with Lund typing, there are more SCCL types in Cluster 1, more UroA types in Cluster 1, and more infs types in Cluster 2 (Figure 8A). We found differences in m6Ascore levels among the three m6A modification patterns, with the lowest m6Ascore level found in Cluster 2, while the m6Ascore of Cluster 3 and Cluster 1 were the same, with no significant difference (Figure 8B). Differences in the m6Ascore were also observed in immunophenotyping, with the excluded subtype having the highest m6Ascore, and no significant difference in m6Ascore found between the inflamed and desert subtypes (Figure 8C).
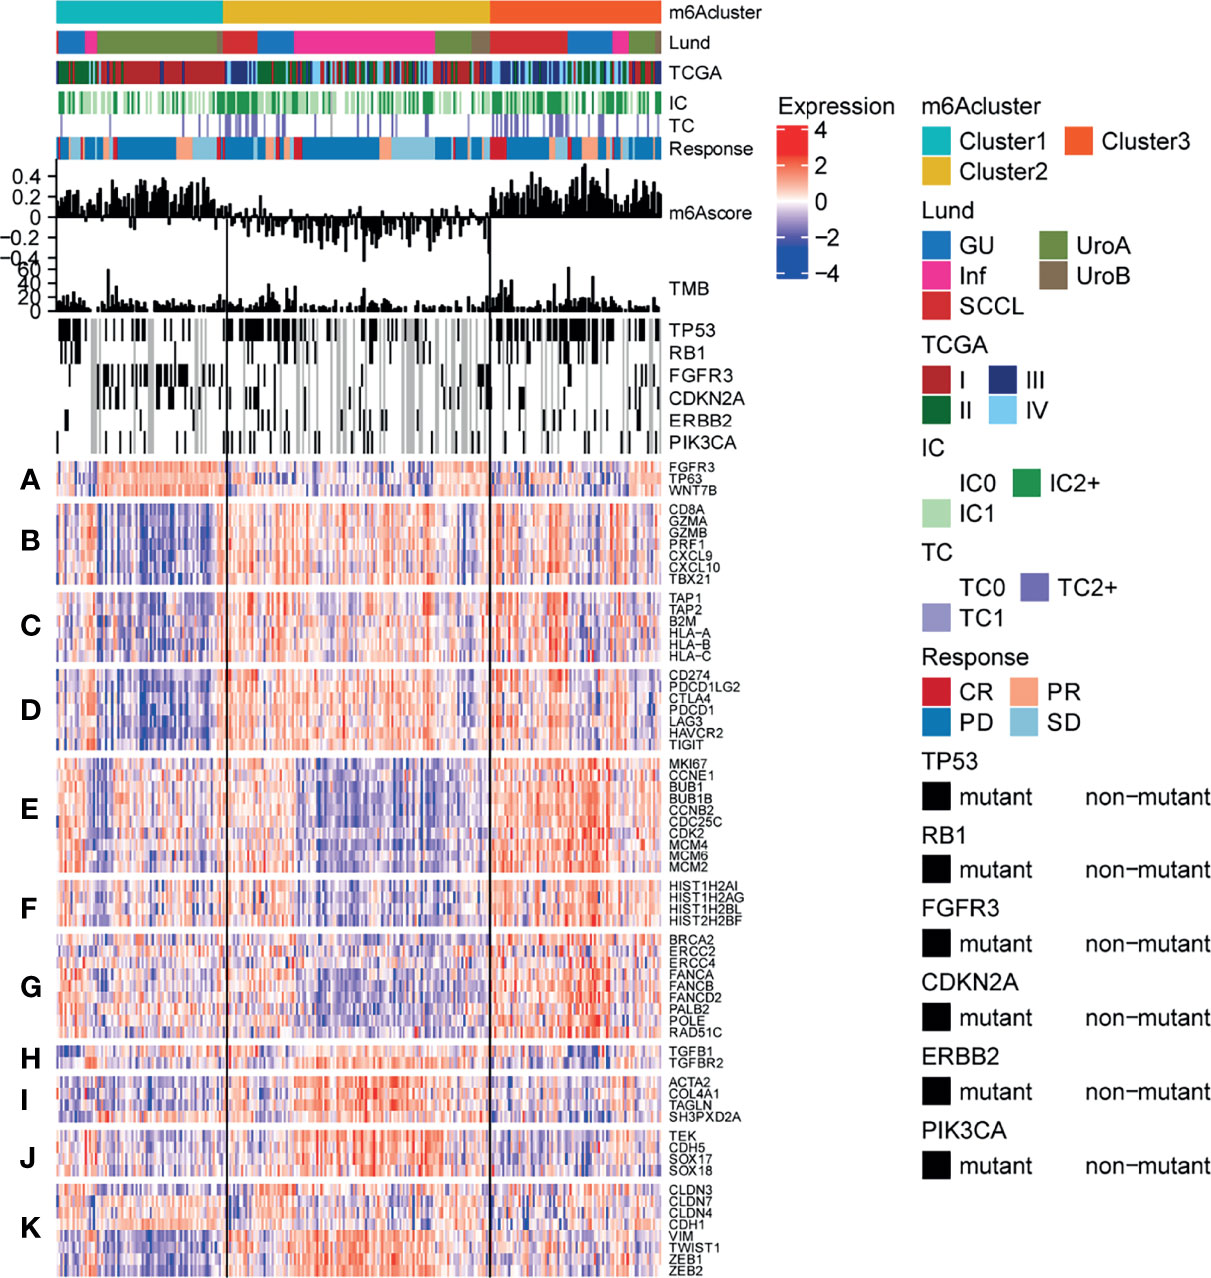
Figure 7 Characteristics of m6A modification in anti-PD-L1 immunotherapy cohort of bladder cancer. Heatmap representing all patients evaluated for anti-PD-L1 response, First, the sequence was based on the modified mode of m6A, next by the molecular subtype, PD-L1 expression on cells (IC), PD-L1 expression on cells (TC), and the reaction to atezolizumab. The m6Ascore and TMB levels of each patient are shown, and the mutation status of several genes of interest (black, mutation; gray, patients without mutation data) are shown. In addition, the lines of the heat map show the expression of the genes of interest (z-score), which are divided into the following biological classes and/or pathways: (A) FGFR3 gene signature; (B) CD8 Teff signature; (C) antigen-processing machinery; (D) immune checkpoint signature; (E) MKI67 and cell cycle genes; (F) DNA replication-dependent histones; (G) DNA damage-repair genes; (H) TGFβ receptor and ligand; (I) F-TBRS genes; (J) EMT markers; (K) angiogenesis signature.
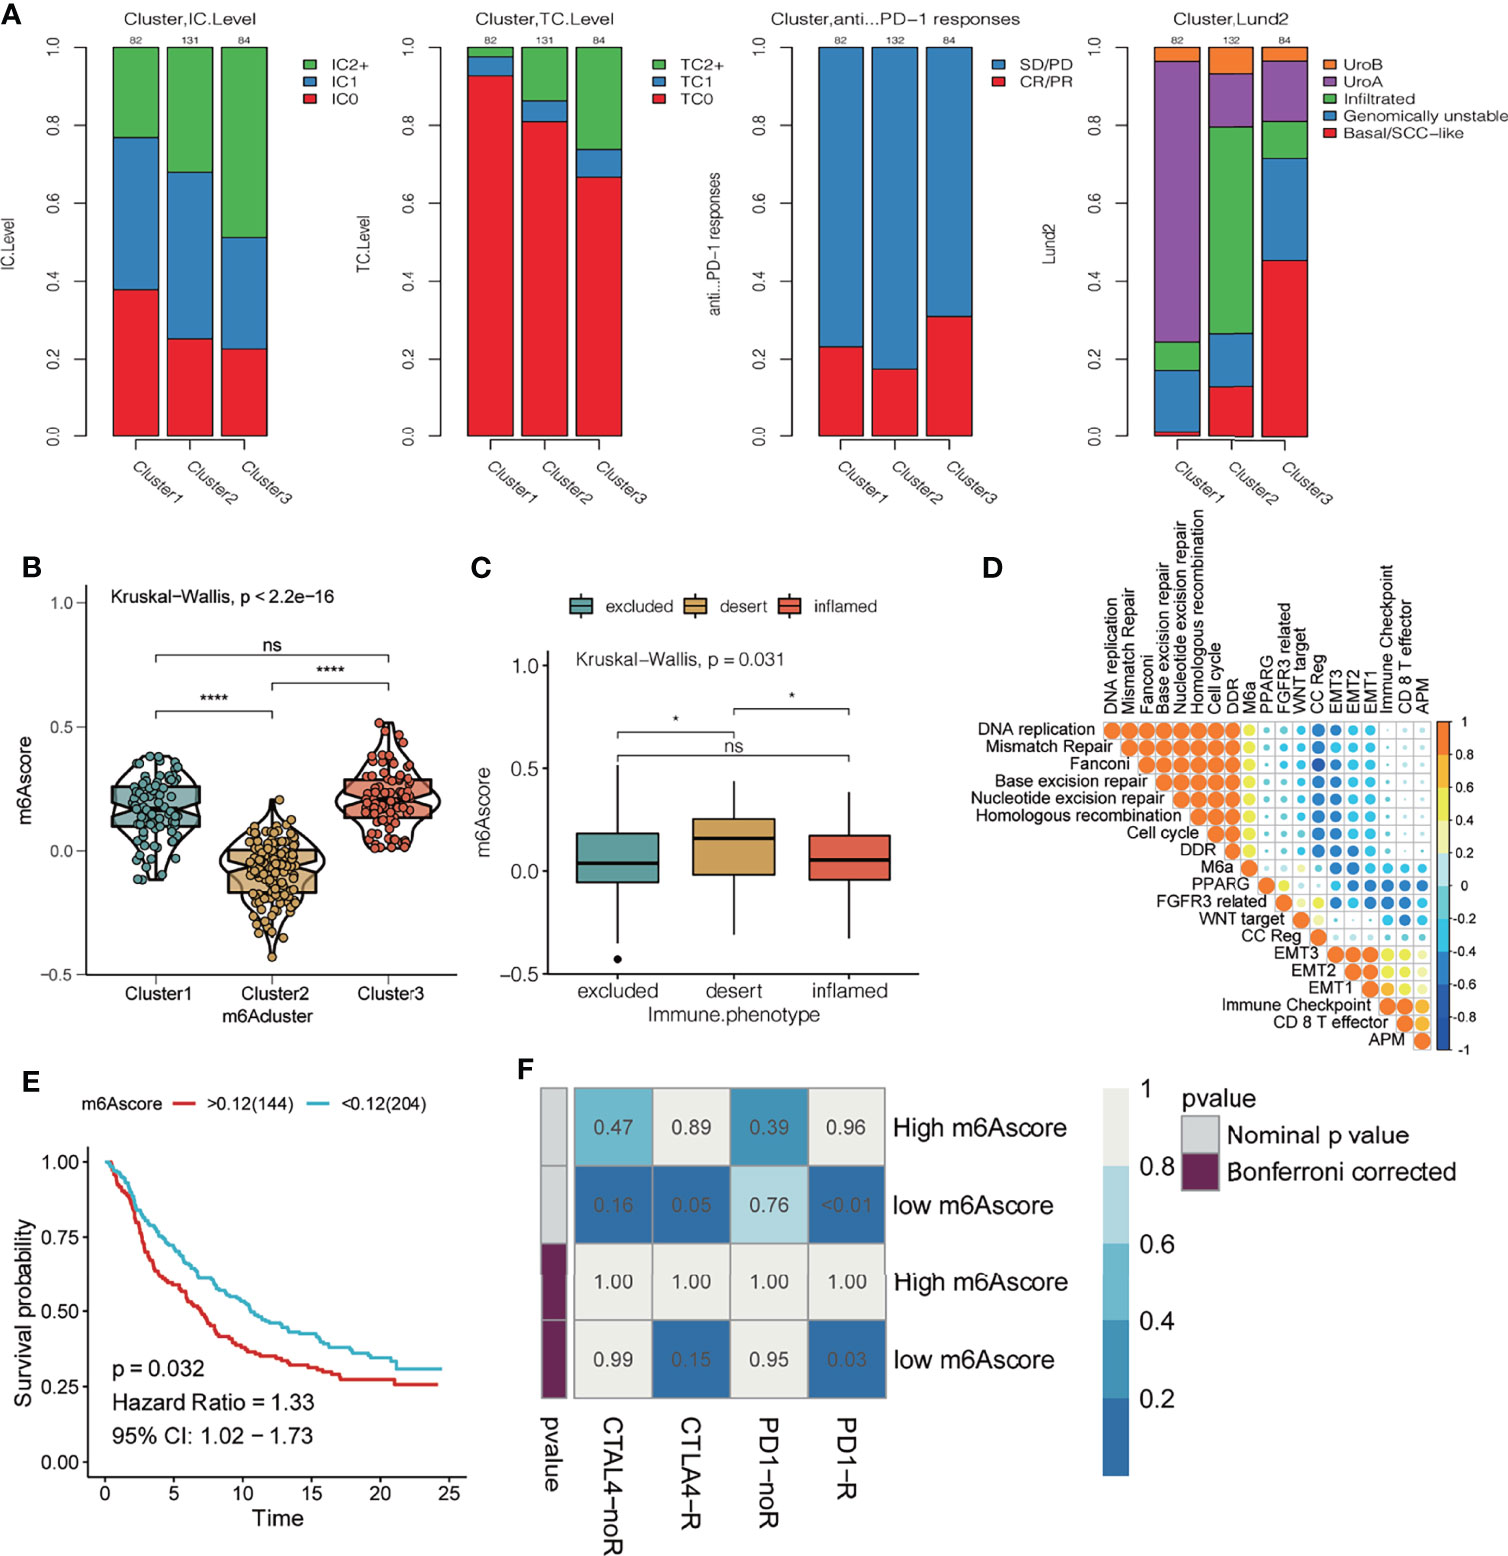
Figure 8 Effect of m6A modification mode on the treatment of bladder cancer with PD-L1. (A) From left to right, the stacking histogram shows the relationship between the three kinds of m6A modification patterns and PD-L1 expression on immune cells (IC), PD-L1 expression on tumor cells (TC), response to atezolizumab, and Lund typing. (B) m6Ascore difference between 3 different m6A modification patterns. The asterisk represents the statistical p-value (*P < 0.05; ****P < 0.0001, ns P > 0.05). (C) The difference in m6Ascore among the three immunophenotypes; the asterisk represents the statistical p-value (*P < 0.05; ****P < 0.0001). (D) Spearman correlation was used to analyze the relationship between the m6Ascore and known gene characteristics in the IMvigor 210 cohort. The larger the circle, higher the correlation. (E) KM curve showing the effect of m6Ascore on OS in the IMvigor210 cohort. (F) Using the SubMAP algorithm, we predicted response to the anti-PD1 and anti- cytotoxic T-lymphocyte-associated protein 4 (CTLA4) immunotherapy in the groups with high and low m6A score. High IC score group may respond better to the PD-1 treatment (Bonferroni-corrected P = 0.03).
Next, we analyzed the correlation between m6Ascore and biological pathway gene scores (39) in bladder cancer (Figure 8D). The m6Ascore was positively correlated with the scores for DNA replication, mismatch repair, Fanconi, base excision repair, nucleotide excision repair, homologous recombination, cell cycle, and DDR, and negatively correlated with EMT2, EMT1, immune checkpoint, CD8 T effector, APM, etc. The effect of the m6Ascore on OS was observed by plotting the KM curve, which indicated that a higher m6Ascore had a poor prognosis (P = 0.032, Figure 8E). Using the SubMAP algorithm, we predicted response to the anti-PD1 and anti- cytotoxic T-lymphocyte-associated protein 4 (CTLA4) immunotherapy in the groups with high and low m6A score. High m6Ascore group may respond better to the PD-1 treatment (Bonferroni-corrected P = 0.03)
The results from our data analysis showed that patients with high expression of FTO had a poor prognosis in the IMvigor210 cohort (p = 0.0035; Figure 9A) and there were differences in FTO expression in the three groups (Figure 9B). We also queried the predictive value of FTO expression in the cohort for anti-PD-L1 immunotherapy and found that there was a significant difference in FTO expression between non-responders and objective remission groups. Non-responsive patients showed significantly higher FTO expression (Figure 9C), suggesting that FTO may play an important role in the anti-PD-L1 treatment of bladder cancer. Upon further examination, FTO expression was positively correlated with the EMT signaling pathway and negatively correlated with the DDR/cell cycle, nucleotide excision repair, Fanconi anemia pathway, and other signaling pathways (Figure 9D), and additionally, was negatively correlated with the protein level of PD-L1 in immune cells (Figure 9E). FTO had no significant correlation with the total PD-L1 level in tumor cells (Figure 9F). The analysis of data from the TCGA database showed that the prognosis of patients with a high expression of FTO was worse (p = 0.0015; Figure 9G), and FTO expression was higher in patients with a high stage of bladder cancer (Figure 9H). Additionally, the enrichment results of FTO-related gene pathways showed that FTO may be involved in the regulation of focal adhesion, the Hippo signaling pathway, the TGF-β signaling pathway, and other signal pathways (Figure 9I). Previous studies have confirmed that the activation of EMT and TGF-β related pathways reduces T cell migration to tumors and weakens their tumor-killing effect (5, 51). Therefore, FTO may play an important role in the occurrence and development of bladder cancer, the efficacy of anti-PD-L1 immune checkpoint therapy, and might be useful for predicting the prognosis.
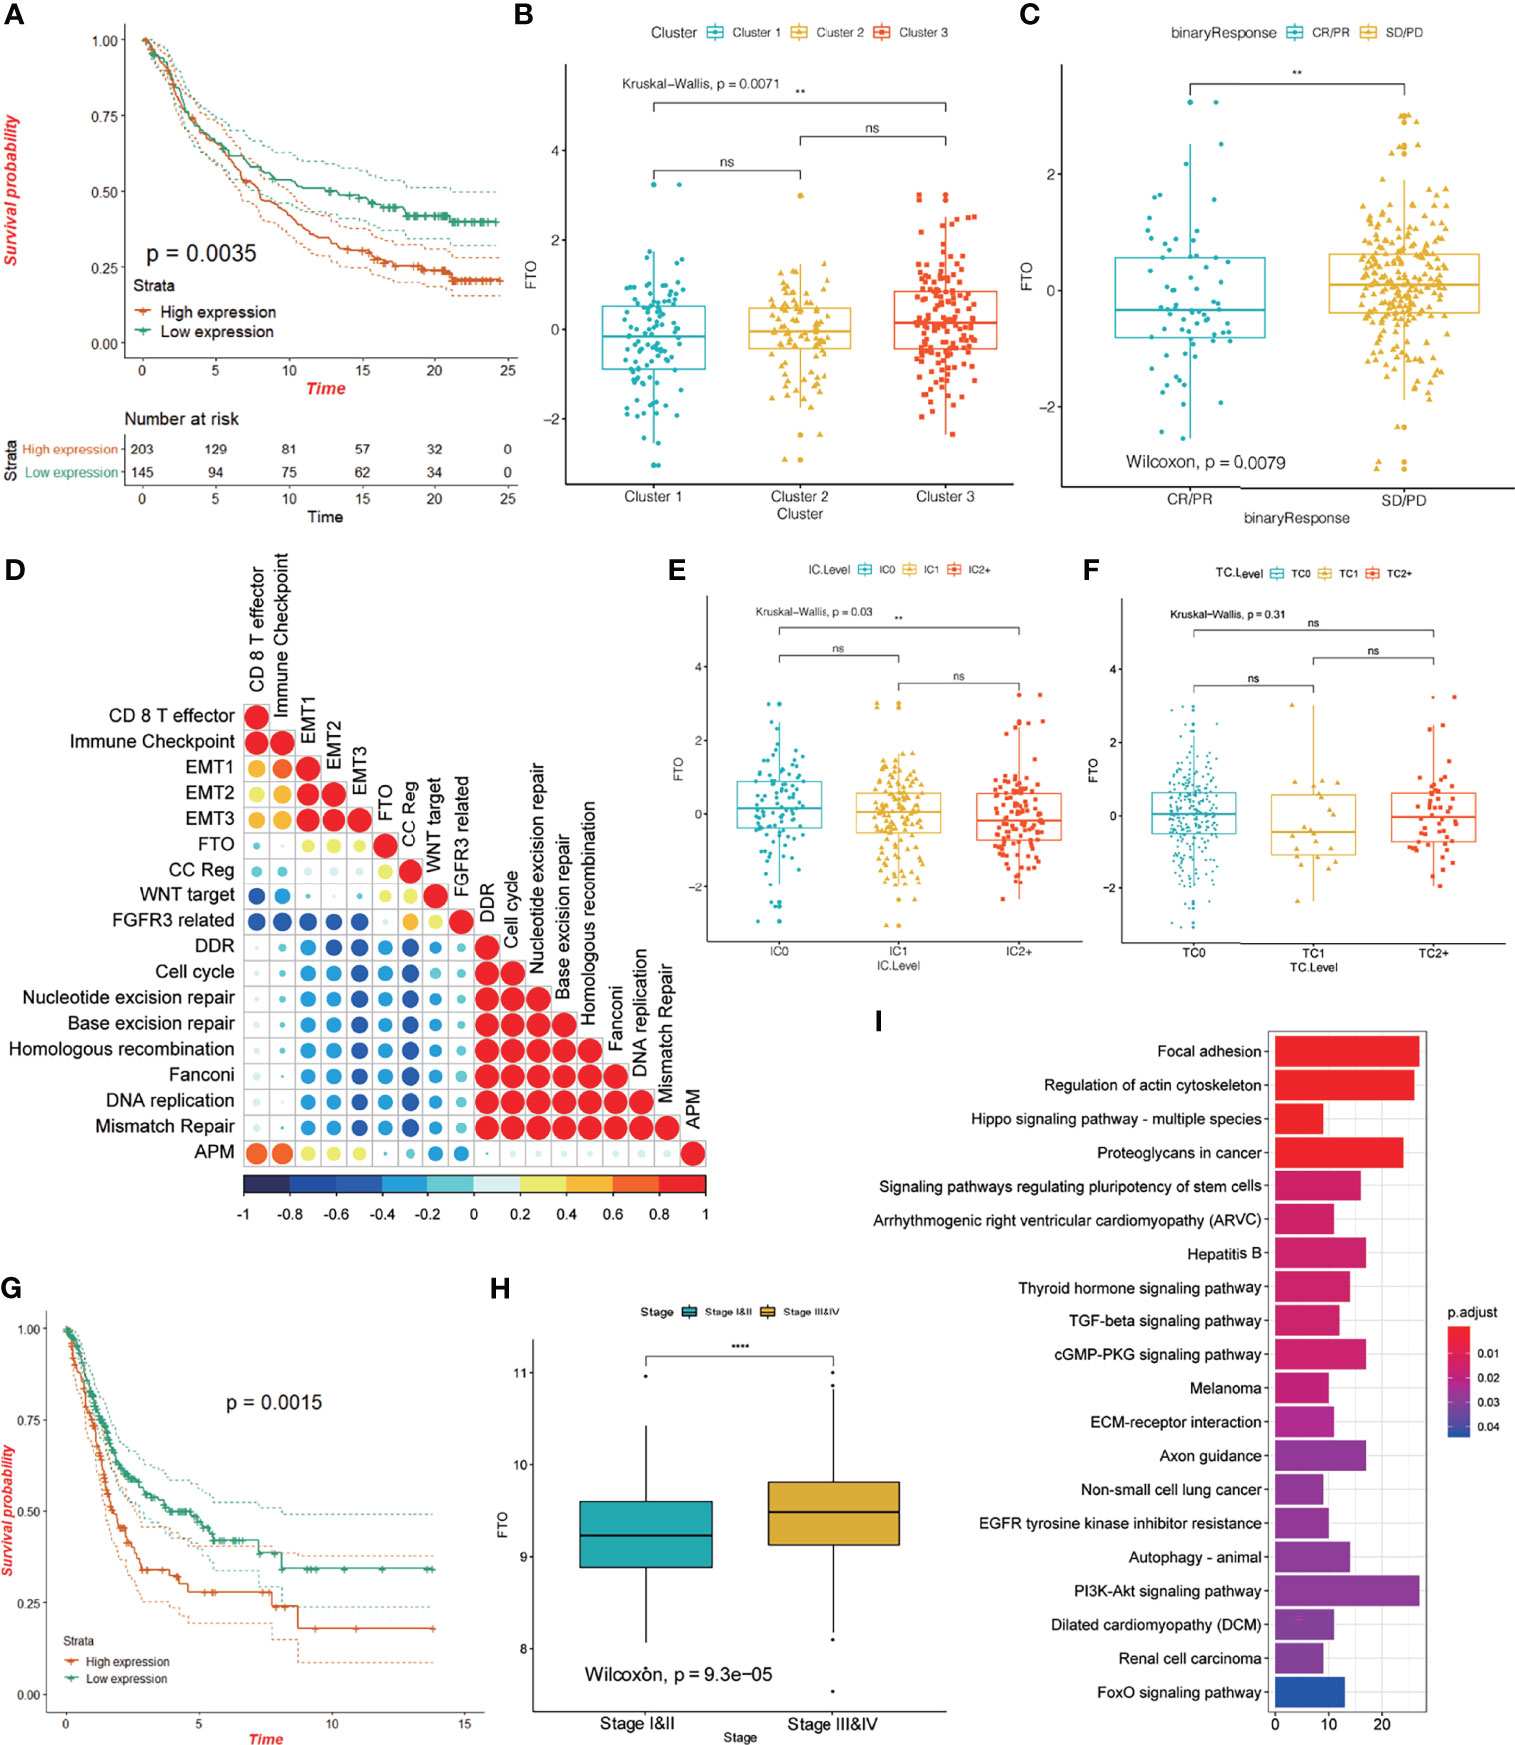
Figure 9 Characteristics of FTO in the TCGA-BLCA cohort and anti-PD-L1 treatment cohort. (A) KM curve showing the effect of FTO on OS in the IMvigor 210 cohort. (B) The difference in FTO expression among the three different m6A modification patterns in the IMvigor 210 cohort; the asterisk represents the statistical p-value (**P < 0.01; ****P < 0.0001, ns P > 0.05). (C) The difference in FTO expression between responders (CR/PR) and non-responders (SD/PD) in the IMvigor 210 cohort; the asterisk represents the statistical p-value (**P < 0.01; ****P < 0.0001). (D) Spearman’s correlation was used to analyze the correlation between FTO expression and known gene characteristics in the IMvigor 210 cohort. Blue, negatively correlated; orange, positively correlated; and the larger circle indicates a higher correlation. (E, F) The relationship between FTO expression and PD-L1 expression in immune cells (IC), and PD-L1 expression in tumor cells (TC). The asterisk represents the statistical p-value (**P < 0.01; ****P < 0.0001, ns P > 0.05). (G) KM curve showing the effect of FTO on OS in the TCGA-BLCA cohort. (H) Box plot showing the difference in FTO expression between stage I and II and stage III and IV; the asterisk represents the statistical p-value (**P < 0.01; ****P < 0.0001). (I) Pearson correlation was used to calculate the correlation between FTO and all other protein-coding genes, and genes with a correlation coefficient R >= 0.03, and p < 0.05 were selected as FTO-related genes. These genes were enriched by KEGG signaling pathway analysis to study FTO function.
We examined the nuclear, cytoplasmic, and overall expression levels of FTO in nine human bladder cancer cell lines: BIU87 cells, 5637 cells, T24 cells, EJ cells, RT4 cells, J82 cells, UM-UC-3 cells, TCCSUP cells, and human bladder epithelial immortalized SV-huv-1 cells (Figure 10A). Using immunofluorescence two cell lines with high FTO expression (EJ and T24 cells) and two cell lines with low FTO expression (BIU87 and RT4) were identified. We found that FTO was expressed in both cytoplasm and nucleus of these cell lines (Figure 10B). Subsequently, we knocked down the FTO in EJ and RT4 using siRNA. CCK-8 examination revealed that cell proliferation was reduced in the si-FTO group (Figure 10C), and transwell assays showed reduced cell invasion in the si-FTO group (Figure 10D). Flow cytometry revealed increased apoptosis after the knockdown of FTO (Figure 10E). The level of total cellular FTO-m6A enzyme activity was significantly increased (Figure 10F), and total FTO protein was decreased in the si-FTO group (Figure 10G). These results confirm the critical role of FTO in bladder cancer.
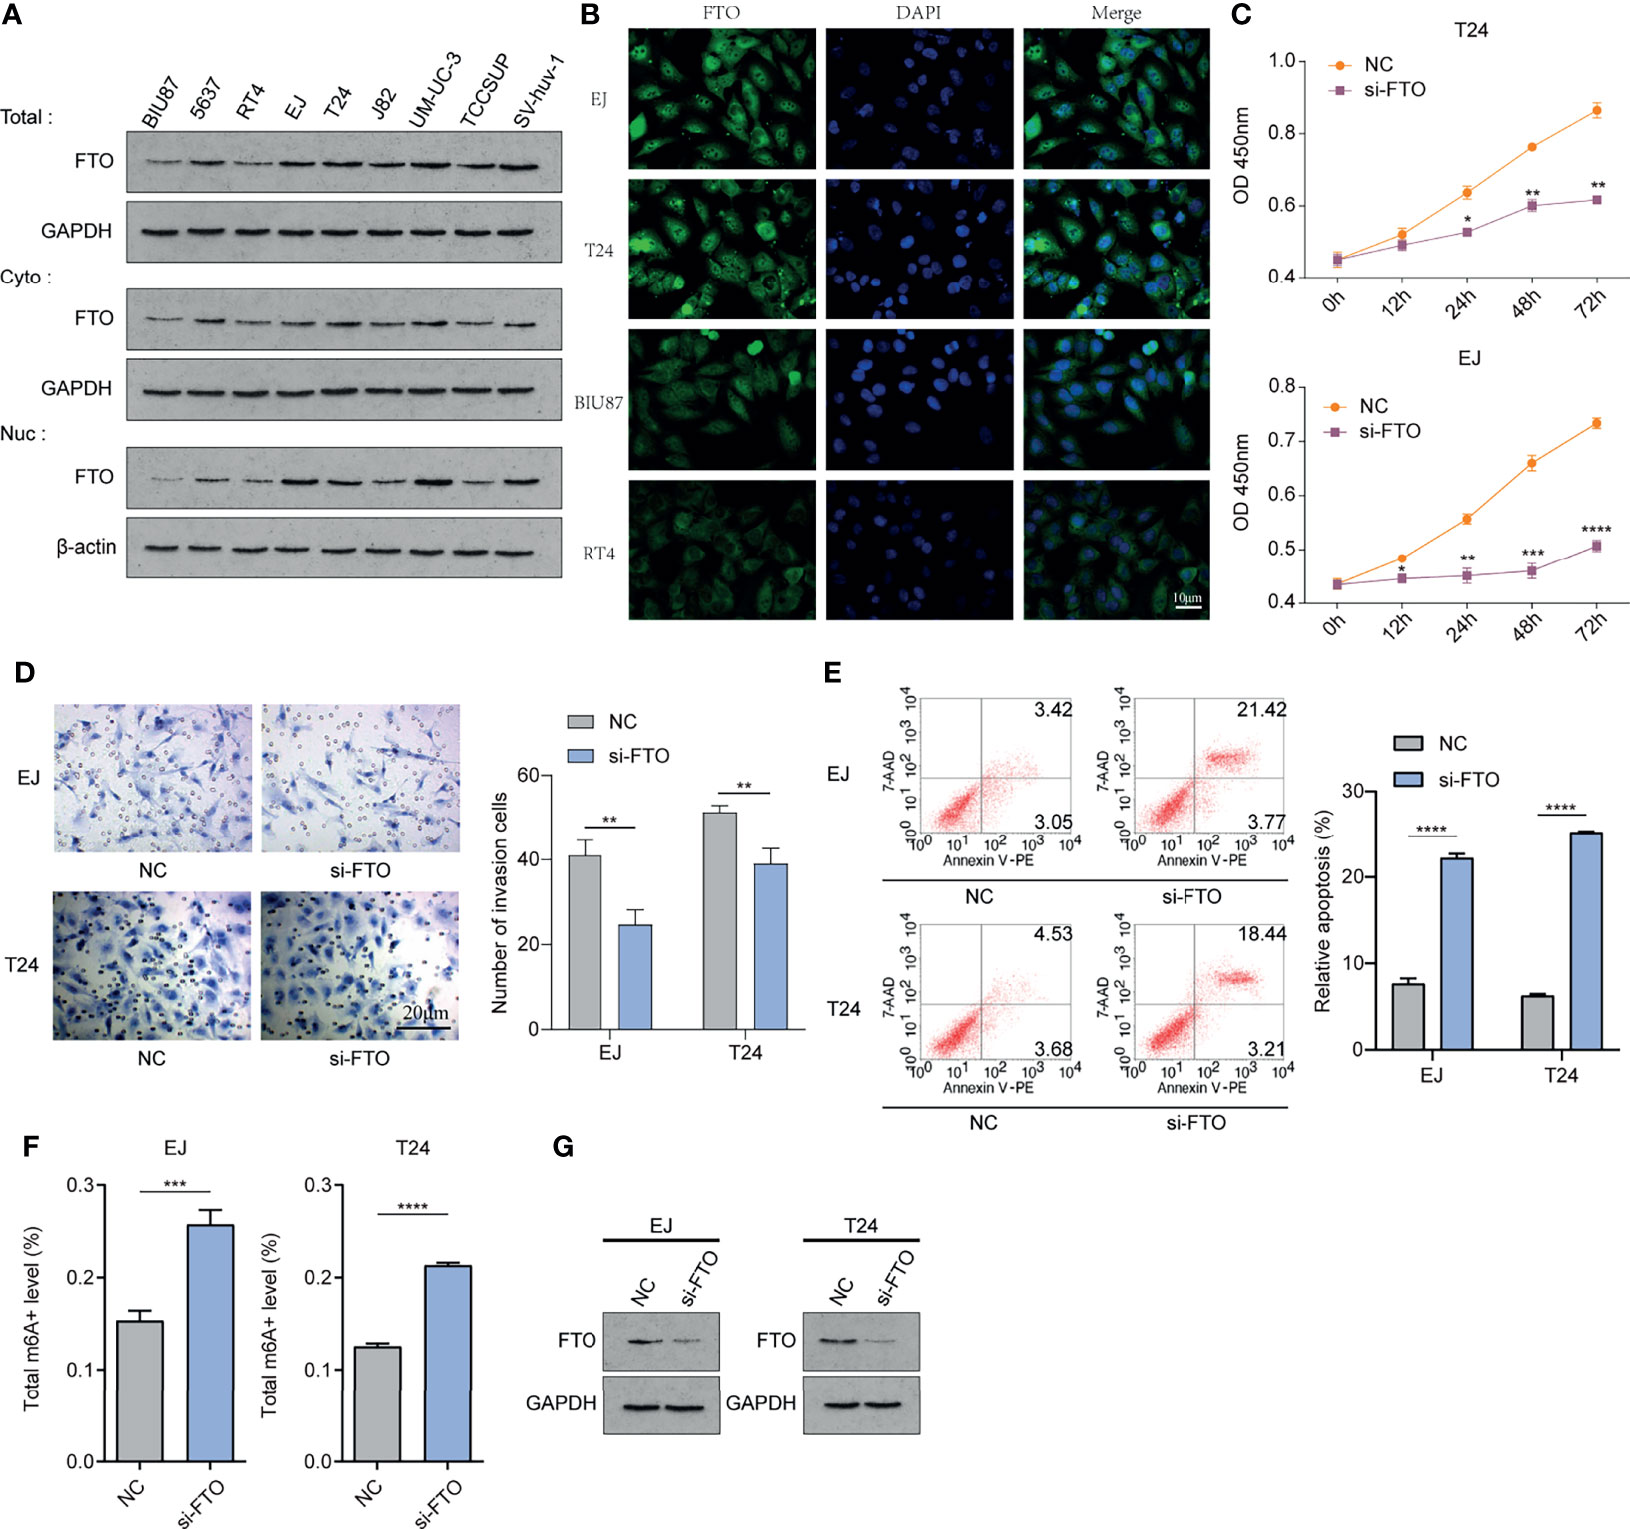
Figure 10 FTO could be involved in the occurrence and development of bladder cancer in vitro. (A) Western Blot method to detect nuclear, cytoplasmic, and overall expression levels in BIU87 cells, 5637 cells, T24 cells, EJ cells, RT4 cells, J82 cells, UM-UC-3 cells, TCCSUP cells, and human bladder epithelial immortalized SV-huv-1 cells. (B) IF immunofluorescence method to detect the cellular localization of FTO protein. (C) Cell Counting Kit-8(CCK-8) to detect the proliferation level of each group of cells. (D) Transwell method to observe the invasion level of each group of cells. (E) Flow cytometry method to detect apoptosis in each group. (F) Detection of m6A enzyme activity level in each group. (G) Western Blot method to detect the FTO expression level after siRNA knockdown. The histogram data for each group is the average of three independent replicates; bars represent mean ± SD; *P < 0.05, **P < 0.01, ***P < 0.001, ****P < 0.0001.
According to our previous study (53), we confirmed the existence of important modification sites K216 for FTO protein, including K216R, K216H, K216S, and K216E. We constructed plasmids and transfected them into BIU87 and RT4 cells, as well as detected the expression of FTO protein in each group by WB (Western blot) (Figure 11A). The apoptosis was increased in the FTO-MT (K216H) and MT (K216E) groups (Figure 11B), and the cell invasion was significantly reduced in the FTO-MT (K216H) and MT (K216E) groups as observed by transwell assay (Figure 11C), and the total FTO-m6A enzyme activity level was significantly increased in these two groups (Figure 11D). The above results suggest that K216H and K216E are the important targets for regulating FTO in the future.
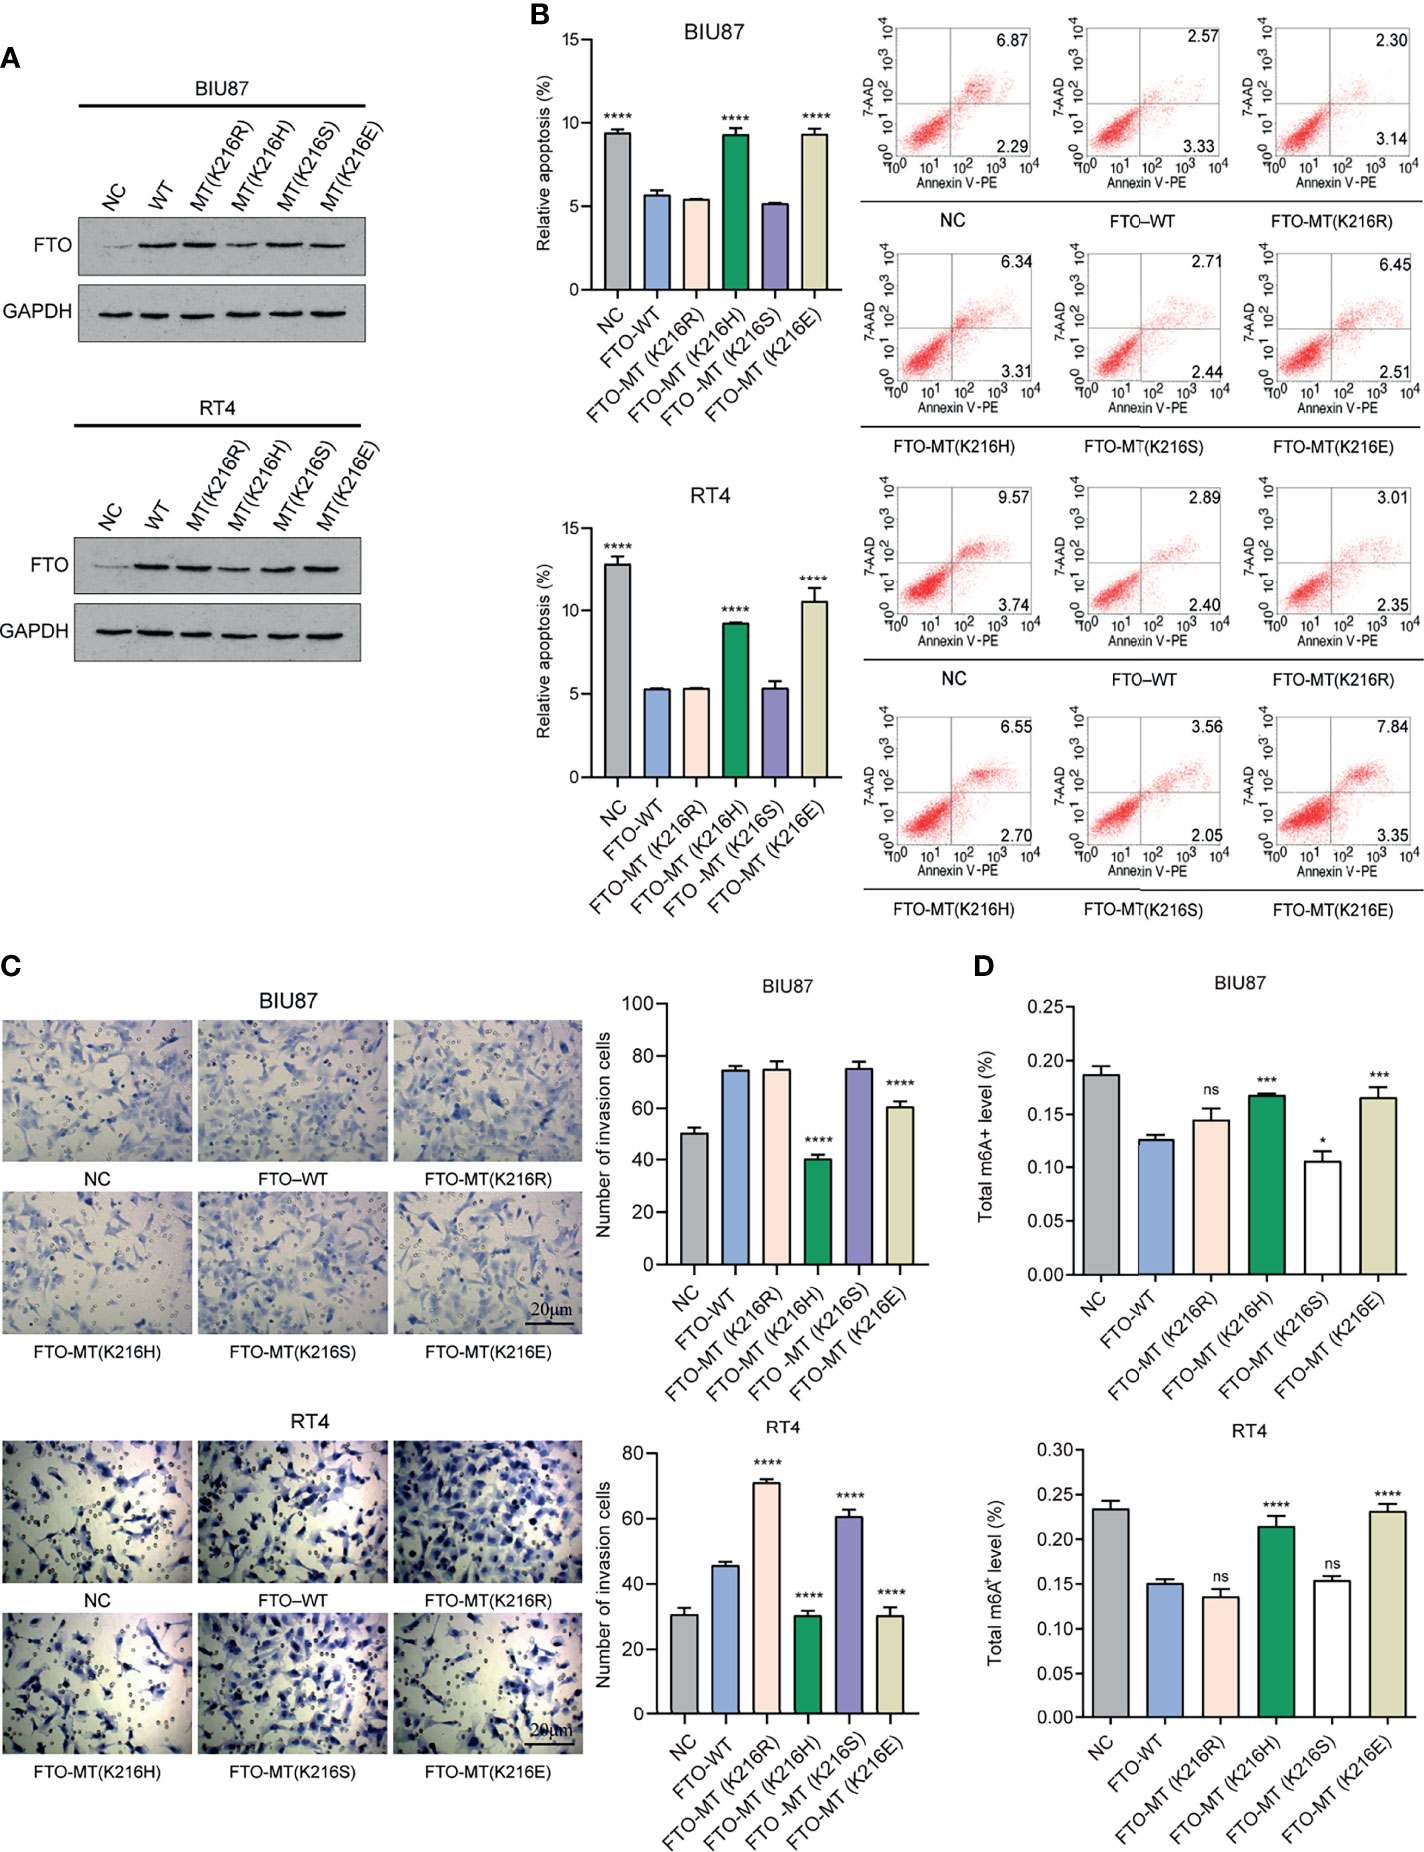
Figure 11 K216H and K216E are the potential important targets for regulating FTO. (A) Western Blot method to detect the expression level of FTO in each group. (B) Flow cytometry method to detect apoptosis in each group of cells. (C) Transwell method to observe the level of cell invasion in each group. (D) Detection of m6A enzyme activity in each group. The histogram data for each group is the average of three independent replicates; bars represent mean ± SD; *P < 0.05, ***P < 0.001, ****P < 0.0001, ns P > 0.05.
More than 150 RNA modifications have been identified in all organisms, including 5-methylcytosine (m5C), N6-methyladenosine (m6A), and N1-methyladenosine (m1A), of which the m6A RNA methylation is considered to be the most prominent and abundant form of internal modification in eukaryotic cells (54). The study of m6A modification in cancer is a new field of cancer research, which may reveal a new layer of epigenetic regulation in cancer, and provide new insights into the tumorigenesis, immune response, and the molecular mechanisms underlying drug resistance during therapy. Additionally, it may lead to the development of new, effective treatments (55) through the use of effective inhibitors targeting maladjusted m6A regulatory factors alone (or editing targeted mutant or dysfunctional m6A sites through targeted transcriptomics), or in combination with other therapies. Targeting the m6A modification may have a strong therapeutic potential for the treatment of all types of cancers, especially those that are resistant to existing treatments (56).
Due to technical and resource constraints, most studies have focused on a single TME immune cell type or a single m6A. The overall infiltration characteristics of the TME mediated by the combined effects of multiple m6A regulators have not been widely analyzed (57, 58). The modification of m6A is a reversible process that is affected by various writers, erasers, and readers. In this study, we explored the effects of multiple m6A regulators on the infiltration of immune cells in the TME of bladder cancer, the molecular mechanisms underlying m6A modification in bladder carcinogenesis, the immune response, and the drug resistance of immune checkpoint inhibitors. We also provide new insights into the role of m6A modification patterns in TME cell infiltration and developing more effective immunotherapy strategies.
We classified patients with bladder cancer based on the expression of 23 m6A regulatory molecules and identified three different m6A modification patterns. We found that Cluster 2 showed unique specificity compared with the other two types. A quantification of 28 immune cells in the immune microenvironment of bladder cancer using the ssGSEA algorithm showed that Cluster 2 had a low level of immune cell infiltration characterized by immune inhibition, which corresponds to the immune desert phenotype. Furthermore, an analysis performed using the ESTIMATE algorithm showed that the stromal and immune scores in Cluster 2 were lower than the other two subtypes, which corroborates our previous results. The expression of immune checkpoint and CD8+T cell markers were lower in Cluster 2 than in the other two groups, and studies have shown that the expression of these markers is highly sensitive to immune checkpoint inhibitors (52). Thus, different m6A modification patterns are significantly related to immune activation, and a comprehensive evaluation of the m6A modification patterns will enable the understanding of the characteristics of TME cell infiltration. An analysis of DEGs between the different m6A modification patterns uncovered m6A-related signaling pathway genes. These were mainly enriched in the biological pathways related to the matrix and immune activation. In the anti-PD-L1 treatment cohort, we identified three different m6A modification patterns and found significant differences in gene expression and mutations in biological pathway genes associated with the three subtypes of bladder cancer. We constructed a scoring system to quantify and evaluate the m6A modification level in a single tumor and found that a high m6Ascore was related to poor prognosis in the TCGA and anti-PD-L1 cohorts. Patients with a high or low m6Ascore showed differences in immune cell infiltration in the tumor immune microenvironment. A GSEA signaling pathway analysis indicated that the high and low m6Ascore are mainly enriched in the matrix and immune-related signaling pathways. Together, these results indicate that the m6A score is a reliable tool for the comprehensive evaluation of m6A modification patterns in tumors in individuals, and to determine the mode of infiltration in the TME. The expression and gene changes for m6A regulatory factors are related to a variety of biological processes, especially the matrix and immune activation. Our findings may provide new impetus for improving the clinical response of patients with bladder cancer to immunotherapy, the identification of different immunophenotypes in bladder cancer, and promoting individualized immunotherapy.
The role of FTO in cancer has recently garnered increasing attention. Previous studies conducted by our team have shown that FTO-mediated m6A modification plays an important role in hepatocellular carcinoma, and the SIRT1 deacetylase can play a carcinogenic role by down-regulating FTO. FTO is an RNA demethylase that can remove the methylation of m6A in mRNA both in vitro and in vivo (59, 60). FTO has catalytic demethylation activity for both cap-m6Am and internal m6A. As the abundance of m6A in mRNA is much higher than that of its preferred binding target m6Am, the main target of FTO is m6A (61). Reports indicate that the FTO-mediated demethylation of cap-m6Am leads to mRNA degradation (62), but the evidence for this is inconsistent. PCIF1 is the cap-m6Am methyltransferase, which processes cap-m6A alone but not internal m6A. Reports indicate that the cap-m6Am added by PCIF1 does not change the level of gene expression or the stability of transcripts (63–65). Additionally, studies (66) have found that the spatial distribution of FTO can also play a regulatory role. The N-terminus of FTO has an NLS, which can be partially distributed in the nucleus and the cytoplasm, and the distribution of FTO is different in different cell lines, its role and regulation being affected by the environment. Yang et al. (20) have shown that the induction of FTO can be used as an adaptive mechanism to combat metabolic stress in melanoma cells, thus increasing their proliferation, invasion, and migration, and promoting the tumorigenesis and development of melanoma in mice. Further, the authors showed that an FTO knockout can increase m6A methylation in key oncogenic melanoma cells, including the loci for PD-1 (PDCD1), CXCR4, and SOX10. The inhibition of FTO makes melanoma cells sensitive to interferon-γ (IFN-γ) and anti-PD-1 therapy in mice, indicating that FTO plays an important role in promoting the occurrence of melanoma and anti-PD-1 drug resistance. The role of m6A involvement with FTO in bladder cancer had not been reported, and we found that in the TCGA and IMvigor210 cohorts, patients with high FTO expression had a poor prognosis, and the expression of FTO was higher in patients with a higher stage of bladder cancer.
In addition, we analyzed the predictive value of FTO expression in the cohort subjected to anti-PD-L1 immunotherapy, and found that there was a significant difference in FTO expression between the non-responders and the objective remission group. The level of FTO expression in the patients non-responsive to anti-PD-L1 therapy was significantly higher than in patients in remission. The data showed that FTO expression was negatively correlated with the protein level of PD-L1 in immune cells (Figure 9E), was positively correlated with the EMT signaling pathway, and negatively correlated with DDR, cell cycle, nucleoside exercise repair, Fanconi anemia pathway, and other signaling pathways. The enrichment of FTO-related gene pathways indicated that FTO might be involved in the regulation of focal adhesion/Hippo signaling pathway/TGF-β signaling, these results suggest that FTO plays an important role in bladder cancer. The combination of FTO targeted regulation and anti-PD-L1 blockers may have great therapeutic potential for reducing the resistance of bladder cancer to immunotherapy. Thus, this study furthers the understanding of the regulation of m6A modification in the tumor immune microenvironment of the bladder cancer and contributes to the development of new predictive indicators, drug combination strategies, and new immunotherapeutic strategies for cancer immunotherapy. However, its specific role and mechanism need further experimental study.
In this study, we systematically analyzed the mutation and correlation of 23 kinds of m6A regulatory factors in bladder cancer, and their effects on OS and immune invasion, We found three different patterns of m6A modification and compared them with other important molecular types of bladder cancer, such as MDA, Lund, and Baylor, the effects of the three kinds of m6A modification patterns on the mutation characteristics, clinicopathological characteristics, gene expression, immune cell infiltration level, and gene expression level of immune checkpoint regulators were comprehensively analyzed. Further, we investigated the effect of m6A modification mode on the therapeutic efficacy of bladder cancer immune checkpoint inhibitor anti-PD-L1. Our results confirmed that m6A methylation is involved in the process of immune cell recruitment in the TME of bladder cancer, and may affect the efficacy of anti-PD-L1 therapy. In addition, we established a method to quantify the level of m6A modification (m6Ascore), which we found to be an important and powerful prognostic biomarker and predictor for bladder cancer. Thus, this study furthers the understanding of the regulation of m6A modification in the tumor immune microenvironment of bladder cancer and contributes to the potential development of new predictive indicators, drug combination strategies, and new immunotherapeutic strategies for cancer immunotherapy.
This study comprehensively recognized the role of m6A methylation modification on the invasion characteristics of bladder cancer immune microenvironment cells and the effect on the anti-PD-L1 treatment for bladder cancer. The difference in m6A modification mode is an important factor indicating the heterogeneity and complexity of the tumor microenvironment and the immunotherapy impact. The m6A modification mode helps decipher the molecular mechanisms underlying the immune microenvironment regulation in bladder cancer and provides new predictive indicators, possible auxiliary targets, and directions for guiding more effective immunotherapy strategies in the future.
The datasets presented in this study can be found in online repositories. The names of the repository/repositories and accession number(s) can be found in the article/Supplementary Material.
The experimental protocol was established according to the ethical guidelines of the Helsinki Declaration and was approved by the Human Ethics Committee of the Ethical Review Committee of the Third Xiangya Hospital of Central South University. Written informed consent was obtained from individuals or guardians of the participants.
XC and KC designed the study. XC and HD analyzed and interpreted the data. HD and XC wrote this manuscript. HD, FT, MZ, and DS conducted the experiments and edited and revised the manuscript. All authors have seen and approved the final version of the manuscript.
This work was supported by The Science and Technology Innovation Program of Hunan Province (2020RC2066), Hunan Provincial Natural Science Foundation of China (2020JJ5335), Science and Technology Foundation of Changsha City (kq1907127), Health Commission Science Foundation of Hunan Province (20200957), Hunan Cancer Hospital Climb Plan (QH201904), The Science and Technology Innovation Program of Hunan Province (2021RC2041), and The National Science Foundation of China (81874137).
The authors declare that the research was conducted in the absence of any commercial or financial relationships that could be construed as a potential conflict of interest.
All claims expressed in this article are solely those of the authors and do not necessarily represent those of their affiliated organizations, or those of the publisher, the editors and the reviewers. Any product that may be evaluated in this article, or claim that may be made by its manufacturer, is not guaranteed or endorsed by the publisher.
We thank our colleagues in the Department of Laboratory Medicine for helpful discussions and valuable assistance. We thank Dr. Jianming Zeng (University of Macau), and all the members of his bioinformatics team, biotrainee, for generously sharing their experience and codes. This work was carried out in part using computing resources at the High Performance Computing Center of Central South University.
The Supplementary Material for this article can be found online at: https://www.frontiersin.org/articles/10.3389/fonc.2022.820242/full#supplementary-material
Supplementary Figure 1 | Three m6A modification patterns were identified in the TCGA-BLCA cohort through unsupervised clustering of 23 m6A regulatory factors. (A–D) Consensus matrices of the TCGA-BLCA cohort for k = 2-5. (E) Waterfall diagram showing the influence of the three m6A modification patterns on the mutation of the top 20 genes in the TCGA-BLCA cohort. Each column represents the patient, each color represents the mutation type, and gray indicates that there is no mutation in the gene in this sample. The bar graph above shows the TMB, and the number on the right shows the mutation frequency of each gene.
Supplementary Figure 2 | GISTIC analysis of foci of recurrent amplification and deletion. Detailed cytoband with focal amplification (A) and focal deletion (B) in Cluster 1, Cluster 2, and Cluster 3 generated with GISTIC 2.0 software. The q value of each locus is plotted horizontally.
Supplementary Figure 3 | Copy number alterations across three m6A modification patterns. Copy number Gistic score (A) and Copy number profiles (B) for Cluster 1, Cluster 2, and Cluster 3, with gains are shown in dark red and losses in midnight blue. Gene segments are placed according to their location on chromosomes, ranging from chromosome 1 to chromosome 22.
Supplementary Figure 4 | Difference of immune cell infiltration characteristics in tumor immune microenvironment for the three m6A modification patterns in the TCGA-BLCA cohort. (A) The box plot shows the difference for 28 immune cell infiltration levels in the three m6A modification patterns; the asterisk represents the statistical p-value (*P < 0.05; **P < 0.01; ***P < 0.001, ****P < 0.0001). (B, C) The differences in the antitumor immunity score and pro-tumor immunity score among three kinds of m6A modification patterns; the asterisk represents the statistical p-value.
Supplementary Figure 5 | Signaling pathway enrichment analysis. (A, B) In the TCGA-BLCA cohort, there are three different m6A modification patterns, and different gene signaling pathways are enriched; the same enrichment network has its nodes displayed as pies. Each pie sector is proportional to the number of hits that originated from a gene list. Color code for the pie sector represents a gene list and is consistent with the colors used for the table rows in the slide. The same enrichment network has its nodes colored by p-value, as shown in the legend. Darker color indicates more statistically significant nodes (see legend for p-value ranges). (C–E) The enrichment analysis of Gene Ontology (GO) signaling pathways in the high and low m6A groups was divided into three parts: C, cellular component (CC); D, biological process (BP); E, molecular function (MF). (F) Enrichment analysis of KEGG signaling pathways of DEGs in high and low m6A groups.
Supplementary Table 1 | Pearson correlation of 23 m6A regulatory factors
Supplementary Table 2 | Immune cell marker genes
Supplementary Table 3 | Infiltration levels of 28 immune cells and anti-tumor immunity score and pro-tumor immunity scores of 407 samples in the TCGA-BLCA cohort
Supplementary Table 4 | IMvigor 210 cohort clinical information and important gene set score
m6A, N6-methyladenosine; TCGA, The Cancer Genome Atlas; GEO, Gene-Expression Omnibus; KEGG, Kyoto encyclopedia of gene and genome; GO, Gene ontology; GSEA, Gene set enrichment analysis; SsGSEA, The single-sample gene set enrichment analysis; TME, Tumor microenvironment; TMB, Tumor mutation burden; ICT, The immune checkpoint therapy; CTLA-4, Cytotoxic lymphocyte antigen-4; PD-1, Programmed cell death protein 1; PD-L1, Programmed-death ligand 1; DCs, Dendritic cells; DEGs, Differentially expressed genes; EMT, Epithelial-mesenchymal transition; ICB, Immunological checkpoint blockade; TGFb, Transforming growth factor beta
1. Herbst RS, Soria JC, Kowanetz M, Fine GD, Hamid O, Gordon MS, et al. Predictive Correlates of Response to the Anti-PD-L1 Antibody MPDL3280A in Cancer Patients. Nature (2014) 515:563–7. doi: 10.1038/nature14011
2. Inman BA, Longo TA, Ramalingam S, Harrison MR. Atezolizumab: A PD-L1-Blocking Antibody for Bladder Cancer. Clin Cancer Res (2017) 23:1886–90. doi: 10.1158/1078-0432.CCR-16-1417
3. Powles T, Eder JP, Fine GD, Braiteh FS, Loriot Y, Cruz C, et al. MPDL3280A (Anti-PD-L1) Treatment Leads to Clinical Activity in Metastatic Bladder Cancer. Nature (2014) 515:558–62. doi: 10.1038/nature13904
4. Davis AA, Patel VG. The Role of PD-L1 Expression as a Predictive Biomarker: An Analysis of All US Food and Drug Administration (FDA) Approvals of Immune Checkpoint Inhibitors. J Immunother Cancer (2019) 7(1):278. doi: 10.1186/s40425-019-0768-9
5. Gomez de Liano Lista A, van Dijk N, de Velasco Oria de Rueda G, Necchi A, Lavaud P, Morales-Barrera R, et al. Clinical Outcome After Progressing to Frontline and Second-Line Anti-PD-1/PD-L1 in Advanced Urothelial Cancer. Eur Urol (2020) 77:269–76. doi: 10.1016/j.eururo.2019.10.004
6. Wolacewicz M, Hrynkiewicz R, Grywalska E, Suchojad T, Leksowski T, Rolinski J, et al. Immunotherapy in Bladder Cancer: Current Methods and Future Perspectives. Cancers (Basel) (2020) 12(5):1181. doi: 10.3390/cancers12051181
7. Li Z, Zhu L, Sun H, Shen Y, Hu D, Wu W, et al. Fluorine Assembly Nanocluster Breaks the Shackles of Immunosuppression to Turn the Cold Tumor Hot. Proc Natl Acad Sci USA (2020) 117(52):32962–9. doi: 10.1073/pnas.2011297117
8. Schneider AK, Chevalier MF, Derre L. The Multifaceted Immune Regulation of Bladder Cancer. Nat Rev Urol (2019) 16:613–30. doi: 10.1038/s41585-019-0226-y
9. Chen X, Chen H, He D, Cheng Y, Zhu Y, Xiao M, et al. Analysis of Tumor Microenvironment Characteristics in Bladder Cancer: Implications for Immune Checkpoint Inhibitor Therapy. Front Immunol (2021) 12:672158. doi: 10.3389/fimmu.2021.672158
10. Li Z, Wang Y, Shen Y, Qian C, Oupicky D, Sun M. Targeting Pulmonary Tumor Microenvironment With CXCR4-Inhibiting Nanocomplex to Enhance Anti-PD-L1 Immunotherapy. Sci Adv (2020) 6(20):eaaz9240. doi: 10.1126/sciadv.aaz9240
11. Chen X, Chen H, Yao H, Zhao K, Zhang Y, He D, et al. Turning Up the Heat on non-Immunoreactive Tumors: Pyroptosis Influences the Tumor Immune Microenvironment in Bladder Cancer. Oncogene (2021) 40(45):6381–93. doi: 10.1038/s41388-021-02024-9
12. Dai D, Wang H, Zhu L, Jin H, Wang X. N6-Methyladenosine Links RNA Metabolism to Cancer Progression. Cell Death Dis (2018) 9:124. doi: 10.1038/s41419-017-0129-x
13. Tuncel G, Kalkan R. Importance of m N (6)-Methyladenosine (m (6)A) RNA Modification in Cancer. Med Oncol (2019) 36:36. doi: 10.1007/s12032-019-1260-6
14. Malla S, Melguizo-Sanchis D, Aguilo F. Steering Pluripotency and Differentiation With N (6)-Methyladenosine RNA Modification. Biochim Biophys Acta Gene Regul Mech (2019) 1862:394–402. doi: 10.1016/j.bbagrm.2018.10.013
15. Zhang Z, Luo K, Zou Z, Qiu M, Tian J, Sieh L, et al. Genetic Analyses Support the Contribution of mRNA N (6)-Methyladenosine (M (6)A) Modification to Human Disease Heritability. Nat Genet (2020) 52(9):939–49. doi: 10.1038/s41588-020-0644-z
16. Wang S, Sun C, Li J, Zhang E, Ma Z, Xu W, et al. Roles of RNA Methylation by Means of N (6)-Methyladenosine (m (6)A) in Human Cancers. Cancer Lett (2017) 408:112–20. doi: 10.1016/j.canlet.2017.08.030
17. Li HB, Tong J, Zhu S, Batista PJ, Duffy EE, Zhao J, et al. m (6)A mRNA Methylation Controls T Cell Homeostasis by Targeting the IL-7/STAT5/SOCS Pathways. Nature (2017) 548:338–42. doi: 10.1038/nature23450
18. Wang H, Hu X, Huang M, Liu J, Gu Y, Ma L, et al. Mettl3-Mediated mRNA m (6)A Methylation Promotes Dendritic Cell Activation. Nat Commun (2019) 10:1898. doi: 10.1038/s41467-019-09903-6
19. Han D, Liu J, Chen C, Dong L, Liu Y, Chang R, et al. Anti-Tumour Immunity Controlled Through mRNA m6A Methylation and YTHDF1 in Dendritic Cells. Nature (2019) 566(7751):270–4. doi: 10.1038/s41586-019-0916-x
20. Yang S, Wei J, Cui YH, Park G, Shah P, Deng Y, et al. m (6)A mRNA Demethylase FTO Regulates Melanoma Tumorigenicity and Response to Anti-PD-1 Blockade. Nat Commun (2019) 10:2782. doi: 10.1038/s41467-019-10669-0
21. Mariathasan S, Turley SJ, Nickles D, Castiglioni A, Yuen K, Wang YL, et al. TGF Beta Attenuates Tumour Response to PD-L1 Blockade by Contributing to Exclusion of T Cells. Nature (2018) 554(7693):544–8. doi: 10.1038/nature25501
22. Rosenberg JE, Hoffman-Censits J, Powles T, van der Heijden MS, Balar AV, Necchi A, et al. Atezolizumab in Patients With Locally Advanced and Metastatic Urothelial Carcinoma Who Have Progressed Following Treatment With Platinum-Based Chemotherapy: A Single-Arm, Multicentre, Phase 2 Trial. Lancet (2016) 387:1909–20. doi: 10.1016/S0140-6736(16)00561-4
23. Shi HL, Wei JB, He C. Where, When, and How: Context-Dependent Functions of RNA Methylation Writers, Readers, and Erasers. Mol Cell (2019) 74:640–50. doi: 10.1016/j.molcel.2019.04.025
24. Yang Y, Hsu PJ, Chen YS, Yang YG. Dynamic Transcriptomic m (6)A Decoration: Writers, Erasers, Readers and Functions in RNA Metabolism. Cell Res (2018) 28:616–24. doi: 10.1038/s41422-018-0040-8
25. Wilkerson MD, Hayes DN. ConsensusClusterPlus: A Class Discovery Tool With Confidence Assessments and Item Tracking. Bioinformatics (2010) 26:15721573. doi: 10.1093/bioinformatics/btq170
26. Mo Q, Nikolos F, Chen F, Tramel Z, Lee YC, Hayashi K, et al. Prognostic Power of a Tumor Differentiation Gene Signature for Bladder Urothelial Carcinomas. J Natl Cancer Inst (2018) 110:448–59. doi: 10.1093/jnci/djx243
27. Damrauer JS, Hoadley KA, Chism DD, Fan C, Tiganelli CJ, Wobker SE, et al. Intrinsic Subtypes of High-Grade Bladder Cancer Reflect the Hallmarks of Breast Cancer Biology. Proc Natl Acad Sci USA (2014) 111:3110–5. doi: 10.1073/pnas.1318376111
28. Choi W, Porten S, Kim S, Willis D, Plimack ER, Hoffman-Censits J, et al. Identification of Distinct Basal and Luminal Subtypes of Muscle-Invasive Bladder Cancer With Different Sensitivities to Frontline Chemotherapy. Cancer Cell (2014) 25:152–65. doi: 10.1016/j.ccr.2014.01.009
29. Marzouka NA, Eriksson P, Rovira C, Liedberg F, Sjodahl G, Hoglund M. A Validation and Extended Description of the Lund Taxonomy for Urothelial Carcinoma Using the TCGA Cohort. Sci Rep (2018) 8(1):3737. doi: 10.1038/s41598-018-22126-x
30. Robertson AG, Kim J, Al-Ahmadie H, Bellmunt J, Guo G, Cherniack AD, et al. Comprehensive Molecular Characterization of Muscle-Invasive Bladder Cancer. Cell (2017) 171:540–56.e525. doi: 10.1016/j.cell.2017.09.007
31. Rebouissou S, Bernard-Pierrot I, de Reynies A, Lepage ML, Krucker C, Chapeaublanc E, et al. EGFR as a Potential Therapeutic Target for a Subset of Muscle-Invasive Bladder Cancers Presenting a Basal-Like Phenotype. Sci Trans Med (2014) 6(244):244ra91. doi: 10.1126/scitranslmed.3008970
32. Kamoun A, de Reynies A, Allory Y, Sjodahl G, Robertson AG, Seiler R, et al. A Consensus Molecular Classification of Muscle-Invasive Bladder Cancer. Eur Urol (2020) 77:420–33. doi: 10.1016/j.eururo.2019.09.006
33. Jia Q, Wu W, Wang Y, Alexander PB, Sun C, Gong Z, et al. Local Mutational Diversity Drives Intratumoral Immune Heterogeneity in non-Small Cell Lung Cancer. Nat Commun (2018) 9:5361. doi: 10.1038/s41467-018-07767-w
34. Newman AM, Liu CL, Green MR, Gentles AJ, Feng W, Xu Y, et al. Robust Enumeration of Cell Subsets From Tissue Expression Profiles. Nat Methods (2015) 12:453–7. doi: 10.1038/nmeth.3337
35. Ritchie ME, Phipson B, Wu D, Hu Y, Law CW, Shi W, et al. Limma Powers Differential Expression Analyses for RNA-Sequencing and Microarray Studies. Nucleic Acids Res (2015) 43:e47. doi: 10.1093/nar/gkv007
36. Zhou Y, Zhou B, Pache L, Chang M, Khodabakhshi AH, Tanaseichuk O, et al. Metascape Provides a Biologist-Oriented Resource for the Analysis of Systems-Level Datasets. Nat Commun (2019) 10:1523. doi: 10.1038/s41467-019-09234-6
37. Castro MA, de Santiago I, Campbell TM, Vaughn C, Hickey TE, Ross E, et al. Regulators of Genetic Risk of Breast Cancer Identified by Integrative Network Analysis. Nat Genet (2016) 48:12–21. doi: 10.1038/ng.3458
38. Yu G, Wang LG, Han Y, He QY. clusterProfiler: An R Package for Comparing Biological Themes Among Gene Clusters. OMICS (2012) 16:284–7. doi: 10.1089/omi.2011.0118
39. Zeng Q, Liu J, Cao P, Li J, Liu X, Fan X, et al. Inhibition of REDD1 Sensitizes Bladder Urothelial Carcinoma to Paclitaxel by Inhibiting Autophagy. Clin Cancer Res (2018) 24:445–59. doi: 10.1158/1078-0432.CCR-17-0419
40. Hazra A, Gogtay N. Biostatistics Series Module 3: Comparing Groups: Numerical Variables. Indian J Dermatol (2016) 61:251–60. doi: 10.4103/0019-5154.182416
41. DeGraff DJ, Cates JM, Mauney JR, Clark PE, Matusik RJ, Adam RM. When Urothelial Differentiation Pathways Go Wrong: Implications for Bladder Cancer Development and Progression. Urol Oncol Seminars Original Invest (2013) 31:802–11. doi: 10.1016/j.urolonc.2011.07.017
42. Choi W, Czemiak B, Ochoa A, Su XP, Siefker-Radtke A, Dinney C, et al. Intrinsic Basal and Luminal Subtypes of Muscle-Invasive Bladder Cancer. Nat Rev Urol (2014) 11:400–10. doi: 10.1038/nrurol.2014.129
43. Eriksson P, Aine M, Veerla S, Liedberg F, Sjodahl G, Hoglund M. Molecular Subtypes of Urothelial Carcinoma are Defined by Specific Gene Regulatory Systems. BMC Med Genomics (2015) 8:25. doi: 10.1186/s12920-015-0101-5
44. Breyer J, Wirtz RM, Laible M, Schlombs K, Erben P, Kriegmair MC, et al. ESR1, ERBB2, and Ki67 mRNA Expression Predicts Stage and Grade of non-Muscle-Invasive Bladder Carcinoma (NMIBC). Virchows Archiv (2016) 469:547–52. doi: 10.1007/s00428-016-2002-1
45. Dadhania V, Zhang M, Zhang L, Bondaruk J, Majewski T, Siefker-Radtke A, et al. Meta-Analysis of the Luminal and Basal Subtypes of Bladder Cancer and the Identification of Signature Immunohistochemical Markers for Clinical Use. Ebiomedicine (2016) 12:105–17. doi: 10.1016/j.ebiom.2016.08.036
46. Jones RT, Felsenstein KM, Theodorescu D. Pharmacogenomics: Biomarker-Directed Therapy for Bladder Cancer. Urol Clinics North Am (2016) 43:77–+. doi: 10.1016/j.ucl.2015.08.007
47. Lim S, Koh MJ, Jeong HJ, Cho NH, Choi YD, Cho DY, et al. Fibroblast Growth Factor Receptor 1 Overexpression Is Associated With Poor Survival in Patients With Resected Muscle Invasive Urothelial Carcinoma. Yonsei Med J (2016) 57:831–9. doi: 10.3349/ymj.2016.57.4.831
48. Liu RY, Zeng YY, Lei Z, Wang LQ, Yang HP, Liu ZY, et al. JAK/STAT3 Signaling is Required for TGF-Beta-Induced Epithelial-Mesenchymal Transition in Lung Cancer Cells. Int J Oncol (2014) 44:1643–51. doi: 10.3892/ijo.2014.2310
49. Gu GY, Gao TH, Zhang L, Chen XY, Pang Q, Wang YN, et al. NKAP Alters Tumor Immune Microenvironment and Promotes Glioma Growth via Notch1 Signaling. J Exp Clin Cancer Res (2019) 38(1):291. doi: 10.1186/s13046-019-1281-1
50. Karn T, Denkert C, Weber KE, Holtrich U, Hanusch C, Sinn BV, et al. Tumour Mutational Burden and Immune Infiltration as Independent Predictors of Response to Neoadjuvant Immune Checkpoint Inhibition in Early TNBC in GeparNuevo. Ann Oncol (2020) 31:S58–8. doi: 10.1016/j.annonc.2020.03.230
51. Gouin KH 3rd, Ing N, Plummer JT, Rosser CJ, Ben B, Cheikh C, et al. An N-Cadherin 2 Expressing Epithelial Cell Subpopulation Predicts Response to Surgery, Chemotherapy and Immunotherapy in Bladder Cancer. Nat Commun (2021) 12(1):4906. doi: 10.1038/s41467-021-25103-7
52. Chen X, Xu R, He D, Zhang Y, Chen H, Zhu Y, et al. CD8+ T Effector and Immune Checkpoint Signatures Predict Prognosis and Responsiveness to Immunotherapy in Bladder Cancer. Oncogene (2021) 40(43):6223–34. doi: 10.1038/s41388-021-02019-6
53. Liu X, Liu J, Xiao W, Zeng Q, Bo H, Zhu Y, et al. SIRT1 Regulates N (6) -Methyladenosine RNA Modification in Hepatocarcinogenesis by Inducing RANBP2-Dependent FTO SUMOylation. Hepatology (2020) 72(6):2029–50. doi: 10.1002/hep.31222
54. Liu J, Dou X, Chen C, Chen C, Liu C, Xu MM, et al. N (6)-Methyladenosine of Chromosome-Associated Regulatory RNA Regulates Chromatin State and Transcription. Science (2020) 367(6477):580–6. doi: 10.1126/science.aay6018
55. Zhou Z, Lv J, Yu H, Han J, Yang X, Feng D, et al. Mechanism of RNA Modification N6-Methyladenosine in Human Cancer. Mol Cancer (2020) 19(1):104. doi: 10.1186/s12943-020-01216-3
56. Huang H, Weng H, Chen J. m (6)A Modification in Coding and Non-Coding RNAs: Roles and Therapeutic Implications in Cancer. Cancer Cell (2020) 37:270–88. doi: 10.1016/j.ccell.2020.02.004
57. Zhang B, Wu Q, Li B, Wang D, Wang L, Zhou YL. m (6)A Regulator-Mediated Methylation Modification Patterns and Tumor Microenvironment Infiltration Characterization in Gastric Cancer. Mol Cancer (2020) 19:53. doi: 10.1186/s12943-020-01170-0
58. He L, Li H, Wu A, Peng Y, Shu G, Yin G. Functions of N6-Methyladenosine and its Role in Cancer. Mol Cancer (2019) 18:176. doi: 10.1186/s12943-019-1109-9
59. Mauer J, Luo X, Blanjoie A, Jiao X, Grozhik AV, Patil DP, et al. Reversible Methylation of m (6)Am in the 5’ Cap Controls mRNA Stability. Nature (2017) 541:371–5. doi: 10.1038/nature21022
60. Fu Y, Jia G, Pang X, Wang RN, Wang X, Li CJ, et al. FTO-Mediated Formation of N6-Hydroxymethyladenosine and N6-Formyladenosine in Mammalian RNA. Nat Commun (2013) 4:1798. doi: 10.1038/ncomms2822
61. Wei J, Liu F, Lu Z, Fei Q, Ai Y, He PC, et al. Differential m (6)A, m (6)Am, and m (1)A Demethylation Mediated by FTO in the Cell Nucleus and Cytoplasm. Mol Cell (2018) 71(6):973–85.e975. doi: 10.1016/j.molcel.2018.08.011
62. Zhang X, Wei LH, Wang Y, Xiao Y, Liu J, Zhang W, et al. Structural Insights Into FTO’s Catalytic Mechanism for the Demethylation of Multiple RNA Substrates. Proc Natl Acad Sci USA (2019) 116(8):2919–24. doi: 10.1073/pnas.1820574116
63. Sendinc E, Valle-Garcia D, Dhall A, Chen H, Henriques T, Navarrete-Perea J, et al. PCIF1 Catalyzes M6am mRNA Methylation to Regulate Gene Expression. Mol Cell (2019) 75:620–30.e629. doi: 10.1016/j.molcel.2019.05.030
64. Boulias K, Toczydlowska-Socha D, Hawley BR, Liberman N, Takashima K, Zaccara S, et al. Identification of the m (6)Am Methyltransferase PCIF1 Reveals the Location and Functions of m (6)Am in the Transcriptome. Mol Cell (2019) 75(3):631–43.e638. doi: 10.1016/j.molcel.2019.06.006
65. Akichika S, Hirano S, Shichino Y, Suzuki T, Nishimasu H, Ishitani R, et al. Cap-Specific Terminal N (6)-Methylation of RNA by an RNA Polymerase II-Associated Methyltransferase. Science (2019) 363(6423):eaav0080. doi: 10.1126/science.aav0080
Keywords: bladder cancer, N6-methyladenosine, tumor immune microenvironment, anti-PD-L1, immune checkpoint inhibitors
Citation: Deng H, Tang F, Zhou M, Shan D, Chen X and Cao K (2022) Identification and Validation of N6-Methyladenosine-Related Biomarkers for Bladder Cancer: Implications for Immunotherapy. Front. Oncol. 12:820242. doi: 10.3389/fonc.2022.820242
Received: 22 November 2021; Accepted: 07 February 2022;
Published: 02 March 2022.
Edited by:
Riccardo Tellini, Careggi University Hospital, ItalyReviewed by:
Liuer He, Beijing Hospital, ChinaCopyright © 2022 Deng, Tang, Zhou, Shan, Chen and Cao. This is an open-access article distributed under the terms of the Creative Commons Attribution License (CC BY). The use, distribution or reproduction in other forums is permitted, provided the original author(s) and the copyright owner(s) are credited and that the original publication in this journal is cited, in accordance with accepted academic practice. No use, distribution or reproduction is permitted which does not comply with these terms.
*Correspondence: Xingyu Chen, eGluZ3l1Y2hlbkBjc3UuZWR1LmNu; Ke Cao, Y3N1Y2Fva2VAMTYzLmNvbQ==; Y3N1Y2Fva2VAY3N1LmVkdS5jbg==
Disclaimer: All claims expressed in this article are solely those of the authors and do not necessarily represent those of their affiliated organizations, or those of the publisher, the editors and the reviewers. Any product that may be evaluated in this article or claim that may be made by its manufacturer is not guaranteed or endorsed by the publisher.
Research integrity at Frontiers
Learn more about the work of our research integrity team to safeguard the quality of each article we publish.