
95% of researchers rate our articles as excellent or good
Learn more about the work of our research integrity team to safeguard the quality of each article we publish.
Find out more
ORIGINAL RESEARCH article
Front. Oncol. , 27 April 2022
Sec. Cancer Immunity and Immunotherapy
Volume 12 - 2022 | https://doi.org/10.3389/fonc.2022.812786
This article is part of the Research Topic Role of Non-Coding RNA in Gastrointestinal Cancer Tumor Immune Microenvironment and Anticancer Therapy View all 5 articles
 Zikang He1
 Hongfeng Liu1Huilin Guan2Jinli Ji1
 Ying Jiang1Naiwen Zhang1
 Zheyao Song1Xingyun Wang1Ping Shen1Huan Wang1
 Rongjun Cui1*
Digestive system pan-cancer is a general term for digestive system tumors including colorectal carcinoma (CRC), esophageal carcinoma (ESCA), stomach adenocarcinoma (STAD), and liver hepatocellular carcinoma (LIHC). Since the anatomical location, function and metabolism are closely related, there may be similarities in development and progression of these tumors. Hypoxia is the consequence of an imbalance between oxygen demand and supply, and intracellular hypoxia is associated with malignant progression, treatment resistance, and poor prognosis in tumors. Therefore, an urgent and challenging task is to investigate the molecular mechanisms associated with hypoxia in digestive system pan-cancer for the prognosis and treatment of digestive tract tumors. In this study, we identified 18 hypoxia-related lncRNAs (HRlncRNAs) by co-expression analysis between hypoxia genes and lncRNAs from digestive system pan-cancer. Six HRlncRNAs were then obtained using lasso regression and multivariate cox analysis to construct a prognostic model. Next, the Akaike information criterion (AIC) values for 3-year receiver operating curve (ROC) were counted to determine the cut-off point and establish an optimal model to distinguish between high- or low-risk groups among patients with digestive system pan-cancer. To evaluate the stability of the prognosis model, we validated it in terms of survival outcomes, clinicopathological stage, tumor-infiltrating immune cells, immune checkpoint inhibitors (ICIs) and anticancer drugs sensitivity. The results suggested that high- risk group had a worse prognosis and a more positive association with tumor-infiltrating immune cells such as B cells, cancer-associated fibroblasts, endothelial cells, monocytes, macrophages and bone marrow dendritic cells in digestive system pan-cancer. Immune checkpoint inhibitors (ICIs) related biomarkers discovered that high-risk group was positively correlated with high expression of HAVCR2 in digestive system pan-cancer. The anticancer drugs sensitivity analysis showed that the high-risk group was associated with the lower half-inhibitory centration (IC50) of Imatinib in digestive system pan-cancer. In conclusion, the prognostic model of HRlncRNAs showed a promising clinical prediction value and may provide a useful reference for the diagnosis and treatment of the digestive system tumors.
Digestive system pan-cancer is a general term for malignant tumors of the digestive system, which mainly includes esophageal carcinoma (ESCA), stomach adenocarcinoma (STAD), liver hepatocellular carcinoma (LIHC), colorectal carcinoma (CRC). Malignant tumors of the digestive system are by far the most common cause of cancer death (1), and are characterized by the lack of obvious early symptoms, difficulty in clinical diagnosis, and extremely low survival rates at late stages. According to 2018 statistics, malignant tumors of the digestive system accounted for more than a quarter (26.3%) of the global cancer incidence and more than a third (35.4%) of all cancer-related death (2). However, clinical treatment of digestive system malignancies has yielded some achievements, particular with immune checkpoint inhibitors (ICIs) therapies. For instance, the binding of programmed death 1 (PD-1) to programmed death ligand 1 (PD-L1) suppresses the immune microenvironment surrounding tumor tissue, leading to a downregulation of specific T-cell activity and contributing to immune escape. Nivolumab and Pembrolizumab, as PD-1 and PD-L1 inhibitors, can block the pathway and activate the anti-tumor immune response, thus curbing tumor growth (3).
Hypoxia, and in particular hypoxia-inducible factor 1 alpha (HIF-1α) is a common feature of solid tumors and is involved in metabolic reprogramming of tumors, stem cell characteristics, angiogenesis, extracellular matrix organization and metastasis of cancers (4–7). Moreover, because of abnormal proliferation of tumor cells resulting in increased oxygen consumption, the hypoxic environment promotes the generation of resistance to cancer therapy, which is strongly related to poor clinical prognosis (8, 9). Hypoxia is known to be inextricably linked to the immune microenvironment (TME), which affects the effectiveness of immunotherapy through a variety of mechanisms, including innate and adaptive immunity. Hypoxia contributes to the evasion of innate immunity by increasing the expression of the metalloproteinase ADAM10 in tumor cells in dependence on the accumulation of HIF-1α (10). In adaptive immunity, hypoxia leads to reduced differentiation of CD4+ T effector cells and enhanced the suppressive capacity of regulatory T cells (11). Therefore, a critical element for the benefit of tumor immunotherapy is the amelioration of hypoxic conditions.
Long non-coding RNAs (lncRNAs) are RNA molecules with transcripts greater than 200 nucleotides, which are not directly involved in gene coding and protein synthesis. However, they can regulate gene expression at the epigenetic, transcriptional, and post-transcriptional levels, and thus modulate tumor cell promoting or suppressing effects (12). Previous studies have shown that lncRNAs, which also can induce hypoxic signaling, facilitate the adaptation of tumor cells to the hypoxic environment. For instance, Zhang et al. found that lncRNA NEAT1 promotes hepatocellular carcinoma growth by regulating miR-199a-3p/UCK2 under hypoxic conditions (13). Zhu et al. suggested that hypoxia-induced cisplatin resistance can be controlled by regulating lncRNA EMS/miR-758-3p/WTAP axis in esophageal cancer (14). LncRNA CPS1-IT1 inhibits epithelial mesenchymal transition (EMT) and metastasis of colorectal cancer by inactivating HIF-1α and suppressing hypoxia-induced autophagy (15). LncRNA PCGEM, serves as a hypoxia-induced factor, promotes the proliferation and migration of gastric cancer by regulating SNAI1 (16). Recent researches focused on hypoxia-related lncRNAs (HRlncRNAs) promoting tumor growth and metastasis by enhancing certain immunogenic traits of TME and driving immune escapes (17, 18). No research has yet been conducted to analyze the application values of HRlncRNAs for clinical immunotherapy from the viewpoint of the digestive system pan-cancer.
In this study, the prognostic model was constructed using six HRlncRNAs from pan-cancer of the digestive system by machine learning. Moreover, we assessed their prognostic value in terms of survival outcomes, clinical characteristics, immune tumor invasion and anticancer drugs sensitivity, providing a new perspective for the diagnosis and treatment of digestive system tumors.
We downloaded the transcriptome profiling data of four digestive system carcinomas from The Cancer Genome Atlas (TCGA) database (https://portal.gdc.cancer.gov/), including 11 normal and 160 tumor of samples in ESCA, 32 normal and 375 tumor of samples from STAD, 50 normal and 374 tumors of samples from LIHC, 51normal and 641 tumor of samples from CRC. LncRNAs from each of the four tumors were extracted using the Perl and R languages. In addition, we downloaded and combined the complete clinical information of patient with four digestive tumors from the TCGA database. In screening of clinical information, we excluded samples with a follow-up time of less than 50 days. Finally, 1368 clinical samples of digestive pan-cancer were included for subsequence analysis.
In the validation phase of clinical outcomes, we randomly divided the 1368 clinical data into training and validation sets using “caret” package in the R languages, and performed reproducibility analysis, respectively.
As the data involved in this research were obtained from TCGA database and strictly follow TCGA publication guidelines (http://cancergenome.nih.gov/abouttcga/policies/publicationguidelines), the approval of the ethics committee was not required.
The hypoxia gene sets were downloaded from Gene Set Enrichment Analysis website (19) (GSEA, http://www.gsea-msigdb.org/gsea/index.jsp). Pearson’s correlation coefficient was used to calculate the correlation between lncRNAs and hypoxia genes in the four digestive system carcinomas, respectively. The square of correlation coefficient |R2| > 0.4 and P < 0.001 was considered being HRlncRNAs. Next, co-expressed HRlncRNAs were obtained by intersection of lncRNAs of those using Draw Venn Diagram (http://bioinformatics.psb.ugent.be/webtools/Venn/). Moreover, we combined and normalized the expression values of co-expressed HRlncRNA samples from the four digestive malignancies for the subsequent comprehensive analysis of digestive pan-cancer.
The univariate cox analysis was first performed on the co-expressed HRlncRNAs. Subsequently, HRlncRNAs with P < 0.05 were included into least absolute shrinkage and selection operator (Lasso) regression and multivariate cox analysis, as well as for construction of the model. The AUC values of the model were also calculated and were drawn as 1-, 2-, and 3-year ROC curves. When the curve reached the highest point, indicating the maximum AUC value, the calculation procedure was terminated while the model was taken as the optimal candidate. We calculated the risk score of all clinical cases using the constructed risk model and the calculation formula was as follows: Risk Score=. In which, β stand for the correlation coefficient of HRlncRNA. The AIC value of the 3-year ROC curve were assessed to determine the maximum inflection point, which was considered as the cut-off point (0.935) to distinguish between the high- or low-risk groups.
To validate whether the cut-off point was plausible, we performed Kaplan-Meier analysis to illustrate the survival difference in the high- or low-risk groups, and plotted the survival curve. Also, the chi-square test was performed to analyze the relationship between the prognostic model and the clinicopathological characteristics. Wilcoxon signed-rank test was used to calculate the risk score differences among different these clinicopathological characteristics. Univariate and multivariate cox regression analyses were then conducted to assess whether the prognostic model could be used as an independent predictor of clinical prognosis.
To analyze the relationship between the risk model and tumor-infiltrating immune cells, we calculated the immune-cells infiltration of samples from the digestive pan-cancer dataset using seven methods, including XCELL, TIMER, QuanTIseq, MCPcounter, EPIC, CIBERSORT-ABS and CIBERSORT. The Wilcoxon signed-rank test was used to analyze the difference in the content of immune infiltrating cells between the high- and low-risk groups of the constructed model. Spearman correlation analysis was performed to analyze the relationship between the risk scores and the tumor-infiltrated immune cells. The threshold of significance was set at p <0.05.
To investigate the relationship between the risk model and the expression level of ICIs-related genes, such as HAVCR2, CD274, PDCD1, CTLA4, TIGIT, and LAG3. We utilized the “ggstatsplot” package of R software and violin plots for visualization.
To evaluate the efficacy of the risk model in the clinical treatments for digestive system pan-cancer, we analyzed the correlation between prognostic models and the IC50 of commonly administered anticancer drugs for the ESCA, STAD, LIHC and CRC datasets in the TCGA project, respectively. The anti-tumor drugs such as Imatinib, Doxorubicin, Mitomycin, Gemcitabine and Cisplatin are recommended for digestive system cancers treatment by NCCN guidelines. The difference in the IC50 between the high- and low-risk groups was compared by Wilcoxon signed-rank test and the results are shown as box drawings obtained using “pRRophetic” and “ggplot2” packages of R software.
First, the RNA transcriptome data were downloaded from TCGA database, including ESCA, STAD, LIHC and CRC. Next, co-expression analysis was performed between known 243 hypoxia genes and lncRNAs of four digestive system tumors. 1133 HRlncRNAs were identified in ESCA. For STAD, 866 HRlncRNAs were identified. 850 HRlncRNAs were identified in LIHC. For CRC, 927 HRlncRNAs were identified. It intersected them in four digestive system cancers, resulting in 18 HRlncRNAs overlapping (|R2| > 0.4, P < 0.001).
We first combined the expression of 18 HRlncRNAs normalized to four digestive cancers (Figure 1). According to the result of univariate cox analysis, 11 HRlncRNAs had significantly prognostic value for the patients with digestive system pan-cancer (P < 0.05, Figure 2A). Subsequently, six HRlncRNAs were included in the prognostic model by the Lasso regression and multivariate cox analysis (Figure 2B and Table 1). The expression of HRlncRNAs weighted by the multivariate cox regression coefficient were transformed into a risk score as follows: risk score = (0.045*expression of LUCAT1) + (0.194*expression of MIR4435-2HG) + (0.010*expression of LINC01711) + (0.033*expression of AP000695.2) + (0.030*expression of ADAMTS9-AS2) + (0.049*expression of AC087521.1).
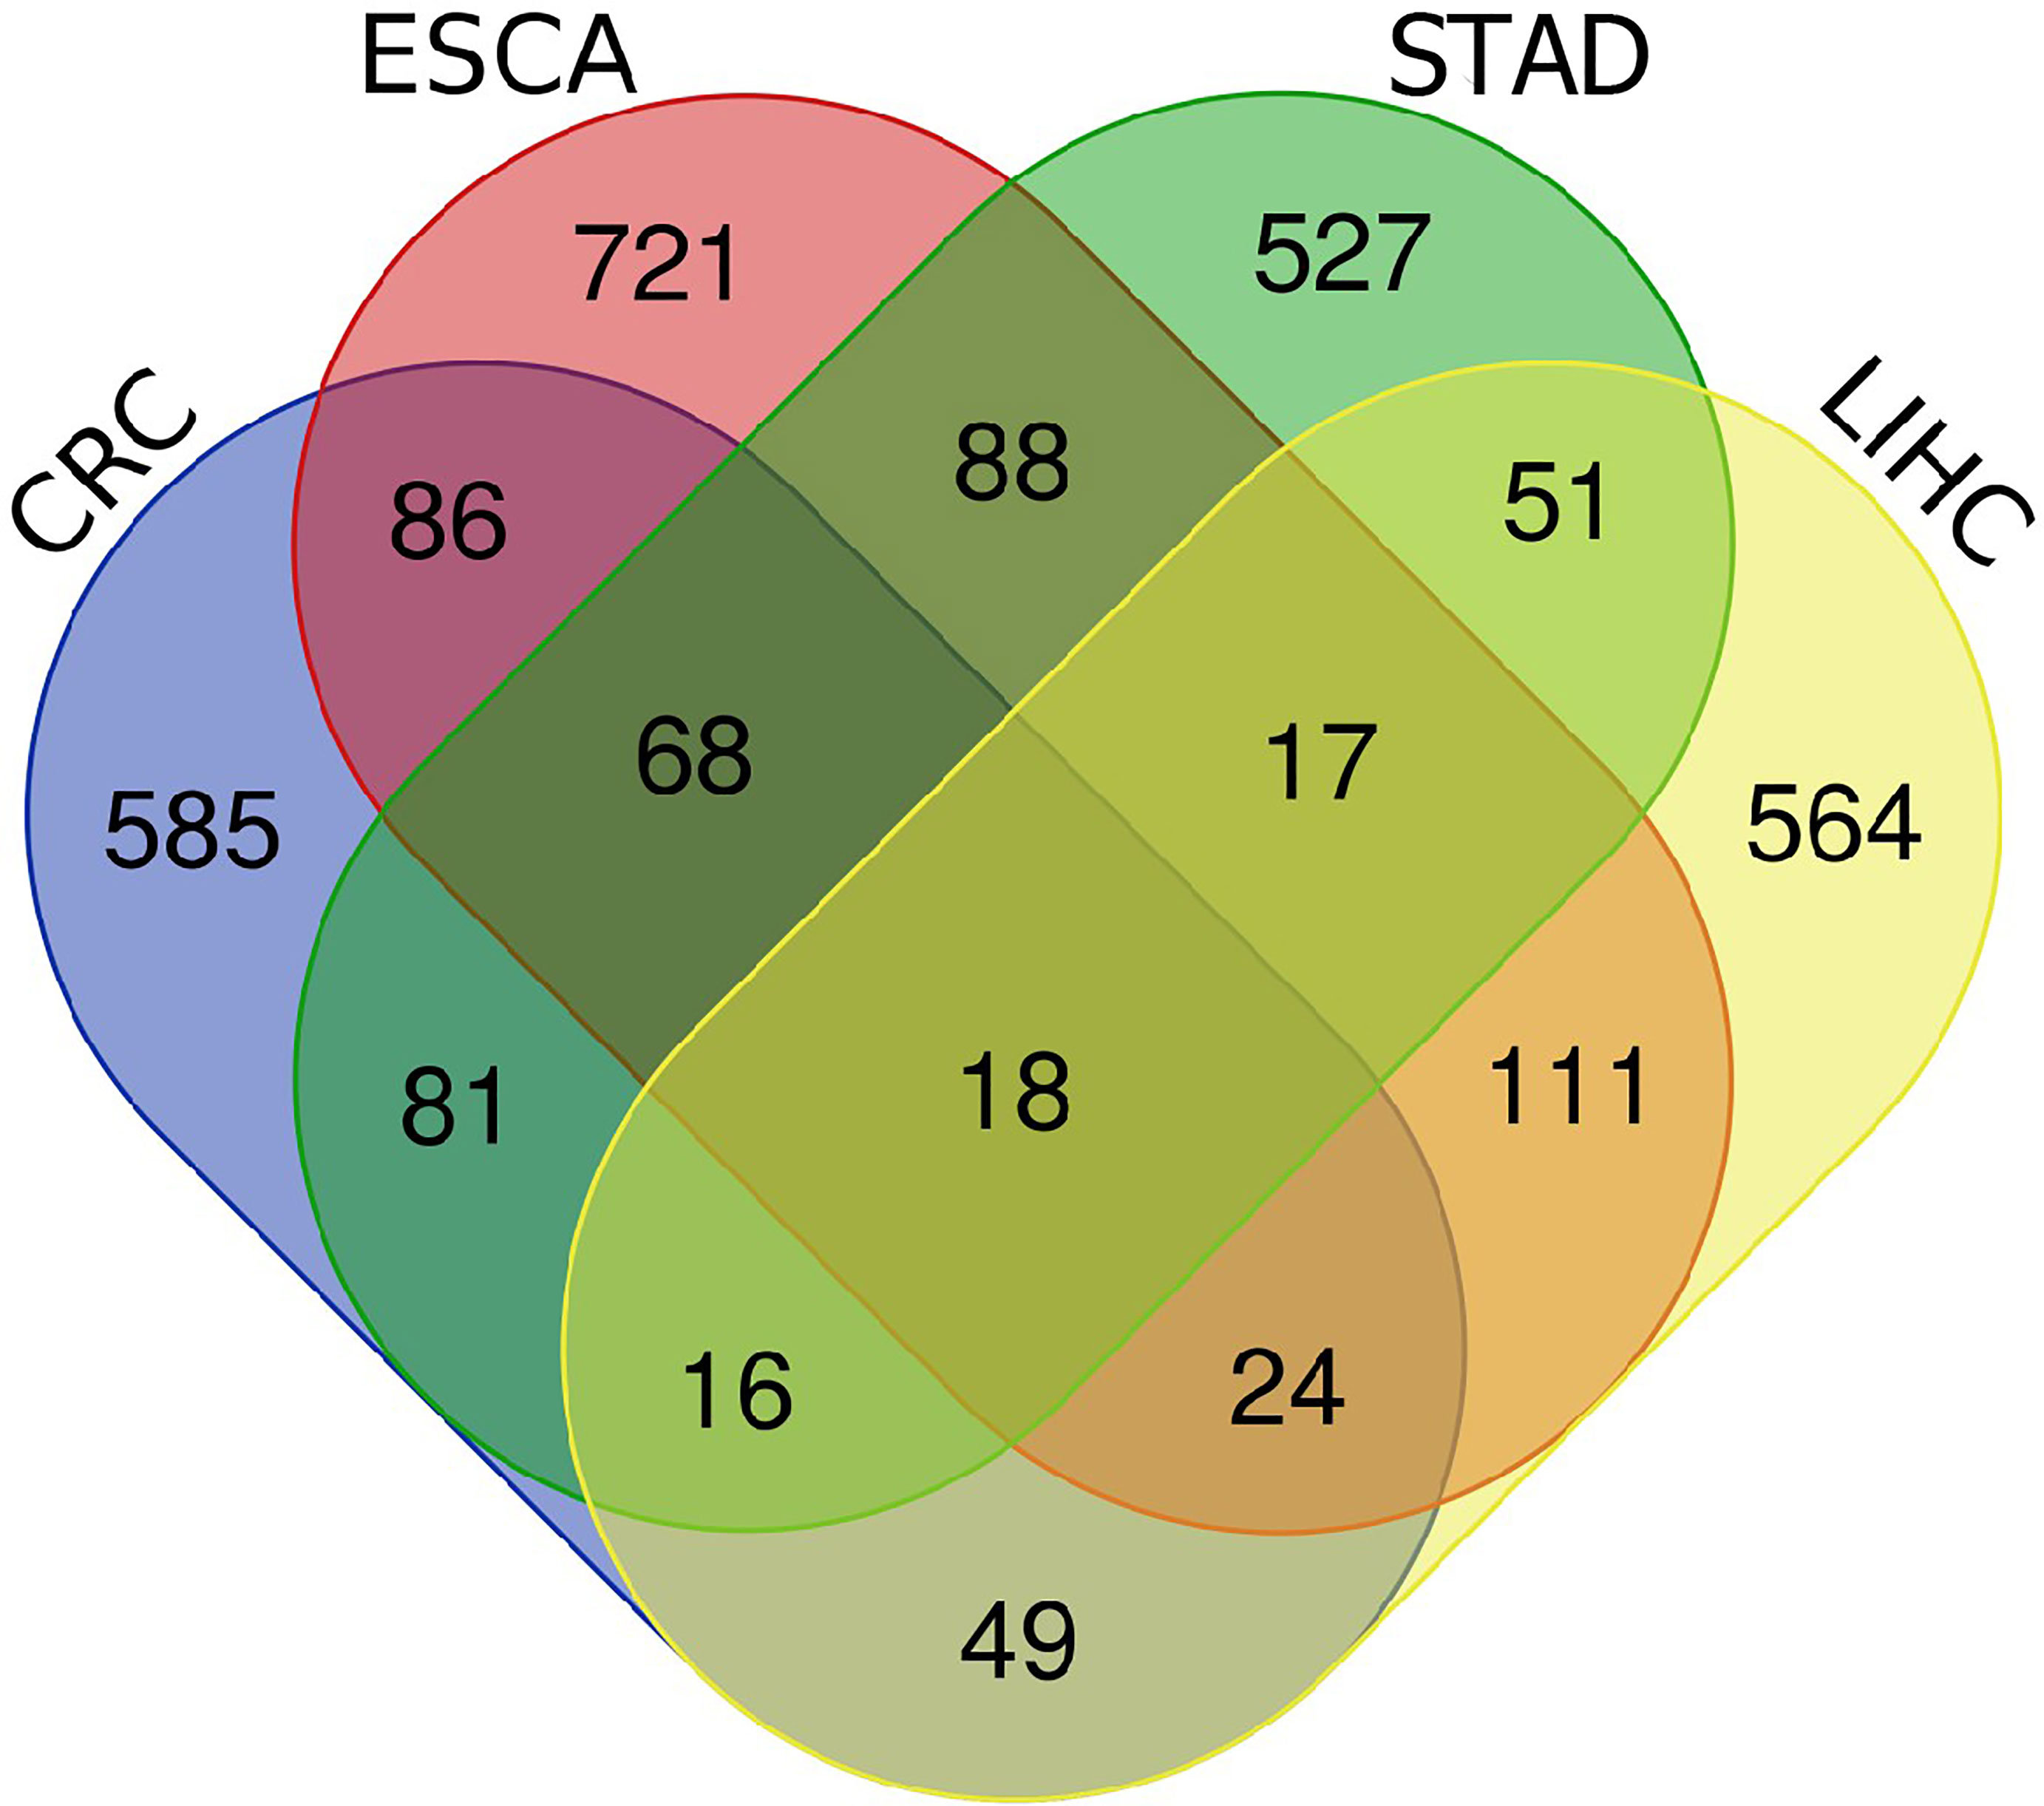
Figure 1 The venn diagrams of four digestive system cancers. A total of 18 HRlncRNAs were obtained from CRC, ESCA, STAD and LIHC.
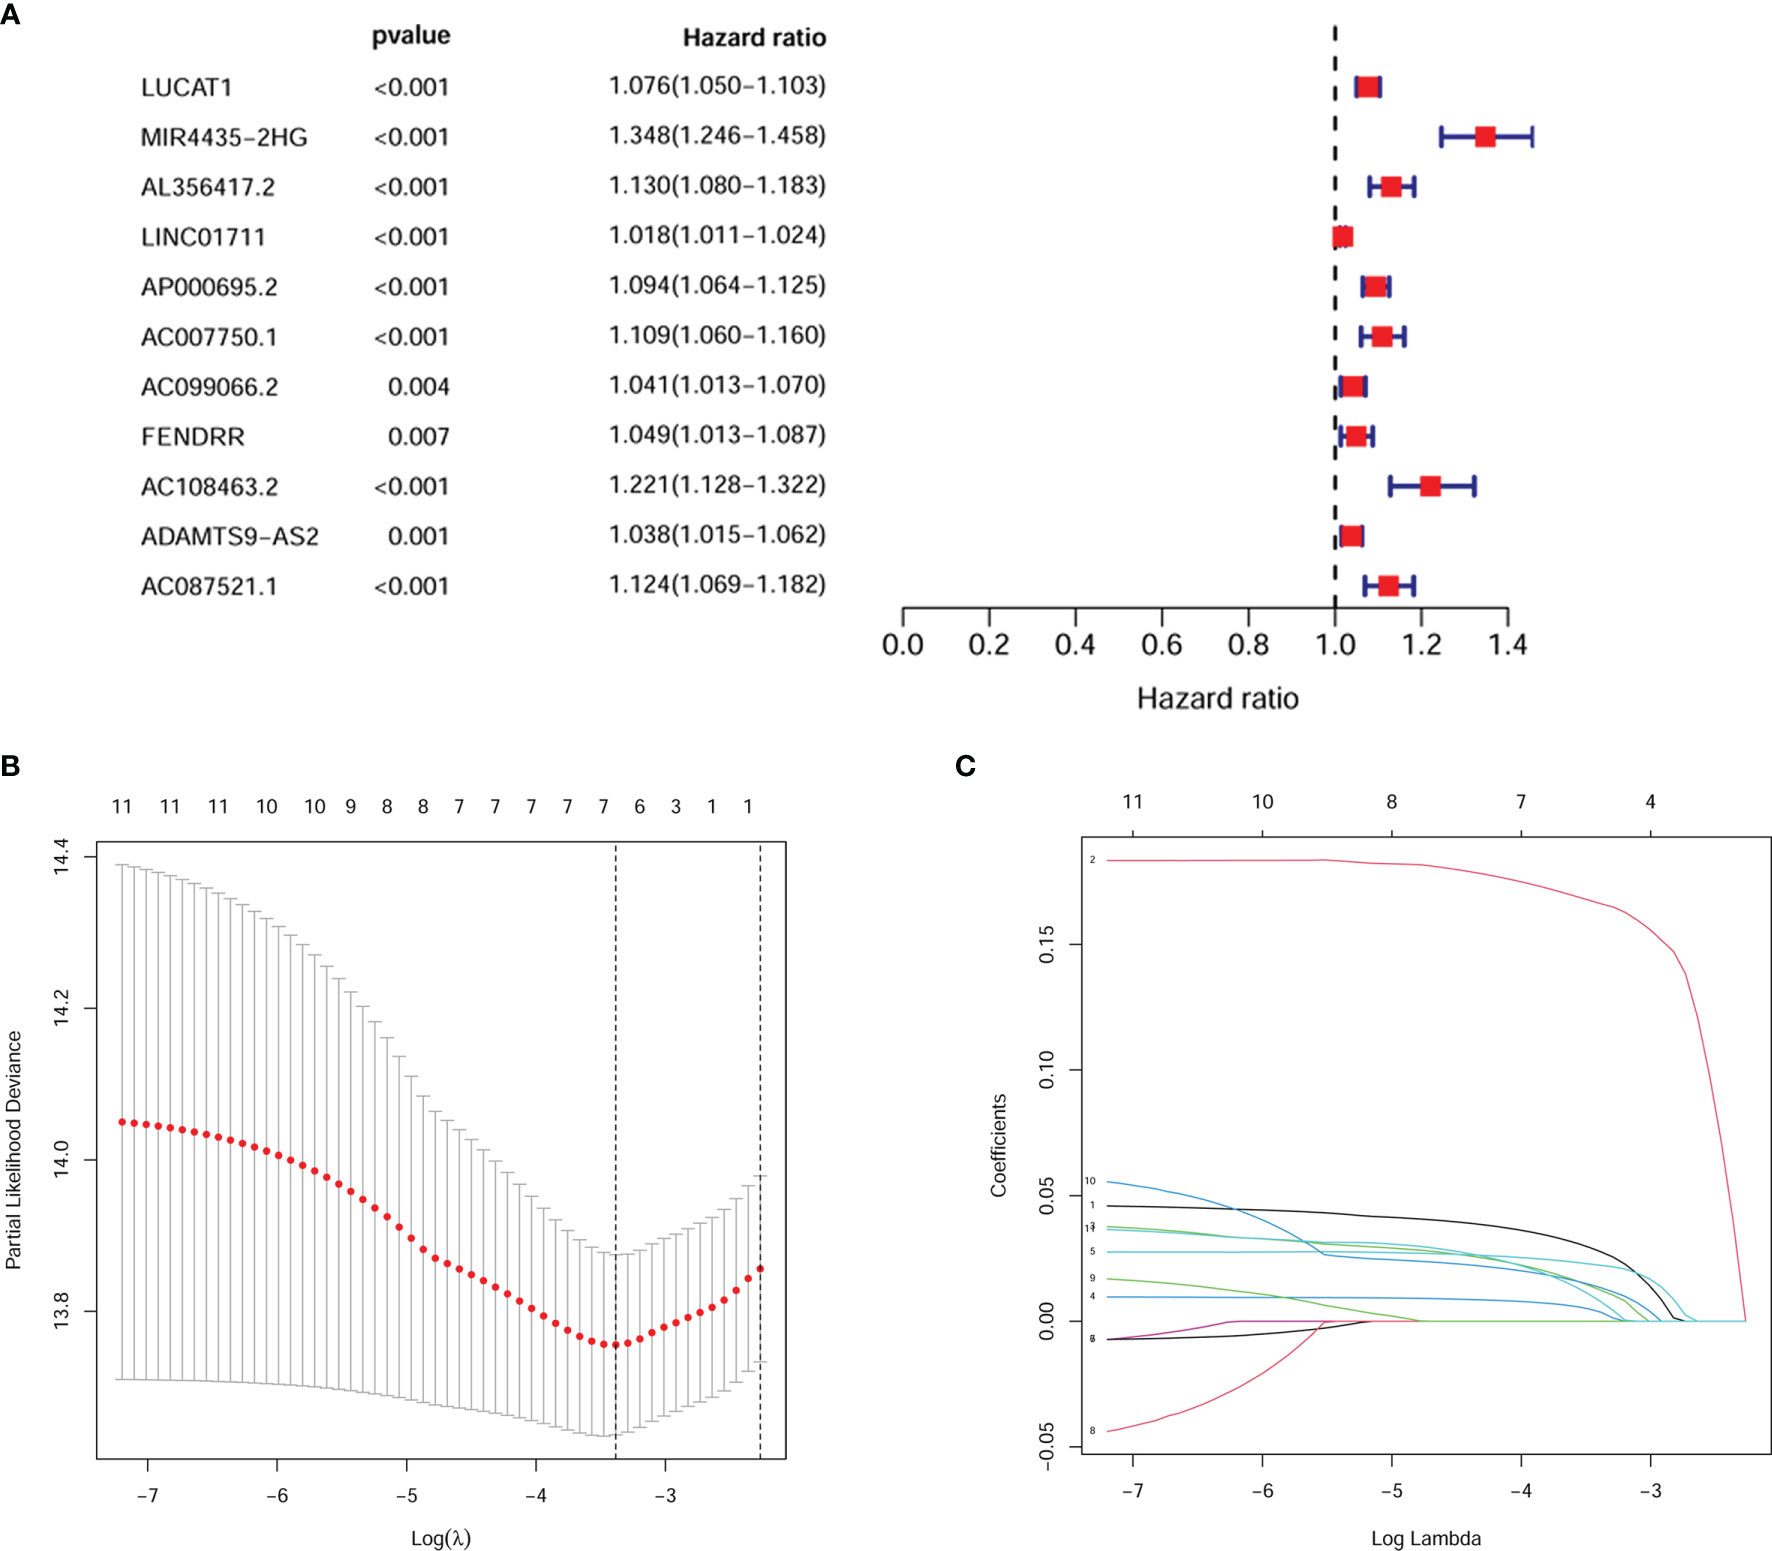
Figure 2 Screening for pivotal HRlncRNAs. (A) 11 HRlncRNAs were derived by univariate cox analysis. (B, C) It predicted the optimal model using Lasso regression analysis.
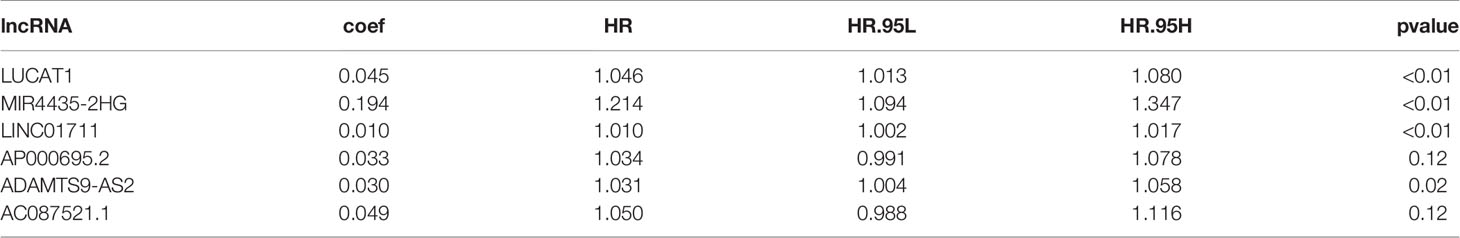
Table 1 the correlation coeffcients for six HRlncRNAs gaind by multivariate cox analysis.
Next, we calculated the area under the curve (AUC) of the receiver operating characteristic curve (ROC) for the risk score-based prognostic model, plotted the curve and found the highest point to be 0.680 (Figures 3A, B). To verify the optimality of the model, we drew ROC curves for 1-, 2- and 3-years related to survival, which revealed that all AUC areas were above 0.6 (Figure 3C). The largest inflection point of the 3-year ROC curve was then identified as the cut-off value using the Akaike information criterion (AIC) value. Based on the cut-off point (0.935), the samples of patients were divided into two risk groups, comprising 582 high-risk and 786 low-risk groups, respectively. The tSNE downscaling analysis demonstrates superior heterogeneity in high- and low-risk score groups, indicating that the efficacy of the cut-off point that distinguish the between high- and low-risk groups (Figure 3D).
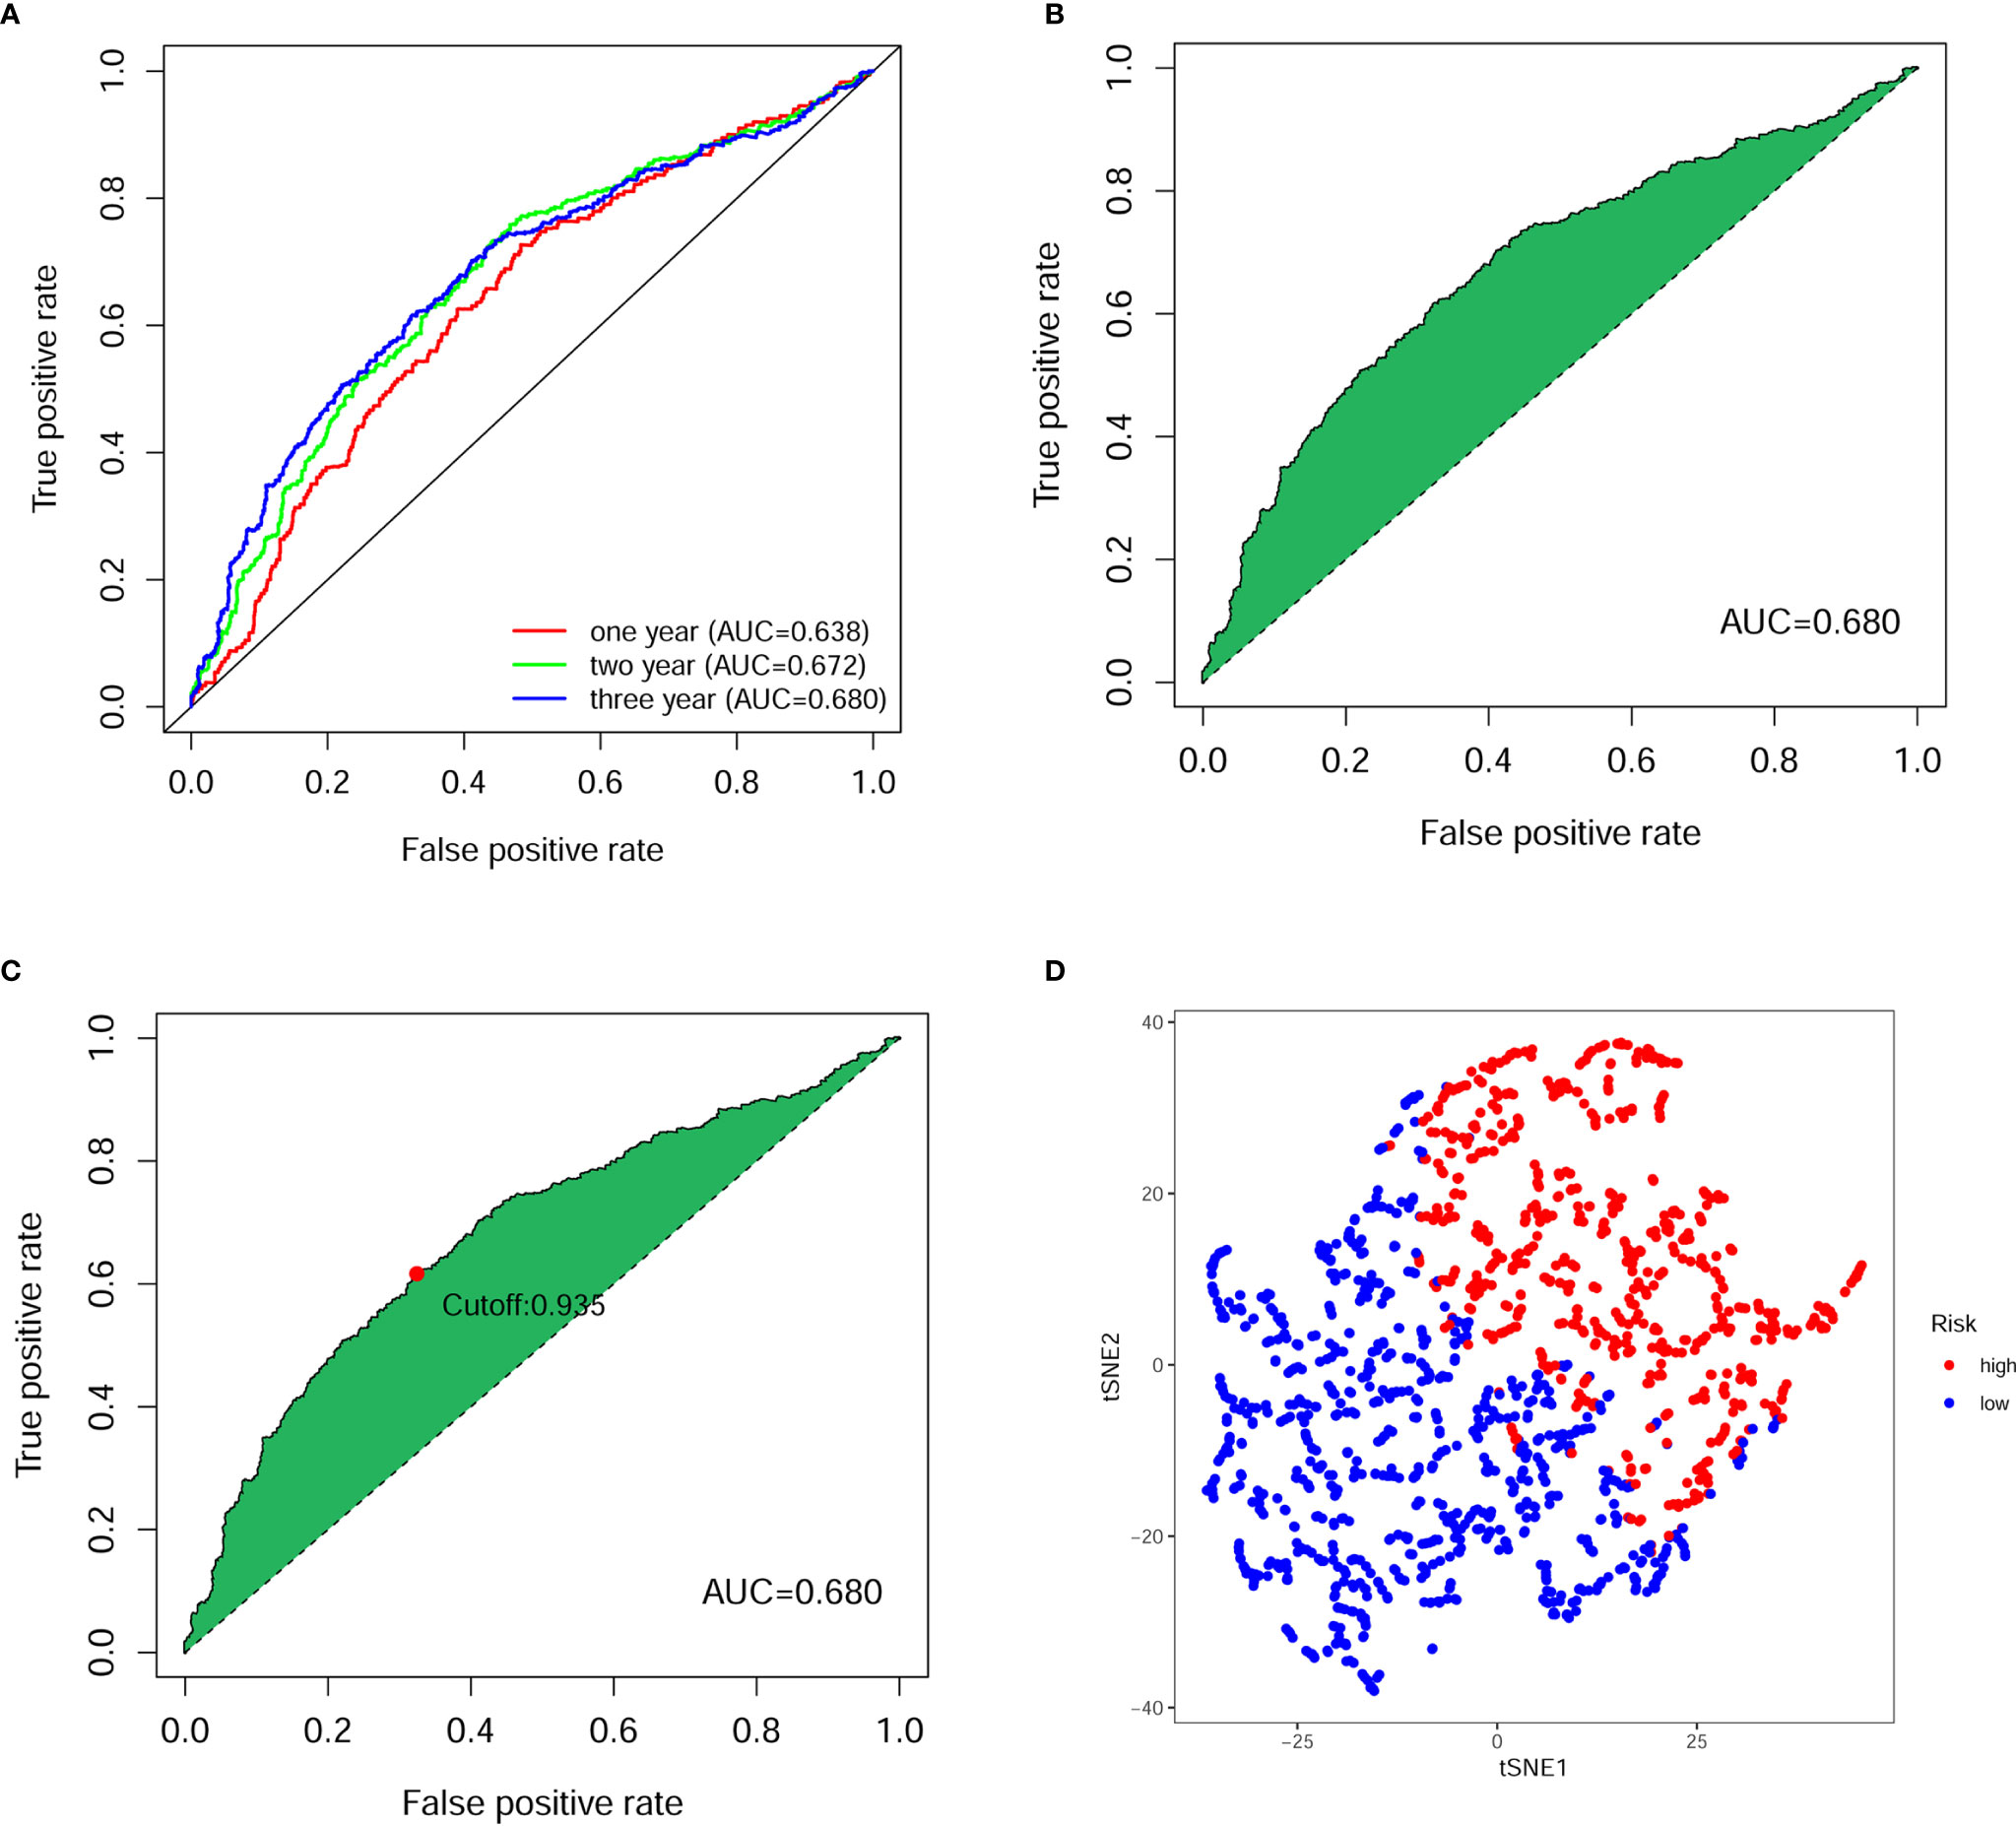
Figure 3 Evaluation of prognostic model for digestive system pan-cancer. (A) The ROC analysis showed that the AUCs of 1-, 2- and 3-year survival of patients with digestive system cancer were greater than 0.6. (B) The AUC for ROC analysis of the optimal model was 0.680. (C) The cut-off point calculated using the AIC was the maximum inflection point of the optimal model. (D) The tSNE down-scaling analysis showed strong heterogeneity between high- and low-risk groups distinguished using truncation points.
Figures 4A, B illustrate the distribution of high- and low-risk scores among the 1368 cases. We found that as the risk score increased, the mortality rate of the patients gradually increased. Kaplan-Meier analysis showed that the risk score significantly corrected with overall survival (OS) in patients with digestive system pan-cancer. The low-risk score group had a better prognostic outcome than the high-risk group (P < 0.001) (Figure 4C).
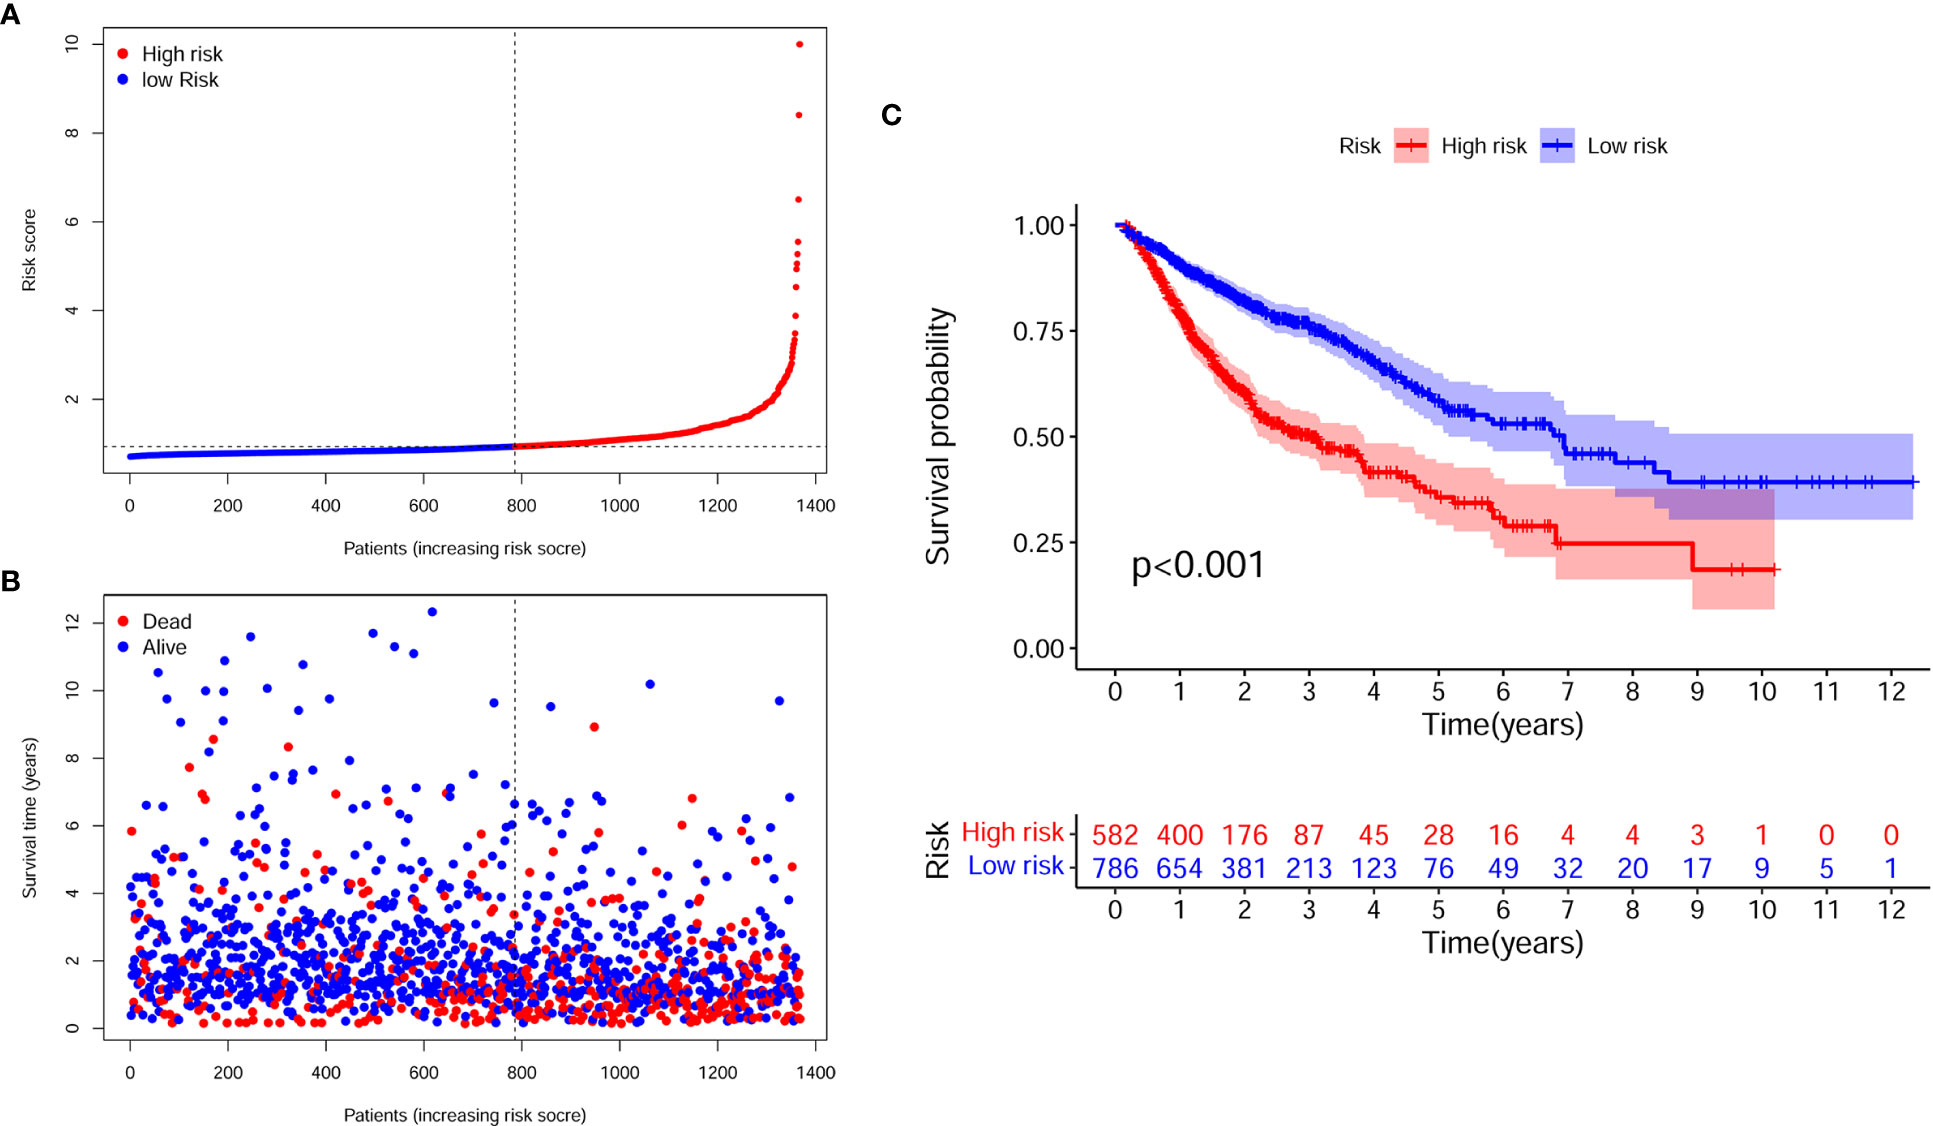
Figure 4 The assessment of prognostic model for survival outcomes. (A) As the number of patients increased, the risk scores of the prognostic model were raised. (B) As the number of patients increased, the number of patient deaths significantly increased. (C) The survival time was significantly longer in the low-risk group than in the high-risk group.
Next, we utilized multivariate cox analysis to construct prognostic models and calculated risk scores for the training and validation sets, respectively. The two datasets were classified into high- and low-risk groups based on the pre-existing cut-off point (0.935), separately. It was found that the training and validation sets were consistent with the above results, which revealed that the prognostic model for the digestive pan-cancer had a stronger predictive value (Figure S1).
To better validate the robustness of the prognostic model, we investigated the relationship between risk score and clinicopathological characteristics using chi-square tests. The bar chart shows that sex, T stage, N stage, and clinical stage were significantly associated with risk score (Figure 5A). Scatter plots are presented using the Wilcoxon signed rank test to display the correlation of risk scores with significant clinicopathological traits (Figures 5B–E). Next, we found T stage (P < 0.001, HR = 1.550, 95% CI: 1.349-1.782), N stage (P < 0.001, HR = 1.604, 95% CI: 1.446-1.779), M stage (P < 0.001, HR = 2.687, 95% CI: 2.033-3.552), clinical stage (P < 0.001, HR = 1.901, 95% CI: 1.686-2.142), and risk score (P < 0.001, HR = 1.310, 95% CI: 1.216-1.413) showed statistical differences by univariate cox regression analysis (Figure 5F), while in the multivariate cox regression analysis, only clinical stage (P < 0.001, HR = 1.845, 95% CI: 1.441-2.363) and riskScore (P < 0.001, HR = 1.212, 95% CI: 1.121-1.310) were considered as independent prognostic factors (Figure 5G). The detailed values for univariate and multivariate cox regression analyses are shown in Table S1. Combined with the clinicopathological information, ROC analysis showed that the AUC for risk score (0.695) and clinical stage (0.682) was greater than 0.65, which suggested that risk score and clinical stage had certain predictive ability in the prognosis of digestive pan-cancer (Figure 5H). Based on a multivariate cox regression analysis, we adopted a nomogram that included clinicopathological characteristics and risk score. As shown in the nomogram, risk score and clinical stage have the greatest impact on 1-, 3-, and 5-year survival in patients with digestive system pan-cancer (Figure 6). The C-index of the prognostic model was 0.713 (95% CI: 0.698-0.728). The risk scores increased with clinical stage, indicating that this prognostic model is significantly associated with the progression of pan-cancer of the digestive system (Table 2).
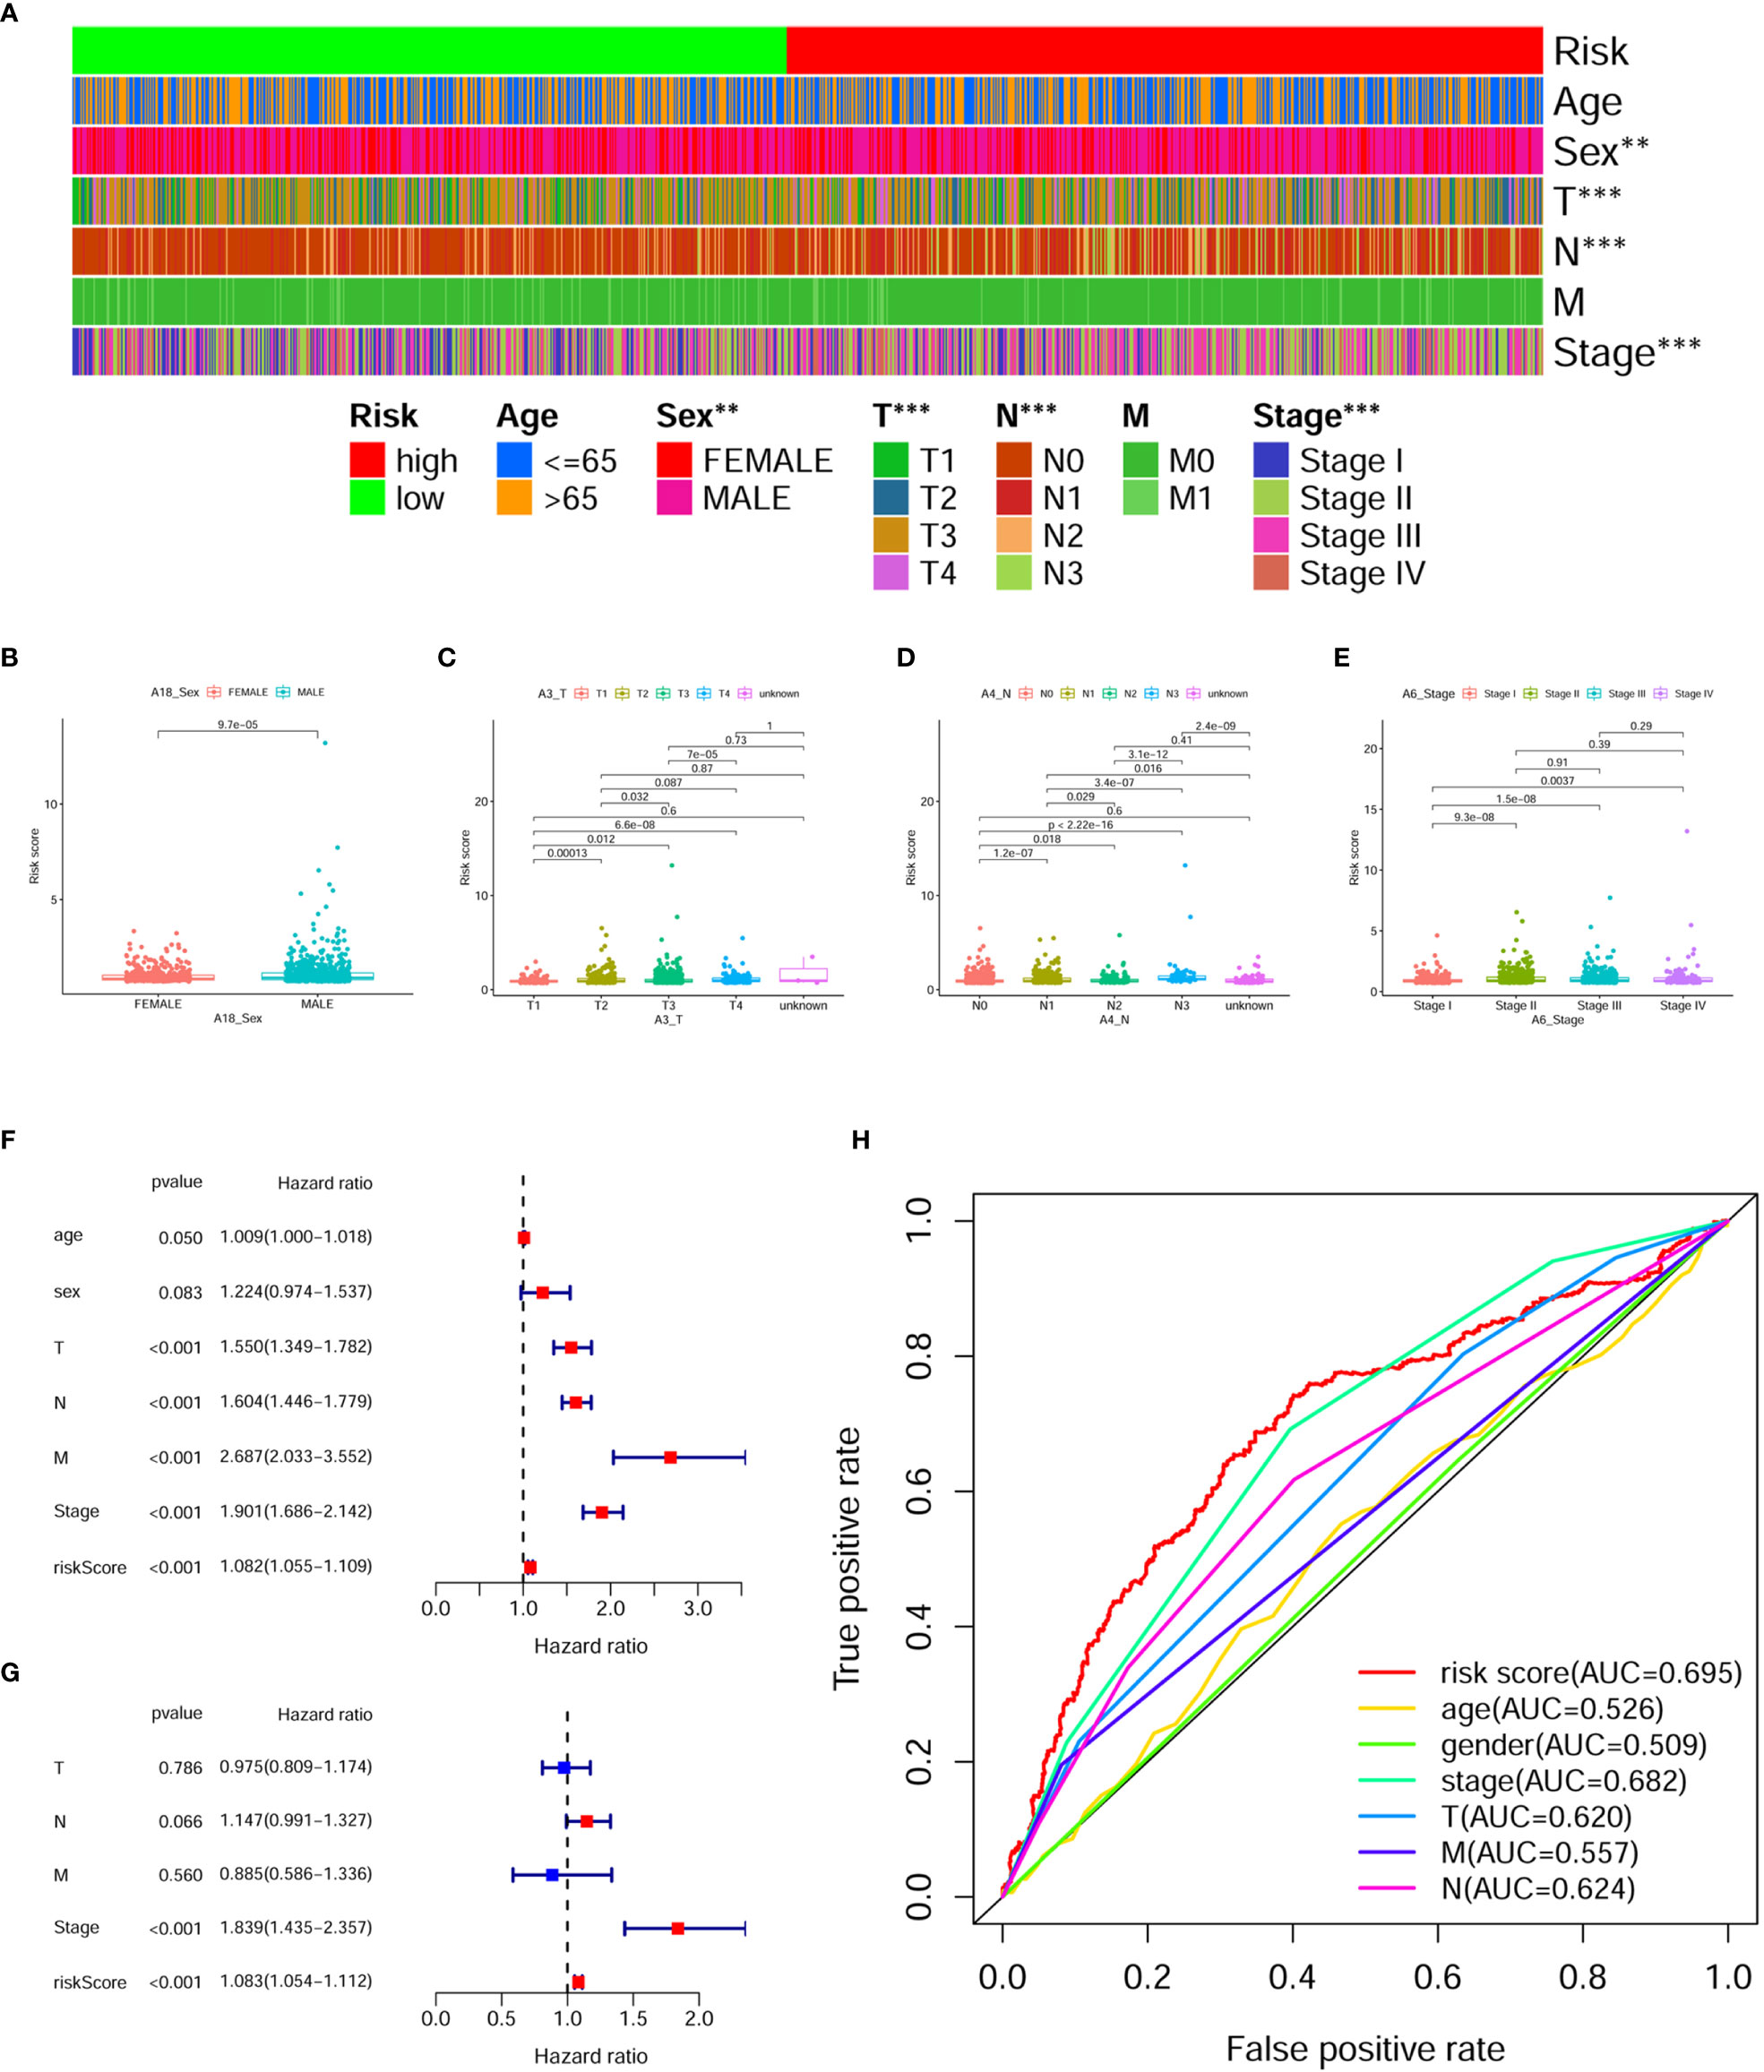
Figure 5 Assessing the relationship between clinicopathological characteristics and prognostic models. (A) The bar chart illustrates it remarkably correlated the risk score with sex, T stage, N stage, and clinical stage. (B–E) The scatterplot shows that (B) sex, (C) T stage, (D) N stage and (E) clinical stage are significantly associated with risk score. (F) The risk score, clinical stage, T stage, N stage, and M stage were significantly associated with clinical prognosis in digestive system pan-cancer by the univariate cox analysis. (G) The risk score and clinical stage as independent prognostic factors for digestive system pan-cancer according to the multivariate cox analysis. (H) The ROC analysis based on the risk score and clinicopathological features demonstrated that the AUCs for both risk scores (0.695) and clinical staging (0.682) were greater than 0.65.
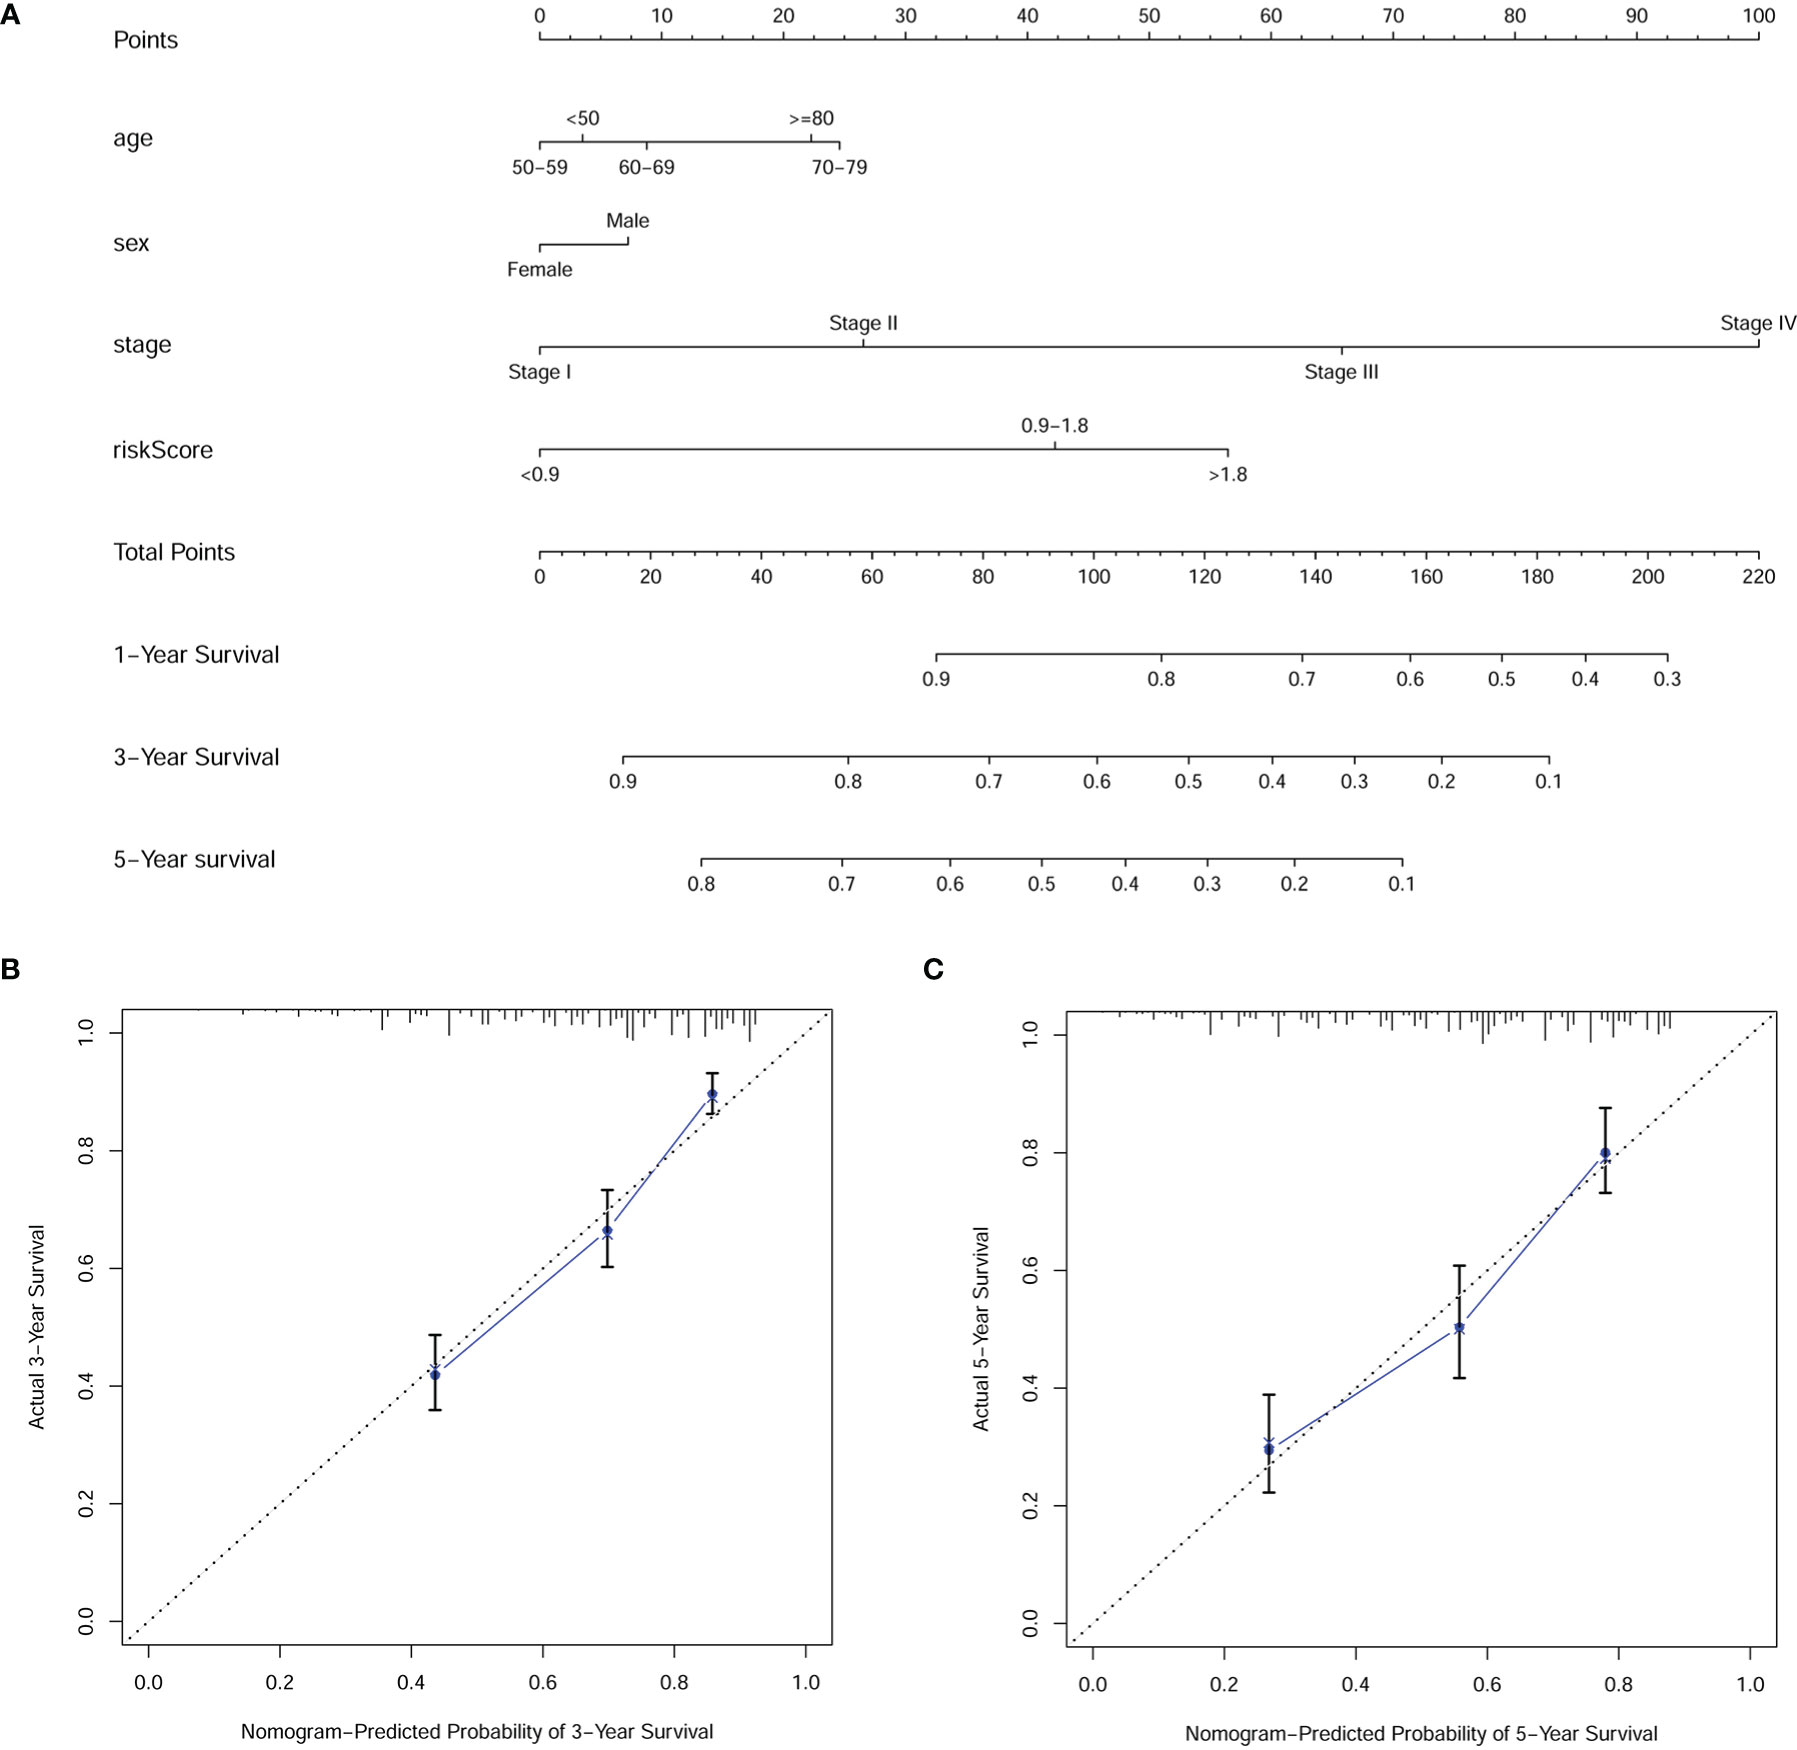
Figure 6 The (A) nomogram and (B, C) calibration plots of 3 and 5 years demonstrated that the combination of risk score and clinicopathological characteristics could well predict the prognostic performance of patients with digestive system pan-cancer.
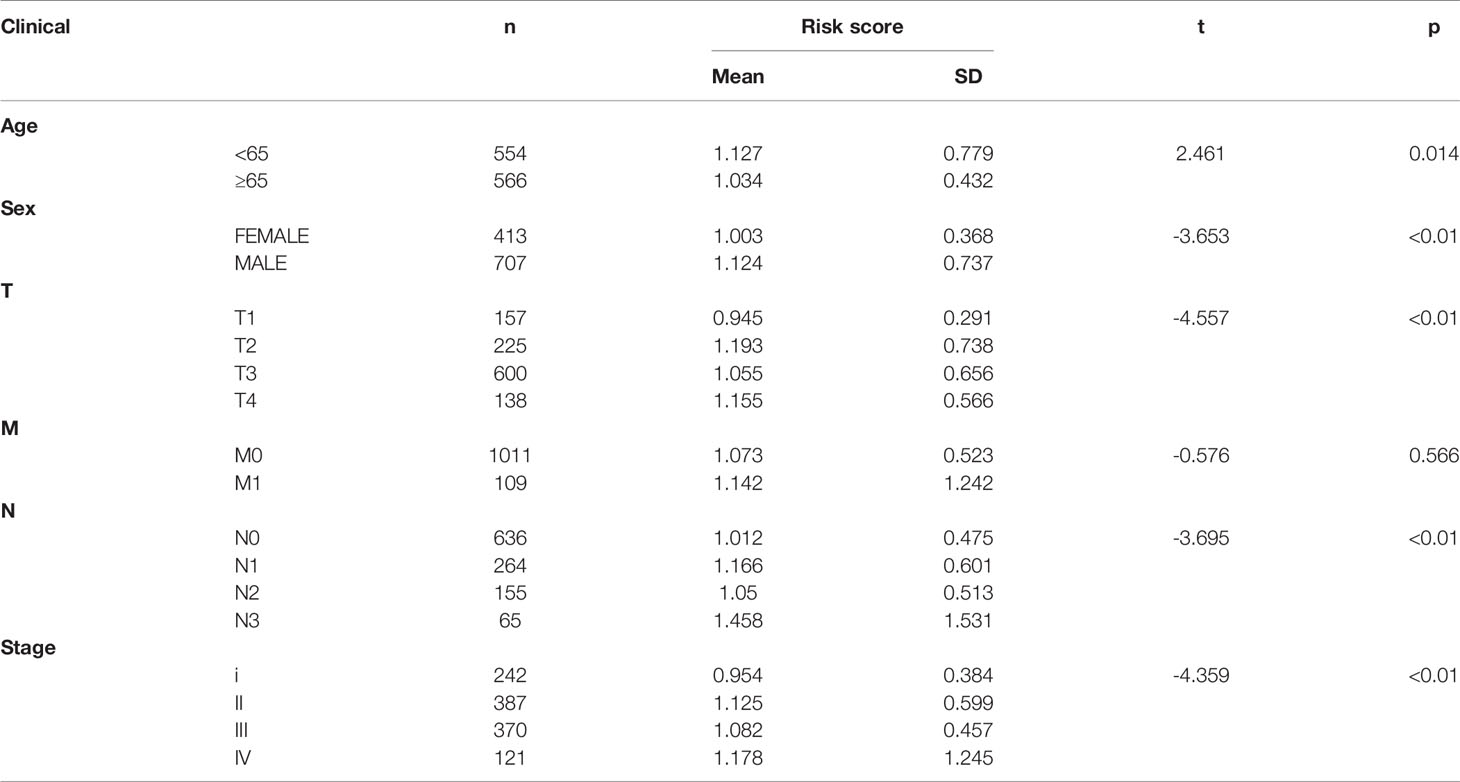
Table 2 Clinical influences of prognostic model in digestive system pan-cancer data.
To investigate whether the HRlncRNAs are associated with the tumor immune microenvironment, we assessed the relationship between the risk score and tumor-infiltrating immune cells by the Wilcoxon signed-rank test. The results indicated that high-risk group was more positively correlated with tumor-infiltrating immune cells such as B cells, cancer associated fibroblast, endothelial cell, monocyte, macrophages, and myeloid dendritic cell, whereas they were negatively correlated with CD4+ T cells (Figure 7 and Figure S2).
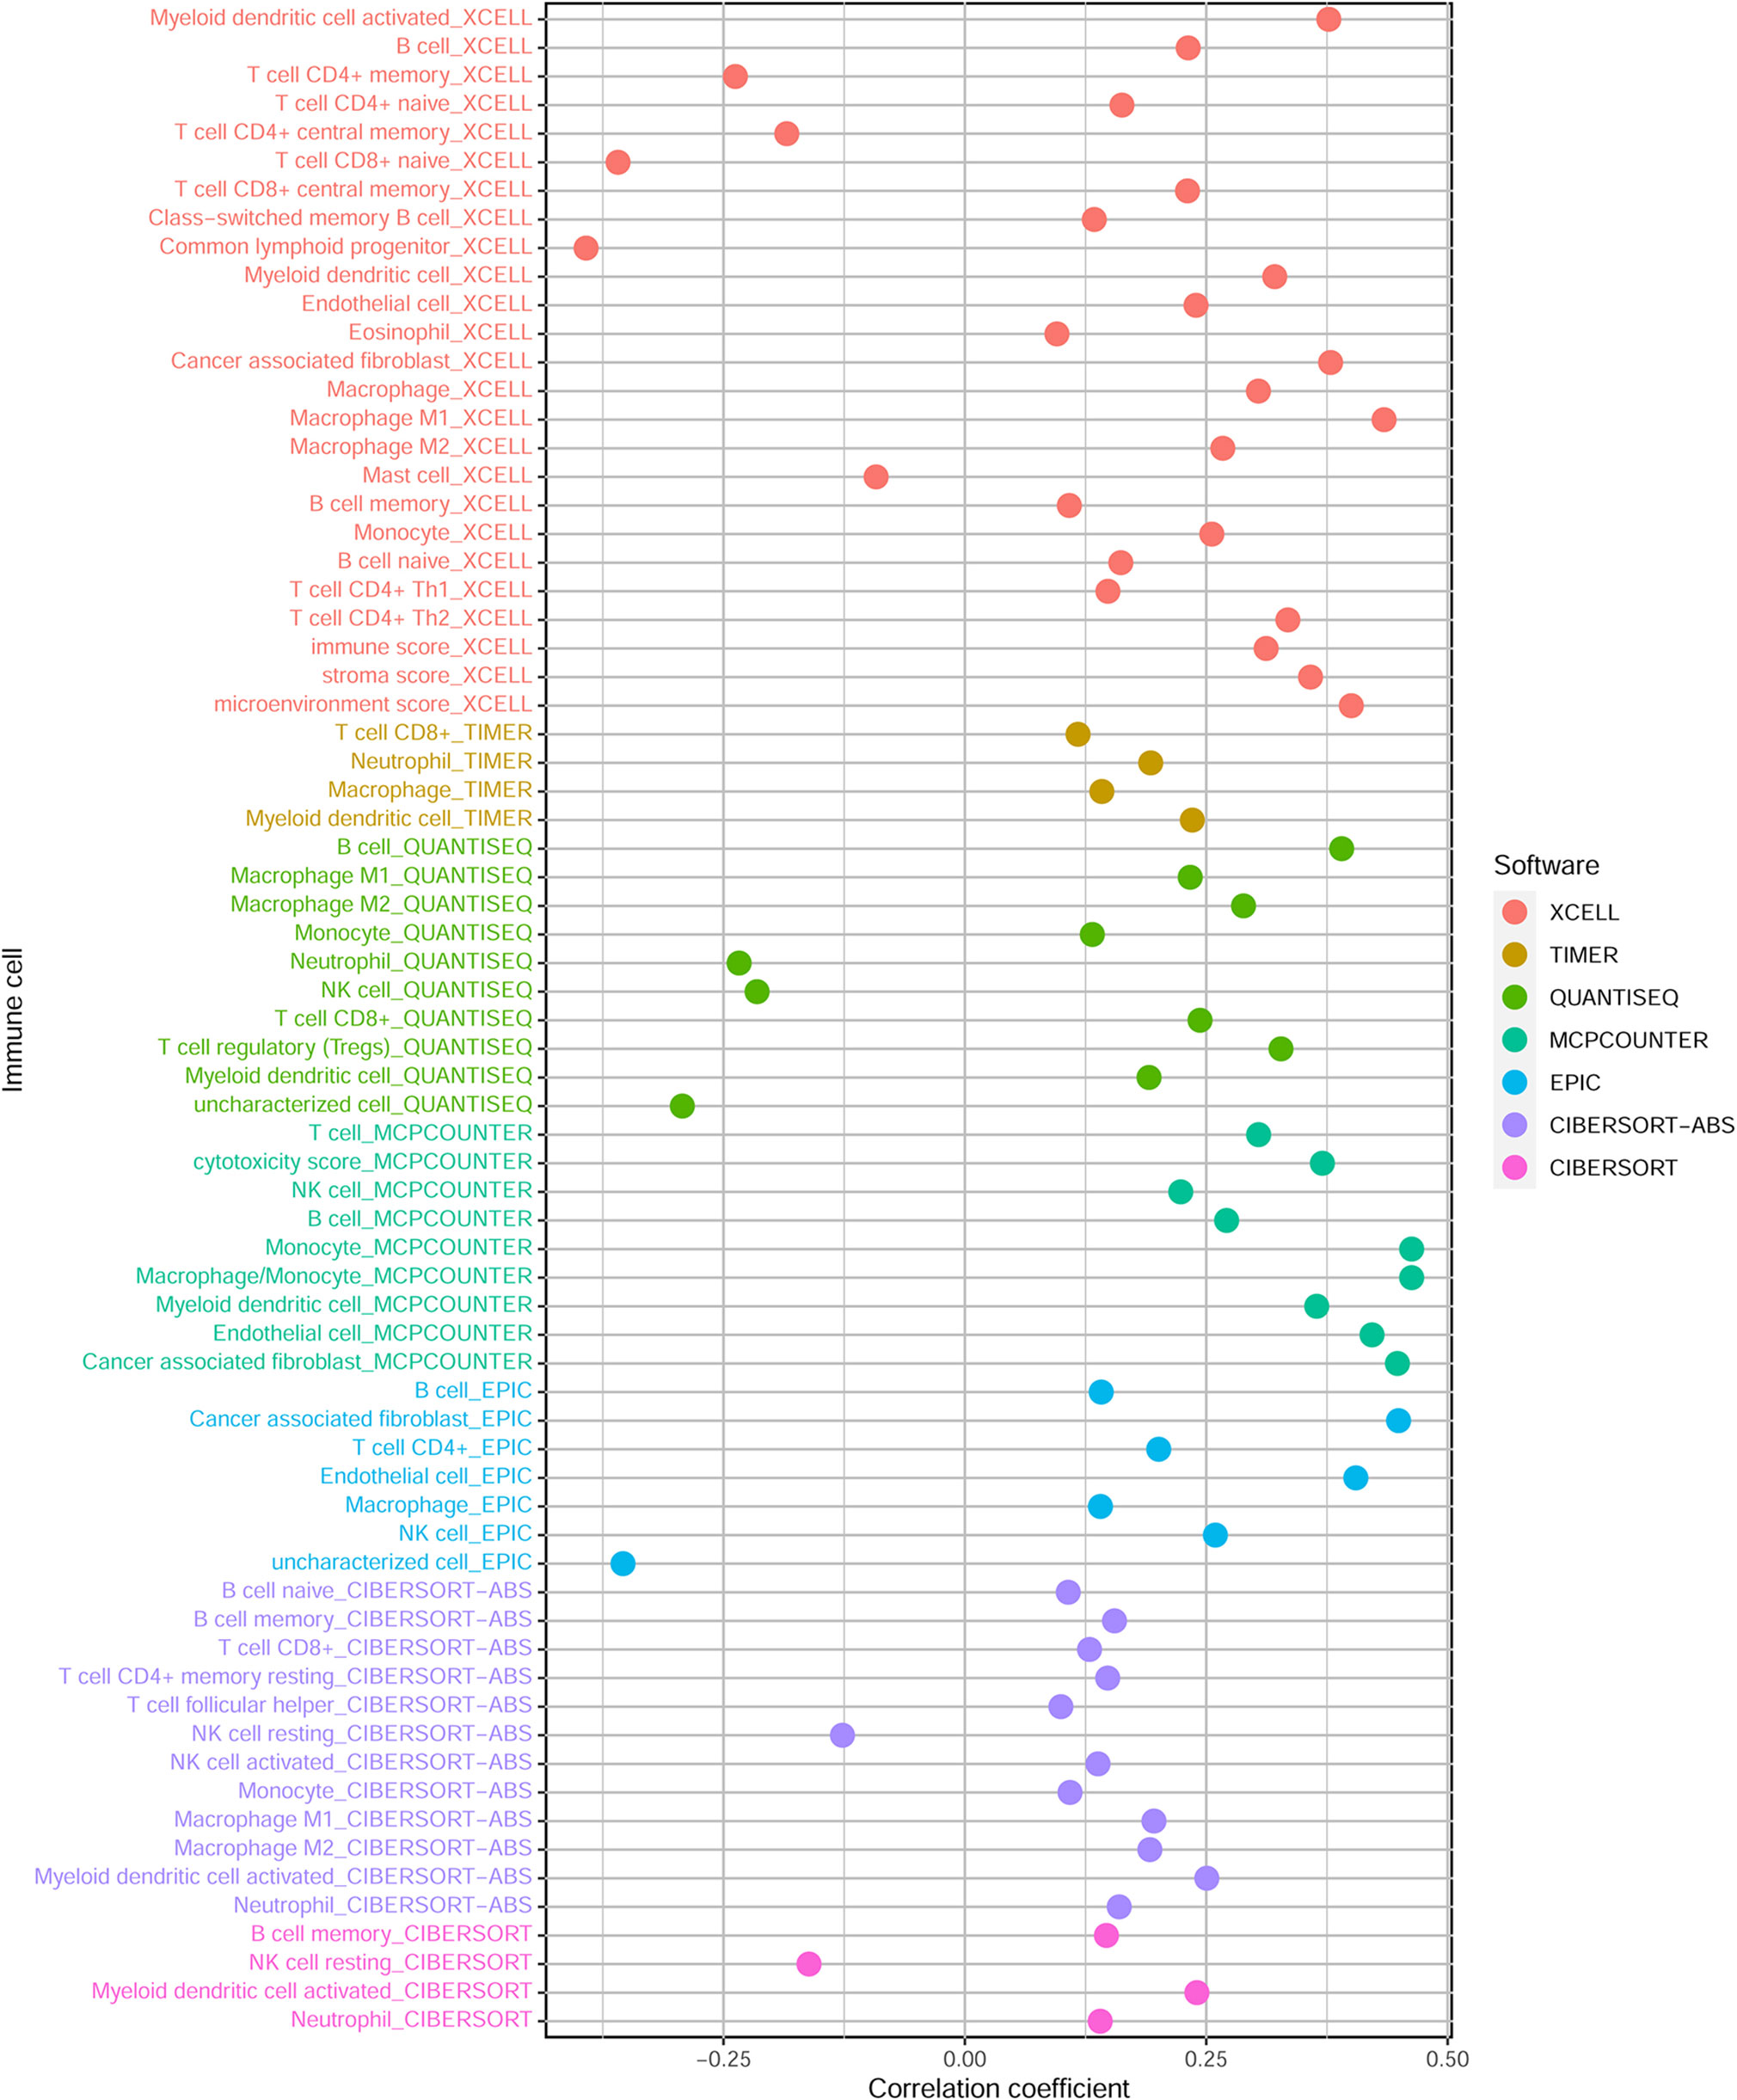
Figure 7 The relationship between risk scores and tumor-infiltrating immune cells.
As ICI has been considered as an effective drug for cancer treatment in recent years, we investigated whether it associated the prognostic model with ICI-related biomarkers. The results showed that high-risk score group was positively correlated with high expression of HAVCR2 in four digestive system cancers (Figure 8); with high expression of CD274 in CRC, ESCA and STAD; with high expression of PDCD1 in CRC, ESCA and LIHC; with high expression of LAG3 in CRC and STAD; with high expression of CTLA4 and TIGIT in CRC and LIHC (P < 0.05) (Figure S3).
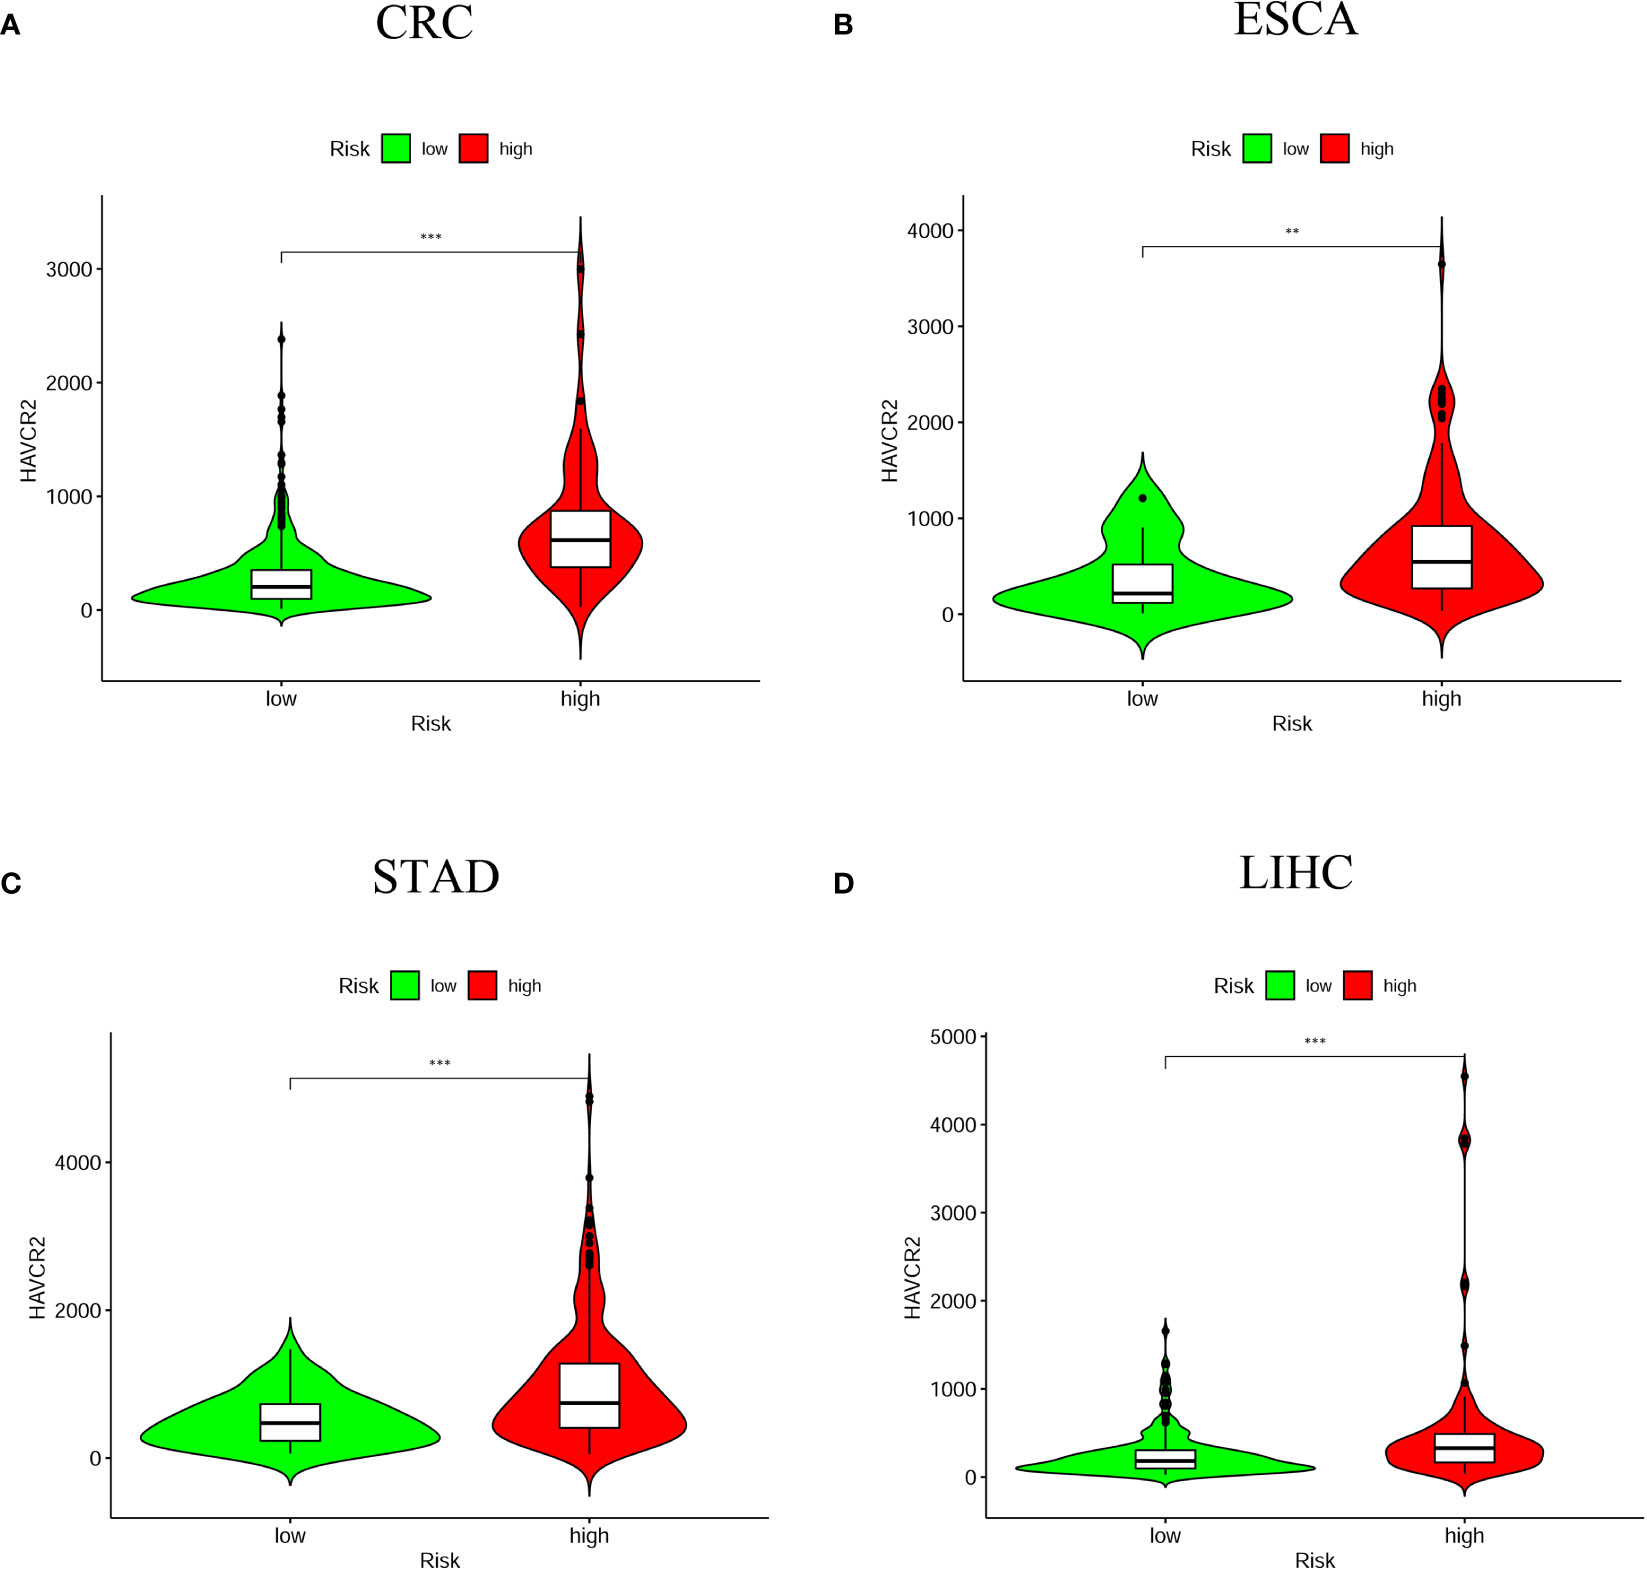
Figure 8 The relationship between risk scores and immune checkpoint inhibitors. HAVCR2 was positively correlated with high-risk groups in the four digestive system tumors (A) CRC; (B) ESCA; (C) STAD; (D) LIHC (**P < 0.01; ***P < 0.001).
Besides immune checkpoint inhibitor treatment, we also attempted to identify correlations between risk score and the effectiveness of five common anticancer drugs. We found that high-risk score groups were associated with lower half-inhibitory centration (IC50) of Imatinib anticancer drug among four digestive system cancers (Figure 9). Whereas the correlations of IC50 of other anticancer drugs with the high-risk score groups were mainly in CRC and LIHC, such as Gemcitabine, Cisplatin, Doxorubicin, and Mitomycin (Figure S4). This suggests that this prognostic model for the assessment of anticancer drugs is more beneficial for patients with CRC and LIHC.
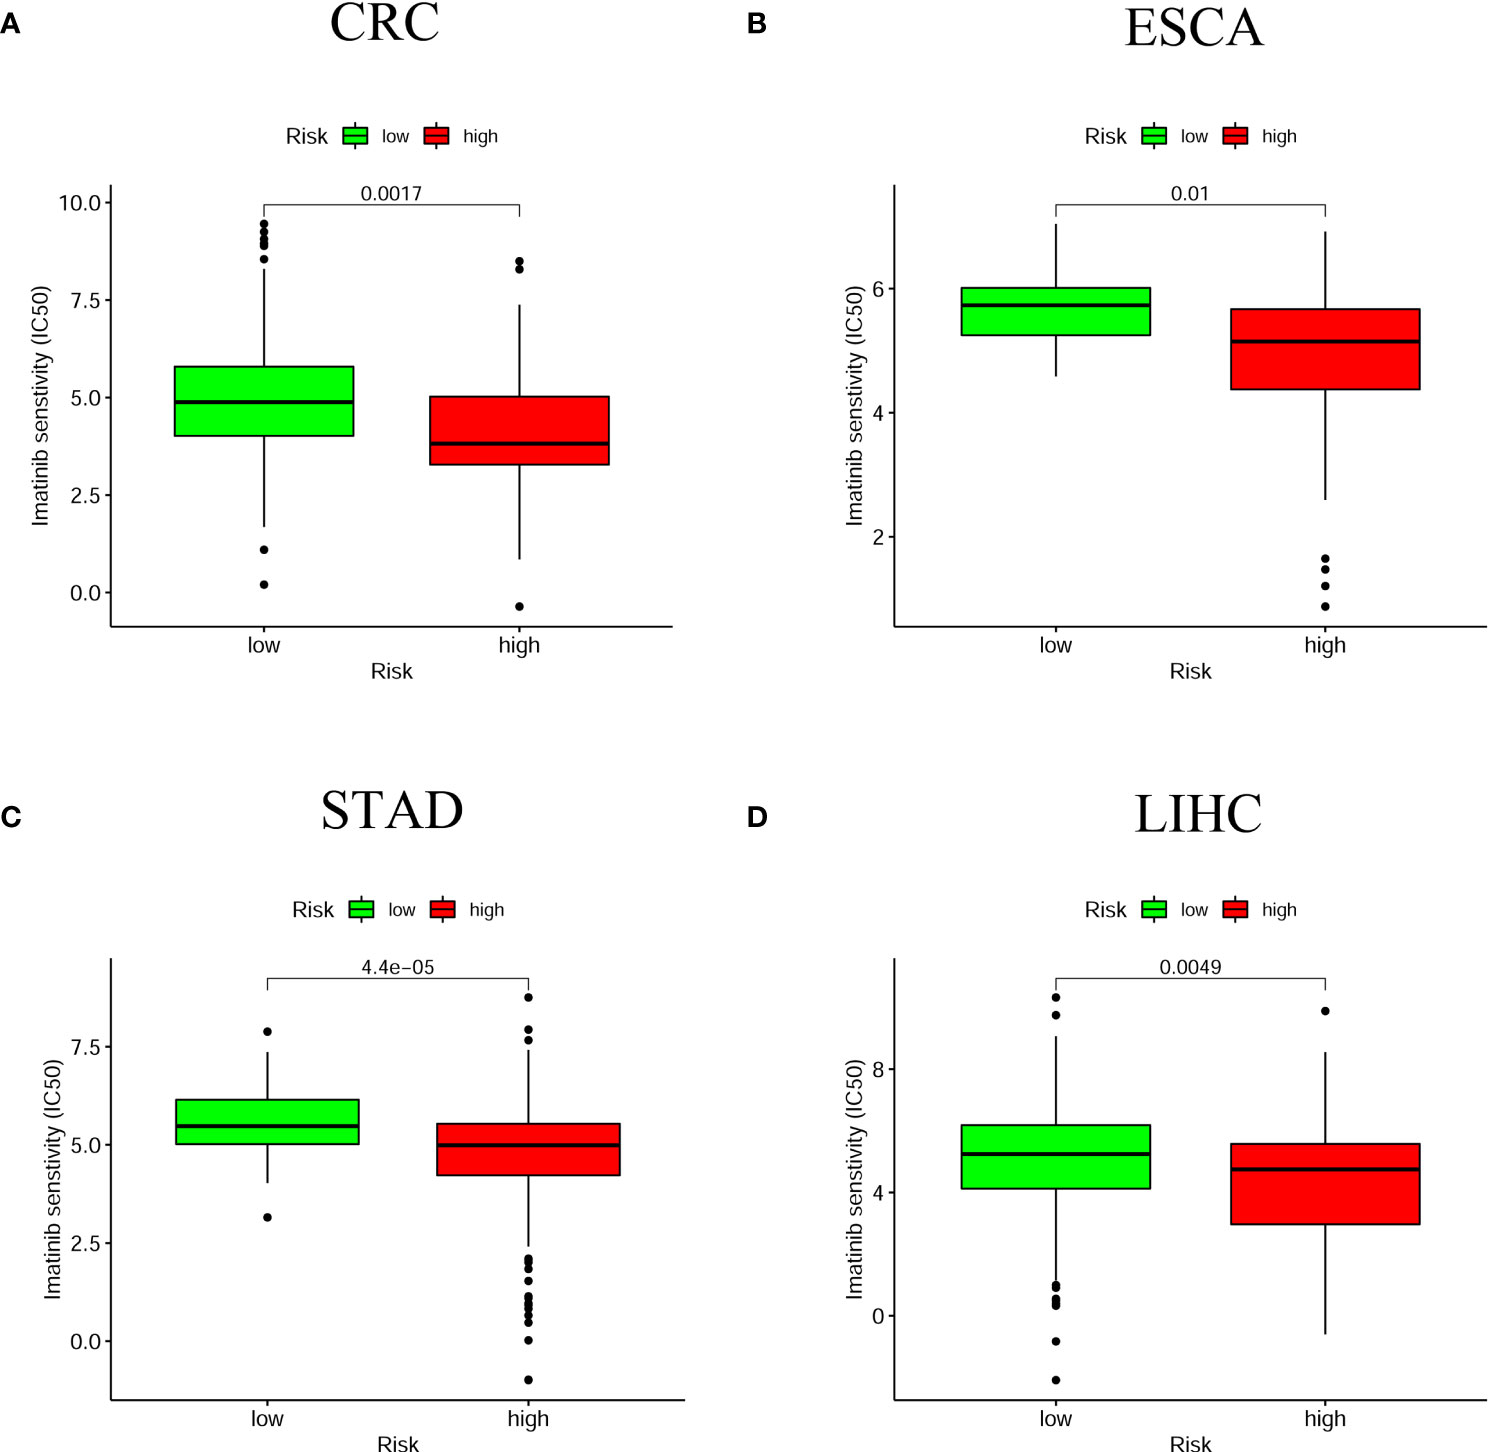
Figure 9 The relationship between risk scores and anti-tumor drugs. The high-risk group in the four digestive system tumors was associated with a lower IC50 for Imatinib (A) CRC; (B) ESCA; (C) STAD; (D) LIHC. P < 0.05 was significant.
Malignant tumors of the digestive system are the most common malignancies, with the new morbidity and mortality of which are among the leading in China (20). At present, however, most studies are limited to the analysis of pivotal biomarkers for a single cancer. The concept of digestive system pan-cancer was born out of the fact that tumors of similar tissue origin share certain molecular characteristics. Meanwhile, hypoxia is one of the most common causes of carcinogenesis (4). The hypoxic environment is the outcome of an imbalance between the increased oxygen demand and insufficient oxygen supply, which applies to the high proliferation rate of tumors (5). Tumor hypoxia can trigger a variety of biological processes including metabolic changes, angiogenesis and metastasis (21, 22). In many solid cancers, the significant crosstalk between hypoxia and cancer features promotes malignant progression and diminished anti-tumor responses, leading to resistance to therapy and poor clinical outcomes (23). Hypoxia is therefore emerging as a novel biomarker and target for cancer therapy.
In this study, HRlncRNAs were screened by analyzing lncRNAs co-expression with hypoxia-related genes in four digestive system carcinomas. It then intersected lncRNAs from four tumors to get co-expressed HRlncRNAs. Further, we established the prognostic model of six HRlncRNAs (LUCAT1, MIR4435-2HG, LINC01711, AP000695.2, ADAMTS9-AS2, and AC087521.1) by means of univariate and multivariate cox and lasso regression analyses to explore the potential influence in pan-cancer of the digestive system. To validate the effect of the model on digestive system pan-cancer, we calculated the AUC values under the ROC curve to obtain the optimal model and computed the AIC values at each point on the AUC to identify the optimal cut-off points for high- and low-risk groups of patients with digestive system cancers. Afterwards, we assessed this new model for survival outcomes, clinicopathological characteristics, and immune infiltration cells, immune checkpoint-related biomarkers, and anticancer drugs.
Five of the six lncRNAs have been reported in the literature to be significantly associated with the prognosis of digestive malignancies, including LUCAT1 (24–27), ADAMTS9-AS2 (28–31), MIR4435-2HG (32–34), LINC01711 (35), AP000695.2 (36), while there are no relevant articles concerning the biological function of AC087521.1. LUCAT1, located on the antisense strand in the q14.3 region of chromosome 5, was first identified in smoking-associated lung cancer. Xing et al. (37) reported that LUCAT1 serves an essential role in four digestive system tumors, which contributes to tumor proliferation, migration and invasion. ADAMTS9-AS2, a tumor suppressor, was mainly involved in the PI3K/AKT signaling pathway and epithelial mesenchymal transition (EMT). Xu et al. (38) showed that upregulation of ADAMTS9-AS2 expression inhibited the proliferation, migration and invasion of cancer cells and induced apoptosis. Nötzold et al. (39) suggested that MIR4435-2HG functions as a critical player in cell cycle progression through mitosis. MIR4435-2HG as ceRNA regulates YAP1 oncogenic activity in colorectal cancer via sponge-adsorbed miR-206 (40). In STAD, MIR4435-2HG is engaged in the development, metastasis and EMT of gastric cancer cells through mediating the miR-138-5p/Sox4 axis (41). In LIHC, MIR4435-2HG promotes cancer cell proliferation through upregulation of miRNA-487a (42). Xu et al. (35) found that LINC01711, which was originated from the exosomes of cancer cells and closely correlated with the intracellular concentration of donor cells, could promote the proliferation, migration and invasion of esophageal cancer cells and inhibit apoptosis by upregulating FSCN1 and downregulating miR-326, thus promoting the development of ESCA. In the construction of a prognostic model, Zha et al. (36) found that AP000695.2, as an oncogenic factor, was positively correlated with the TNM stage and could be an independent prognostic factor for gastric cancer. Therefore, the combined model can be considered as new prognostic biomarkers for further studies.
Recently, the advent of immunotherapy as a potentially effective approach to the treatment of different cancer types, including those of the digestive system, has drawn increasing attention to cancer immunotherapy (43). Tumor hypoxia is an enormous barrier to effective cancer treatment, particularly immunotherapy, because of the irregular growth kinetics of tumors resulting in increased oxygen consumption (9, 44). Hence, there is a great deal of research focused on improving hypoxia in order to revolutionize tumor therapy by blocking immunosuppression or immune escape (45, 46).
In this study, the relationship of risk score and tumor-infiltrating immune cells was predicted by seven algorithms, including XCELL (47, 48), TIMER (49, 50), QuanTIseq (51), MCP-counter (52, 53), EPIC (54), CIBERSORT-ABS (55), and CIBERSORT (56). We found that B cells, cancer associated fibroblast, endothelial cell, monocyte, macrophages, and myeloid dendritic cell were significantly associated with high-risk score. Assuming that hypoxia leads to immunosuppression in the high-risk group, the existence of these immune cells could enhance the efficacy of immunotherapy in patients with digestive system pan-cancer. Previous evidence suggested that tumor-infiltrating B lymphocytes (TIBs) inhibit tumor progression by secreting immunoglobulins, promoting T cell responses and directly killing cancer cells (57). Helmink et al. (58) found that B cell and tertiary lymphoid structures have a potential effect in the response to immune checkpoint blockade (ICB) treatment. The endothelial cells and tumor-associated fibroblasts are the major inducers of the migration and invasive capacity of cancer cells and may be novel targets for cancer therapy (59, 60). Previous studies have shown that TME influences the differentiation of monocytes to macrophages and dendritic cells (61). Similarly, hypoxia, and in particular HIF-1α, drives the differentiation of myeloid-derived suppressor cells (MDSCs) into tumor-associated macrophages (TAMs), which guides cancer treatment. For instance, the restriction of TAMs to normoxic regions by blocking the Sema3A/Neuropilin-1 pathway reduced tumor pro-angiogenic and immunosuppressive functions and inhibited tumor development and metastasis (62). Thus, the positive correlation of these immune cells with high-risk group proved that the prognostic model has potential for immunotherapy. We then examined that relationship between common immune checkpoint inhibitors and chemotherapy and the prognostic model, which revealing that HAVCR2, the immune checkpoint marker gene, was positively associated with the high-risk group for all four digestive cancers, while other marker genes (CD274, PDCD1, CTLA4, LAG3 and TIGIT) were more significant in some single cancers such as CRC, STAD and LIHC. The lower IC50 for Imatinib was more sensitive to the high-risk group for all four digestive cancers, while several other anti-tumor drugs (Doxorubicin, Mitomycin, Gemcitabine and Cisplatin) were significant in some individual cancers such as CRC and LIHC. Generally, immune-targeted therapies support the production of more new antigens and inhibit the progression of malignant tumors by targeted destruction of cancer cells. As a result, immunotherapies offer more benefit than conventional anticancer treatment. While targeted immunotherapies such as anti-PD1/PDL1 have yielded substantial clinical outcomes for cancer treatment (63), we believe that the identification and validation of specific biomarkers may be of greater benefit to clinical treatment due to the differences between different immune cells and immune checkpoint marker genes.
However, there are a few shortcomings to this study. To begin with, we only downloaded transcriptomic data from the TCGA database for the analysis of digestive system pan-cancer, and the raw data were relatively limited. Moreover, we should perform functional validation of the HRlncRNAs for constructing prognostic model to further ensure the robustness of HRlncRNAs in cancers of the digestive system. In future researches, we hope to supplement the above limitations and ultimately make the study of digestive system pan-cancer more conducive to clinical treatment.
In conclusion, our research suggested that the prognostic model constructed by HRlncRNAs and validated at multiple levels could predict the prognosis of digestive system pan-cancer and might help patients to benefit from anti-tumor immunotherapy.
The datasets presented in this study can be found in online repositories. The names of the repository/repositories and accession number(s) can be found below: The Cancer Genome Altas database.
RC and ZH contributed to the design of the study and the writing of the manuscript. ZH, HL, and HG conducted the writing of the manuscript. ZH, JJ, and YJ performed the bioinformatics analysis. NZ, ZS, XW, PS, and HW reviewed and revised the manuscript. All authors contributed to the article and approved the submitted version.
This study was supported by 2019 Scientific Research Project of Basic Scientific Research Business Fee of Provincial Higher Education Institutions of Heilongjiang Province (NO.2019-KYYWFMY-0001) and the PhD Start-up Fund of Mudanjiang Medical University (NO.2021-MYBSKY-041).
The authors declare that the research was conducted in the absence of any commercial or financial relationships that could be construed as a potential conflict of interest.
All claims expressed in this article are solely those of the authors and do not necessarily represent those of their affiliated organizations, or those of the publisher, the editors and the reviewers. Any product that may be evaluated in this article, or claim that may be made by its manufacturer, is not guaranteed or endorsed by the publisher.
We acknowledge the TCGA database for providing their platforms and contributors for uploading their meaningful datasets.
The Supplementary Material for this article can be found online at: https://www.frontiersin.org/articles/10.3389/fonc.2022.812786/full#supplementary-material
1. Bray F, Ferlay J, Soerjomataram I, Siegel RL, Torre LA, Jemal A. Global Cancer Statistics 2018: GLOBOCAN Estimates of Incidence and Mortality Worldwide for 36 Cancers in 185 Countries. CA: Cancer J Clin (2018) 68(6):394–424. doi: 10.3322/caac.21492
2. Arnold M, Abnet CC, Neale RE, Vignat J, Giovannucci EL, McGlynn KA, et al. Global Burden of 5 Major Types of Gastrointestinal Cancer. Gastroenterology (2020) 159(1):335–49. doi: 10.1053/j.gastro.2020.02.068
3. Han Y, Liu D, Li L. PD-1/PD-L1 Pathway: Current Researches in Cancer. Am J Cancer Res (2020) 10(3):727–42.
4. Ruan K, Song G, Ouyang G. Role of Hypoxia in the Hallmarks of Human Cancer. J Cell Biochem (2009) 107(6):1053–62. doi: 10.1002/jcb.22214
5. Brahimi-Horn MC, Chiche J, Pouysségur J. Hypoxia and Cancer. J Mol Med (Berlin Germany) (2007) 85(12):1301–7. doi: 10.1007/s00109-007-0281-3
6. Semenza GL. HIF-1: Upstream and Downstream of Cancer Metabolism. Curr Opin Genet Dev (2010) 20(1):51–6. doi: 10.1016/j.gde.2009.10.009
7. Mathieu J, Zhang Z, Zhou W, Wang AJ, Heddleston JM, Pinna CMA, et al. HIF Induces Human Embryonic Stem Cell Markers in Cancer Cells. Cancer Res (2011) 71(13):4640–52. doi: 10.1158/0008-5472.CAN-10-3320
8. Semenza GL. Hypoxia-Inducible Factors: Mediators of Cancer Progression and Targets for Cancer Therapy. Trends Pharmacol Sci (2012) 33(4):207–14. doi: 10.1016/j.tips.2012.01.005
9. Graham K, Unger E. Overcoming Tumor Hypoxia as a Barrier to Radiotherapy, Chemotherapy and Immunotherapy in Cancer Treatment. Int J Nanomed (2018) 13:6049–58. doi: 10.2147/IJN.S140462
10. Graham C, Barsoum I, Kim J, Black M, Siemens RD. Mechanisms Of Hypoxia-Induced Immune Escape In Cancer And Their Regulation By Nitric Oxide. Redox Biol (2015) 5:417. doi: 10.1016/j.redox.2015.09.022
11. Westendorf AM, Skibbe K, Adamczyk A, Buer J, Geffers R, Hansen W, et al. Hypoxia Enhances Immunosuppression by Inhibiting CD4+ Effector T Cell Function and Promoting Treg Activity. Cell Physiol Biochem: Int J Exp Cell Physiol Biochem Pharmacol (2017) 41(4):1271–84. doi: 10.1159/000464429
12. Huarte M. The Emerging Role of lncRNAs in Cancer. Nat Med (2015) 21(11):1253–61. doi: 10.1038/nm.3981
13. Zhang Q, Cheng Q, Xia M, Huang X, He X, Liao J. Hypoxia-Induced lncRNA-NEAT1 Sustains the Growth of Hepatocellular Carcinoma via Regulation of miR-199a-3p/UCK2. Front Oncol (2020) 10:998. doi: 10.3389/fonc.2020.00998
14. Zhu Z-J, Pang Y, Jin G, Zhang H-Y, Wang W-H, Liu J-W, et al. Hypoxia Induces Chemoresistance of Esophageal Cancer Cells to Cisplatin Through Regulating the lncRNA-EMS/miR-758-3p/WTAP Axis. Aging (2021) 13(13):17155–76. doi: 10.18632/aging.203062
15. Zhang W, Yuan W, Song J, Wang S, Gu X. LncRNA CPS1-IT1 Suppresses EMT and Metastasis of Colorectal Cancer by Inhibiting Hypoxia-Induced Autophagy Through Inactivation of HIF-1α. Biochimie (2018) 144:21–7. doi: 10.1016/j.biochi.2017.10.002
16. Zhang J, Jin HY, Wu Y, Zheng ZC, Guo S, Wang Y, et al. Hypoxia-Induced LncRNA PCGEM1 Promotes Invasion and Metastasis of Gastric Cancer Through Regulating Snai1. Clin Trans Oncol: Off Publ Fed Spanish Oncol Soc Natl Cancer Instit Mexico (2019) 21(9):1142–51. doi: 10.1007/s12094-019-02035-9
17. Xu S, Tang L, Liu Z, Luo C, Cheng Q. Hypoxia-Related lncRNA Correlates With Prognosis and Immune Microenvironment in Lower-Grade Glioma. Front Immunol (2021) 12:731048. doi: 10.3389/fimmu.2021.731048
18. Shao J, Zhang B, Kuai L, Li Q. Integrated Analysis of Hypoxia-Associated lncRNA Signature to Predict Prognosis and Immune Microenvironment of Lung Adenocarcinoma Patients. Bioengineered (2021) 12(1):6186–200. doi: 10.1080/21655979.2021.1973874
19. Winter SC, Buffa FM, Silva P, Miller C, Valentine HR, Turley H, et al. Relation of a Hypoxia Metagene Derived From Head and Neck Cancer to Prognosis of Multiple Cancers. Cancer Res (2007) 67(7):3441–9. doi: 10.1158/0008-5472.CAN-06-3322
20. Feng R-M, Zong Y-N, Cao S-M, Xu R-H. Current Cancer Situation in China: Good or Bad News From the 2018 Global Cancer Statistics? Cancer Commun (London England) (2019) 39(1):22. doi: 10.1186/s40880-019-0368-6
21. Eales KL, Hollinshead KER, Tennant DA. Hypoxia and Metabolic Adaptation of Cancer Cells. Oncogenesis (2016) 5:e190. doi: 10.1038/oncsis.2015.50
22. Gilkes DM, Semenza GL, Wirtz D. Hypoxia and the Extracellular Matrix: Drivers of Tumour Metastasis. Nat Rev Cancer (2014) 14(6):430–9. doi: 10.1038/nrc3726
23. Obacz J, Pastorekova S, Vojtesek B, Hrstka R. Cross-Talk Between HIF and P53 as Mediators of Molecular Responses to Physiological and Genotoxic Stresses. Mol Cancer (2013) 12(1):93. doi: 10.1186/1476-4598-12-93
24. Huan L, Guo T, Wu Y, Xu L, Huang S, Xu Y, et al. Hypoxia Induced LUCAT1/PTBP1 Axis Modulates Cancer Cell Viability and Chemotherapy Response. Mol Cancer (2020) 19(1):11. doi: 10.1186/s12943-019-1122-z
25. Jiao Y, Li Y, Ji B, Cai H, Liu Y. Clinical Value of lncRNA LUCAT1 Expression in Liver Cancer and its Potential Pathways. J Gastrointest Liver Dis: JGLD (2019) 28(4):439–47. doi: 10.15403/jgld-356
26. Chi J, Liu T, Shi C, Luo H, Wu Z, Xiong B, et al. Long non-Coding RNA LUCAT1 Promotes Proliferation and Invasion in Gastric Cancer by Regulating miR-134-5p/YWHAZ Axis. Biomed Pharmacother = Biomed Pharmacother (2019) 118:109201. doi: 10.1016/j.biopha.2019.109201
27. Yoon J-H, You B-H, Park CH, Kim YJ, Nam J-W, Lee SK. The Long Noncoding RNA LUCAT1 Promotes Tumorigenesis by Controlling Ubiquitination and Stability of DNA Methyltransferase 1 in Esophageal Squamous Cell Carcinoma. Cancer Lett (2018) 417:47–57. doi: 10.1016/j.canlet.2017.12.016
28. Pan H, Pan J, Song S, Ji L, Lv H, Yang Z. Identification and Development of Long Non-Coding RNA-Associated Regulatory Network in Colorectal Cancer. J Cell Mol Med (2019) 23(8):5200–10. doi: 10.1111/jcmm.14395
29. Li H, Huang H, Li S, Mei H, Cao T, Lu Q. Long non-Coding RNA ADAMTS9-AS2 Inhibits Liver Cancer Cell Proliferation, Migration and Invasion. Exp Ther Med (2021) 21(6):559. doi: 10.3892/etm.2021.9991
30. Ren N, Jiang T, Wang C, Xie S, Xing Y, Piao D, et al. LncRNA ADAMTS9-AS2 Inhibits Gastric Cancer (GC) Development and Sensitizes Chemoresistant GC Cells to Cisplatin by Regulating miR-223-3p/NLRP3 Axis. Aging (2020) 12(11):11025–41. doi: 10.18632/aging.103314
31. Chen L-P, Wang H, Zhang Y, Chen Q-X, Lin T-S, Liu Z-Q, et al. Robust Analysis of Novel mRNA-lncRNA Cross Talk Based on ceRNA Hypothesis Uncovers Carcinogenic Mechanism and Promotes Diagnostic Accuracy in Esophageal Cancer. Cancer Manage Res (2019) 11:347–58. doi: 10.2147/CMAR.S183310
32. Shen MY, Zhou GR, Y Zhang Z. LncRNA MIR4435-2hg Contributes Into Colorectal Cancer Development and Predicts Poor Prognosis. Eur Rev Med Pharmacol Sci (2020) 24(4):1771–7. doi: 10.26355/eurrev_202002_20354
33. Shen X, Ding Y, Lu F, Yuan H, Luan W. Long Noncoding RNA MIR4435-2hg Promotes Hepatocellular Carcinoma Proliferation and Metastasis Through the miR-22-3p/YWHAZ Axis. Am J Trans Res (2020) 12(10):6381–94.
34. Wang H, Wu M, Lu Y, He K, Cai X, Yu X, et al. LncRNA MIR4435-2hg Targets Desmoplakin and Promotes Growth and Metastasis of Gastric Cancer by Activating Wnt/β-Catenin Signaling. Aging (2019) 11(17):6657–73. doi: 10.18632/aging.102164
35. Xu M-L, Liu T-C, Dong F-X, Meng L-X, Ling A-X, Liu S. Exosomal lncRNA LINC01711 Facilitates Metastasis of Esophageal Squamous Cell Carcinoma via the miR-326/FSCN1 Axis. Aging (2021) 13(15):19776–88. doi: 10.18632/aging.203389
36. Zha Z, Zhang P, Li D, Liu G, Lu L. Identification and Construction of a Long Noncoding RNA Prognostic Risk Model for Stomach Adenocarcinoma Patients. Dis Markers (2021) 2021:8895723. doi: 10.1155/2021/8895723
37. Xing C, Sun S-G, Yue Z-Q, Bai F. Role of lncRNA LUCAT1 in Cancer. Biomed Pharmacother = Biomed Pharmacother (2021) 134:111158. doi: 10.1016/j.biopha.2020.111158
38. Xu W, Wang B, Cai Y, Chen J, Lv X, Guo C, et al. ADAMTS9-AS2: A Functional Long Non-Coding RNA in Tumorigenesis. Curr Pharm Design (2021) 27(23):2722–7. doi: 10.2174/1381612827666210325105106
39. Nötzold L, Frank L, Gandhi M, Polycarpou-Schwarz M, Groß M, Gunkel M, et al. The Long non-Coding RNA LINC00152 Is Essential for Cell Cycle Progression Through Mitosis in HeLa Cells. Sci Rep (2017) 7(1):2265. doi: 10.1038/s41598-017-02357-0
40. Dong X, Yang Z, Yang H, Li D, Qiu X. Long Non-Coding RNA MIR4435-2hg Promotes Colorectal Cancer Proliferation and Metastasis Through miR-206/YAP1 Axis. Front Oncol (2020) 10:160. doi: 10.3389/fonc.2020.00160
41. Gao L-F, Li W, Liu Y-G, Zhang C, Gao W-N, Wang L. Inhibition of MIR4435-2HG on Invasion, Migration, and EMT of Gastric Carcinoma Cells by Mediating MiR-138-5p/Sox4 Axis. Front Oncol (2021) 11:661288. doi: 10.3389/fonc.2021.661288
42. Kong Q, Liang C, Jin Y, Pan Y, Tong D, Kong Q, et al. The lncRNA MIR4435-2HG is Upregulated in Hepatocellular Carcinoma and Promotes Cancer Cell Proliferation by Upregulating miRNA-487a. Cell Mol Biol Lett (2019) 24:26. doi: 10.1186/s11658-019-0148-y
43. Chen DS, Mellman I. Elements of Cancer Immunity and the Cancer-Immune Set Point. Nature (2017) 541(7637):321–30. doi: 10.1038/nature21349
44. Vito A, El-Sayes N, Mossman K. Hypoxia-Driven Immune Escape in the Tumor Microenvironment. Cells (2020) 9(4):992. doi: 10.3390/cells9040992
45. Multhoff G, Vaupel P. Hypoxia Compromises Anti-Cancer Immune Responses. Adv Exp Med Biol (2020) 1232:131–43. doi: 10.1007/978-3-030-34461-0_18
46. You L, Wu W, Wang X, Fang L, Adam V, Nepovimova E, et al. The Role of Hypoxia-Inducible Factor 1 in Tumor Immune Evasion. Med Res Rev (2021) 41(3):1622–43. doi: 10.1002/med.21771
47. Aran D. Cell-Type Enrichment Analysis of Bulk Transcriptomes Using Xcell. Methods Mol Biol (Clifton NJ) (2020) 2120:263–76. doi: 10.1007/978-1-0716-0327-7_19
48. Aran D, Hu Z, Butte AJ. Xcell: Digitally Portraying the Tissue Cellular Heterogeneity Landscape. Genome Biol (2017) 18(1):220. doi: 10.1186/s13059-017-1349-1
49. Li T, Fu J, Zeng Z, Cohen D, Li J, Chen Q, et al. TIMER2.0 for Analysis of Tumor-Infiltrating Immune Cells. Nucleic Acids Res (2020) 48(W1):W509–14. doi: 10.1093/nar/gkaa407
50. Li T, Fan J, Wang B, Traugh N, Chen Q, Liu JS, et al. TIMER: A Web Server for Comprehensive Analysis of Tumor-Infiltrating Immune Cells. Cancer Res (2017) 77(21):e108–10. doi: 10.1158/0008-5472.CAN-17-0307
51. Finotello F, Mayer C, Plattner C, Laschober G, Rieder D, Hackl H, et al. Molecular and Pharmacological Modulators of the Tumor Immune Contexture Revealed by Deconvolution of RNA-Seq Data. Genome Med (2019) 11(1):34. doi: 10.1186/s13073-019-0638-6
52. Petitprez F, Vano YA, Becht E, Giraldo NA, de Reyniès A, Sautès-Fridman C, et al. Transcriptomic Analysis of the Tumor Microenvironment to Guide Prognosis and Immunotherapies. Cancer Immunol Immunother: CII (2018) 67(6):981–8. doi: 10.1007/s00262-017-2058-z
53. Dienstmann R, Villacampa G, Sveen A, Mason MJ, Niedzwiecki D, Nesbakken A, et al. Relative Contribution of Clinicopathological Variables, Genomic Markers, Transcriptomic Subtyping and Microenvironment Features for Outcome Prediction in Stage II/III Colorectal Cancer. Ann Oncol: Off J Eur Soc Med Oncol (2019) 30(10):1622–9. doi: 10.1093/annonc/mdz287
54. Racle J, de Jonge K, Baumgaertner P, Speiser DE, Gfeller D. Simultaneous Enumeration of Cancer and Immune Cell Types From Bulk Tumor Gene Expression Data. eLife (2017) 6:e26476. doi: 10.7554/eLife.26476
55. Tamminga M, Hiltermann TJN, Schuuring E, Timens W, Fehrmann RS, Groen HJ. Immune Microenvironment Composition in Non-Small Cell Lung Cancer and its Association With Survival. Clin Trans Immunol (2020) 9(6):e1142. doi: 10.1002/cti2.1142
56. Chen B, Khodadoust MS, Liu CL, Newman AM, Alizadeh AA. Profiling Tumor Infiltrating Immune Cells With CIBERSORT. Methods Mol Biol (Clifton NJ) (2018) 1711:243–59. doi: 10.1007/978-1-4939-7493-1_12
57. Wang S-S, Liu W, Ly D, Xu H, Qu L, Zhang L. Tumor-Infiltrating B Cells: Their Role and Application in Anti-Tumor Immunity in Lung Cancer. Cell Mol Immunol (2019) 16(1):6–18. doi: 10.1038/s41423-018-0027-x
58. Helmink BA, Reddy SM, Gao J, Zhang S, Basar R, Thakur R, et al. B Cells and Tertiary Lymphoid Structures Promote Immunotherapy Response. Nature (2020) 577(7791):549–55. doi: 10.1038/s41586-019-1922-8
59. Kobayashi H, Enomoto A, Woods SL, Burt AD, Takahashi M, Worthley DL. Cancer-Associated Fibroblasts in Gastrointestinal Cancer. Nat Rev Gastroenterol Hepatol (2019) 16(5):282–95. doi: 10.1038/s41575-019-0115-0
60. Sobierajska K, Ciszewski WM, Sacewicz-Hofman I, Niewiarowska J. Endothelial Cells in the Tumor Microenvironment. Adv Exp Med Biol (2020) 1234:71–86. doi: 10.1007/978-3-030-37184-5_6
61. Tcyganov E, Mastio J, Chen E, Gabrilovich DI. Plasticity of Myeloid-Derived Suppressor Cells in Cancer. Curr Opin Immunol (2018) 51:76–82. doi: 10.1016/j.coi.2018.03.009
62. Casazza A, Laoui D, Wenes M, Rizzolio S, Bassani N, Mambretti M, et al. Impeding Macrophage Entry Into Hypoxic Tumor Areas by Sema3A/Nrp1 Signaling Blockade Inhibits Angiogenesis and Restores Antitumor Immunity. Cancer Cell (2013) 24(6):695–709. doi: 10.1016/j.ccr.2013.11.007
Keywords: hypoxia, lncRNA, digestive system pan-cancer, prognostic model, immune microenvironment, bioinformatics
Citation: He Z, Liu H, Guan H, Ji J, Jiang Y, Zhang N, Song Z, Wang X, Shen P, Wang H and Cui R (2022) Construction of a Prognostic Model for Hypoxia-Related LncRNAs and Prediction of the Immune Landscape in the Digestive System Pan-Cancer. Front. Oncol. 12:812786. doi: 10.3389/fonc.2022.812786
Received: 06 January 2022; Accepted: 25 March 2022;
Published: 27 April 2022.
Edited by:
Junyan Tao, University of Pittsburgh, United StatesReviewed by:
Liyuan Zhang, Second Affiliated Hospital of Soochow University, ChinaCopyright © 2022 He, Liu, Guan, Ji, Jiang, Zhang, Song, Wang, Shen, Wang and Cui. This is an open-access article distributed under the terms of the Creative Commons Attribution License (CC BY). The use, distribution or reproduction in other forums is permitted, provided the original author(s) and the copyright owner(s) are credited and that the original publication in this journal is cited, in accordance with accepted academic practice. No use, distribution or reproduction is permitted which does not comply with these terms.
*Correspondence: Rongjun Cui, Y3Vpcm9uZ2p1bkBtZGptdS5lZHUuY24=
Disclaimer: All claims expressed in this article are solely those of the authors and do not necessarily represent those of their affiliated organizations, or those of the publisher, the editors and the reviewers. Any product that may be evaluated in this article or claim that may be made by its manufacturer is not guaranteed or endorsed by the publisher.
Research integrity at Frontiers
Learn more about the work of our research integrity team to safeguard the quality of each article we publish.