
94% of researchers rate our articles as excellent or good
Learn more about the work of our research integrity team to safeguard the quality of each article we publish.
Find out more
ORIGINAL RESEARCH article
Front. Oncol., 31 January 2022
Sec. Cancer Imaging and Image-directed Interventions
Volume 12 - 2022 | https://doi.org/10.3389/fonc.2022.659096
 Lawrence Wing-Chi Chan1*†
 Tong Ding1
 Huiling Shao1Mohan Huang1William Fuk-Yuen Hui1
 William Chi-Shing Cho2*†
 Sze-Chuen Cesar Wong1
 Ka Wai Tong1
 Keith Wan-Hang Chiu3
 Luyu Huang4,5
 Haiyu Zhou4,5*
Background: Owing to the cytotoxic effect, it is challenging for clinicians to decide whether post-operative adjuvant therapy is appropriate for a non-small cell lung cancer (NSCLC) patient. Radiomics has proven its promising ability in predicting survival but research on its actionable model, particularly for supporting the decision of adjuvant therapy, is limited.
Methods: Pre-operative contrast-enhanced CT images of 123 NSCLC cases were collected, including 76, 13, 16, and 18 cases from R01 and AMC cohorts of The Cancer Imaging Archive (TCIA), Jiangxi Cancer Hospital and Guangdong Provincial People’s Hospital respectively. From each tumor region, 851 radiomic features were extracted and two augmented features were derived therewith to estimate the likelihood of adjuvant therapy. Both Cox regression and machine learning models with the selected main and interaction effects of 853 features were trained using 76 cases from R01 cohort, and their test performances on survival prediction were compared using 47 cases from the AMC cohort and two hospitals. For those cases where adjuvant therapy was unnecessary, recommendations on adjuvant therapy were made again by the outperforming model and compared with those by IBM Watson for Oncology (WFO).
Results: The Cox model outperformed the machine learning model in predicting survival on the test set (C-Index: 0.765 vs. 0.675). The Cox model consists of 5 predictors, interestingly 4 of which are interactions with augmented features facilitating the modulation of adjuvant therapy option. While WFO recommended no adjuvant therapy for only 13.6% of cases that received unnecessary adjuvant therapy, the same recommendations by the identified Cox model were extended to 54.5% of cases (McNemar’s test p = 0.0003).
Conclusions: A Cox model with radiomic and augmented features could predict survival accurately and support the decision of adjuvant therapy for bettering the benefit of NSCLC patients.
Lung cancer is the leading cause of cancer-related deaths worldwide, in which non-small cell lung cancer (NSCLC) is the most common primary lung malignancy cancer, accounting for 85% of all cases (1). For early-stage NSCLC (IA-IIB) (2), and some locally advanced NSCLC (stage IIIA) (3), complete surgical resection is considered as the most optimal treatment option. Combined modality therapy, including chemotherapy, radiation therapy and surgery, could be applied for NSCLC that cannot be completely removed by surgery (1). Despite the advancement in treatment, the recurrence rate following complete surgical resection of NSCLC tumor remains high, ranging from 30% to 75% (3). In order to reduce the recurrence rate and prolong the patient’s survival, there are two countermeasures that could be applied on the patients: pre-operative induction therapy and post-operative adjuvant therapy where their net benefits are similar. Post-operative adjuvant therapy is regarded as the better option because the clinicians can assess the patients’ pre-operative conditions for adjuvant therapy. Post-operative thoracic radiotherapy can reduce the chance of recurrence after surgery, but some previous studies revealed its detrimental effect on the patient’s survival (4). Although platinum-based chemotherapy is more suitable for stage IB, II, and III NSCLC patients, some patients could not tolerate its cytotoxic effect (4, 5). Therefore, it is necessary for clinicians to consider the survival benefits and risks of adjuvant therapy on patients.
In reality, the conventional Tumor Node Metastasis (TNM) staging system, which is the most important post-operative prognostic factor, may not be capable to stratify the recurrence risk of patients accurately. It was revealed that the recurrence and the survival time of NSCLC patients in the same TNM stage were diverse (6), and even the recurrence rate of stage IA NSCLC is still high, reaching 30% (5). Therefore, in the era of precision medicine, a quantitative predictive model is required to evaluate the recurrence risk of NSCLC patients and the effect of adjuvant therapy on survival.
Radiomics is a newly emerged field in radiology that involves the high-throughput extraction of quantitative features from the regions of interest in medical images, which allows the use of non-invasive imaging technique for monitoring tumor progression and treatment outcome. Previously, there has been substantial interest in relating the radiomic features with the prognosis and pathological response to treatments of NSCLC patients, which related radiomic features with patients’ survival (2, 7–9). However, the role of adjuvant therapy was not taken into account in these studies, and it remains unclear whether their findings could be used to evaluate the survival benefit of post-operative adjuvant therapy.
This work proposed a quantitative radiomics model that involves adjuvant-therapy-associated features for predicting the patient’s survival. The proposed model can provide the clinicians with an additional diagnostic tool to determine whether post-operative adjuvant therapy is appropriate for NSCLC patients.
This is a retrospective study on the anonymized pre-operative contrast-enhanced CT images together with the clinical information of 123 NSCLC cases that were collected, including 76, 13, 16, and 18 cases from R01 and AMC cohorts of The Cancer Imaging Archive (TCIA), Jiangxi Cancer Hospital and Guangdong Provincial People’s Hospital, respectively. For the open access image data, the CT scanning parameters are a slice thickness of 0.625–3 mm, a pixel spacing of 0.604–0.930, and an x-ray tube current of 124–699 mA at 80–140 kVp. For the image data collected from Jiangxi Cancer Hospital, the CT scanning parameters are a slice thickness of 1 mm, a pixel spacing of 0.781, and an X-ray tube current of 287 mA at 140 kVp. For the image data collected from Guangdong Provincial People’s Hospital, the CT scanning parameters are a slice thickness of 1 mm, a pixel spacing of 0.742, and an x-ray tube current of 378 mA at 120 kVp.
The open access data originally consist of 211 NSCLC cases of the R01 and AMC cohorts, which were collected between April 2008 and September 2012, from TCIA database (10–12). Institutional review board approval was waived as the patient data in TCIA have been deidentified. All the cases have undergone surgical resection of the tumor with preoperative CT performed prior to surgical procedures. Among the 211 cases, tumor segmentation was performed in 76 cases from the R01 cohort, which were used as the training set. As the segmentations were unavailable in the AMC cohort, 13 cases with clear semantic annotations of tumor manifestations were included in the test set. The test set consists of 47 cases from the AMC cohort and two hospitals. The contouring of tumors for the test set was performed by WH and KT and validated by KC based on the semantic annotations provided. The summary of the patients is shown in Table 1.
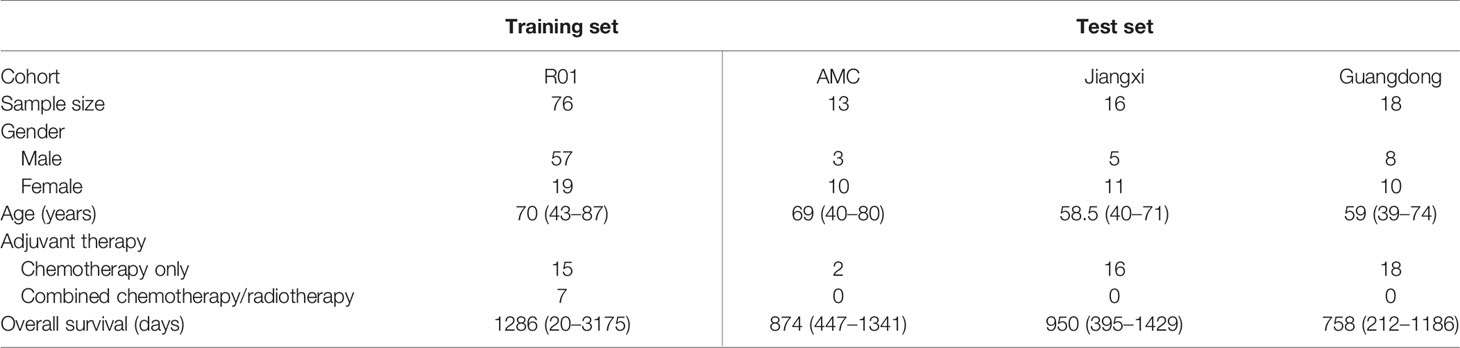
Table 1 Summary of the study cohorts. Jiangxi: Jiangxi Cancer Hospital; Guangdong: Guangdong Provincial People’s Hospital.
The radiomic features were extracted from the images using Slicer Radiomics with a fixed bin width of 25 and following the definitions provided by Image Biomarker Standardization Initiative (IBSI) (13). A total of 851 radiomic features, composed of 14 shape features, 18 intensity features, 75 texture features, and 744 wavelet features, were extracted from the regions of interest. Laplacian of Gaussian wavelet was applied to the images before extracting the wavelet features. The default bin width, 25, was applied to all texture features.
Concordance Index (C-Index) was used to quantify the performance of model, which was computed based on the following area under the curve (AUC) formula (14).
where τ represents the observe period; Pi and Pj represent the relative hazard any two patients experience; represent their survival time. The detailed procedure for computing C-Index is illustrated in Supplementary Figure 1.
Augmented features were derived based on Pearson’s correlation coefficients between primary predictors (15), which are the radiomic features in this work. As the primary predictors should follow the normal distribution, rank-based inverse normalization was performed to the radiomic features. The association level between two radiomic features, zi and zj, was denoted by CT(i, j) for the adjuvant therapy group of n1 cases and CN(i, j) for the control group of n0 cases without adjuvant therapy and is quantified by the following formulas.
Two cumulative distributions, FT and FN, formed by CT and CN, represent the association structures among radiomic features in the adjuvant therapy and control groups, which were compared using two-sample Kolmogorov–Smirnov test (16). With significant difference, the likelihood of adjuvant therapy can be estimated by two augmented features given by the following formulas (15).
In survival data, the survival time is defined as the days between dates first CT diagnosis and last known survival and the status indicates whether the time is right-censored. A linear Cox model and a machine learning model were built for comparison. For the linear model, the radiomic features were first evaluated by the rank of C-indices of the 851 univariate Cox models, where the top 203 features were selected as candidates for the multivariate Cox regression model. To examine the effect of adjuvant therapy on survival, the augmented features were included as interactions with the selected 203 radiomic features, which gave 611 candidate predictors in total. Feature selection was further performed on the 611 predictors based on the omnibus test with entry and removal criteria at 0.05 and 0.10 respectively. The nomogram was generated using the coefficients of Cox regression, and the model fit was assessed by calibration plot. The flow chart of the model identification and performance test is illustrated in Figure 1. Setting the predicted outcome as proportional hazard, a machine learning model of decision trees was fitted using XGBoost (17).
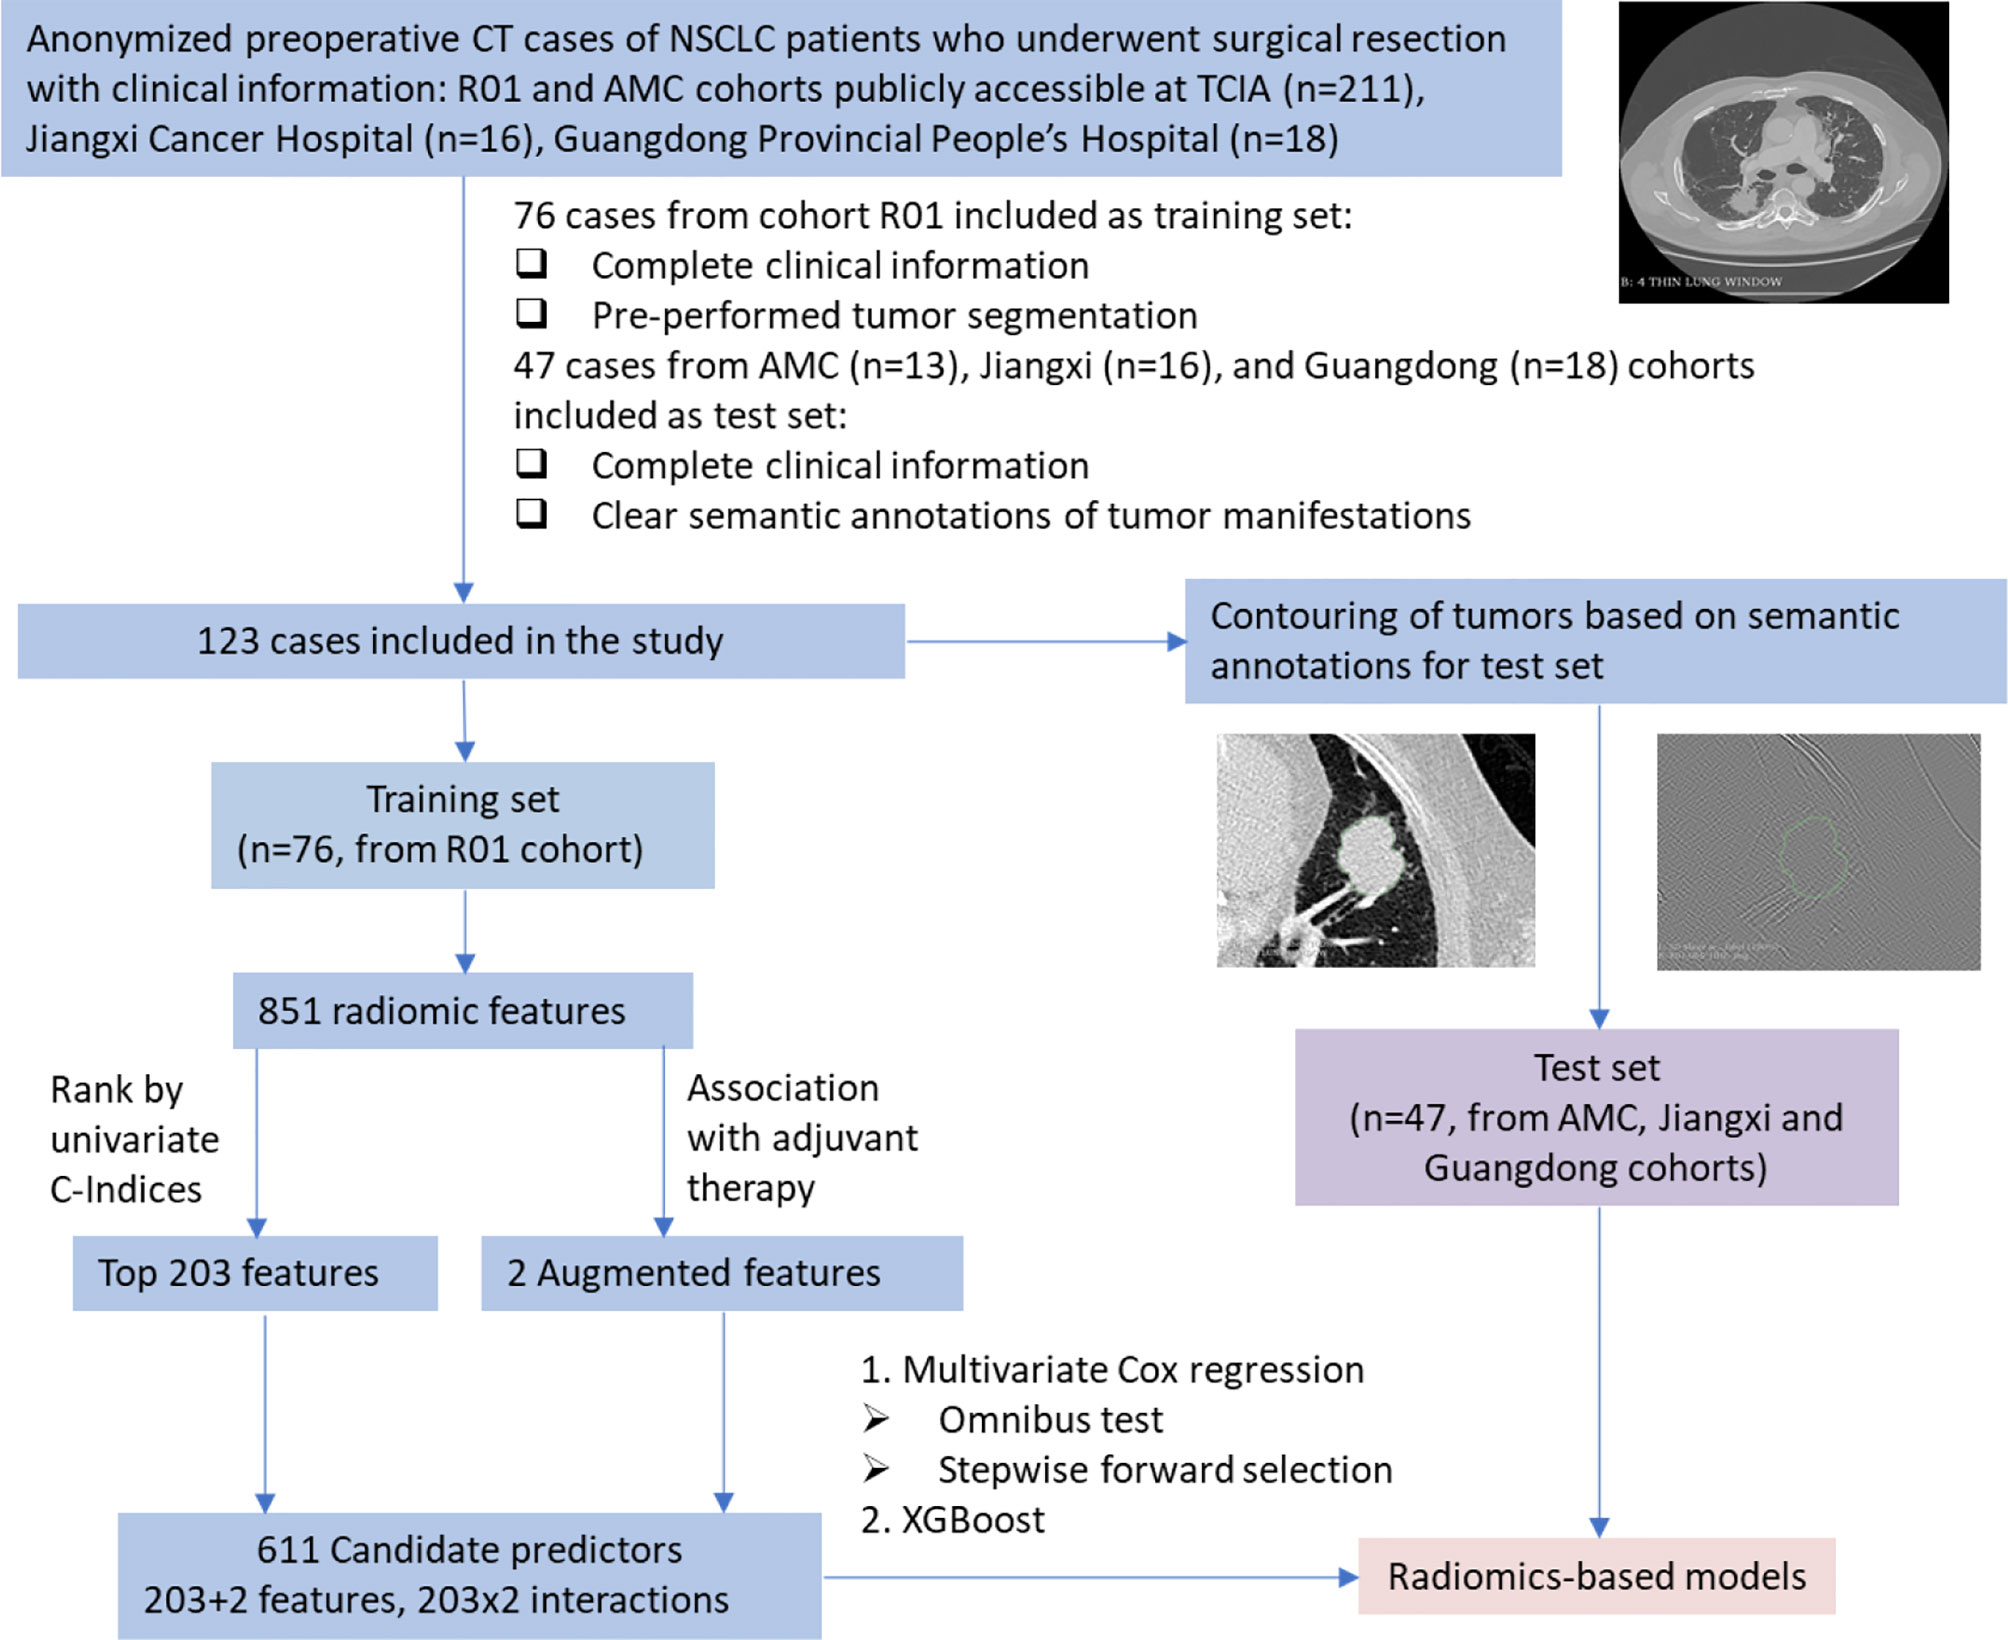
Figure 1 Flow chart of model identification and performance test. NSCLC, non-small cell lung cancer; CT, computed tomography; TCIA, The Cancer Imaging Archive; Jiangxi, Jiangxi Cancer Hospital; Guangdong, Guangdong Provincial People’s Hospital.
A risk score was defined as the log relative hazard of each patient, which was used to stratify the cases into high- and low-risk groups by the median risk scores. To examine the discriminative ability of the risk score, a two-sample log rank test was performed to the survival functions of the two groups estimated by the Kaplan–Meier estimator.
The distribution of C-Index under null hypothesis was simulated by the Monte Carlo procedure. While the panel of selected predictors were kept unchanged, the survival time together with the event status were randomly permutated 1,000 times. Using the same predictors, 1,000 null models were generated, whose C-indices were used to simulate the null distribution. Statistical significance quantified by p-value was obtained by the area under the simulated null distribution at the right tail delimited by the C-Index of the identified model.
The statistical analyses were performed by the statistical package (SPSS version 24.0), and the packages survival, rms, and xgboost in the R statistical software (version 3.6.3; www.r-project.org). p-values less than 0.05 were considered as significant.
After the predictive model has been obtained, clinical suggestion could be given by first obtaining the radiomics data of the patients and treating the two augmented features as the actionable variables. For clinicians to make clinical decisions for a new case, the risk score is inferred by inputting the radiomics data extracted from the CT images and modulating the value of for optimizing the survival benefit. In other words, the log relative hazard of the patient could be seen as a function of . The following formula deduces the values of that favor the longest survival, i.e., lowest relative risk.
where y represents the Cox model with fixed radiomic features. The values of are both between 0 and 1 and their geometric mean, GT, also falls on the same range. This work also proved that GT is inversely associated with the likelihood of adjuvant therapy. Thus, GT = 0 corresponds to adjuvant therapy and GT = 1 corresponds to no adjuvant therapy. Due to the property of geometric mean, the same implication applies to . To simulate the outcome with and without adjuvant therapy, we could simply set to be both 0 and both 1, respectively, to determine which pair gives a lower risk, i.e., (v1, v2).
Given the toxicity and side effects of adjuvant therapy, the net benefit from clinical decision is defined by whether adjuvant therapy is necessary for the patients. To do this, we defined a group of patients who did not receive adjuvant therapy, and recurrence also did not happen, implying unnecessity of adjuvant therapy.
To compare the benefits of the identified model and the actual clinical decision made by clinicians, medical information of patients, including pathologic data, such as TNM stage, was input into IBM’s Watson for Oncology (WFO) (https://www.ibm.com/watson-health/oncology-and-genomics), where the actual decision is regarded as reference. We excluded 6 patients who had local recurrence since reference data of the treatment is currently not available in WFO. We compared the proportion of better decisions made by the identified model and WFO to decide whether the model is more beneficial to the patients.
However, it is inappropriate to define a group of patients who received adjuvant therapy, and recurrence also did not happen, that could indicate the necessity of adjuvant therapy. It is because the absence of recurrence was not necessarily caused by adjuvant therapy.
The C-Index of the linear model was 0.7834 for the training data and 0.765 for the test data. It is worth noting that the test performance was not lowered by our own tumor segmentations. However, while the C-Index of the XGBoost machine learning model was 0.841 for the training data, that for the test data was only 0.675, indicating poorer performance. The trained XGBoost tree model is shown in Supplementary Figure 2. Therefore, the linear Cox model was chosen for further analysis.
When building the linear model, among the top 203 features, C-Index ranged from 0.5647 to 0.6197. The top 203 instead of the top 200 were selected because the 199th–203rd features gave the same C-Index value. The performance of radiomic features is summarized in Table 2 with respect to the four categories.
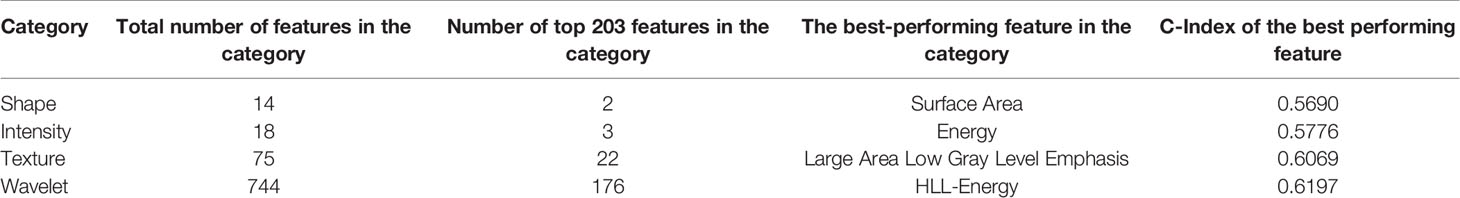
Table 2 Predictive ability of radiomic features in four categories.
As the augmented features, z’1 and z’2, represent the second-order statistics of radiomic features as shown in Equations (4) and (5), the expected level of association with adjuvant therapy can be estimated by the geometric mean, GT = (z’1×z’2)1/2. The waterfall plot of the estimated association level, GT, sorted across the cases (before rescaled) is shown in Figure 2. The median-dichotomized GT is significantly and inversely associated with adjuvant therapy (Chi-square = 4.094, p = 0.043; Ordinal by Ordinal Spearman’s ρ = −0.232, p = 0.044).
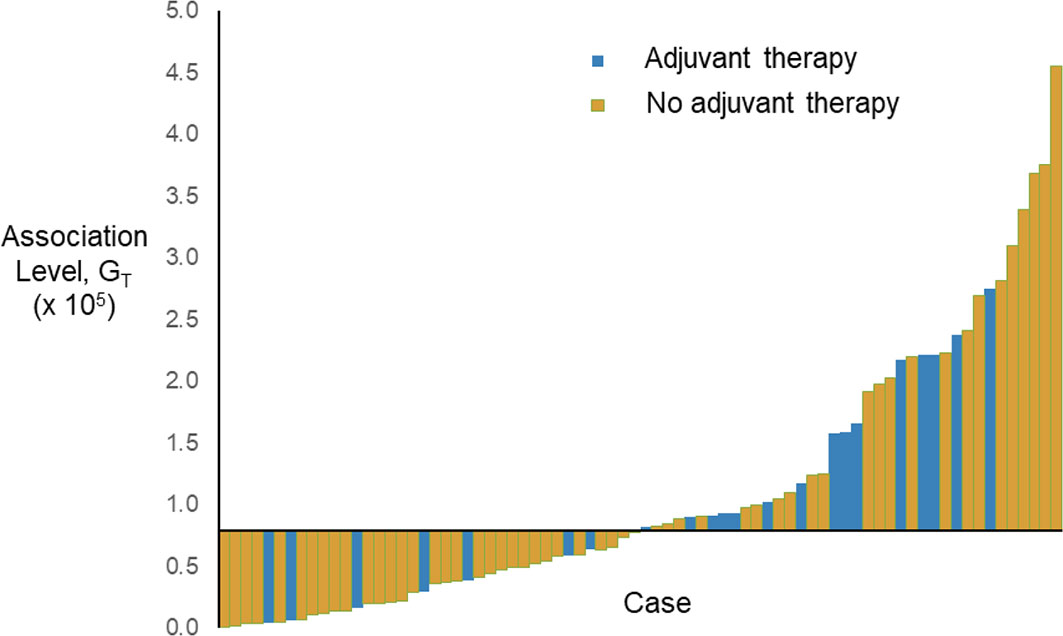
Figure 2 Waterfall plot of the estimated association level, GT, sorted across the cases (before rescaled). The horizontal axis crosses the vertical axis at the median of GT, i.e., 0.796 × 10⁵.
Statistical analysis selected 5 predictors: z47, z’1×z2, z’1×z61, z’1×z92, and z’2×z175, which are summarized in Table 3. The model is represented by the following equation.
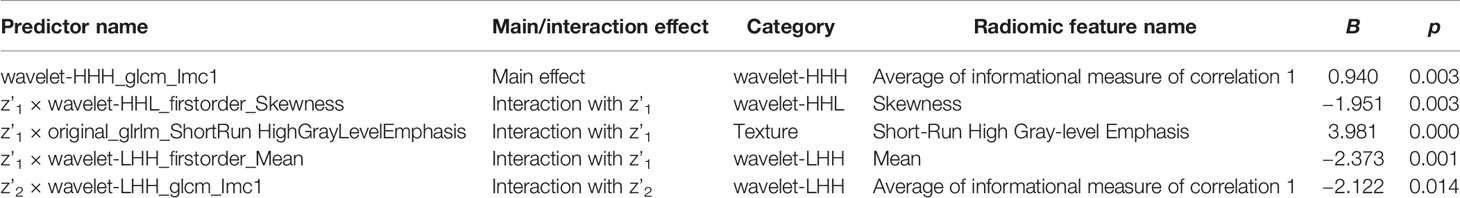
Table 3 Summary of predictors selected for multivariate Cox regression model.
where y is log of relative hazard, h(t)/h0(t); h(t) represents the expected hazard at time t and h0(t) is the baseline hazard. The correlation coefficients of all pairs of selected covariates were calculated. The range of correlation coefficients is −0.291 to 0.512, implying that the collinearity between the model covariates is very low. The nomogram of the model is shown in Figure 3A.
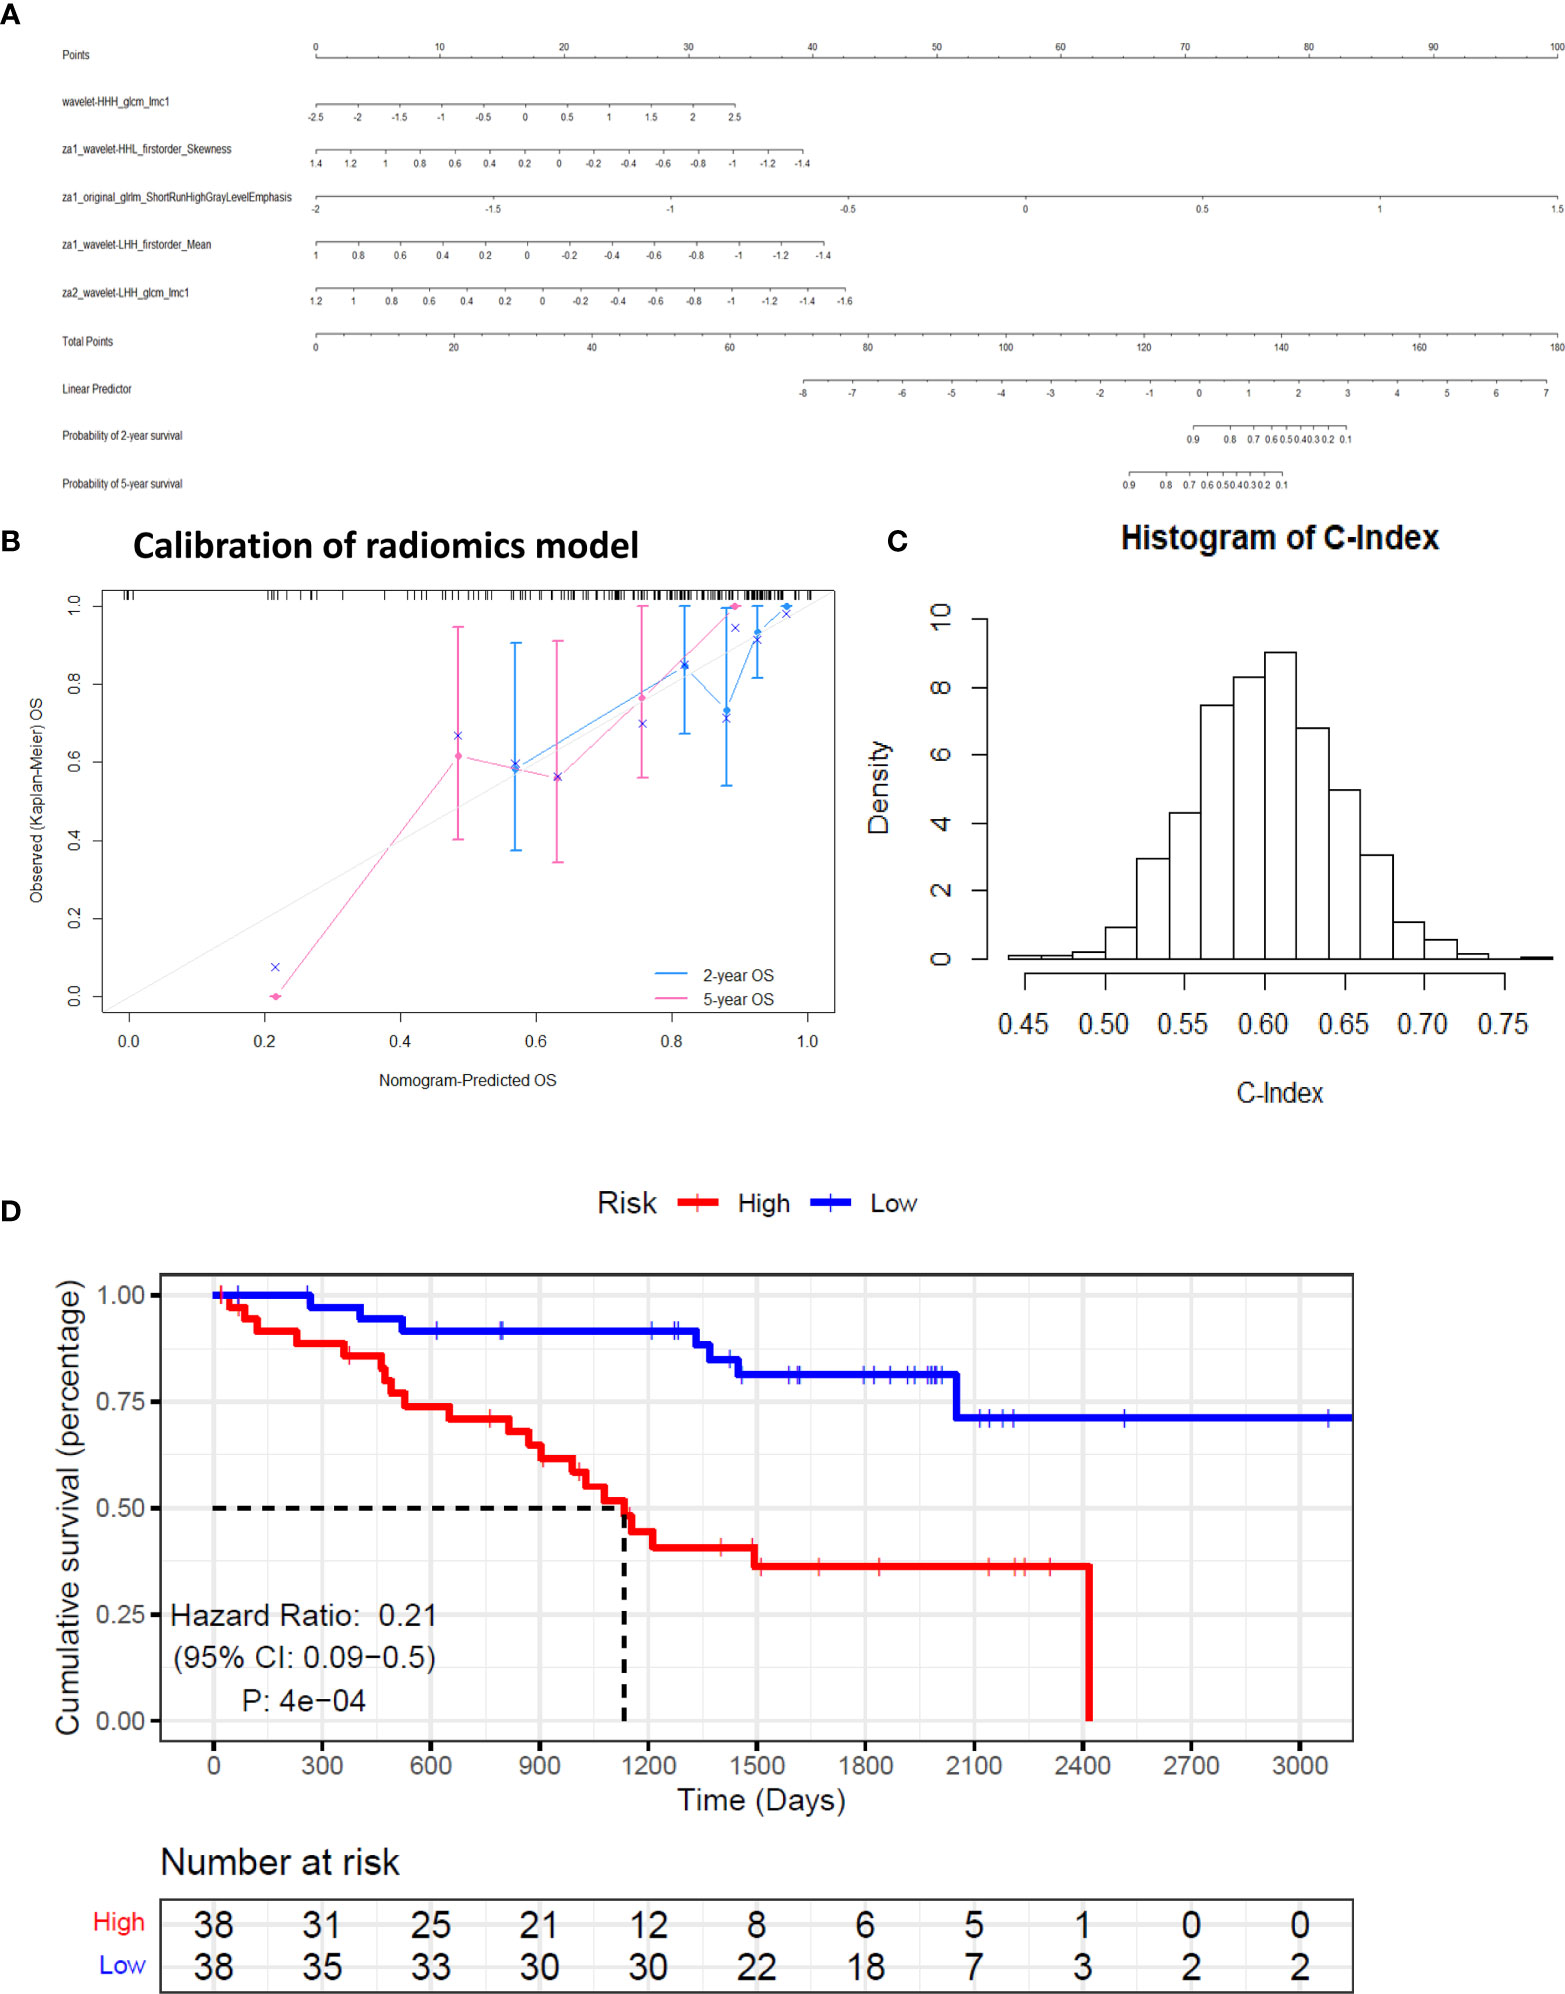
Figure 3 Calibration and performance of the identified model based on training set. (A) The identified model was illustrated as a nomogram to predict overall survival (OS). (B) Calibration of the model. (C) Simulated null distribution of C-Index. (D) Kaplan–Meier estimates of the survival functions of the high- and low-risk groups.
The augmented features representing the summaries of all the 851 radiomic features help stabilize the predictor values, which may be perturbed by the variation in manual tumor segmentations. The predicted overall survival (OS) was well calibrated with the Kaplan-Meier estimated OS at 2 and 5 years (Figure 3B). The simulated null distribution of the C-Index is shown in Figure 3C, which centered at 0.602, with a standard deviation of 0.0444. The highest simulated C-Index, 0.7684, is smaller than the C-Index of the identified model, 0.7834. Based on the right tail of the null distribution, the p-value of the identified model is empirically zero. Kaplan–Meier estimates of survival functions of the high- and low-risk groups are illustrated in Figure 3D (log-rank test, p < 0.01). Clearly from the result, individuals in the low-risk group have significantly better survival.
In addition, the simulation showed that the random performance may not be C-Index = 0.5, which was frequently assumed by previous studies (18). The criteria for significant performance may be more stringent as the null distribution was shifted to the right based on our observation.
The suggestion on adjuvant therapy was given by minimizing the log relative hazard in Equation 7. Two representative cases, R01-001 and R01-065, were compared in Figure 4 as an illustration of the clinical suggestions on adjuvant therapy. It was clearly shown in these two cases that the predicted risk scores accorded with the survival time and the suggestions on adjuvant therapy complied with the original decisions.
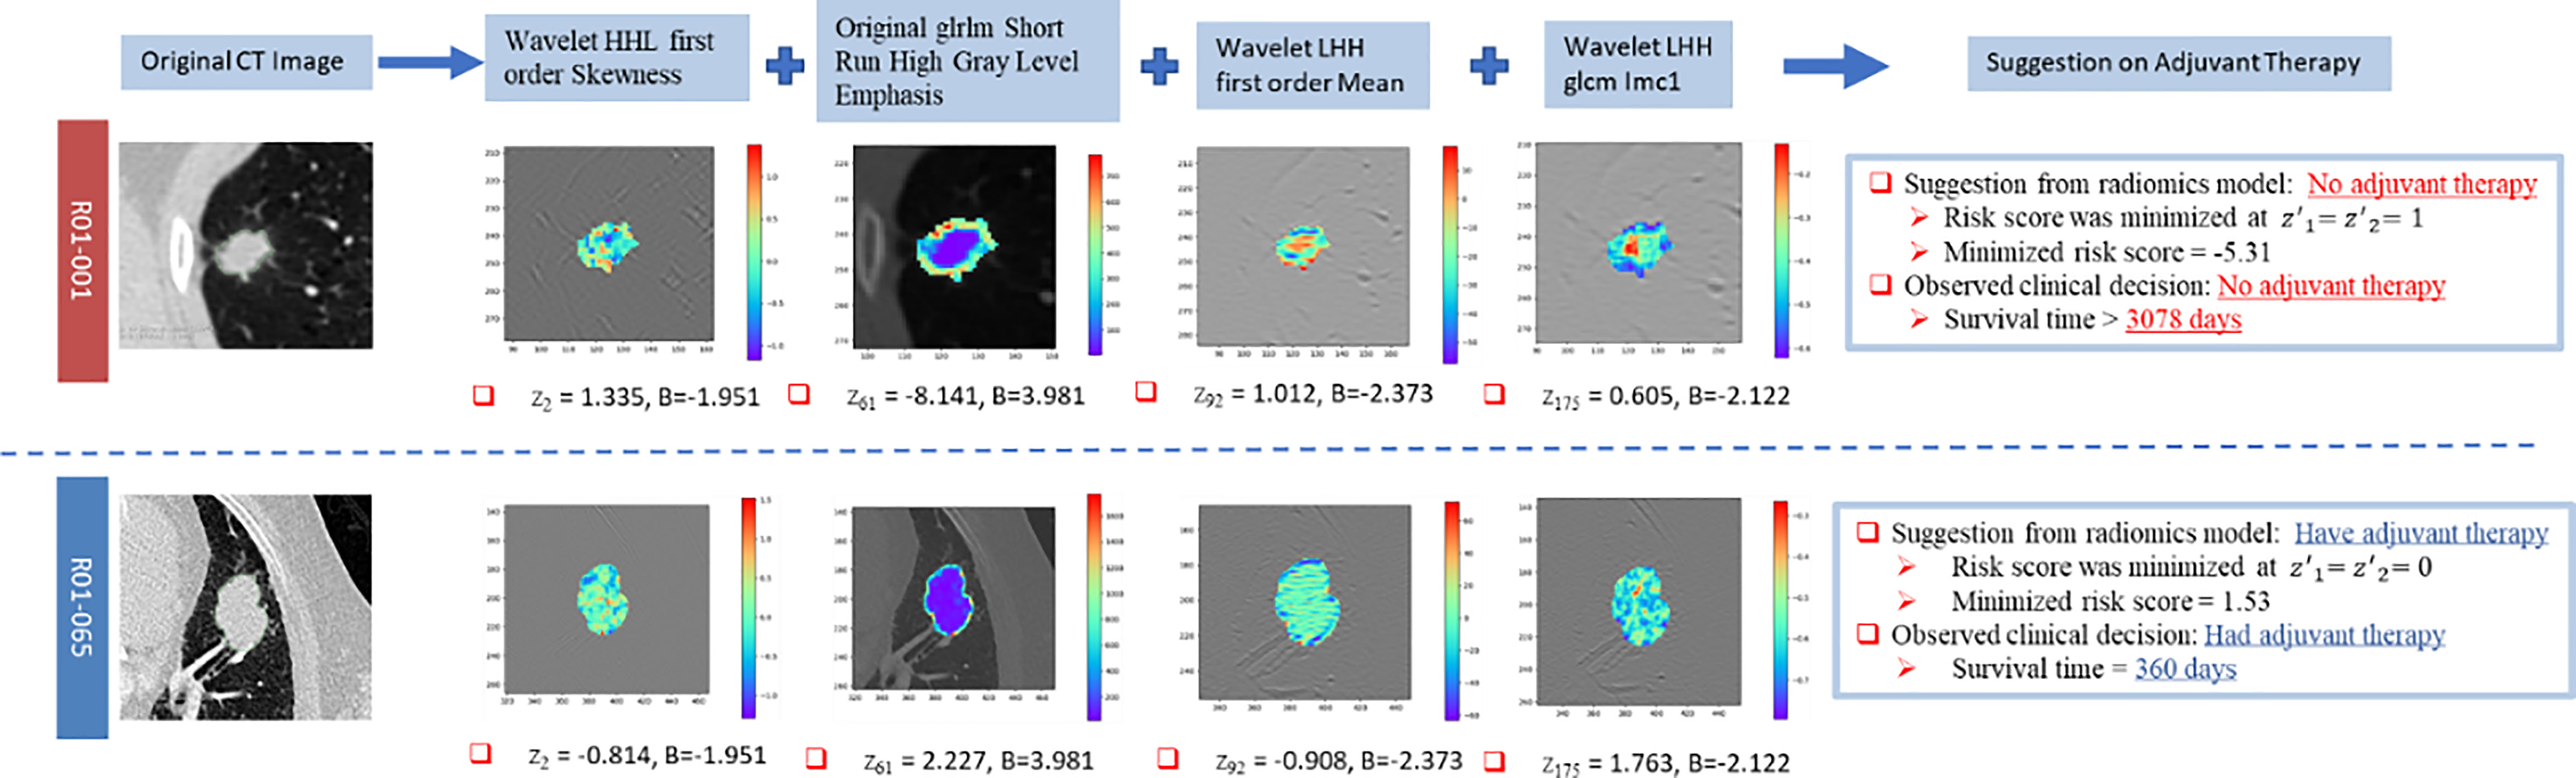
Figure 4 Illustration of the clinical suggestions on adjuvant therapy by two representative cases based on the identified model. “B” represents the coefficient of the corresponding covariate in the Cox model.
Comparison between the adjuvant therapy options suggested by the identified radiomic Cox model and WFO is shown in Table 4. Whereas only 13.6% of clinical decisions given by WFO were beneficial to the patients, the radiomic Cox model gave 52.0% better clinical suggestions (McNemar’s test χ2 = 13.136; p = 0.0003).
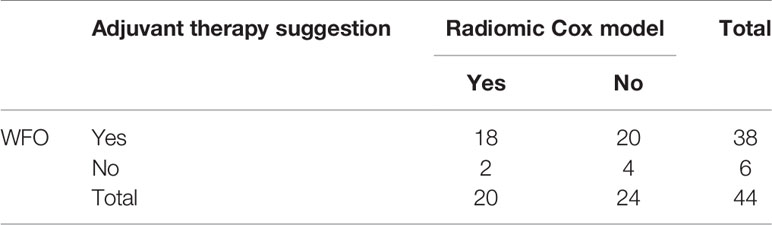
Table 4 Comparison between radiomic Cox model and WFO on patient’s benefit.
The present study proposed a predictive model based on radiomic features associated with adjuvant therapy. It achieved a high prediction accuracy, where the prediction power was proved to be statistically significant. The model could serve as an additional tool to help the clinicians know more about the survival benefits of adjuvant therapy for a NSCLC patient.
The identified model consists of 5 radiomic features. Wavelet filters were applied before the extraction of 3 radiomic features: Average of informational measure of correlation 1 (IMC1), Skewness, and Mean. A texture feature without filtering, Short-Run High Gray-level Emphasis (SRHGLE), was also selected. SRHGLE quantifies the distribution of the short homogeneous runs with low or high gray levels. It was found previously that SRHGLE was significantly associated with progression-free survival where hazard ratio = 2.43 (p = 0.005) concurs with the positive coefficient obtained in this work (19). IMC1 assesses the correlation between the probability distributions of two pixels separated by 1-pixel distance that quantifies the complexity of the texture based on mutual information. Tumor spatial heterogeneity was characterized by IMC1, whose exponential increase was associated with shorter overall survival in NSCLC (20). The extraction of IMC1 was performed after applying wavelet-HHH and wavelet-LHH in this work. In another study, multivariate regression analysis of radiomic features extracted from baseline CT showed that skewness of positive pixel values was associated with overall survival (21). Mean is a typical radiomic feature for classifying the tumor histopathology of NSCLC (22).
It was observed from the top 203 features and selected predictors that wavelet features have superior performance than other features in terms of C-Index and the high-frequency filters could enhance the characterization of the underlying physiopathology and anatomy of NSCLC tumor.
In this study, the performance of the Cox model and the machine learning model in predicting survival on the test set attained C-indices of 0.765 and 0.675, respectively. In contrast, Aerts et al. developed a similar Cox model based on radiomic features where the highest C-Index attained was 0.69 only (18).
The selected radiomic features, wavelet-LHH_firstorder_Mean and wavelet-LHH_glcm_Imc1, are classified in the wavelet category, which were computed after applying the wavelet-LHH filter onto the CT images. The wavelet-LHH filter applies low-pass filter on the x-dimension and high-pass filter on the y- and z-dimensions of CT images. For another selected predictor, wavelet-HHH filter was also applied before extracting IMC1. The high-frequency filter can enhance the tumor spatial heterogeneity to be quantified by IMC1 and thus the determination of tumor solid components. It is consistent with a previous study on lung cancer that solid components were regarded as invasive (23). A similar effect of high-frequency filter, wavelet-HHL, was found on skewness as a similar negative coefficient was estimated.
In the identified model, the relative hazard was related to not only the radiomic features, but also two augmented features, which reflect the likelihood of adjuvant therapy due to the significant association with their geometric mean, GT (p = 0.043). The inverse association of augmented features with adjuvant therapy implies that the clinical decision less likely supports adjuvant therapy when the augmented features tend to 1 and more likely supports adjuvant therapy when the augmented features tend to 0. With the identified model, two survival functions can be derived by setting the augmented features to 0 for adjuvant therapy and 1 for no adjuvant therapy, respectively. Before surgery, patient’s survival durations and benefits with and without adjuvant therapy can be simulated by the two survival functions using Harrell’s approach (24).
From the European Society for Medical Oncology (ESMO) guideline, it has become clear in the past two decades that adjuvant chemotherapy benefits stage II and stage III NSCLC by improving 4%–5% absolute survival at 5 years (25). However, adjuvant chemotherapy is not recommended for stage IA and its benefit in stage IB is small based on lower evidence (26). However, the proposed model could enrich the ESMO guideline to predict the benefit of adjuvant therapy option in NSCLC at any stage.
While Watson for Oncology made decisions referring to the NCCN guideline and clinicians in Memorial Sloan Kettering based mainly on clinical information including pathological stages and ages, our model was identified based on the pre-operative CT. The significant benefit on the decision of adjuvant therapy of our model over Watson for Oncology shows the power of pre-operative CT imaging in predicting tumor progression and indicating treatment plans. In clinical practice, the poor tumor response to adjuvant therapy predicted by clinical and histopathological factors suggests a “watch and wait” approach. To provide more prognostically informative indicators for those predicted non-responders, researchers proposed to grade the colorectal cancer by counting the poorly differentiated clusters (PDCs) of neoplastic cells in histological samples and pre-operative biopsies (27, 28). A significant association between PDC grade and survival was found. The finding of this study reveals the potential of the Cox model with radiomic features in complementing the PDC grading system for the best survival benefit in NSCLC.
A similar research study was performed to develop and validate a quantitative radiomic risk score (QuRiS) for stratifying the early-stage NSCLC patients into high-, intermediate-, and low-risk groups, and the associated nomogram (QuRNom) for estimating the survival benefit (29). It was found in the high-risk group identified by QuRiS that the survival time of patients received adjuvant chemotherapy after surgery was significantly longer than patients who underwent surgery alone. The survival benefit estimated by QuRNom can predict the improvement of survival time by adjuvant chemotherapy. However, the report benefit was focused on a group of patients but not individuals. The variation of features among individuals within the same risk group cannot be addressed by such approach. In contrast, this study proposed and developed a theranostic model that can quantify the change in survival or relapse time due to the treatment and indicate the individual’s benefit.
The interobserver variability of the cases was unknown as it requires contouring. In addition, combination of clinical features was not performed in our model.
As more high-throughput radiomics data become accessible and available, personalized medicine through radiomics can help in the clinical treatment and prolong the patients’ survival case by case. The current study proposed a survival model that can predict the survival benefits of adjuvant therapy in NSCLC without reliance on stage, which can help in the clinical decisions. The model building process can also help future studies in dealing with high-dimensional data analysis.
Publicly available datasets were analyzed in this study. These data can be found here: https://wiki.cancerimagingarchive.net/display/Public/NSCLC+Radiogenomics.
As the publicly available data have been anonymized, institutional review board approval was waived. Institutional review board approval was obtained from Research Ethics Committee, Jiangxi Cancer Hospital (2021ky039) and Research Ethics Committee, Guangdong Provincial People’s Hospital, Guangdong Academy of Medical Sciences (GDREC2020233H(R1)).
LC: Original draft, conceptualization, funding acquisition, project coordination, supervision, writing, review & editing. TD: Methodology, data curation, visualization, writing, review & editing. HS: Methodology & visualization. MH: review & editing. WH: Original draft, conceptualization. WC: Supervision, project administration, methodology, writing, review & editing. S-CW: Methodology, review & editing. KT: review & editing. KC: Methodology, review & editing. LH: Methodology, review & editing. HZ: Funding acquisition, project coordination, supervision, writing, review & editing. All authors contributed to the article and approved the submitted version.
This study was funded by two Health and Medical Research Funds (HMRF 02131026 and HMRF 16172561) of Food and Health Bureau, Hong Kong; Huawei Technologies Co. Ltd. Collaborative Research Fund 2021 (PolyU Ref.: ZGBH); the Guangdong Province Medical Scientific Research Foundation (Grant Number B2018148); Science and Technology Program of Guangzhou (Grant Number 201903010028); and Natural Science Foundation of Guangdong (Grant Number 2018A0303130113). The funder was not involved in the study design, collection, analysis, interpretation of data, the writing of this article or the decision to submit it for publication.
The authors declare that the research was conducted in the absence of any commercial or financial relationships that could be construed as a potential conflict of interest.
All claims expressed in this article are solely those of the authors and do not necessarily represent those of their affiliated organizations, or those of the publisher, the editors and the reviewers. Any product that may be evaluated in this article, or claim that may be made by its manufacturer, is not guaranteed or endorsed by the publisher.
We thank MEDcentra Technology Limited and Infiniti MINDS Limited for supporting the computing platform, project management, and technology services. We also appreciate that PolyU radiography students, Cheung Pak Kin, Chung Tak Yu, Ho Hoi Kiu, Lo Chi Fung, Tsoi Wing Hei, and Wong Yiu Ting, performed the data entry to Watson for Oncology.
The Supplementary Material for this article can be found online at: https://www.frontiersin.org/articles/10.3389/fonc.2022.659096/full#supplementary-material
Supplementary Figure 1 | Procedure for computing Concordance Index
Supplementary Figure 2 | Trees generated from XGBoost. “Gain” represents the improvement in accuracy that a feature brings to the branch on which it is on, “Cover” is the relative amount of observation concerned by a feature. While the baseline hazard h(0) is set as 0.5, the predicted hazard, h(t) is given by 0.5*exp(s) where the value s represents the summed leaf value.
1. Coroller TP, Grossmann P, Hou Y, Rios Velazquez E, Leijenaar RT, Hermann G, et al. CT-Based Radiomic Signature Predicts Distant Metastasis in Lung Adenocarcinoma. Radiother Oncol (2015) 114(3):345–50. doi: 10.1016/j.radonc.2015.02.015
2. Huang Y, Liu Z, He L, Chen X, Pan D, Ma Z, et al. Radiomics Signature: A Potential Biomarker for the Prediction of Disease-Free Survival in Early-Stage (I or II) Non-Small Cell Lung Cancer. Radiology (2016) 281(3):947–57. doi: 10.1148/radiol.2016152234
3. Sasaki H, Suzuki A, Tatematsu T, Shitara M, Hikosaka Y, Okuda K, et al. Prognosis of Recurrent Non-Small Cell Lung Cancer Following Complete Resection. Oncol Lett (2014) 7(4):1300–4. doi: 10.3892/ol.2014.1861
4. Tiseo M, Franciosi V, Grossi F, Ardizzoni A. Adjuvant Chemotherapy for Non-Small Cell Lung Cancer: Ready for Clinical Practice? Eur J Cancer (2006) 42(1):8–16. doi: 10.1016/j.ejca.2005.08.031
5. Wakelee H, Dubey S, Gandara D. Optimal Adjuvant Therapy for Non-Small Cell Lung Cancer–How to Handle Stage I Disease. Oncologist (2007) 12(3):331–7. doi: 10.1634/theoncologist.12-3-331
6. Wang X, Janowczyk A, Zhou Y, Thawani R, Fu P, Schalper K, et al. Prediction of Recurrence in Early Stage Non-Small Cell Lung Cancer Using Computer Extracted Nuclear Features From Digital H&E Images. Sci Rep (2017) 7(1):13543. doi: 10.1038/s41598-017-13773-7
7. Thawani R, McLane M, Beig N, Ghose S, Prasanna P, Velcheti V, et al. Radiomics and Radiogenomics in Lung Cancer: A Review for the Clinician. Lung Cancer (2018) 115:34–41. doi: 10.1016/j.lungcan.2017.10.015
8. Kirienko M, Cozzi L, Antunovic L, Lozza L, Fogliata A, Voulaz E, et al. Prediction of Disease-Free Survival by the PET/CT Radiomic Signature in Non-Small Cell Lung Cancer Patients Undergoing Surgery. Eur J Nucl Med Mol Imaging (2018) 45(2):207–17. doi: 10.1007/s00259-017-3837-7
9. Depeursinge A, Yanagawa M, Leung AN, Rubin DL. Predicting Adenocarcinoma Recurrence Using Computational Texture Models of Nodule Components in Lung CT. Med Phys (2015) 42(4):2054–63. doi: 10.1118/1.4916088
10. Bakr S, Gevaert O, Echegaray S, Ayers K, Zhou M, Shafiq M, et al. A Radiogenomic Dataset of Non-Small Cell Lung Cancer. Sci Data (2018) 5:180202. doi: 10.1038/sdata.2018.202
11. Gevaert O, Xu J, Hoang CD, Leung AN, Xu Y, Quon A, et al. Non-Small Cell Lung Cancer: Identifying Prognostic Imaging Biomarkers by Leveraging Public Gene Expression Microarray Data–Methods and Preliminary Results. Radiology (2012) 264(2):387–96. doi: 10.1148/radiol.12111607
12. Clark K, Vendt B, Smith K, Freymann J, Kirby J, Koppel P, et al. The Cancer Imaging Archive (TCIA): Maintaining and Operating a Public Information Repository. J Digit Imaging (2013) 26(6):1045–57. doi: 10.1007/s10278-013-9622-7
13. van Griethuysen JJM, Fedorov A, Parmar C, Hosny A, Aucoin N, Narayan V, et al. Computational Radiomics System to Decode the Radiographic Phenotype. Cancer Res (2017) 77(21):e104–e7. doi: 10.1158/0008-5472.CAN-17-0339
14. Pencina MJ, D’Agostino RB Sr, Song L. Quantifying Discrimination of Framingham Risk Functions With Different Survival C Statistics. Stat Med (2012) 31(15):1543–53. doi: 10.1002/sim.4508
15. Chan LWC, Wong SCC, Chiau CC, Chan TM, Tao L, Feng J, et al. Association Patterns of Ontological Features Signify Electronic Health Records in Liver Cancer. J Healthc Eng (2017) 2017:6493016. doi: 10.1155/2017/6493016
16. Chan LW, Lin X, Yung G, Lui T, Chiu YM, Wang F, et al. Novel Structural Co-Expression Analysis Linking the NPM1-Associated Ribosomal Biogenesis Network to Chronic Myelogenous Leukemia. Sci Rep (2015) 5:10973. doi: 10.1038/srep10973
17. Chen T, Guestrin C eds. Xgboost: A Scalable Tree Boosting System. Proceedings of the 22nd Acm Sigkdd International Conference on Knowledge Discovery and Data Mining. San Francisco California USA: Association for Computing Machinery, New York, NY, United States (2016).
18. Aerts HJ, Velazquez ER, Leijenaar RT, Parmar C, Grossmann P, Carvalho S, et al. Decoding Tumour Phenotype by Noninvasive Imaging Using a Quantitative Radiomics Approach. Nat Commun (2014) 5:4006. doi: 10.1038/ncomms5006
19. Jiangdian S, Di D, Yanqi H, Yali Z, Zaiyi L, Jie T. Association Between Tumor Heterogeneity and Progression-Free Survival in Non-Small Cell Lung Cancer Patients With EGFR Mutations Undergoing Tyrosine Kinase Inhibitors Therapy. Conf Proc IEEE Eng Med Biol Soc (2016) 2016:1268–71. doi: 10.1109/EMBC.2016.7590937
20. Dercle L, Fronheiser M, Lu L, Du S, Hayes W, Leung DK, et al. Identification of Non-Small Cell Lung Cancer Sensitive to Systemic Cancer Therapies Using Radiomics. Clin Cancer Res (2020) 26(9):2151–62. doi: 10.1158/1078-0432.CCR-19-2942
21. Bak SH, Park H, Sohn I, Lee SH, Ahn MJ, Lee HY. Prognostic Impact of Longitudinal Monitoring of Radiomic Features in Patients With Advanced Non-Small Cell Lung Cancer. Sci Rep (2019) 9(1):8730. doi: 10.1038/s41598-019-45117-y
22. Patil R, Mahadevaiah G, Dekker A. An Approach Toward Automatic Classification of Tumor Histopathology of Non-Small Cell Lung Cancer Based on Radiomic Features. Tomography (2016) 2(4):374–7. doi: 10.18383/j.tom.2016.00244
23. Postmus PE, Kerr KM, Oudkerk M, Senan S, Waller DA, Vansteenkiste J, et al. Early and Locally Advanced Non-Small-Cell Lung Cancer (NSCLC): ESMO Clinical Practice Guidelines for Diagnosis, Treatment and Follow-Up. Ann Oncol (2017) 28(suppl_4):iv1–iv21. doi: 10.1093/annonc/mdx222
24. Harrell FE. Regression Modeling Strategies: With Applications to Linear Models, Logistic and Ordinal Regression, and Survival Analysis. Cham: Springer (2015). doi: 10.1007/978-3-319-19425-7
25. Chemotherapy in non-Small Cell Lung Cancer: A Meta-Analysis Using Updated Data on Individual Patients From 52 Randomised Clinical Trials. Non-Small Cell Lung Cancer Collaborative Group. BMJ (1995) 311(7010):899–909. doi: 10.1136/bmj.311.7010.889
26. Artal Cortes A, Calera Urquizu L, Hernando Cubero J. Adjuvant Chemotherapy in Non-Small Cell Lung Cancer: State-of-the-Art. Transl Lung Cancer Res (2015) 4(2):191–7. doi: 10.3978/j.issn.2218-6751.2014.06.01
27. Ueno H, Kajiwara Y, Shimazaki H, Shinto E, Hashiguchi Y, Nakanishi K, et al. New Criteria for Histologic Grading of Colorectal Cancer. Am J Surg Pathol (2012) 36:193–201. doi: 10.1097/PAS.0b013e318235edee
28. Reggiani Bonetti L, Lionti S, Domati F, Pagliani G, Mattioli E, Barresi V. Histological Grading Based on Poorly Differentiated Clusters Is Predictive of Tumour Response and Clinical Outcome in Rectal Carcinoma Treated With Neoadjuvant Chemoradiotherapy. Histopathology (2017) 71:393–405. doi: 10.1111/his.13242
29. Vaidya P, Bera K, Gupta A, Wang X, Corredor G, Fu P, et al. CT Derived Radiomic Score for Predicting the Added Benefit of Adjuvant Chemotherapy Following Surgery in Stage I, II Resectable Non-Small Cell Lung Cancer: A Retrospective Multicohort Study for Outcome Prediction. Lancet Digital Health (2020) 2:e116–28. doi: 10.1016/S2589-7500(20)30002-9
Keywords: non-small cell lung cancer (NSCLC), radiomics, adjuvant therapy (post-operative), prediction model, patient benefit
Citation: Chan LW-C, Ding T, Shao H, Huang M, Hui WF-Y, Cho WC-S, Wong S-CC, Tong KW, Chiu KW-H, Huang L and Zhou H (2022) Augmented Features Synergize Radiomics in Post-Operative Survival Prediction and Adjuvant Therapy Recommendation for Non-Small Cell Lung Cancer. Front. Oncol. 12:659096. doi: 10.3389/fonc.2022.659096
Received: 27 January 2021; Accepted: 03 January 2022;
Published: 31 January 2022.
Edited by:
Hyunjin Park, Sungkyunkwan University, South KoreaReviewed by:
Jiangdian Song, China Medical University, ChinaCopyright © 2022 Chan, Ding, Shao, Huang, Hui, Cho, Wong, Tong, Chiu, Huang and Zhou. This is an open-access article distributed under the terms of the Creative Commons Attribution License (CC BY). The use, distribution or reproduction in other forums is permitted, provided the original author(s) and the copyright owner(s) are credited and that the original publication in this journal is cited, in accordance with accepted academic practice. No use, distribution or reproduction is permitted which does not comply with these terms.
*Correspondence: Lawrence Wing-Chi Chan, d2luZy5jaGkuY2hhbkBwb2x5dS5lZHUuaGs=; William Chi-Shing Cho, Y2hvY3NAaGEub3JnLmhr; Haiyu Zhou, emhvdWhhaXl1QGdkcGgub3JnLmNu
†ORCID: Lawrence Wing-Chi Chan, orcid.org/0000-0001-6451-2273
William Chi-Shing Cho, orcid.org/0000-0003-4174-4586
Disclaimer: All claims expressed in this article are solely those of the authors and do not necessarily represent those of their affiliated organizations, or those of the publisher, the editors and the reviewers. Any product that may be evaluated in this article or claim that may be made by its manufacturer is not guaranteed or endorsed by the publisher.
Research integrity at Frontiers
Learn more about the work of our research integrity team to safeguard the quality of each article we publish.