 Jing Zhang
 Ying-Jun Wang2,3
 Yan-Qiu Han
94% of researchers rate our articles as excellent or good
Learn more about the work of our research integrity team to safeguard the quality of each article we publish.
Find out more
ORIGINAL RESEARCH article
Front. Oncol., 13 January 2023
Sec. Molecular and Cellular Oncology
Volume 12 - 2022 | https://doi.org/10.3389/fonc.2022.1074057
This article is part of the Research TopicNovelties in Acute Myeloid Leukemia: From Biology to Clinical ApplicationsView all 13 articles
Acute myeloid leukemia (AML) is one of the most common malignant blood neoplasma in adults. The prominent disease heterogeneity makes it challenging to foresee patient survival. Autophagy, a highly conserved degradative process, played indispensable and context-dependent roles in AML. However, it remains elusive whether autophagy-associated stratification could accurately predict prognosis of AML patients. Here, we developed a prognostic model based on autophagy-associated genes, and constructed scoring systems that help to predicte the survival of AML patients in both TCGA data and independent AML cohorts. The Nomogram model also confirmed the autophagy-associated model by showing the high concordance between observed and predicted survivals. Additionally, pathway enrichment analysis and protein-protein interaction network unveiled functional signaling pathways that were associated with autophagy. Altogether, we constructed the autophagy-associated prognostic model that might be likely to predict outcome for AML patients, providing insights into the biological risk stratification strategies and potential therapeutic targets.
Acute myeloid leukemia (AML), the most common acute leukemia in adults, is a heterogeneous group of leukemias characterized by aberrant clone transformation of hematopoietic precursors through the acquisition of chromosomal arrangements and abnormal gene expression patterns, exhibiting partial or complete arrest of maturation in the bone marrow, peripheral blood or other tissues (1). With application and refinement of the detection methodology such as chromosome banding, fluorescence in situ hybridization/chromosomal painting and the next generation sequencing, there have been incremental understanding of abnormal genetic and molecular alterations in the pathogenesis of AML (2).With these efforts, it is gradually accepted that AML is rather an umbrella diagnosis that comprises diverse subtypes with different prognostic and predictive markers, which are recommended for distinguished classification criteria and require selective and possible targeted therapies (3, 4). However, approximately half of AML patients lack predicable or prognostic biomarker and widely variable transcriptome data and the overall prognosis remains dismal [5-year overall survival 28.7%] (5), highlighting the need for identifying novel genetic and molecular predictors.
Autophagy is a critical intracellular degradative process, leading to the turnover of cellular material and providing macromolecular precursors (6). Dysfunctional autophagy has been implicated linked to multiple disorders especially in cancer cells (7), but its biological roles vary a lot and the pathophysiologic mechanism has not yet been fully elucidated. As is mentioned, autophagy is required for hematopoietic stem cell (HSC) survival as well as normal hematopoiesis (8). Dysfunctional autophagy raises the occurrence of hematological malignant neoplasms especially in leukemia (9). However, the exact role of autophagy in leukemogenesis remains debatable, in that it appears to be both leukemia-promoting and -suppressive. Some thought that reduced level of autophagy-related genes might be beneficial for AML cells due to decreased autophagic flux with accumulation of impaired mitochondrial within leukemic cells. For example, a body of evidence suggested that key autophagy genes such as ULK1, ATG3, ATG4D and ATG5 were significantly downregulated in primary AML cells compared to normal granulocytes (10). Lower expression of Beclin-1, LC3, UVRAG, Rubicon and NBR1 were identified in the high-risk AML patient group with higher white blood cell(WBC) counts and worse overall survival (11). Marine studies demonstrated that inhibition of autophagy by deletion of Atg5 or Atg7 prolonged survival in leukemic mice and decreased functional leukemia-initial cells (LICs) (12). However, others found that the autophagy flux was significantly higher in AML patients with TP53 mutations and inactivation of the autophagy triggered a p53-dependent increase in apoptosis in AML CD34+ cells (13). Nguye et al. reported loss of the autophagy receptor p62 deteriorated the expansion and colony-forming ability and impaired leukemia progression in murine models (14). Moreover, autophagy could lower the risk of myelodysplastic syndromes (MDS) progression to AML by suppress ROS levels (15).
Given the above, it is reasonable to believe that autophagy participates in the initiation and progression of AML due to its diverse roles. A deep understanding of autophagy in AML might contribute to identifying novel biomarkers in terms of diagnosis, risk stratification, prognosis as well as potential therapeutic targets. Given the functional role and therapeutic potential of autophagy in AML, we screened 12 key genes from autophagy-associated genes, and constructed risk scores that significantly predicted survival outcomes of AML patients in the study. The scoring system was also validated in an independent AML cohort. Moreover, we explored the biological pathways in that autophagy-associated genes are mainly involved. Overall, our study illustrates that the autophagy-associated model which might provide previously unrecognized risk stratification options for AML patients, shedding novel insights on potential personalized therapeutic strategies.
Autophagy-associated genes were collected by retrieving the GeneCards website (https://www.genecards.org/ ) using the term “autophagy”. Relevance scores denote the correlation between autophagy activity and individual genes. A total of 117 autophagy-associated genes were identified with relevance score at the criteria of |logFC | ≥ 1 and P-value< 0.05.
The gene expression matrix and corresponding clinical parameters of AML patients were collected from TCGA database, consisting of 200 adult patients and 51normal controls. The validation cohorts were downloaded from Gene Expression Omnibus (GEO, https://www.ncbi.nlm.nih.gov/geo/), under the accession of GSE23143 (16).
Hierarchical clustering analysis of the Euclidean distance of all collected autophagy-associated genes was used to investigate the subtypes of AML. The discrimination and accuracy of the subtypes of AML patients were further evaluated by principle component analysis (PCA).
Differential expression analyses were used to filter autophagy-associated genes that were also significantly differentially expressed between the high-risk groups and low-risk groups. Count matrices were loaded in R package “limma” (version 3.38)[PMID: 28367255]. Significant genes were selected at the criteria of |log2 fold change | > 1 and false discovery rate (FDR)< 0.05. In total, 6061 genes were kept for the following analyses.
The optimal autophagy-associated prognostic model was constructed by multivariable Cox regression method with the least absolute shrinkage and selection operator (LASSO) algorithm in the R package “glmnet” (version 2.0-18) (17). Using the 10-fold cross-validation, the best lambda that achieved the best model performance was selected. The risk score was calculated using the formula below.
Coef(j) denotes the coefficient of j gene in the Cox model, and Expr(j) represents the expression levels of autophagy-related gene j. The median risk score was selected as the cutoff to separate AML patients into high-risk and low-risk groups. The same method was applied in another independent AML cohort (GSE23143), to further evaluate the predictive power of the Cox model that was trained in TCGA data.
The time-dependent receiver operating characteristic curve (ROC) was used to estimate the sensitivity and specificity in the R package “survival ROC” (version 1.0.3) (18). The area under the curve (AUCs) estimated the prognostic accuracy for 1-, 3-, and 5-year overall survival respectively, to evaluate the predictive power of survival prediction using the selected 12 autophagy-related genes. Kaplan-Meier survival curve analysis was performed and visualized by R package “survival” (version 3.1-12). Log-rank test was applied to check the significant differences between high-risk and low-risk groups. Multivariate Cox regression and univariate Cox regression were applied to investigate the associations between genes within the 12 genes and overall survival.
Pathway enrichment analyses in Gene Ontology (GO) databases, including biological process, cellular component, and molecular function, were performed and visualized in the R package “clusterProfiler” (version 3.10.1) (19). These analyses were also conducted in the Kyoto Encyclopedia of Genes and Genomes (KEGG) database (https://www.genome.jp/kegg/ ). Significant pathways were identified as these with adjusted p values less than 0.05.
Protein-protein interaction networks were built and visualized on STRING website (https://string-db.org/ ), with all autophagy-associated genes.
Individual genes within 12 selected autophagy-associated genes were used to build a nomogram, using the R package “survival” and “rms” (version 6.0-1). Calibration curves were plotted to evaluate the concordance between actual survival and predicted survival for 6 months, 1 year, and 3 years. The concordance index (C-index) was used to measure the model performance for predicting prognosis.
All the statistics were conducted in the R software (version 3.5.2). The Wilcoxon test was applied to compare two groups with nonnormally distributed data. The Kruskal-Wallis tests were used for comparing more than two groups with nonnormally distributed data. Correlation coefficients were assessed by Spearman or Pearson correlations. Statistical significance in survival analysis was determined by the log-rank test. Significant p values were denoted as follows: ns ≥0.05, *<0.05, **<0.01, ***<0.001, and ****<0.0001. The statistical information for the experiments is detailed in the figure legends.
A total of 200 AML patients and 51 matched healthy controls (HC) were collected in TCGA database, and the autophagy-related genes were retrieved from Genotype-Tissue Expression database. Based on hieratical clustering of gene expressions of autophagy-related genes, the AML patients and HCs were divided into two different clusters (Figure 1A). Consistently, the principle component analysis also indicated that AML patients were separated from HCs clusters (Figure 1B). These results suggested that autophagy-related genes expressed differently between AML patients and HCs in general.
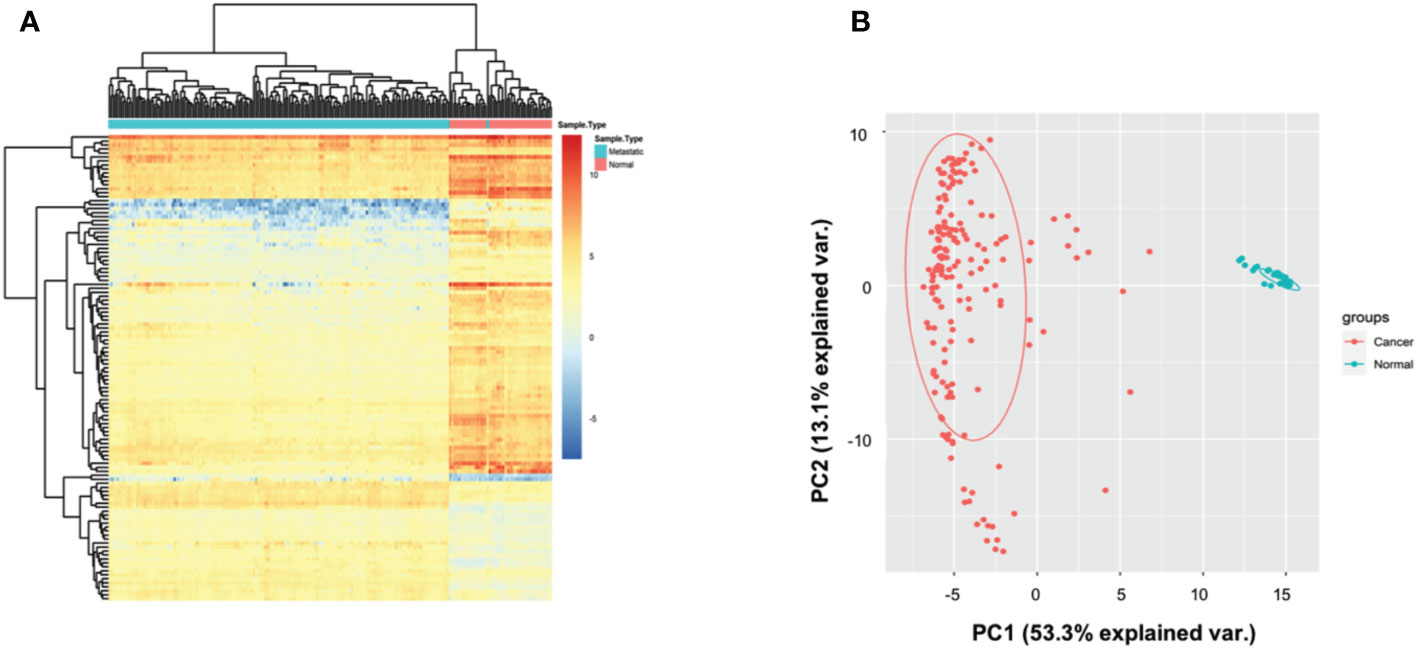
Figure 1 Autophagy-associated genes distinguished AML patients from controls. (A) Heatmap showing that the hieratical clustering of autophagy-associated genes separated AML patients from normal controls. (B) Scatterplot showing the gene expressions of autophagy-associated genes in AML patients are different from normal controls by PCA analysis.
To recognize the prognosis-related genes from the autophagy-associated genes, we identified 117 differentially expressed genes (DEGs) between AML patients and normal healthy controls, and then performed Cox regression model with LASSO algorithm. Using the best lambda parameters in the 10-fold validations, we finally selected 12 hub autophagy-associated genes, including APOL1, BAG1, BAG3, BAX, CAPN10, DNAJB2, KLHL24, P4HB, RAC1, RAF1, SERPINA1, and SIRT1 (Figures 2A, B), which, as expected, were significantly differentially expressed in AML patients (Figure 2C). Univariate Cox analysis revealed that some of the 12 genes were correlated to the overall survival (OS) of AML patients. For instance, KLHL24 has a hazard ratio of less than 1 in AML patients and was regarded as a protective gene (HR=0.71, 95% CI=0.53-0.94, P=0.016, Figure 2D), while BAG3 was considered a risk gene (HR=1.23, 95% CI=1.08-1.40, P=0.002, Figure 2D). Multivariate Cox analyses were also conducted to confirm that BAG3 was significantly correlated with worse overall survivals of AML patients (HR=1.201, 95% CI=1.021-1.412, P=0.027, Figure 2E). These analyses are consistent with the indispensable role of BAG3 in cancer progression and tumor resistance to therapy (20).
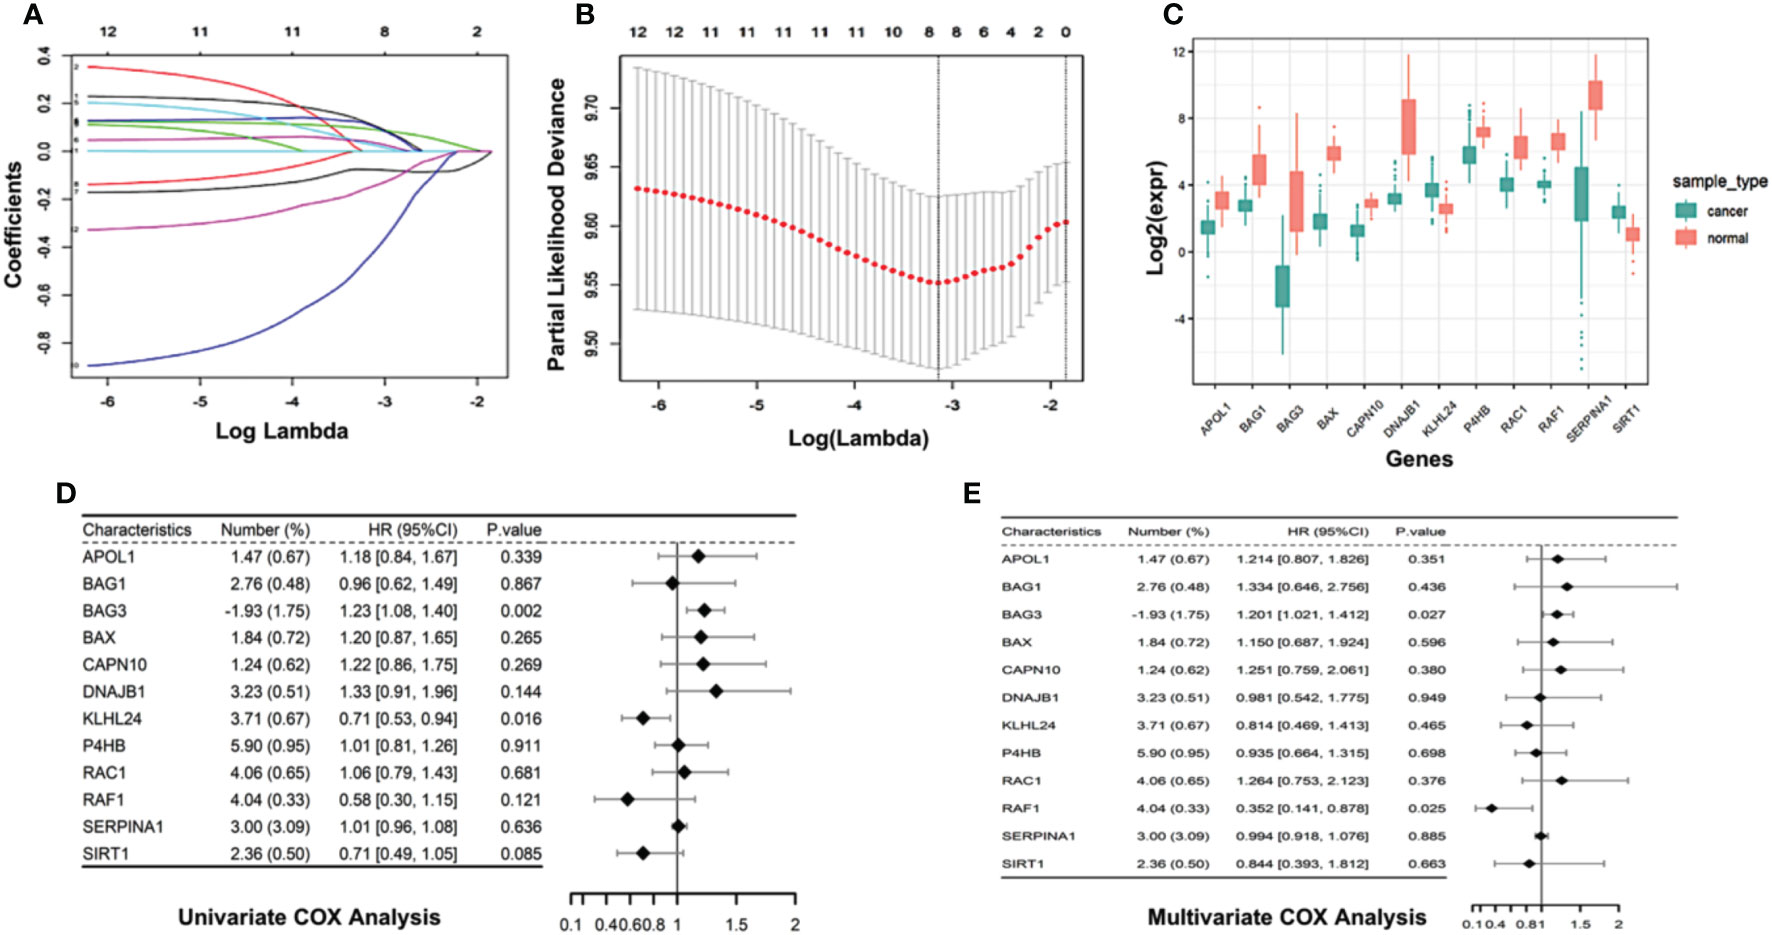
Figure 2 Construction of autophagy-associated prognostic model in TCGA-AML cohort. (A) 10-fold cross-validation of tuning parameter selection in LASSO model using the TCGA- AML data. (B) LASSO coefficient of the selected 12 autophagy-associated genes. (C) Boxplot comparing the difference in gene expression of the selected 12 autophagy-associated genes between AML patients and normal controls. (D, E) Univariate Cox analysis (D) and multivariate Cox analysis (E) show the coefficients and corresponding p values of individual genes within 12 autophagy-associated genes.
We then calculated the risk score for individual AML patients based on the gene expression patterns and coefficients in LASSO model. Specifically, the risk score was the sum of gene expressions of the 12 autophagy-associated genes weighted by their corresponding coefficients in multivariable LASSO regression (Methods). The unsupervised hieratical clustering of gene expression profiles of 12 autophagy-associated genes exhibited that their expressions and the corresponding risk scores were confounded by age, gender and race in AML (Figure 3A). AML patients were then divided into the high-risk and low-risk groups based on the median value of risk scores (Figure 3B). Next, we evaluated the predictive power of the risk score in prognosis of AML patients. Compared with age and gender, risk scores indicated the highest hazard ratio with the OS of AML patients in the univariate COX regression model (HR=23, 95% CI=7.1-72, P<0.001, Figure 3C). These results revealed that the risk scores were an independent prognostic predictor in AML.
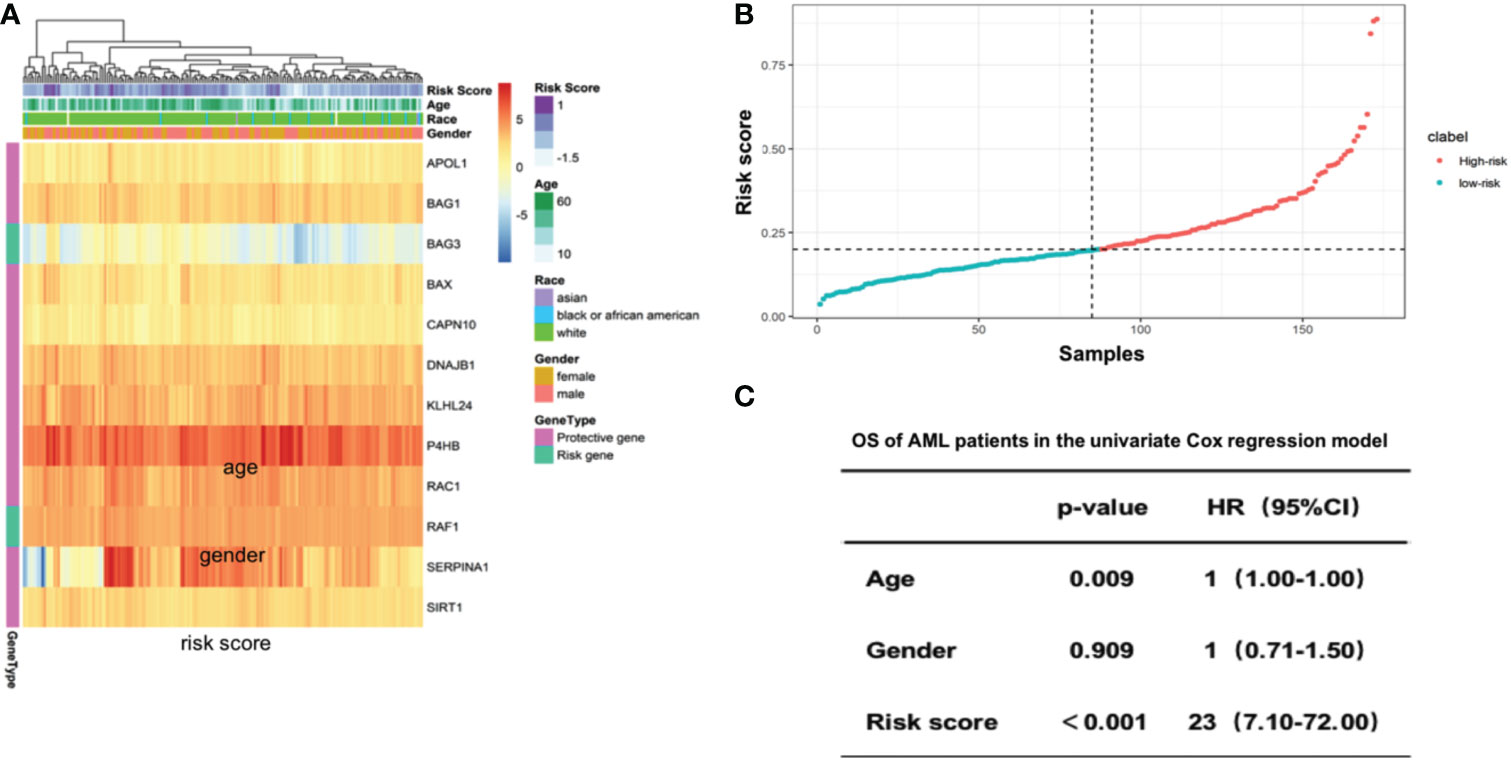
Figure 3 Risk score of 12 selected autophagy-associated genes is an independent predictor of patient survival in the AML cohort. (A) Heatmap showing the gene expression of the 12 selected autophagy-associated genes. Columns were annotated by patient race, gender and age. (B) Rank of risk scores in AML patients who were divided into high-risk and low-risk groups by the median value of risk score. (C) Multivariate Cox analysis shows the coefficients and corresponding p values in the model with risk score, age and gender as covariates.
To evaluate the predictive power of the risk score in AML prognosis, we conducted Kaplan-Meier analyses, and found the AML patients with high-risk scores showed significantly worse overall survivals than patients with relatively low-risk scores in TCGA database (Figure 4A). The time-dependent ROC curve also revealed that the risk scores were capable to predict 6-month (Figure 4D), 1-year (Figure 4E) and 3-year (Figure 4F) survivals with area under curve more than 0.579 (AUC for 6 months, 0.579; AUC for 1 year, 0.729; AUC for 3 years, 0.803, Figure 4B).
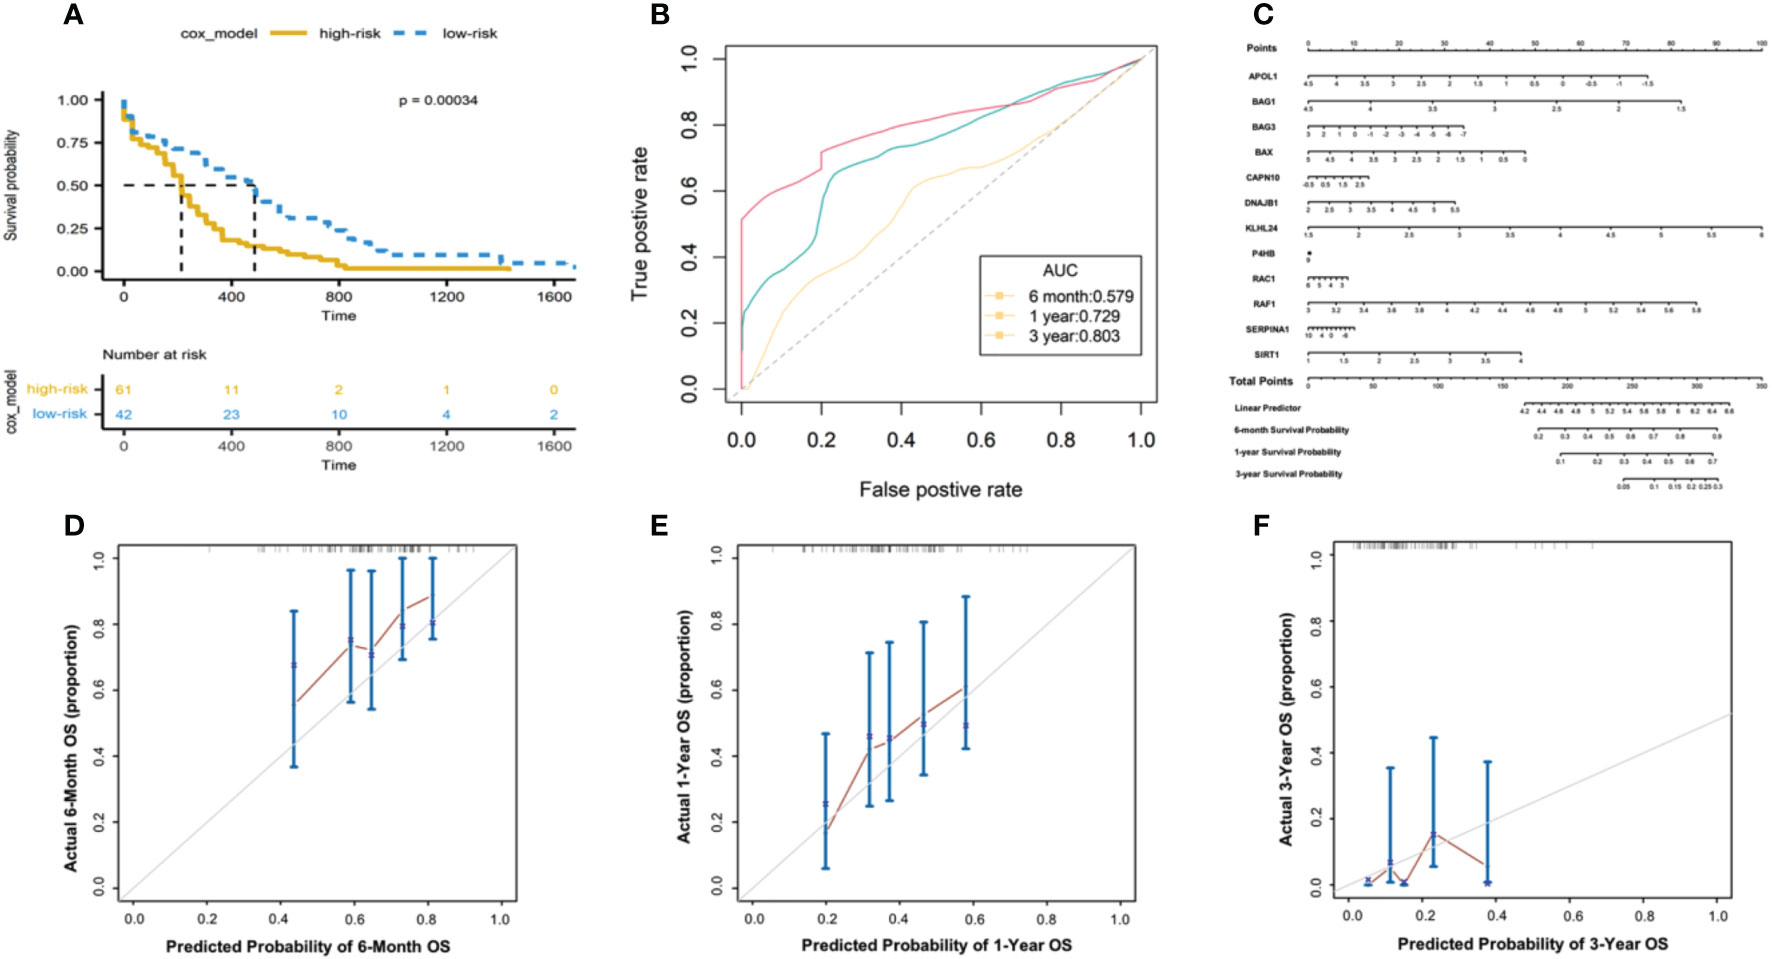
Figure 4 Evaluating the predictive power of risk scores in TCGA-AML cohorts. (A) Kaplan-Meier analysis based on the 12-gene signature in TCGA- AML cohort. Color denotes patients’ stratifications based on risk scores. The table below shows the alive patients at individual time points. (B) The ROC curve showing the AUC of the predictions for 6-month, 1-year and 3-year survivals. (C) Nomogram constructed between the 12 autophagy-associated genes and 6-month, 1-year and 3-year survivals. The calibration plot of the nomogram showing the observed survivals and Nomogram-predicted survivals for 6-month (D), 1-year (E) and 3-year (F) survivals.
Next, we developed a nomogram model of individual autophagy-associated genes to predict patients’ survivals (Figure 4C). The calibration curve showed that the combination of these autophagy genes achieved better performance for AML patients’ 6-month, 1-year prognosis, compared with each one alone (Figure 4D). These findings consistently revealed the success of 12 autophagy-related genes in predicting patient survivals, suggesting the critical role of autophagy signaling in the development of AML progression.
We further validated the prognostic model in independent dataset (GSE23143), including the 200 AML patients. Applied the same methods, we calculated the risk scores based on the 12 autophagy-associated genes, and then divided AML patients into two groups, including high-risk and low-risk groups. Consistent with the results in TCGA data (Figure 4A), we found the high-risk groups showed the significantly worse overall survivals for 6 months, 1 year, and 3 years (p-value = 0.035 for 6 months; p-value = 0.048 for 1 year; p-value = 0.007 for 3 years; Figures 5A-C). These results suggested the effectiveness of autophagy-associated model in predicting prognosis in AML cohorts.
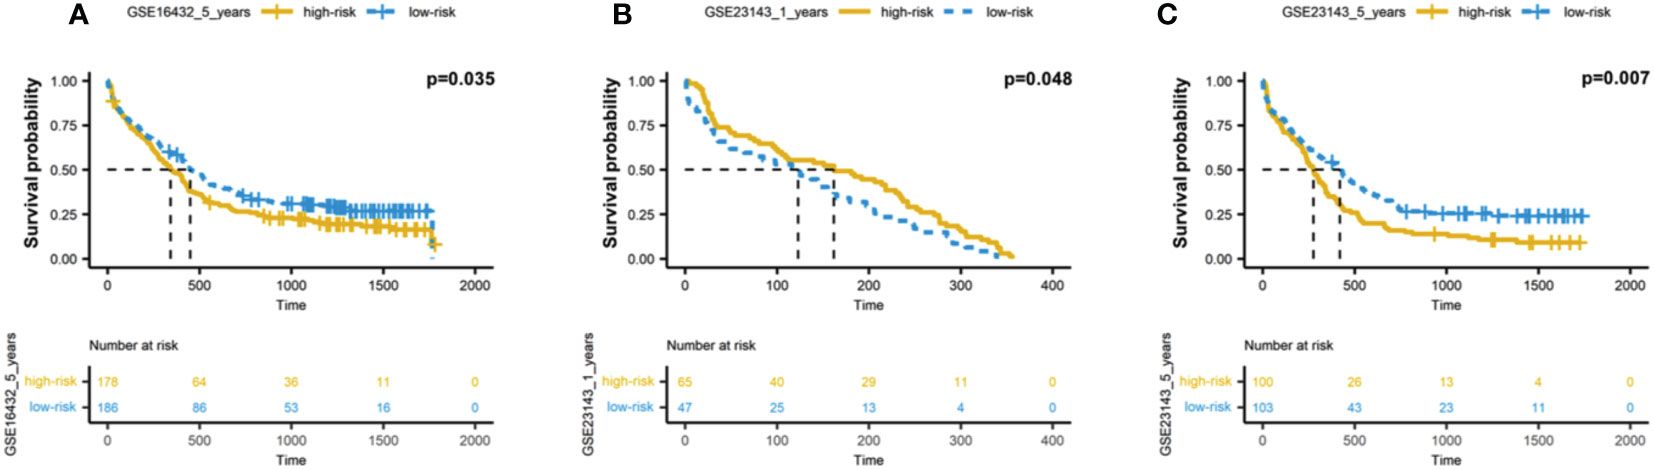
Figure 5 Validation of autophagy-associated prognostic model in independent AML cohort. (A-C) Kaplan-Meier analysis of 6-month (A), 1-year (B) and 3-year (C) survivals based on the 12 autophagy-associated genes in GSE23143 cohort.
In order to decipher the biological pathways related to autophagy-related risks, we viewed the 12 autophagy-associated genes as baits to find 106 most related neighbor genes in TCGA-AML cohort. Totally, 106 genes were identified as neighbor genes. Biological pathway analysis in GO database showed that cellular response to nutrients levels and response to starvations pathways were prominently related to the 12 genes, in addition to autophagy pathway (Figure 6A). Cell component analyses in GO databases showed consistently enriched in the autophagosome and autophagosome membrane (Figure 6B). Molecular function enrichment displayed several related functions, such as protein serine/threonine kinase activity, ubiquitin-like protein ligase binding and ubiquitin protein ligase binding (Figure 6C). These findings are also in line with the fact that the ubiquitin-proteasome system and autophagy are two major quality control systems responsible for protein degradation (21).
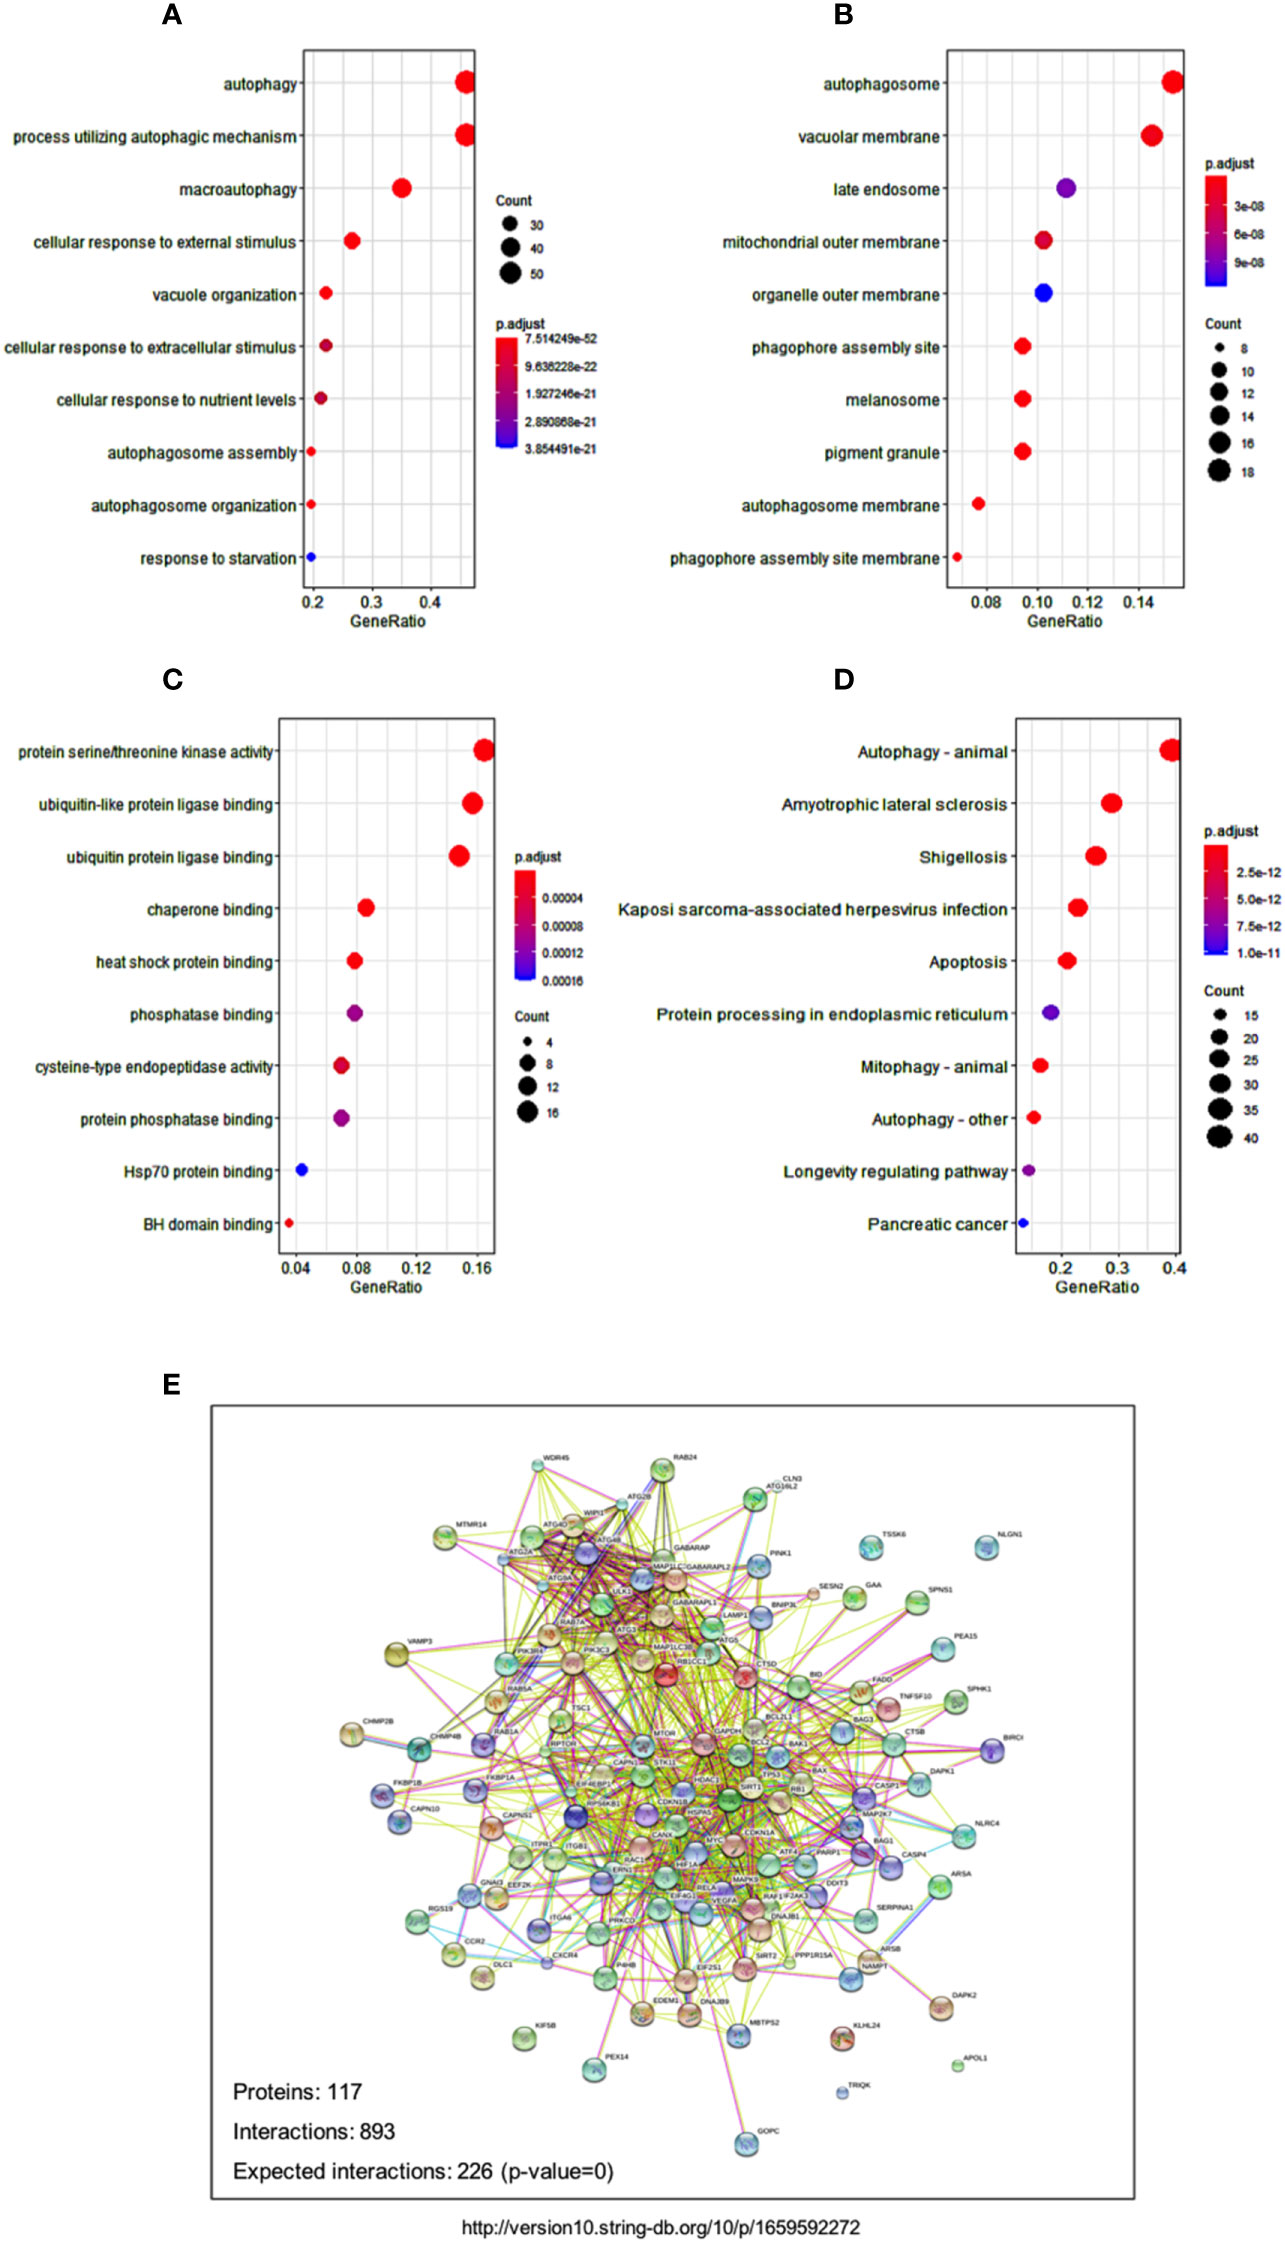
Figure 6 Signaling and networks related to autophagy-associated genes. (A-C) Dot plot reveals the GO enrichment of autophagy-associated genes, showing the significant biological pathways (A), cellular components (B), and molecular functions (C), respectively. (D) Dot plot displays the significant pathways that were enriched in KEGG databases. Dot sizes denote the count number of enriched genes in the pathway, and dot color represents the adjusted p value of the enriched pathway. (E) Protein-protein interaction network shows the relationships among autophagy-associated proteins in the STRING database.
Pathway enrichment in KEGG database showed several disease-related pathways, including amyotrophic lateral sclerosis, shigellosis, and Kaposi sarcoma-associated herpesvirus infection (Figure 6D). The significant enrichments of disease pathways indicated that the 12 autophagy-associated genes might play an essential role in the development of these human diseases. The tight protein-protein interaction network of the 12 autophagy genes and their neighbor genes reflect their close relationships as well (Figure 6E).
The genetic alterations in AML are highly heterogeneous and the manifestation of the disease is distinguishing in each patient. New therapeutic targeted drugs have shown promising effects but these are directed only to specific AML subgroups (22). There still remains around half of the patients who cannot be reasonably categorized due to a lack of prognostic biomarkers. Given this context, there is urgent need to better understand the molecular mechanisms pathogenesis involved in AML and novel classification systems are needed to improve the accuracy of predicting patients’ prognosis.
In this study, we focused on the autophagy-associated genes due to their essential roles in leukemogenesis. We constructed a multivariate prognostic model and identified 12 key autophagy associated genes that indicated significant relevance with prognosis. The filtered 12 genes provided previously unrecognized stratification strategies for AML patients, and also potentially promising targets for AML treatments (23, 24).
We constructed the autophagy-based risk scores based on 12 LASSO regression-selected prognostic genes. The scoring systems are robust to predict the outcome of AML patients in both TCGA-AML cohorts and another independent cohort. Multivariate Cox analysis also revealed that the risk scores were an independent factor, but not the age and gender. These findings are consistent with previous studies that have reported autophagy was involved in cancer initiation via regulating many oncogenes and tumor suppressor genes (25–27). Altogether, our analysis suggested the undermined role of autophagy in AML development.
Among the selected 12 key genes, we identified several genes which have been reported to participate in tumor prognosis and tumorigenesis. For instance, Bcl2-associated athanogene-3 (BAG3), also known as CAIR-1(CAI-stressed-1), belongs to the family of co-chaperones interacted with the ATPase domain of the hear shock protein Hsp 70 via the structural domain known as BAG domain(110-124 amino acids) (28). BAG3 gene expression is constitutive in normal cells such as the skeletal and heart muscles, while aberrant expressed BAG3 is also found in neoplastic cell lines as well as primary AML and CML cell (29, 30). Studies has confirmed that overexpressed BAG3 could reverse the pro-apoptotic effect of WT1 silencing and regulate the leukemia stem cell-supporting activity (31). Further evidence demonstrated that BAG3 down-modulation resulted in a reduction of the anti-apoptotic protein level such as MCL1, BCL2 and BCL-XL, which are capable of regulating autophagy in AML cells (32). It is expected that BAG3 will serve as a key player in leukemogenesis and potential therapeutic drug target (33–35). RAC1, a member of the Ras superfamily of small guanosine triphosphatases (GTPases), is capable to activate several signaling pathways and cytoskeletal arrangements, resulting in cell cycle progression, morphogenesis, migration as well as autophagy (36). Abnormal overexpression has been regularly reported in cancer. Early research indicated that inactivation of RAC1-GTPase suppressed migration and promoted drug induced apoptosis in KG-1 cells (37). Recent in vitro studies found that suppression of RAC with a RAC inhibitor (EHT-1864) could increase autophagy, apoptosis, cell cycle, modulation of p53 factor and inhibit the PI3K/AKT/mTOR signaling pathway in AML cell lines (38). In fact, it has recently been reported that the combination of EHT-1846, venetoclax(BCL-2 inhibitor) and midostaurin(FLT3 inhibitor) could reverse midostaurin resistance in AML cells (39). Sirtuin 1, known as NAD-dependent deacetylase sirtuin-1, promoted cancer cell proliferation and metastasis via STAT3/MMP-13 signaling (40), which is also found participated in the abnormal metabolism pathways in AML. Recent study suggested that SIRT1 was a downstream factor of AdipoR1 and ANRIL in glucose metabolism and regulate AML cell survival (41). Apolipoprotein L1 (APOL1) functions as both extra- and intra-cellular regulators in host innate immunity and cellular homeostasis in the kidney (42). It is worth noting that these identified autophagy genes have not been fully recognized in the development of hematopoietic disorders especially in AML, which might provide novel promising molecular targets and help to predict the outcomes, monitor the minimal residue disease and find therapeutic targets in AML.
The protein-protein interaction analysis and pathway enrichment results demonstrate that autophagy is related to environmental stimulations. Similarly, autophagy can respond to a wide spectrum of cellular stresses, including nutrient deprivation, hypoxia, and abnormal macromolecule accumulation (43, 44). Also, KEGG enrichment analysis revealed the significant enrichment of disease-related pathways, which could be partly explained by its essential functions for cell survival, bioenergetic homeostasis, and intracellular component degradation (45). Indeed, it is gradually recognized that autophagy might be responsible for tumorgenesis in multiple direct and indirect signaling ways. For example, aberrations in metabolic rewiring has been described in leukemogenesis due to dysfunctional autophagy in recent years (46). As our analysis aimed mainly to the autophagy, it is insufficient to fully display the pathways of autophagy in leukemia pathogenesis. Additionally, in different setting of chemotherapy, immunotherapy as well as hematopoietic stem cell transplantation, the role of the identified autophagy-genes in AML still remains largely unknown and more objective proof of this waits further experimental testing and detailed functional analyses.
Besides that, there are other limitations in our study. This study aimed to identify a prognostic autophagy-associated gene signature in patients with AML. However, our analysis was mainly based on TCGA and GEO databases which could have biased our conclusions. Considering this, more validations in larger clinical population groups are required to provide more applicable results and enhance the clinical application value as prognostic tools in the AML patients.
Taken together, we recognized a 12-autophagy-associated gene signature which might likely act as an independent predictor of prognosis based on multiple AML cohorts. A nomogram model and Cox regression analyses revealed the accuracy of the gene signature in predicting 6-month, 1-year and 3-year survival probability for individual AML patients. Pathway enrichment analyses demonstrated the potentially related biological pathways of autophagy. Our finding illustrates that the 12-autophagy gene signature would provide new insight into a better understanding of autophagy in AML. Although further validation is needed, we hope it will provide promising prognostic significance and potential therapeutic targets in AML treatment.
The original contributions presented in the study are included in the article/supplementary materials. Further inquiries can be directed to the corresponding author.
JZ, YQH designed the project and supervised the typescript preparation. JZ and YJW performed the analyses and interpreted all the data. JZ prepared the figures and tables. YQH reviewed and revised the manuscript. All authors contributed to the article and approved the submitted version.
The work was supported by grants from the Natural Science Foundation of Inner Mongolia (2020BS08011), the PhD Initial Funding Project of the Affiliated Hospital of Inner Mongolia Medical University (NYFYBS202109), and Translational Research Grant of NCRCH (2021WWB06).
The authors declare that the research was conducted in the absence of any commercial or financial relationships that could be construed as a potential conflict of interest.
All claims expressed in this article are solely those of the authors and do not necessarily represent those of their affiliated organizations, or those of the publisher, the editors and the reviewers. Any product that may be evaluated in this article, or claim that may be made by its manufacturer, is not guaranteed or endorsed by the publisher.
1. Newell LF, Cook RJ. Advances in acute myeloid leukemia. BMJ (2021) 375:n2026. doi: 10.1136/bmj.n2026
2. Grimwade D, Ivey A, Huntly BJ. Molecular landscape of acute myeloid leukemia in younger adults and its clinical relevance. Blood (2016) 127(1):29–41. doi: 10.1182/blood-2015-07-604496
3. Richardson DR, Foster MC, Coombs CC, Zeidner JF. Advances in genomic profiling and risk stratification in acute myeloid leukemia. Semin Oncol Nurs. (2019) 35(6):150957. doi: 10.1016/j.soncn.2019.150957
4. Kantarjian HM, Kadia TM, DiNardo CD, Welch MA, Ravandi F. Acute myeloid leukemia: Treatment and research outlook for 2021 and the MD Anderson approach. Cancer (2021) 127(8):1186–207. doi: 10.1002/cncr.33477
5. Tamamyan G, Kadia T, Ravandi F, Borthakur G, Cortes J, Jabbour E, et al. Frontline treatment of acute myeloid leukemia in adults. Crit Rev Oncol Hematol (2017) 110:20–34. doi: 10.1016/j.critrevonc.2016.12.004
6. White E, Mehnert JM, Chan CS. Autophagy, metabolism, and cancer. Clin Cancer Res (2015) 21(22):5037–46. doi: 10.1158/1078-0432.CCR-15-0490
7. Levine B, Kroemer G. Autophagy in the pathogenesis of disease. Cell (2008) 132(1):27–42. doi: 10.1016/j.cell.2007.12.018
8. Vannini N, Girotra M, Naveiras O, Nikitin G, Campos V, Giger S, et al. Specification of haematopoietic stem cell fate via modulation of mitochondrial activity. Nat Commun (2016) 7:13125. doi: 10.1038/ncomms13125
9. Auberger P, Puissant A. Autophagy, a key mechanism of oncogenesis and resistance in leukemia. Blood (2017) 129(5):547–52. doi: 10.1182/blood-2016-07-692707
10. Jin J, Britschgi A, Schlafli AM, Humbert M, Shan-Krauer D, Batliner J, et al. Low autophagy (ATG) gene expression is associated with an immature AML blast cell phenotype and can be restored during AML differentiation therapy. Oxid Med Cell Longev (2018) 2018:1482795. doi: 10.1155/2018/1482795
11. Liang PQ, Miao M, Liu ZG, Hu R, Jiang HN, Li C, et al. Expression of autophagy genes in acute myeloid leukemia: Associations with clinical characteristics and prognosis. Neoplasma (2018) 65(5):807–14. doi: 10.4149/neo_2018_171028N691
12. Sumitomo Y, Koya J, Nakazaki K, Kataoka K, Tsuruta-Kishino T, Morita K, et al. Cytoprotective autophagy maintains leukemia-initiating cells in murine myeloid leukemia. Blood (2016) 128(12):1614–24. doi: 10.1182/blood-2015-12-684696
13. Folkerts H, Hilgendorf S, Wierenga ATJ, Jaques J, Mulder AB, Coffer PJ, et al. Inhibition of autophagy as a treatment strategy for p53 wild-type acute myeloid leukemia. Cell Death Dis (2017) 8(7):e2927. doi: 10.1038/cddis.2017.317
14. Nguyen TD, Shaid S, Vakhrusheva O, Koschade SE, Klann K, Tholken M, et al. Loss of the selective autophagy receptor p62 impairs murine myeloid leukemia progression and mitophagy. Blood (2019) 133(2):168–79. doi: 10.1182/blood-2018-02-833475
15. Watson AS, Mortensen M, Simon AK. Autophagy in the pathogenesis of myelodysplastic syndrome and acute myeloid leukemia. Cell Cycle (2011) 10(11):1719–25. doi: 10.4161/cc.10.11.15673
16. Kvinlaug BT, Chan WI, Bullinger L, Ramaswami M, Sears C, Foster D, et al. Common and overlapping oncogenic pathways contribute to the evolution of acute myeloid leukemias. Cancer Res (2011) 71(12):4117–29. doi: 10.1158/0008-5472.CAN-11-0176
17. Simon N, Friedman J, Hastie T, Tibshirani R. Regularization paths for cox's proportional hazards model via coordinate descent. J Stat Software (2011) 39(5):1–13. doi: 10.18637/jss.v039.i05
18. Heagerty PJ, Lumley T, Pepe MS. Time-dependent ROC curves for censored survival data and a diagnostic marker. Biometrics (2000) 56(2):337–44. doi: 10.1111/j.0006-341X.2000.00337.x
19. Yu G, Wang LG, Han Y, He QY. clusterProfiler: an r package for comparing biological themes among gene clusters. OMICS (2012) 16(5):284–7. doi: 10.1089/omi.2011.0118
20. De Marco M, Turco MC, Marzullo L. BAG3 in tumor resistance to therapy. Trends Cancer. (2020) 6(12):985–8. doi: 10.1016/j.trecan.2020.07.001
21. Varshavsky A. The ubiquitin system, autophagy, and regulated protein degradation. Annu Rev Biochem (2017) 86:123–8. doi: 10.1146/annurev-biochem-061516-044859
22. Burnett A, Stone R. AML: New drugs but new challenges. Clin Lymphoma Myeloma Leuk. (2020) 20(6):341–50. doi: 10.1016/j.clml.2020.02.005
23. Wiatrowski K, Kim TH, Przespolewski A. Cellular and molecular biomarkers predictive of response to immunotherapy in acute myeloid leukemia. Front Oncol (2022) 12:826768. doi: 10.3389/fonc.2022.826768
24. Prada-Arismendy J, Arroyave JC, Rothlisberger S. Molecular biomarkers in acute myeloid leukemia. Blood Rev (2017) 31(1):63–76. doi: 10.1016/j.blre.2016.08.005
25. Maiuri MC, Tasdemir E, Criollo A, Morselli E, Vicencio JM, Carnuccio R, et al. Control of autophagy by oncogenes and tumor suppressor genes. Cell Death Differ (2009) 16(1):87–93. doi: 10.1038/cdd.2008.131
26. Chen N, Karantza-Wadsworth V. Role and regulation of autophagy in cancer. Biochim Biophys Acta (2009) 1793(9):1516–23. doi: 10.1016/j.bbamcr.2008.12.013
27. Lorin S, Hamai A, Mehrpour M, Codogno P. Autophagy regulation and its role in cancer. Semin Cancer Biol (2013) 23(5):361–79. doi: 10.1016/j.semcancer.2013.06.007
28. Rosati A, Graziano V, De Laurenzi V, Pascale M, Turco MC. BAG3: a multifaceted protein that regulates major cell pathways. Cell Death Dis (2011) 2:e141. doi: 10.1038/cddis.2011.24
29. Seo YJ, Jeon MH, Lee JH, Lee YJ, Youn HJ, Ko JH, et al. Bis induces growth inhibition and differentiation of HL-60 cells via up-regulation of p27. Exp Mol Med (2005) 37(6):624–30. doi: 10.1038/emm.2005.76
30. Cesaro E, Montano G, Rosati A, Crescitelli R, Izzo P, Turco MC, et al. WT1 protein is a transcriptional activator of the antiapoptotic bag3 gene. Leukemia (2010) 24(6):1204–6. doi: 10.1038/leu.2010.68
31. Kwon KR, Ahn JY, Kim MS, Jung JY, Lee JH, Oh IH. Disruption of bis leads to the deterioration of the vascular niche for hematopoietic stem cells. Stem Cells (2010) 28(2):268–78. doi: 10.1002/stem.285
32. Aveic S, Pigazzi M, Basso G. BAG1: The guardian of anti-apoptotic proteins in acute myeloid leukemia. PloS One (2011) 6(10):e26097. doi: 10.1371/journal.pone.0026097
33. Zhu H, Liu P, Li J. BAG3: A new therapeutic target of human cancers? Histol Histopathol. (2012) 27(3):257–61. doi: 10.14670/HH-27.257
34. Kirk JA, Cheung JY, Feldman AM. Therapeutic targeting of BAG3: Considering its complexity in cancer and heart disease. J Clin Invest. (2021) 131(16):e149415. doi: 10.1172/JCI149415
35. De Marco M, Basile A, Iorio V, Festa M, Falco A, Ranieri B, et al. Role of BAG3 in cancer progression: A therapeutic opportunity. Semin Cell Dev Biol (2018) 78:85–92. doi: 10.1016/j.semcdb.2017.08.049
36. Heasman SJ, Ridley AJ. Mammalian rho GTPases: new insights into their functions from in vivo studies. Nat Rev Mol Cell Biol (2008) 9(9):690–701. doi: 10.1038/nrm2476
37. Wang JY, Yu P, Chen S, Xing H, Chen Y, Wang M, et al. Activation of Rac1 GTPase promotes leukemia cell chemotherapy resistance, quiescence and niche interaction. Mol Oncol (2013) 7(5):907–16. doi: 10.1016/j.molonc.2013.05.001
38. Ramos DFV, Mancuso RI, Contieri B, Duarte A, Paiva L, de Melo Carrilho J, et al. Rac GTPases in acute myeloid leukemia cells: Expression profile and biological effects of pharmacological inhibition. Toxicol Appl Pharmacol (2022) 442:115990. doi: 10.1016/j.taap.2022.115990
39. Garitano-Trojaola A, Sancho A, Gotz R, Eiring P, Walz S, Jetani H, et al. Actin cytoskeleton deregulation confers midostaurin resistance in FLT3-mutant acute myeloid leukemia. Commun Biol (2021) 4(1):799. doi: 10.1038/s42003-021-02215-w
40. Zhang S, Yang Y, Huang S, Deng C, Zhou S, Yang J, et al. SIRT1 inhibits gastric cancer proliferation and metastasis via STAT3/MMP-13 signaling. J Cell Physiol (2019) 234(9):15395–406. doi: 10.1002/jcp.28186
41. Sun LY, Li XJ, Sun YM, Huang W, Fang K, Han C, et al. LncRNA ANRIL regulates AML development through modulating the glucose metabolism pathway of AdipoR1/AMPK/SIRT1. Mol Cancer. (2018) 17(1):127. doi: 10.1186/s12943-018-0879-9
42. Hu CA, Klopfer EI, Ray PE. Human apolipoprotein L1 (ApoL1) in cancer and chronic kidney disease. FEBS Lett (2012) 586(7):947–55. doi: 10.1016/j.febslet.2012.03.002
43. Mizushima N, Levine B. Autophagy in mammalian development and differentiation. Nat Cell Biol (2010) 12(9):823–30. doi: 10.1038/ncb0910-823
44. Russell RC, Yuan HX, Guan KL. Autophagy regulation by nutrient signaling. Cell Res (2014) 24(1):42–57. doi: 10.1038/cr.2013.166
45. Yang Y, Klionsky DJ. Autophagy and disease: unanswered questions. Cell Death Differ (2020) 27(3):858–71. doi: 10.1038/s41418-019-0480-9
Keywords: acute myeloid leukemia, autophagy, prognosis, biomarker, bioinforamtics
Citation: Zhang J, Wang Y-J and Han Y-Q (2023) Identification of autophagy-associated genes and prognostic implications in adults with acute myeloid leukemia by integrated bioinformatics analysis. Front. Oncol. 12:1074057. doi: 10.3389/fonc.2022.1074057
Received: 19 October 2022; Accepted: 20 December 2022;
Published: 13 January 2023.
Edited by:
Ran Gao, Chinese Academy of Medical Sciences and Peking Union Medical College, ChinaReviewed by:
Sudjit Luanpitpong, Mahidol University, ThailandCopyright © 2023 Zhang, Wang and Han. This is an open-access article distributed under the terms of the Creative Commons Attribution License (CC BY). The use, distribution or reproduction in other forums is permitted, provided the original author(s) and the copyright owner(s) are credited and that the original publication in this journal is cited, in accordance with accepted academic practice. No use, distribution or reproduction is permitted which does not comply with these terms.
*Correspondence: Yan-Qiu Han, cXloMTAxNkBzaW5hLmNvbQ==
†ORCID: Yan-Qiu Han, orcid.org/0000-0002-2658-0803
ORCID: Jing Zhang, orcid.org/0000-0001-5419-9463
Disclaimer: All claims expressed in this article are solely those of the authors and do not necessarily represent those of their affiliated organizations, or those of the publisher, the editors and the reviewers. Any product that may be evaluated in this article or claim that may be made by its manufacturer is not guaranteed or endorsed by the publisher.
Research integrity at Frontiers
Learn more about the work of our research integrity team to safeguard the quality of each article we publish.