 Eli Varon
 Gaddi Blumrosen
 Orit Shefi
94% of researchers rate our articles as excellent or good
Learn more about the work of our research integrity team to safeguard the quality of each article we publish.
Find out more
ORIGINAL RESEARCH article
Front. Oncol., 04 January 2023
Sec. Radiation Oncology
Volume 12 - 2022 | https://doi.org/10.3389/fonc.2022.1037419
This article is part of the Research TopicNanotechnology Applied to Superficial TumorsView all 4 articles
A major challenge in radiation oncology is the prediction and optimization of clinical responses in a personalized manner. Recently, nanotechnology-based cancer treatments are being combined with photodynamic therapy (PDT) and photothermal therapy (PTT). Predictive models based on machine learning techniques can be used to optimize the clinical setup configuration, including such parameters as laser radiation intensity, treatment duration, and nanoparticle features. In this article we demonstrate a methodology that can be used to identify the optimal treatment parameters for PDT and PTT by collecting data from in vitro cytotoxicity assay of PDT/PTT-induced cell death using a single nanocomplex. We construct three machine learning prediction models, employing regression, interpolation, and low- degree analytical function fitting, to predict the laser radiation intensity and duration settings that maximize the treatment efficiency. To examine the accuracy of these prediction models, we construct a dedicated dataset for PDT, PTT, and a combined treatment; this dataset is based on cell death measurements after light radiation treatment and is divided into training and test sets. The preliminary results show that the performance of all three models is sufficient, with death rate errors of 0.09, 0.15, and 0.12 for the regression, interpolation, and analytical function fitting approaches, respectively. Nevertheless, due to its simple form, the analytical function method has an advantage in clinical application and can be used for further analysis of the sensitivity of performance to the treatment parameters. Overall, the results of this study form a baseline for a future personalized prediction model based on machine learning in the domain of combined nanotechnology- and phototherapy-based cancer treatment.
Cancer remains a leading cause of death globally (1). The conventional methods of treatment offered are radiation (2), chemotherapy (3), immunotherapy (4), surgery, and recently nanotechnology (nanomedicine and nano-processes) (5). Every cancer treatment can be defined and evaluated based on its efficiency, selectivity, side effects, and economic cost (6). However, combining predictive models and advanced machine learning methods with these cancer therapies may enhance their overall efficiency and selectivity, as well as the safety of the patient.
Radiation Therapy (RT), also known as radiotherapy, is a non-surgical intervention frequently used in cancer treatment (2). This method is based on a high-level focused dose of radiation directed toward the tumor. This deposit of high-energy radiation kills cancer cells or decelerates their growth by damaging their DNA (2). Nevertheless, the challenges of RT include damage to tumor- proximate normal cells, the inability to radiate minor tumors out of scope of the imaging scans, patient movement, and low oxygen supply (7, 8). Therefore, many researchers are working on the development of targeted radiation methods to deliver a higher dose of radiation to the tumor with improved selectivity.
Recently, the combination of nanotechnology with laser radiation has been demonstrated to represent a safe set of modalities for tumor destruction with high specificity (9). In particular, this involves the use of light-controlled nanoparticles (NPs) that can be activated via a light of a specific wavelength to form highly efficient and selective systems in the nanometer range (10). These NPs accumulate specifically within tumors due to the Enhanced Permeability and Retention (EPR) effect (11). Thereafter, a specific band of light is directed and radiated toward the target area of the subject.
The two main nanotechnology-based phototherapies for tumor ablation are photodynamic therapy (PDT) and photothermal therapy (PTT) (9). PDT is a two-stage treatment combining a photosensitizing chemical substance with activation by a specific wavelength and energy of light. This photosensitizer activation, performed in the presence of oxygen, generates singlet oxygen molecules that are highly reactive, extremely toxic, and known to cause damage to the tumor (12–14). In contrast, PTT is based on photothermal agents (PTAs) that convert near-infrared (NIR) light to vibrational energy (heat) (15). The targeted cancer cells are labeled by biocompatible PTAs with high photothermal conversion efficiency and stability, these being properties that permit the utilization of light in the near-infrared wavelengths (λ ≈ 650 - 1064 nm) (16). These long wavelengths are suitable for deep penetration into biological tissues (up to a few centimeters) due to their insignificant absorbance by water (17). Nevertheless, PDT and PTT have limited efficiency in cancer treatment (18). The shortcomings and drawbacks of these therapies include short chemical stability, poor tissue penetration, low oxygen, the short life and diffusion distance of ROS, and thermal damage to nearby healthy tissue (18–20). Optimization of the treatment parameters can enhance the efficiency of the treatment and allow these drawbacks to be overcome.
Synergistic strategies are becoming necessary to improve the treatment efficiency of PDT and PTT (21–23). Obstacles may be overcome by adopting a synergistic approach in which the disadvantages of one therapy are mitigated by the advantages of another. Under many circumstances, combining distinct therapeutic approaches in this way does not merely provide a simple supplementary effect, but in fact has a synergistic effect (24, 25). Thus, a thorough investigation should be made of the potential for a synergistic effect of PDT and PTT, rather than treating them as a simple combination of therapeutic approaches. The optimal equilibrium between these therapeutic approaches should be identified computationally in order to provide personalized and productive cancer treatment. Currently, there is no computational methodology that combines these phototherapies in an optimized and customized manner.
A major challenge in RT and particularly in phototherapy is the ability to predict a clinical radiation dose and outcome for a given treatment setup (26). Adjusting the treatment guidelines, such as by estimating the effective dose, reducing acute/late toxicity, and estimating conventional fractionation, is integral to the success of the treatment in terms of patient outcome. Currently, RT is offered based on the patient’s type of cancer, its location, volume, and proximity to normal tissue, and the patient’s general health and medical history (27, 28). After confirming the suitability of the treatment, the treating physicians attempt to identify the set of radiation properties, including radiation frequency, intensity, duration, and angle, that will optimize its effect on the tumor tissue (29). Nonetheless, personalized phototherapy combined with nanotechnology has not been adopted in a clinical setting (10). At present, there are no computational methods that incorporate an optimization criterion covering all aspects of treatment and offer a framework for prediction of a nanotechnology-based phototherapy cancer treatment (PDT combined with PTT).
In this article, we propose a framework for data analysis that may assist clinicians in designing a phototherapy treatment plan, with a corresponding setup configuration and specific laser radiation parameters, based on a desired treatment goal. The framework is based on machine learning techniques that enhance the treatment’s efficacy and the specificity with which it targets cancer cells. We focus in the present study, without loss of generality, on optimization of the laser radiation intensity and duration used in PDT and PTT, both separately and in combination. We derive mathematical models that include the condition of affected cells during and after the treatment; these derivations are followed by an evaluation of the gain provided by combined treatment. We propose three prediction models that enable the selection of an optimal set of parameters and enhance the overall treatment efficiency while preserving certain constraints. To validate the proposed model, we performed a set of in vitro experiments in which PDT, PTT, and a combination of the two were administered with various parameter setting conditions for each treatment. We conduct analysis of post- treatment cell death as a proxy for the treatment’s effectiveness.
The main objective of this work was to establish a precision medicine platform that predicts a treatment outcome when phototherapy and nanotechnology are combined. The work makes four main contributions: 1) formulation of a first step toward a decision support framework for clinicians to help them determine parameter optimization in combined laser radiation and nanotechnology- based treatment; 2) verification of the proposed framework using three predictive models based on machine learning that separately determine treatment parameters for PDT and PTT in order to achieve desired level of treatment efficiency while minimizing laser power and duration; 3) derivation of a quantitative model that aids in predicting the likelihood of cancer cell death based on post- treatment permeability measurements; and 4) derivation of a lower bound for the efficiency of combined PDT and PTT therapies based on the prior distributions of the estimated efficiency of each treatment separately .
Human neuroblastoma cells SH-SY5Y (ATCC) were incubated in a 24-well culture plate at a density of 1 X 10⁵ per well. After 24 h of incubation, the cells were treated with 1.2 μM AuNP-mTHPC in serum-free media and co-incubated for another 24 h without light interference. The characterization of this nanocomplex has been described previously (25). Subsequently, the cells were exposed to 650 nm laser (PDT), 532 nm laser (PTT), or a combination of PDT and PTT. After laser radiation, the cells were incubated at 37°C for 24 h (Figure 1). Following this procedure, all cells were collected from the dish and propidium iodide (PI) was added; samples were next incubated in darkness for 5 minutes at room temperature and then analyzed using flow cytometry (BD LSRFortessa™).
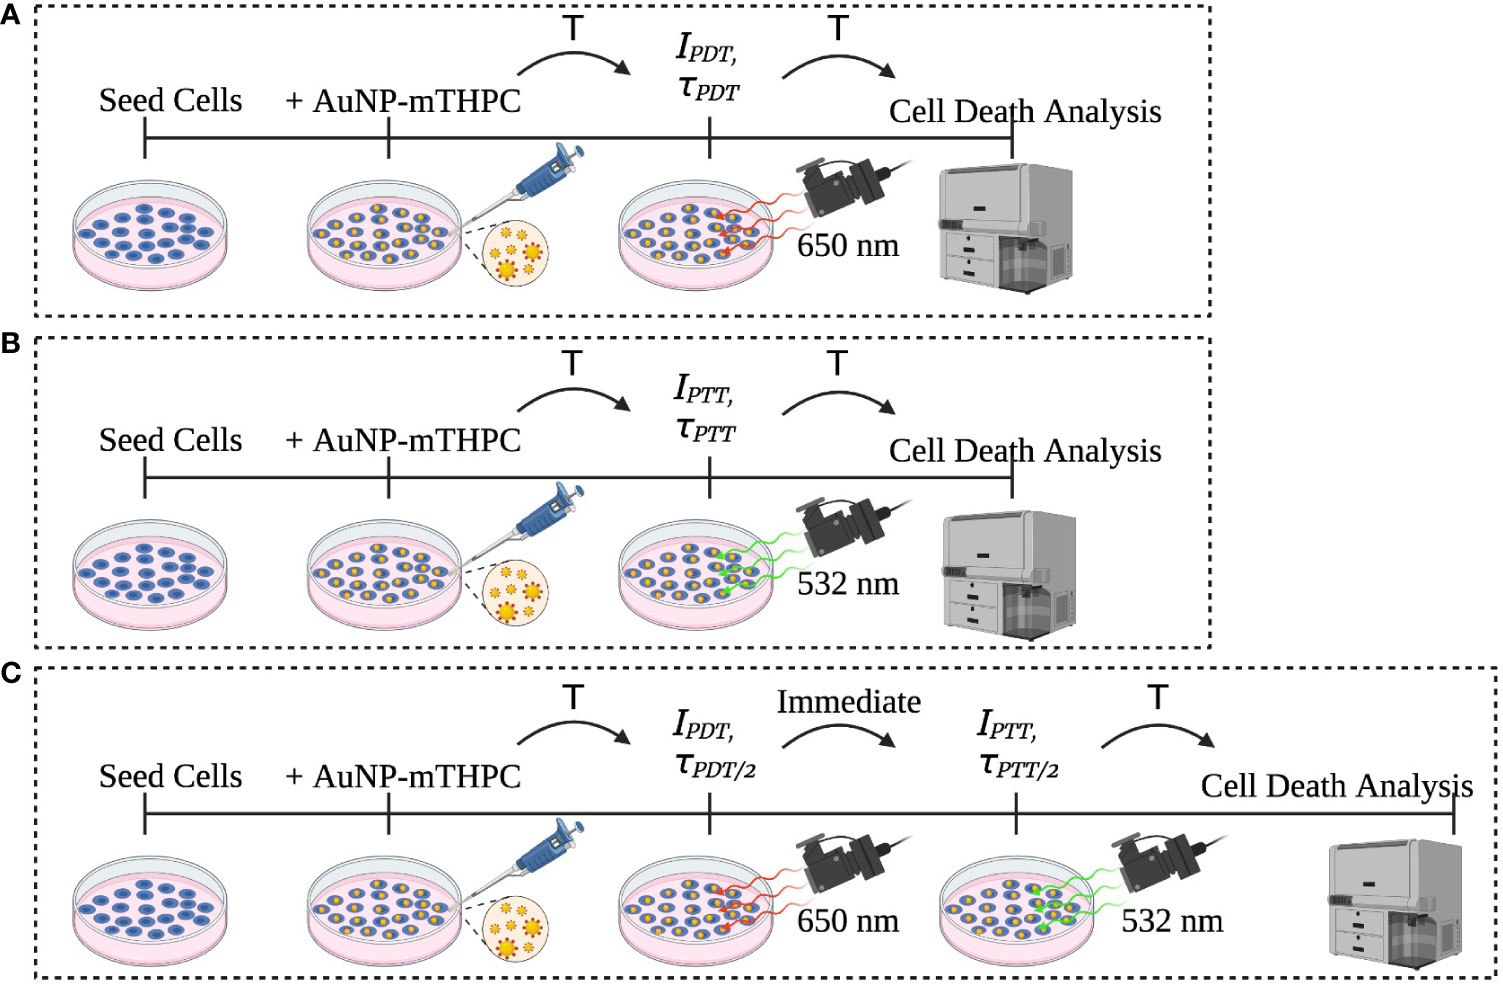
Figure 1 Description of the experiment sets: (A) PDT, (B) PTT, and (C) the combined PDT and PTT experiments.
For the cell death analysis, we used the standard FACS software based on cell size and fluorescent intensity (30). Fractional cells and doublet cells were filtered out as artifacts and excluded. Clustering of cells into live and dead clusters was derived via a manual gating process. Data were processed and analyzed using MATLAB software (MATLAB version R2021a, The MathWorks, Inc). Figure 2 shows the PDT, PTT, and combined PDT and PTT experiments.
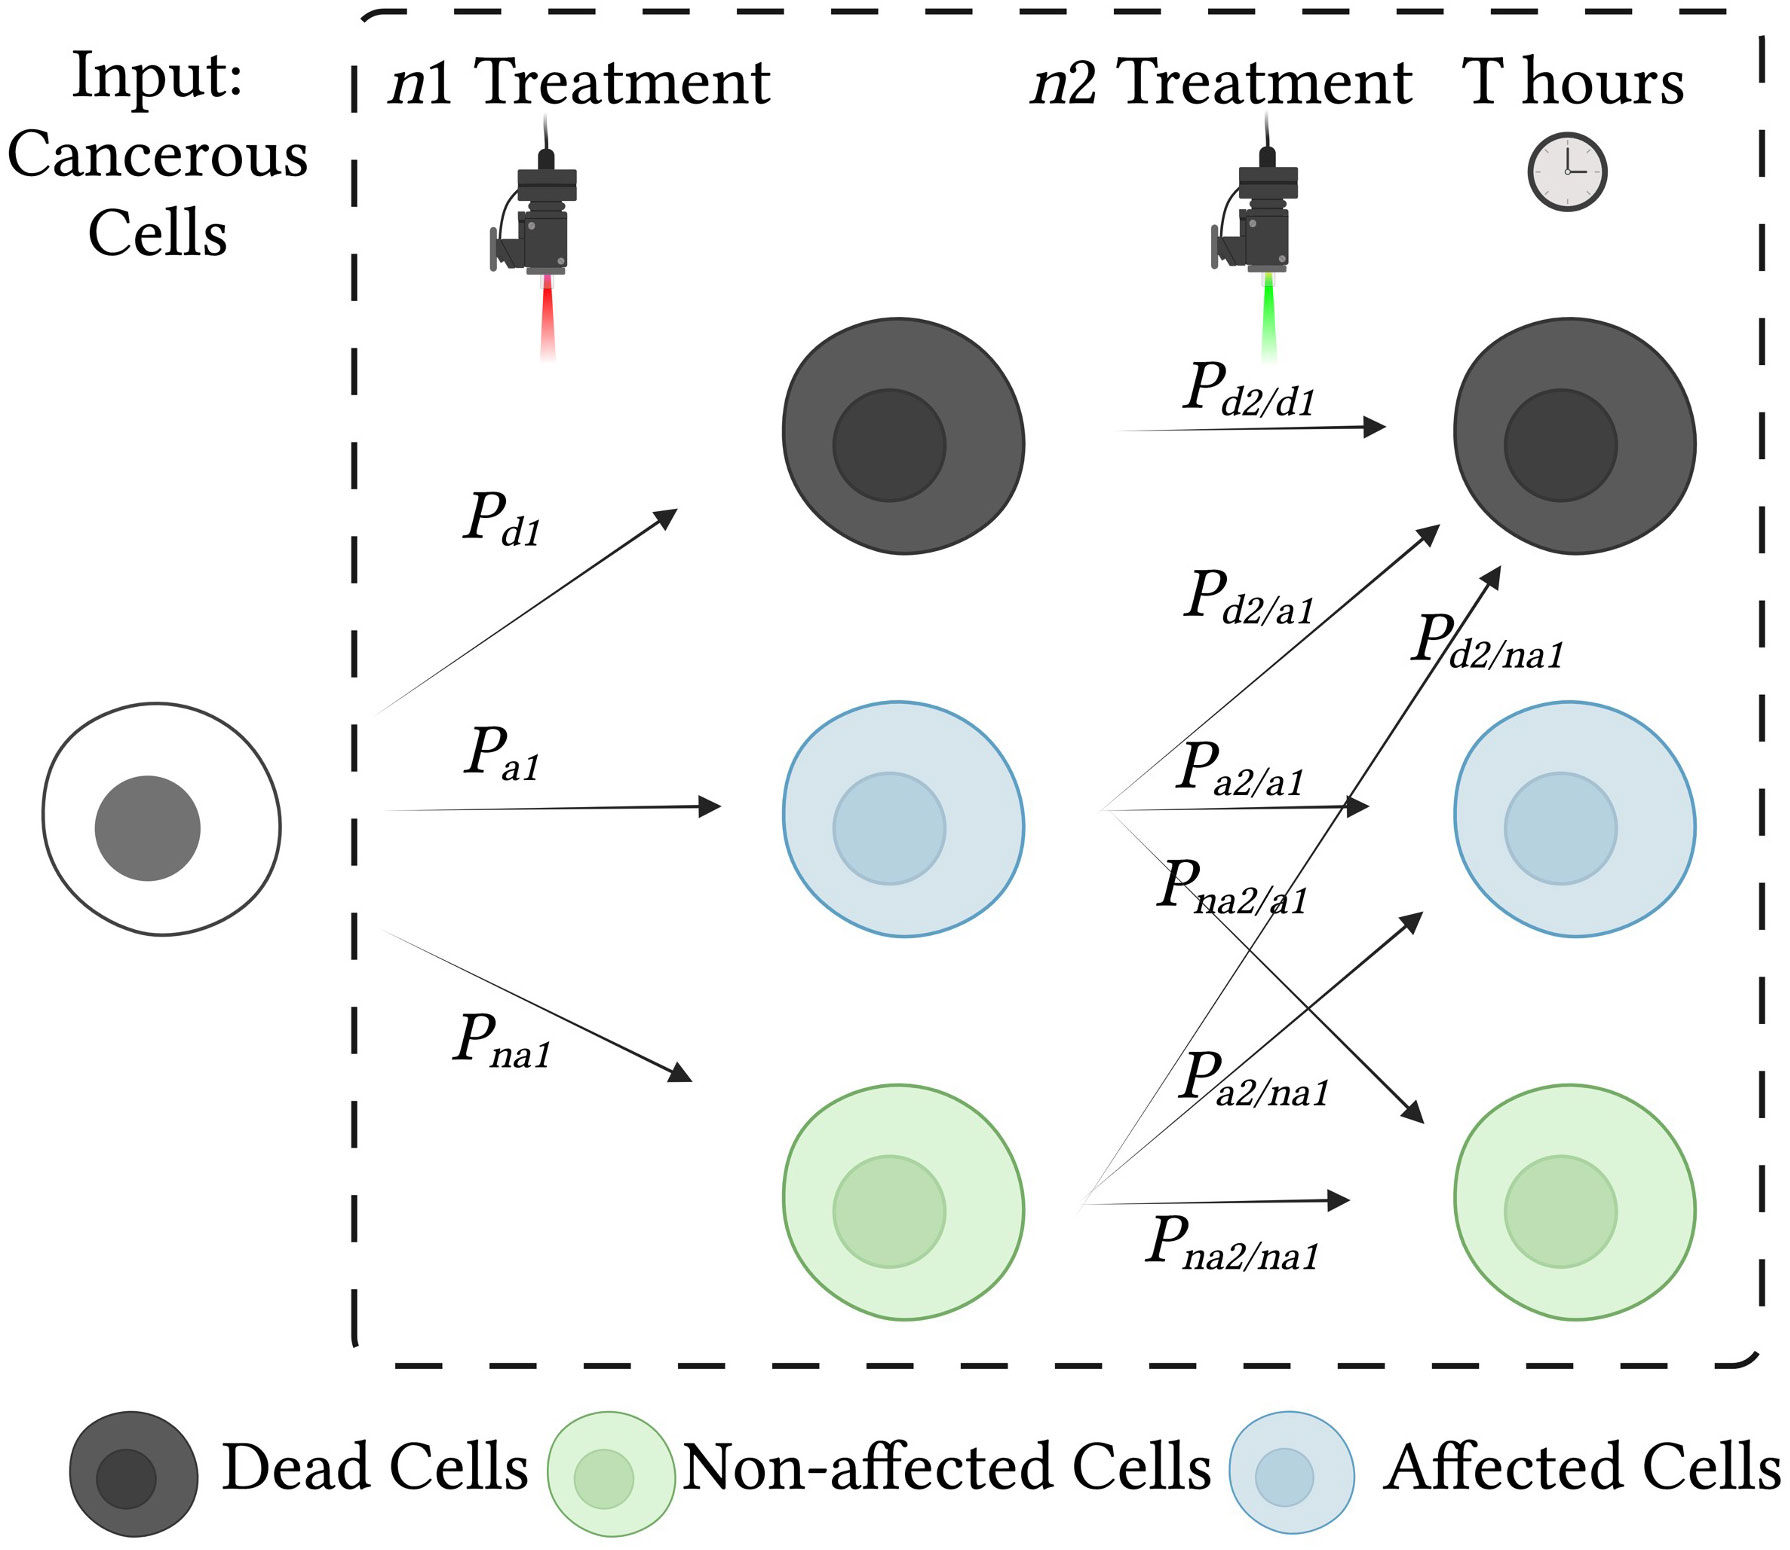
Figure 2 Effects of treatment on cells and probabilities of each cell state. Cancerous cells are treated with two consecutive treatments, n1 and n2. Each treatment influences the condition of the cells and may result in cell death, cell damage (affected cells), or no change (unaffected cells). To analyze the effect of the combined treatment, we use a state diagram with conditional probabilities.
We conducted separate sets of experiments for training and testing of the prediction model. To obtain training data for the model, we carried out two main sets of experiments for PDT and PTT (25). For each set, we used laser radiation intensities of 1, 6, 15, and 30 mW/cm2 and treatment durations of 1, 4, and 8 minutes, for a total of 12 experimental configurations, each of which was implemented twice for replication purposes. This array of laser radiation parameters was designed to include extreme conditions that would result in unaffected cells and death of the entire set of the cells used in the experimental setup. For each experiment we had three controls: cells without any treatment, cells exposed to laser radiation only (with no NPs), and cells exposed to NPs only (without laser radiation).
To test the prediction model, we used an independent test dataset. This test set consisted of two subsets of data, the first consisting of data from three experiments in which each treatment was administered separately, and the second consisting of data from two in which the treatments were combined. This allowed us to examine the feasibility of predicting a lower bound for the efficiency of the combined treatment, over a total of eight test experiments. The test values for a tuple representing treatment duration and intensity, (τ, I0), were selected randomly from the range of values falling within the scope of the treatment; these selections were (2, 25), (6, 12), (7,18), which were used for both the PDT and the PTT treatments, generating a total of six datapoints for the test set.
The set of values used for laser radiation were selected in accordance with the relevant FDA regulations, which specify that Photofrin® should be activated with laser light delivered through optical fibers with a cylindrical-diffuser end emitting 630-nm light at an intensity of 400 mW per cm (mW/cm) and energy of 50–300 J/cm per length of the diffuser (31).
To examine the effect of combined PDT and PTT treatment, we administered identical total treatment durations of 4 and 8 minutes for a fair comparison. For the first dataset, PDT and PTT were administered separately for a duration of 4 minutes in each case, and in the combined condition, each was administered for a duration of 2 minutes. For the second dataset, each treatment was administered separately for a duration of 8 minutes, and in the combined condition, each was administered for 4 minutes. For each of the two sets, laser radiation intensity was set to 6 and 15 mW/cm2 for PDT and PTT, respectively. Thus, the values of the parameter tuple (τ, I0) for the test datasets with combined PDT and PTT treatments were (4, 6), (4, 15), and (8, 6), (8, 15). These values were selected to produce similar treatment efficacies that would enable examination of the effect of the combined treatment without exceeding the maximum value of any parameter. We first applied PDT, followed by PTT; the order of application has been demonstrated to be approximately commutative.
In RT, an electromagnetic power source is concentrated to form a beam, which is radiated toward the target tissue. The radiated beam, B, can be defined (following 32) as:
where represents the electromagnetic waveform, fc, and φ are its frequency and phase, and α(θ) represents the spatial attenuation factor, which is a function of the beamforming technique and the electromagnetic waveform properties.
The beam is radiated in the desired direction with a pre-determined intensity, frequency, and duration (τ) that alter the properties of the affected tissues (3, 33). Thus, the spatial attenuation factor can determine the spatial selectivity of the radiation treatment.
The cellular properties of cancer cells differ from those of normal cells in several respects, such as membrane permeability, cellular morphology, and gene expression (34). A nanotechnology phototherapy design as described by Haimov etal. (14) or Raj etal. (35) aims to exploit the difference in permeability to enable NPs to enter the cancer cells exclusively. This targeted nanotechnology approach is dependent on tissue composition, endothelial cell junctions, tumor location, and the characteristics of the NPs (20, 36, 37).
Overall treatment selectivity is affected by radiation selectivity, which is determined by the beam spatial attenuation, a(θ)), and by nanotechnology selectivity (38). Thus, the overall selectivity is determined by the nanomaterial, the cell membrane permeability, and the properties of the radiation:
Where mn represents the set of relevant NP properties such as size, material, and shape; Cp represents the permeability-related properties of the cancerous and normal cells in the tissue undergoing treatment; and B(θ,fc) represents the properties of the radiation targeting the selected area.
Figure 3B illustrates the spatial sensitivity of traditional radiotherapy aiming to minimize damage to normal cells. Figure 3C illustrates how treatment selectivity for cancer cells over normal cells can be used together with spatial selectivity to enhance the overall efficacy of a combined treatment.
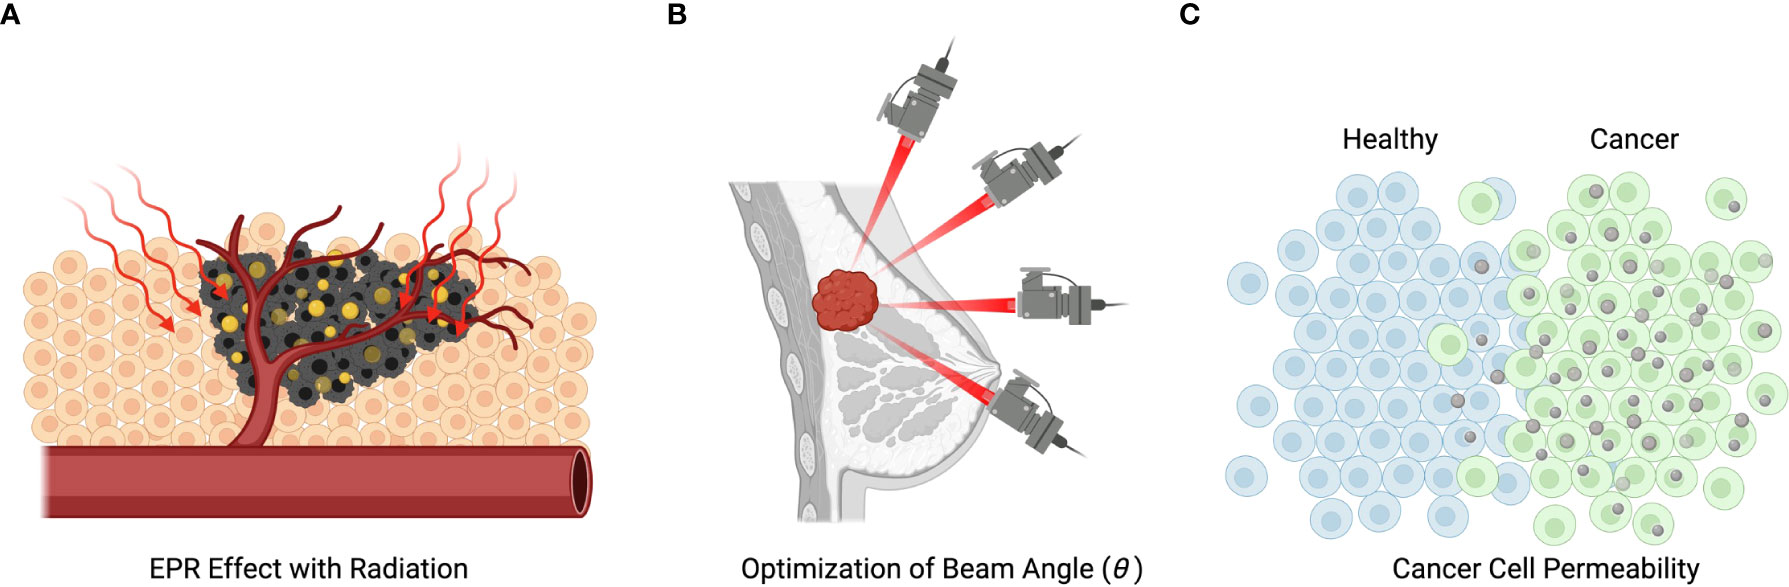
Figure 3 Mechanisms of radiation and nanotechnology-based treatment. (A) Illustration of nanoparticles entering the metastatic cells and being subsequently activated by radiation. (B) Illustration of the spatial selectivity of traditional radiotherapy, which is spatially selective, but can cause death of not metastatic cells. (C) Demonstration of how metastatic selectivity together with spatial selectivity can enhance treatment efficacy.
A prerequisite for personalized cancer treatment is the ability to optimize treatment efficacy while preserving certain constraints. Here, the major criterion for treatment efficiency is the ability to terminate cancer cells while sparing normal cells from any harm. The treatment can be administered under certain safety constraints to ensure that radiation will not cause irreversible damage to non-targeted tissues (39); these constraints include NP biocompatibility (40, 41) and reduced treatment duration. In addition to safety considerations, treatment costs and computational difficulty can also be considered.
We define the response to treatment n, with treatment conditions Pn, as the cell death rate as sampled T hours after the beginning of the experiment; this can be represented by the expression . The cell death rate represents the probability that an individual cell within a sampled population will die, and its possible values range from 0 to 1. The treatment conditions, for example, might consist of laser radiation intensity (mW/cm2) and duration (min).
An efficiency criterion for maximization in laser radiation-based cancer treatment is:
where, and represent the total death rates among the targeted cancerous and normal cells, respectively; is a clinical cost represented as a function of the treatment duration; and is a safety cost, usually a function of the laser radiation intensity and the nano-material component.
This criterion implies that the ratio is the treatment selectivity, , which needs to be maximized while preserving feasible treatment duration and safe radiation conditions. Treatment latency, which is a component of the treatment cost, must also be minimized, while treatment safety must be maximized, or fall within the boundaries of the FDA regulations (31).
Death rate is a non-linear function that is determined by the treatment conditions, laser radiation intensity, and duration (42). To estimate the death rate of targeted and non-targeted cells, we need to calculate the death rate as a function of the treatment condition and compare it to a reference baseline. The cell death rate compared to the reference baseline can be defined as:
where D0 is the initial death rate of the cells, is a function of the nth set of treatment conditions Pn, sampled at time T, and is the control death rate in the absence of the treatment, also sampled at time T, which is used as a reference.
Thus, the treatment success rate as a function of the treatment parameters I (laser radiation intensity) and τ (laser radiation duration), according to a sample taken after 24 hours from the experiment onset, is defined as follows for the PDT and PTT treatment conditions, respectively:
In the case of the dual PDT and PTT treatment design, death rate is assessed as follows:
For example, in a case in which PDT and then PTT treatments are administered, and the tissues sampled after 24 hours, with the treatment parameters IPDT,τPDT , and IPTT,τPTT , we would compute the following death rate:
For an unbiased comparison between any single treatment and the combined effect, we equate the laser radiation intensity and duration used in the combined PDT and PTT treatment to that of an individual PDT or PTT treatment,τPTT or τPDT.
To determine the optimal efficiency of a given treatment , we need to solve for the criterion in (3), as a function of the treatment conditions under the treatment latency and safety constraints. We can do this using the L2-norm loss function, while minimizing the difference between treatment sensitivity and the desired sensitivity goal, and with the addition of the safety and duration losses as constraints. The criterion for identification of the optimal treatment conditions for the nth treatment, after T minutes, thus becomes:
Solving for this criterion can be cumbersome. We can assume, without loss of generality, that the death rate of the normal cells, , is both low and relatively constant, and can therefore be neglected. We further assume that the NPs employed in application of the treatment are biocompatible. Accordingly, the only tunable safety parameter is that relating to laser radiation. The treatment optimization criterion then becomes:
where τ<τmaxrepresents the treatment latency constraint and I0<I0,max represents the safety constraint, with I0,max being the maximum laser radiation.
The criterion in (9) can be used to identify the optimal treatment parameters. We assume without loss of generality that the treatment parameters consist of laser radiation intensity and treatment duration. Thus, the solution to (9) can be obtained by solving for the following criterion:
where is the desired death rate of the cancerous cells and is the measured death rate as a function of the treatment parameters (laser radiation duration and intensity).
The solution implies that the treatment parameters should be identified while the constraints are preserved. To solve (9), we can use predictive models based on training datasets (18) that capture the statistical outcomes of a range of parameter settings. Although the problem is non-linear, we can exploit high- order polynomials, as in Blumrosen etal. (39). Our objective is to predict continuous cell death rate values, rather than predicting a predetermined set of classes. Therefore, continuous methods like regression and interpolation are appropriate. Non-linear regression can include many coefficients, which means that they can suffer from overfitting and cause estimation errors to accumulate. Accordingly, we also propose adopting an approach to fitting using analytical functions that preserve the asymptotic conditions of the solution.
If the influence of the two treatments on the viability of cells is independent and there are no live but affected (i.e., partially damaged) cells, their combined effect in terms of efficiency can be defined as the additive sum of the two efficiencies. Under a realistic set of model assumptions, we assume the following: 1) there are some cells, referred to as “affected cells”, that incur partial damage; 2) a portion of the cells with partial damage will recover naturally; 3) another portion of the cells with partial damage will accumulate further damage under the effect of the other treatment, which is likely to contribute to the cell death rate.
We model the probability of cell death after treatment as pD, which can be estimated as a function of the experimental conditions. The cell death rate associated with a particular experimental setup can be measured based on the fluorescent intensity of the cells present in the training data, as this variable attests to the cells’ condition (43, 44). Specifically, a signal indicating high fluorescent intensity can be taken to indicate reduced cell viability, since it means that membrane permeability is greater and consequently the cell has a higher probability of dying.
Traditionally, cells have two possible conditions: live or dead. In practical terms, in our work, we measure the probability of cell death by examining the population. We can determine the probability of cell death if the population statistic exceeds a threshold of DTH for the value that ensures the cell’s death:
where FD is the cumulative function of the probability distribution, and the probability that a cell will be unaffected by the treatment is . DTH is determined in such a way as to ensure that a desired sensitivity and specificity are achieved in this classification, e.g., specificity of 0.95. The results need to be verified either by inspecting the properties of the cells or by tracing the sampled cells for a long period.
In this work, to model the intermediate state, we define three cell states: unaffected, affected (partially damaged), and dead. Detection of damaged cells is challenging (45), but cell damage following this type of treatment results in alterations to overall cell volume, cell circularity, and membrane integrity.
To estimate the condition of the cells, and specifically to estimate the death rate, , an accepted method is to observe two main features: cell size and membrane permeability. Normal cells will retain their size and exclude fluorescent binding dyes, whereas dead or damaged cells are drastically smaller and contain permeable membranes that allow fluorescent materials such as propidium iodide (PI) to enter unimpeded (43). The clustering of cell states is a k-dimensional problem, where k is the number of features. A machine learning algorithm can be used to locate the decision boundaries that maximize the selectivity and specificity of the clustering algorithm. Under the assumption that some of the cell state parameters are continuous, such as the correlation of the fluorescence signal with cell death, the problem can be reduced to a single dimension with two thresholds based on the probability of cell death within the population. As an example, the clustering of cells into the three conditions of unaffected, affected (partially damaged), or dead can then be approximated by:
where Pd, Pa and Pna, are the probabilities of death, being affected (partially damaged), and being unaffected (normal), respectively, and the thresholds for death and being unaffected (DTH, and HTH) are selected for the desired sensitivity and specificity (46). Figure 4 illustrates the decision boundaries used to classify the conditions on the basis of the cell death probability density function, ), with classification carried out on a simulated randomized dataset with mean values of 0.1, 0.3, and 0.7 for the proportion of unaffected, affected, and dead cells, respectively.
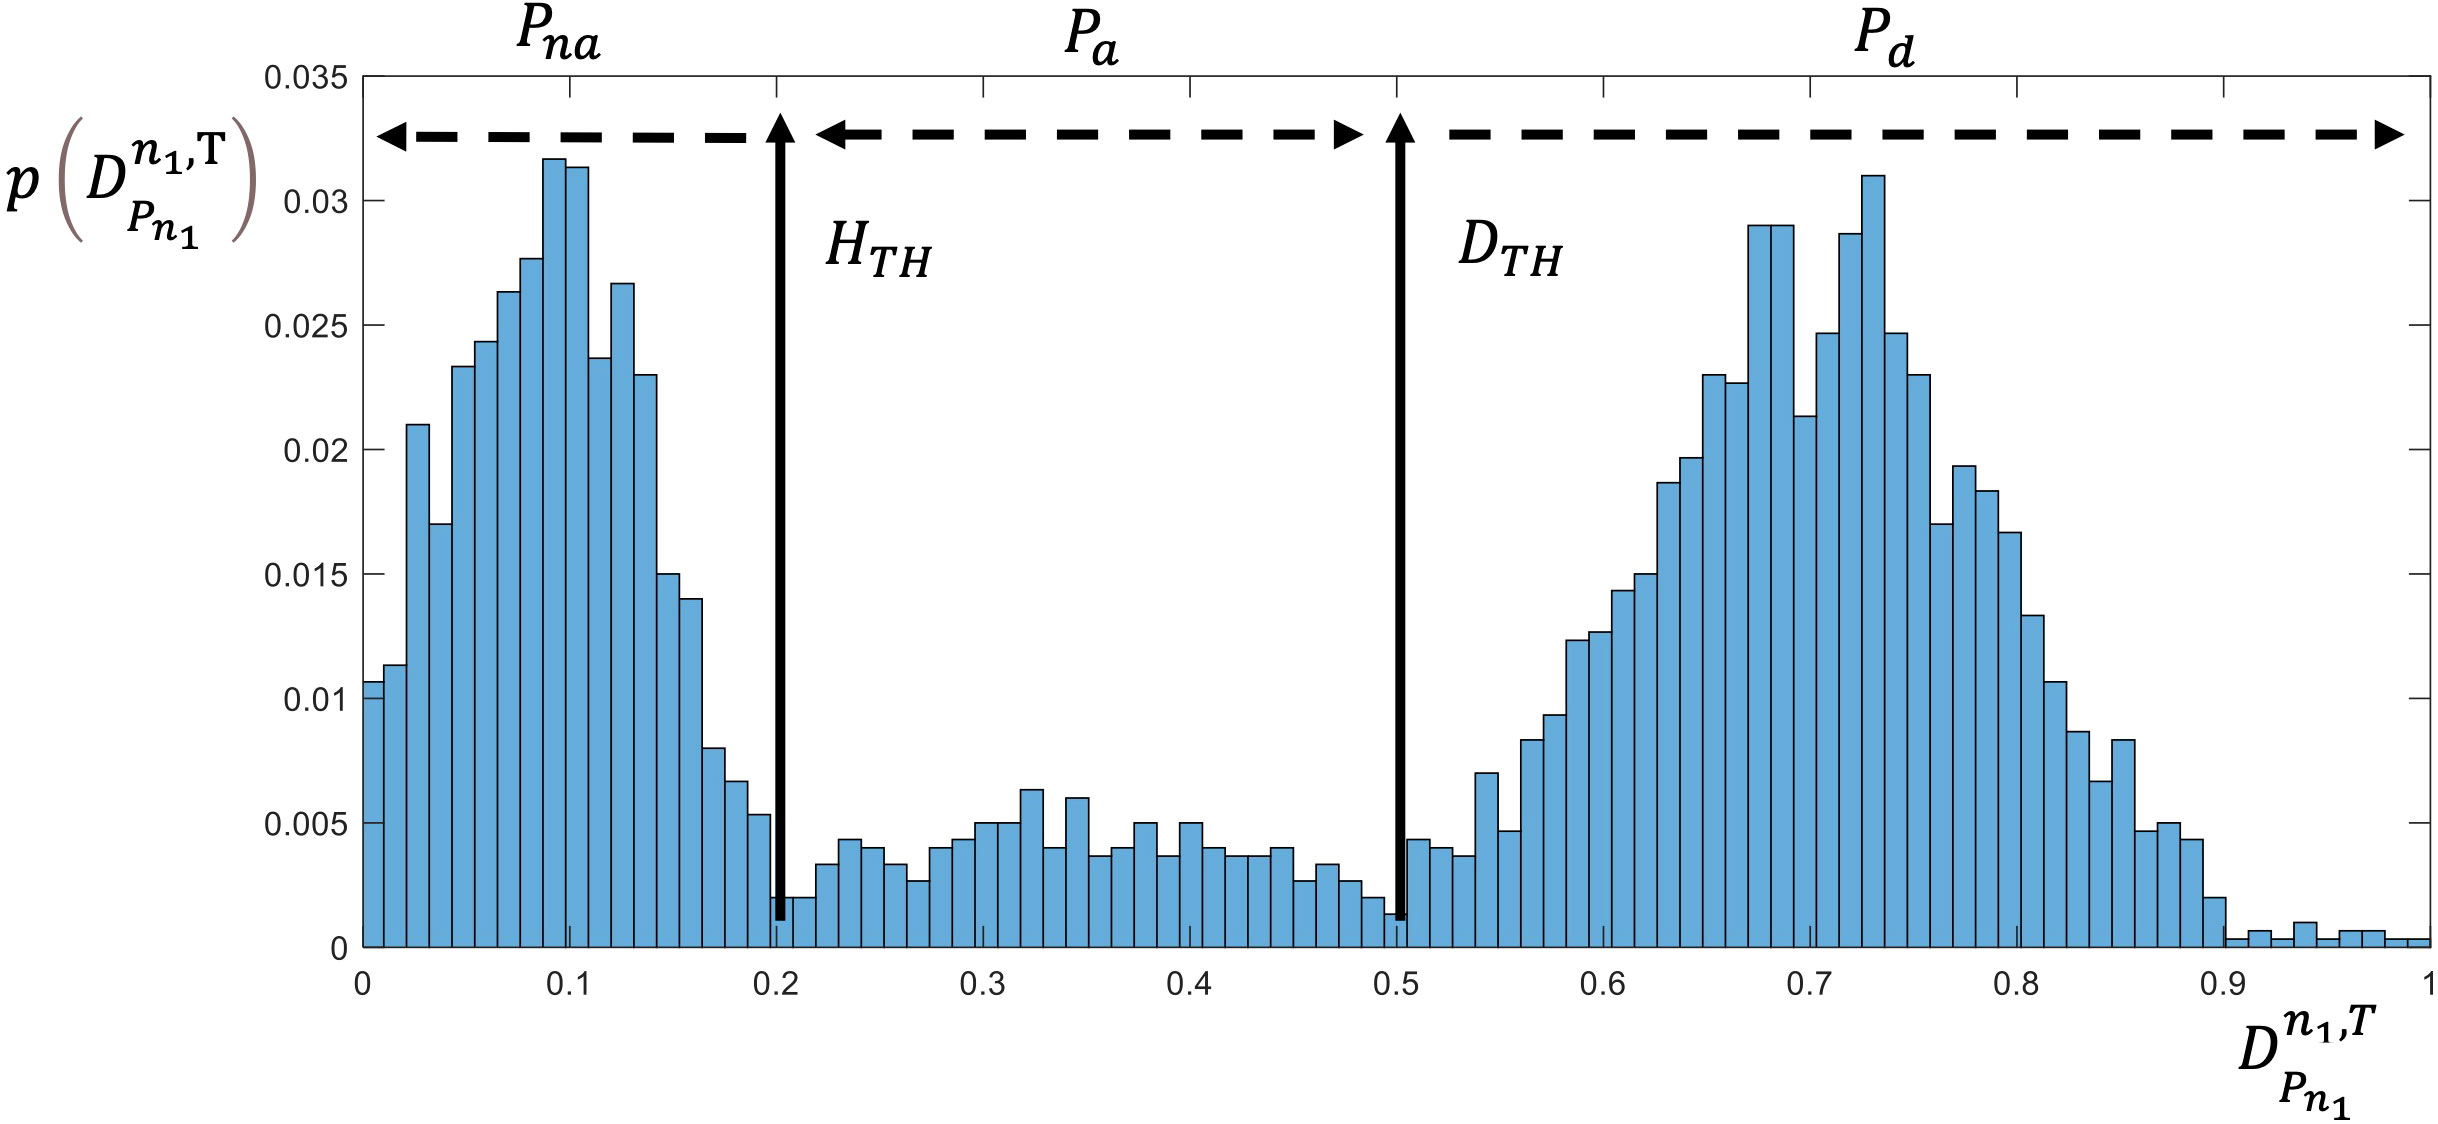
Figure 4 Cell state as derived by the death rate probability.
The combined effect of multiple cancer treatments is of great importance in cancer therapy (47). The primary consideration is that the concatenation of different treatments can increase the level of accumulated damage to the targeted cells in a diverse manner, thereby improving the overall effectiveness of treatment (25). Secondarily, the two treatment effects described in (6) combine with one another in a non-linear fashion, which makes it cumbersome to optimize this combined treatment based on separate optimization of each individual treatment. Consequently, non-linear parameter optimization can enhance performance in a desirable way, in a similar manner to hyperparameter configuration of non-linear neural networks (48). We derive a statistical model of this combined effect below.
The presence of damaged cells induces a statistical dependency between treatments (whether they involve repetition of the same treatment or administration of a different treatment), as the probability that damaged cells will recover or die depends on the prior probability. The probability of death after consecutive treatments becomes:
The term is equal to 1 since dead cells remain dead.
A combined treatment gain can be defined as the relative gain occurring as a result of two consecutive different treatments compared to that occurring as a result of consecutive applications of the same treatment (24, 49, 50). Thus, the gain is:
The combined effect can also be denoted as SG(n1,n2|n1).
A value of SG (n1) > 0 indicates a synergistic result. This implies that application of the two processes has a higher efficiency than the option of repeating the same treatment. When SG (n1) = 0, there is no synergetic gain; instead, the gain between treatments is additive. Finally, when SG (n1)< 0, the efficiency is higher with repetition of treatment n1 ; consequently, the gain is of a type referred to as antagonism.
Substituting the terms in (13) into (14), we derive the combined gain as follows:
The combined gain can be further separated into two components, covering the effect of the combined treatment on damaged cells and unaffected cells:
where and represent the combined gain in relation to affected (partially damaged) cells and unaffected (normal) cells, respectively, .
Following the initial treatment, affected cells have incurred preliminary damage, which reduces their resistance to the second treatment. The combined gain depends on the treatment condition and on the details of the experimental setup, including cell type, NP characteristics, and the accuracy with which cell states are measured. Quantification of the effects of the combined treatments can be used to estimate the combined gain; this entails considering the internal states of the cells after the initial treatment. The probability of cell death in unaffected cells is governed by two factors: death may occur either as a result of treatment or through spontaneous natural death. We assume subtraction of the natural cell death rate in the control experiment in (4), hence it can be neglected. Figure 4 illustrates the cell state distribution after a single treatment and dual consecutive treatments.
To predict the efficiency of the combined treatment, we need to estimate the distributions for each treatment. An alternative method is to use the prediction model to make estimates based on measurements taken following different components of the combined treatment.
Excluding deaths among normal cells and the presence of damaged cells (since these are not clustered as dead cells) we derive a lower bound for the probability of cell death under the combined treatment:
A further lower bound can be established based on the assumption that there is no synergetic effect of the treatments, and we neglect deaths occurring among unaffected cells (natural death) and damaged cells. Accordingly, the two treatments each have an independent effect based on the unique influence of each on the viability of cells. The lower bound then becomes:
The lower bound in a case in which the predicted outcome of the first treatment alone is , and that of the second treatment is , would be . If the result of combined treatment is a higher death rate than the lower bound, this indicates a synergetic gain: for example, experimental results demonstrating a death rate of 0.94 would indicate a synergetic gain of 0.1, or 12%.
Pre-processing was performed on the raw data on cells’ fluorescent intensity, which was measured as an indicator of the rates of cell membrane damage and cell death. First, we computed the normalized level of fluorescence in comparison to a baseline reference; this was taken to represent the probability of cell death . Subsequently, we excluded artifacts on the basis of extreme cell size values that would be unrepresentative of cells. For appropriate artifact removal we used the standard protocol for flow cytometry analysis. Fractional cells and doublet cells were treated as artifacts and excluded. The clustering of cells into live and dead clusters was derived in accordance with a manual gating process in which the size of the cells was also used as a criterion for removal of artifacts arising from fractional cells and doublets, as shown in Figure 4.
Flow cytometry analysis typically begins with the creation of gates and regions to quantify cells of interest. Specifically, forward and side scatter density plots (the former denoting cell size and the latter detailing the granularity of the cell) are used for the identification of distinct cells in a population and to exclude debris. Nonetheless, these FSC and SSC values are merely indications of size and granularity, since they are dependent on the nature of the sample, light refraction, sheath fluid, and laser wavelength. Debris and doublet cells can drastically influence this type of analysis and may lead to mistaken conclusions. Thus, these cells were treated as artifacts and excluded from our analysis (51).
Following this process, we derived from the fluorescent intensity the probability of cell death in a similar manner to Verschoor etal. (30). We then subtracted the control samples from the experimental data. This provided the ability to visualize and demonstrate the combined effect of the NPs and laser radiation. Specifically, we subtracted the mean cell death rate observed in both control experiments (cells treated with NPs only and cells treated with laser radiation only).
The result of the calibration experiment is shown in Figure 5. It can be seen in this figure that a similar death rate (4.0±2.5%) was observed in all control groups after 24 hours, while the death rates in treated samples ranged from 3% to 99%. For a single treatment, in practice, we may opt to use the highest intensity and longest feasible duration: for example, 30 mW/cm2 and 8 minutes. However, since the objective of the present study was to establish the incremental value of the combined treatment, we employed a set of parameters that would induce intermediate rates of cell death, creating the potential for gain as a result of the combination of PDT and PTT treatments.
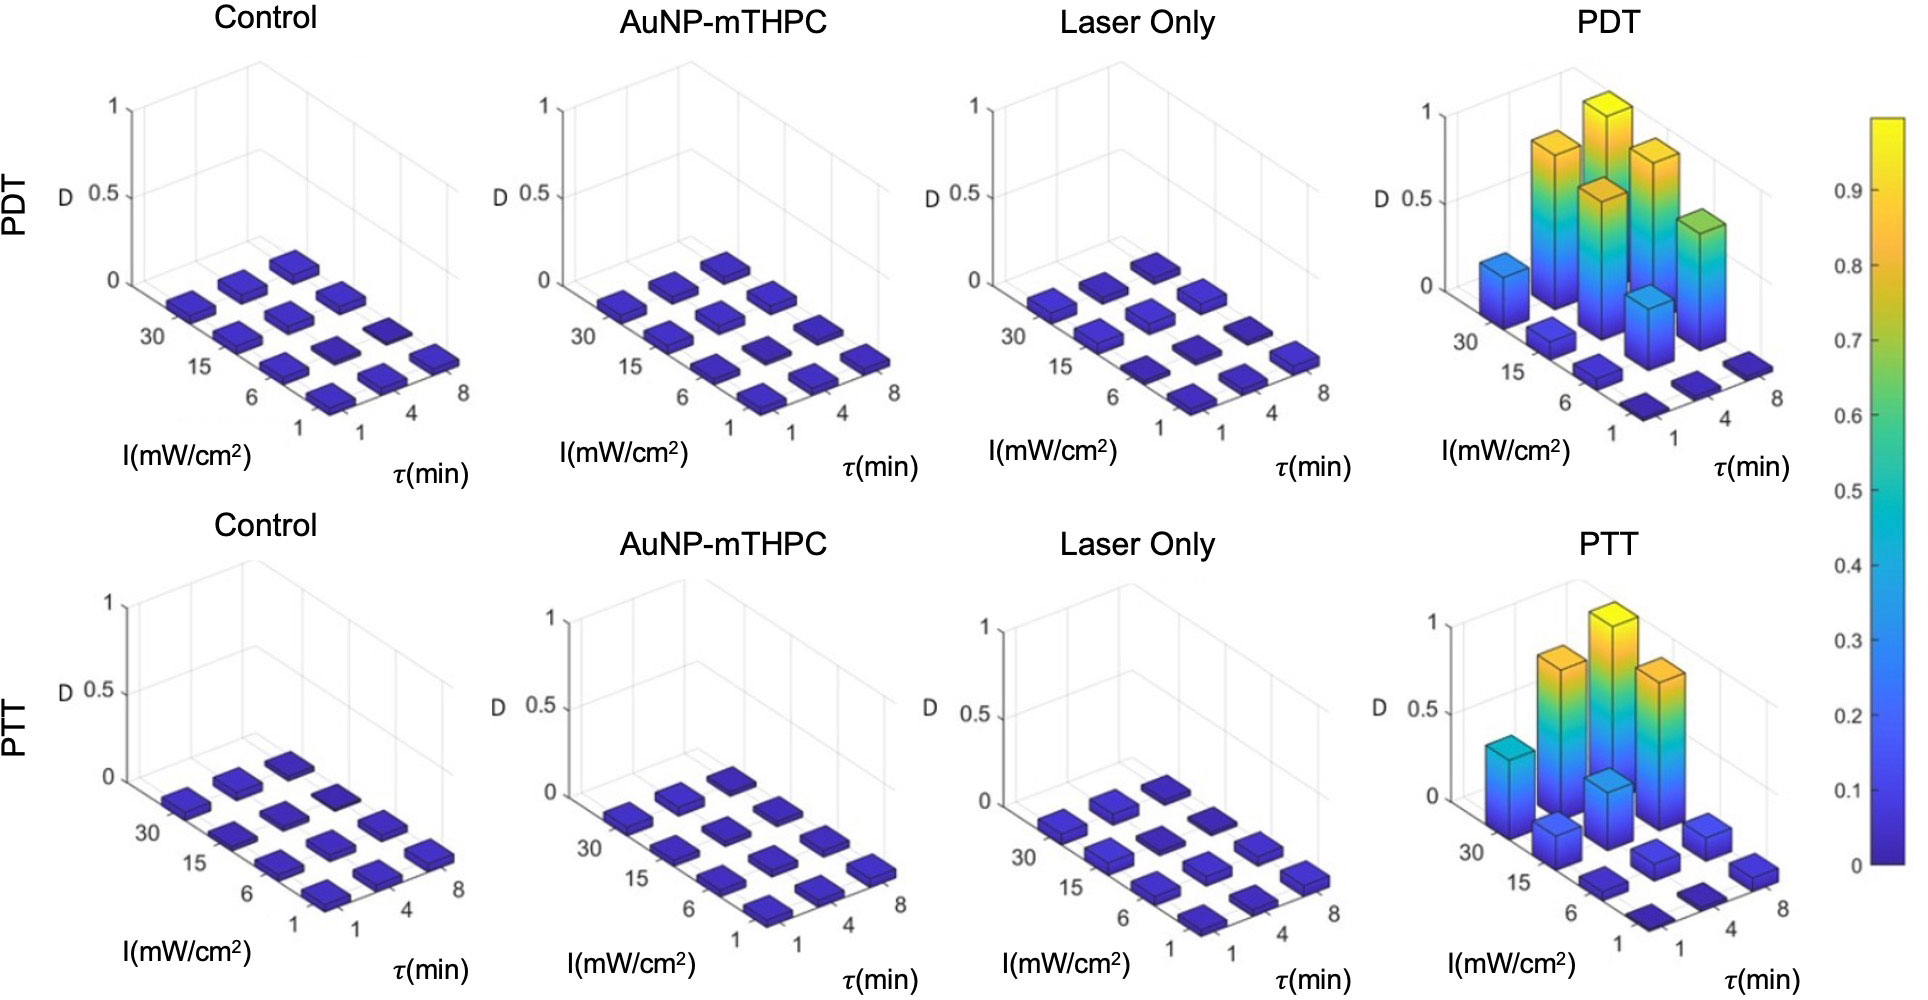
Figure 5 PDT and PTT treatment for different feasible treatment durations (min) and intensities (mW/cm2).
Based on the results, we hypothesized that the death rate was elevated in cases of excessive intensities of over 15 mW/cm2 and treatment durations above 4 minutes. At the low end of the range of laser intensities and durations, the death rate was much lower, with little effect exerted on the sampled cells. We further observed that there was no substantial death rate in any of the controls (4.0±2.5%). Finally, we also observed that PDT produced stronger effects on cells at a lower duration in comparison to PTT; this might be attributable to the time required for NPs to heat up (Figure 5), which was around 90 seconds in our setup. Therefore, for the test data, we selected intermediate laser radiation values of 6 mW/cm2 for 4 minutes and 15 mW/cm2 for 4 minutes for the PDT and PTT treatments, respectively.
Machine learning prediction models, used to approximate the efficiency of a given treatment, are essential in many clinical applications today (52). We compared three common prediction models: regression, interpolation, and analytical function fitting.
For the regression model, we used the LOWESS (Locally Weighted Scatterplot Smoothing) method, which is a non-parametric linear regression method. The LOWESS method works locally by using a sliding window in which each smoothed value is determined by its neighboring data points within a certain defined distance. We configured the sliding window span at 28% and used a robust weight function to combat the influence of outliers. For the interpolation model, we used thin-plate spline interpolation, in which the values lying between each training datapoint are interpolated and smoothed in accordance with a thin-plate spline shape. For the analytical function model, we used a second-degree polynomial fitting all data points.
Figure 6 displays the results of each of the three prediction models for the PDT and PTT treatments. For all prediction curves, the treatment efficiency (cell death rate) is positively proportional to the laser radiation intensity and duration. However, the relationship appears to be less linear in the case of PDT compared to PTT. For all prediction models, we observe that the PDT model produces a larger region of effective treatment. We can see that the efficiency of PDT treatment becomes greater in comparison to that of PTT with diminishing treatment durations. This can be explained by the time that is required for NPs to heat up (41, 42, 49).
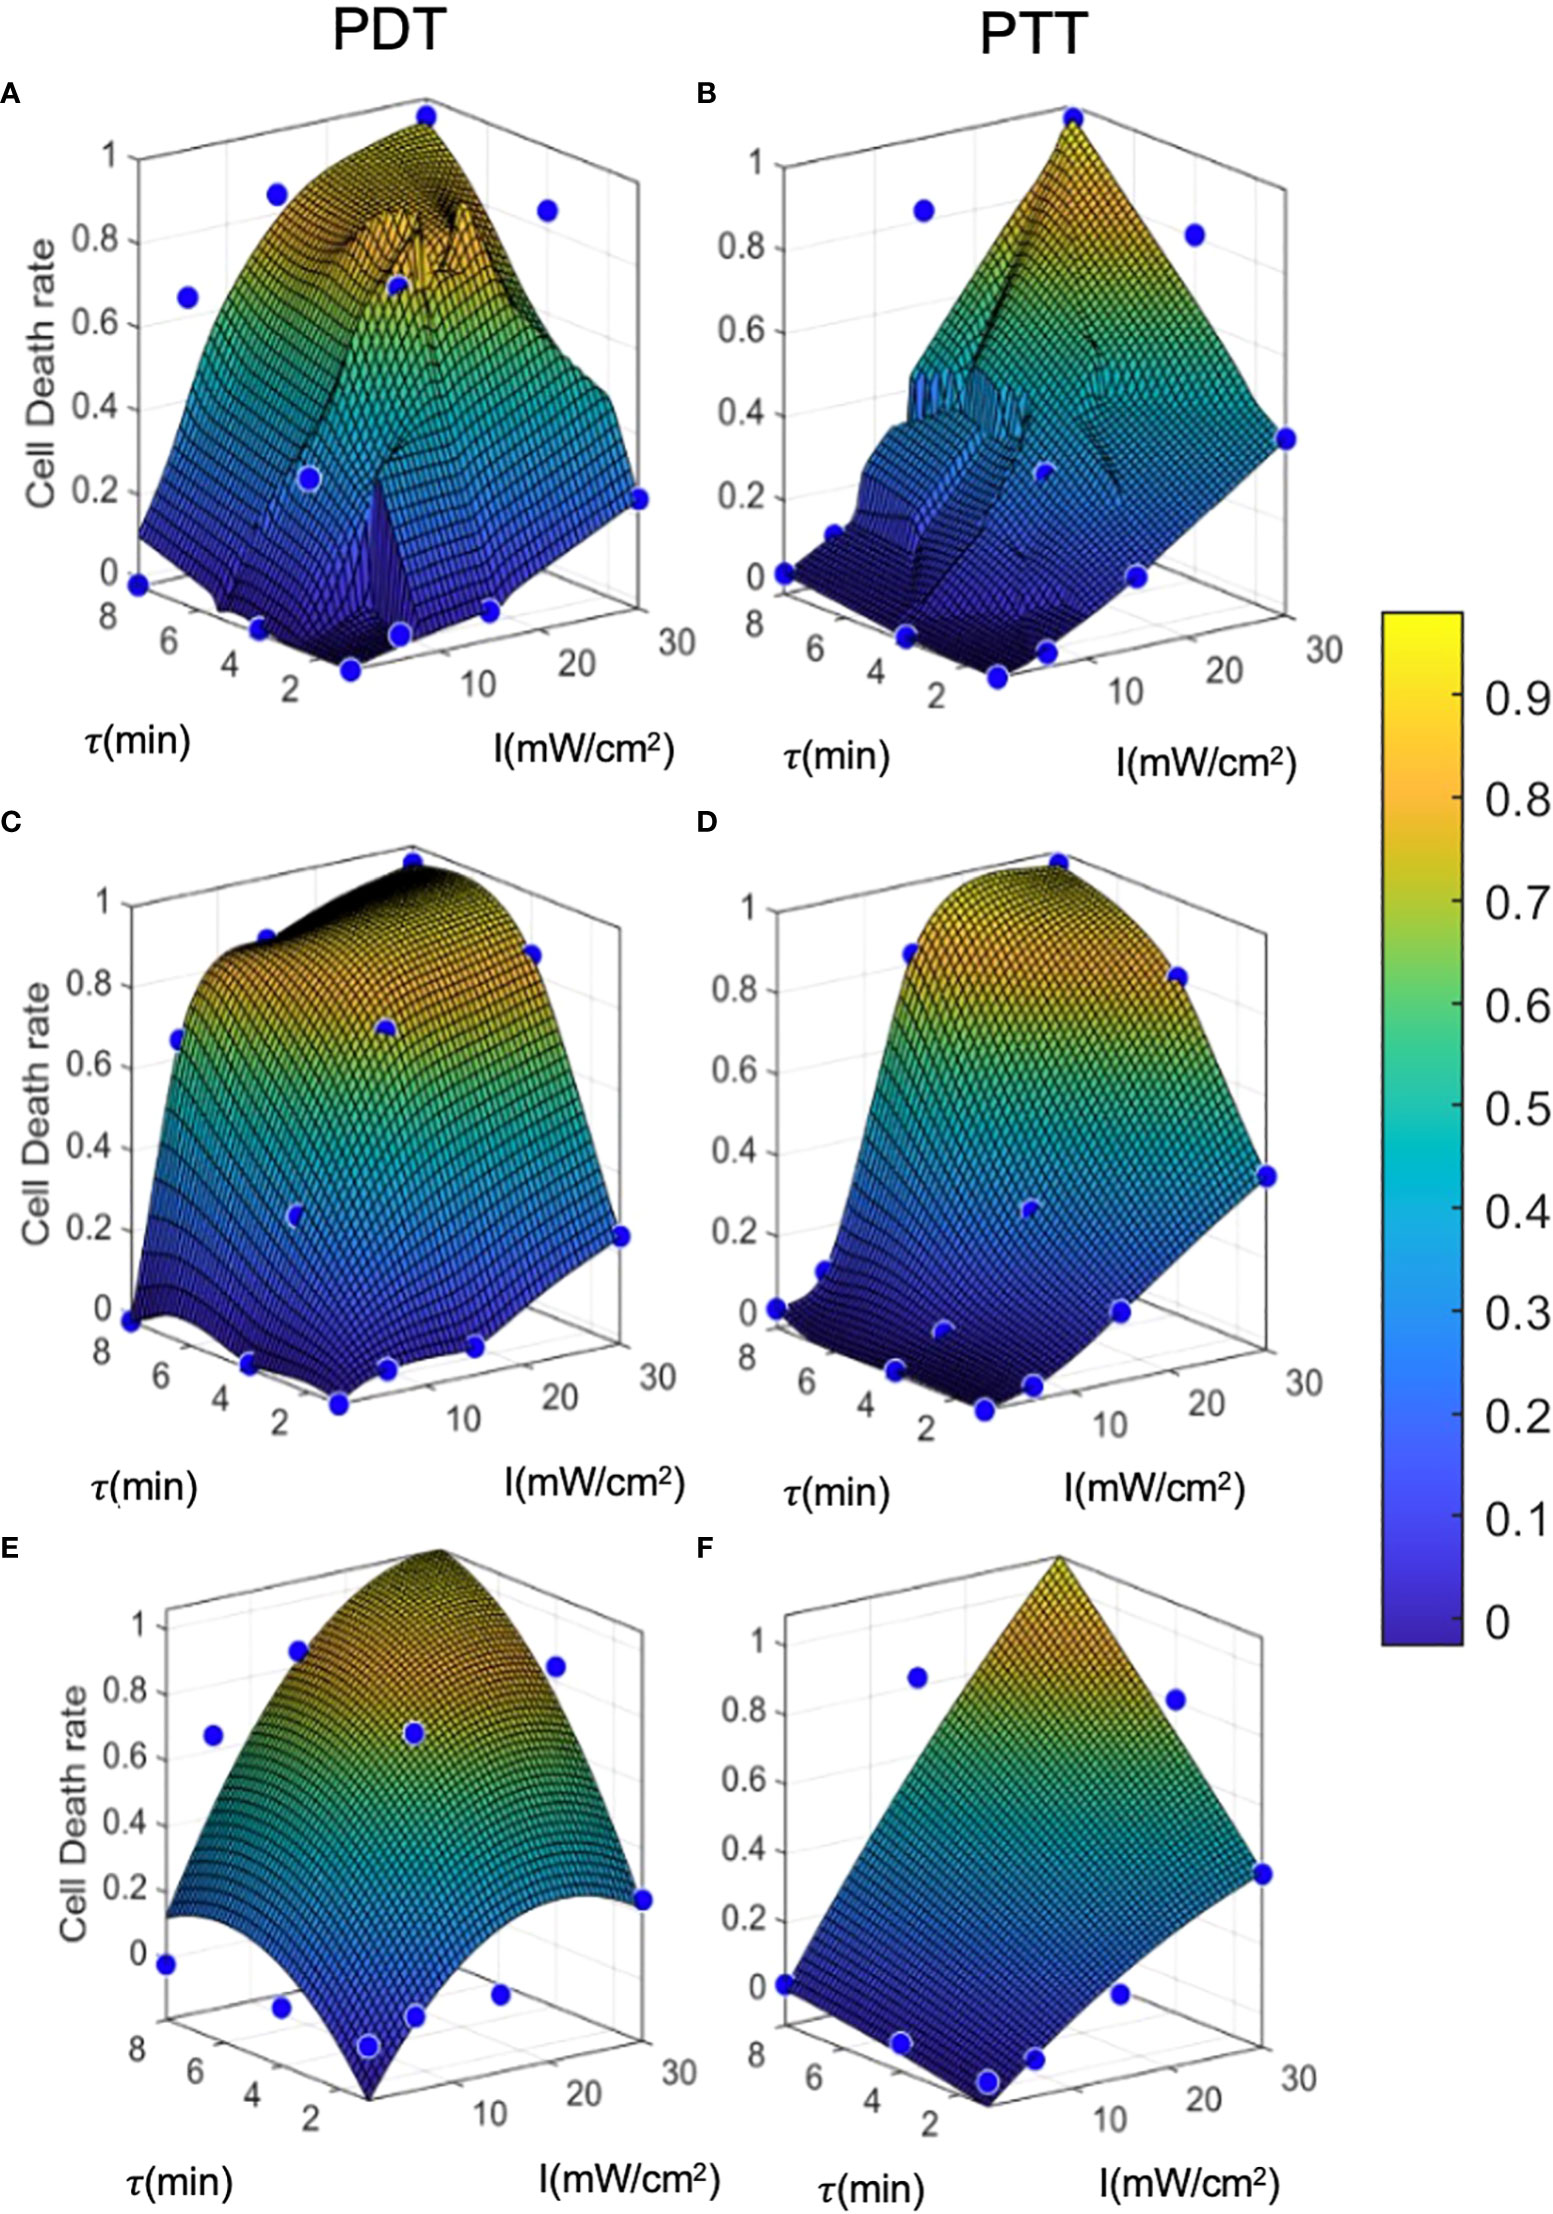
Figure 6 Prediction model curves. (A-F) illustrate the curves generated by prediction models based on regression, interpolation, and analytical function fitting for PDT and PTT, respectively. Blue points represent the mean values of training datapoints.
The linear regression results for both PDT and PTT, illustrated in Figures 6A and 6B, appear to be highly local, and some training datapoints seem to have high residual error values. This reflects the nature of regression models, where the accuracy of the model is directly affected by an inadequate sample size, causing local distortions. This results in relatively high standard deviation error of 4.8 ± 11 and 3.8 ± 10 percent. Nevertheless, the model performed well, with R2 = 0.89 and 0.9 for PDT and PTT, respectively.
Under the interpolation model, illustrated for PDT and PTT in Fig 6c and 6d respectively, the training data points were retained as constraints and points between them were interpolated and smoothed using the thin-plate spline shape. Thus, the residual error at the training data points is 0 for both prediction models, with R2 = 1. Predictions for regions between the points appear to be smoother and to reflect physical behavior.
Lastly, the analytical function model was selected to have a lower dimension rank of two, in the form of . The prediction was not local, allowing minimization of the fitting error for all training data points. The results of fitting were: a1=−0.001,a2=0.04,a3=−0.014,a4=0.170,a5=0.002,a6=−0.392; and a1=−0.0003 ,a2=0.02,a3=−0.0006 ,a4=0.018,a5=0.003,a6=−0.14 , for PDT and PTT, respectively:
The coefficients affirm that the linear components were more dominant in the fitting than the non-linear terms, justifying the moderately transformed slopes. We can further observe from the fitted curves that the outcome of PDT is less linear than that of PTT, with the latter tending to become more linear as the treatment duration increases. This is reflected by larger non-linear terms ( and τ2) for PDT in comparison to PTT.
The error values for this model were -0.02 ± 12 and 0.01 ± 10 percent, but the model performed well, with R2 = 0.89 and 0.92 for PDT and PTT, respectively. The relatively low mean error can be attributed to the optimization criterion, which minimizes mean error over all fitted curves. However, due to the limitation on the number of regression terms, the fit was unable to capture all non-linearities, resulting in relatively high residuals for each training datapoint. The relatively high R2 value for the non-linear analytical fitting approach is expected, due to the monolithic nature of the data and the method of curve-fitting.
The results of the error analysis for training data predictions are summarized in Table 1. While the regression and interpolation methods appear to produce more accurate predictions than the analytical function method, the latter has the advantage of accessibility to clinicians and can also be further analyzed for sensitivity testing. However, where computational resources are unlimited, it seems that the interpolation method with low- pass filtering has the potential to achieve the highest accuracy.
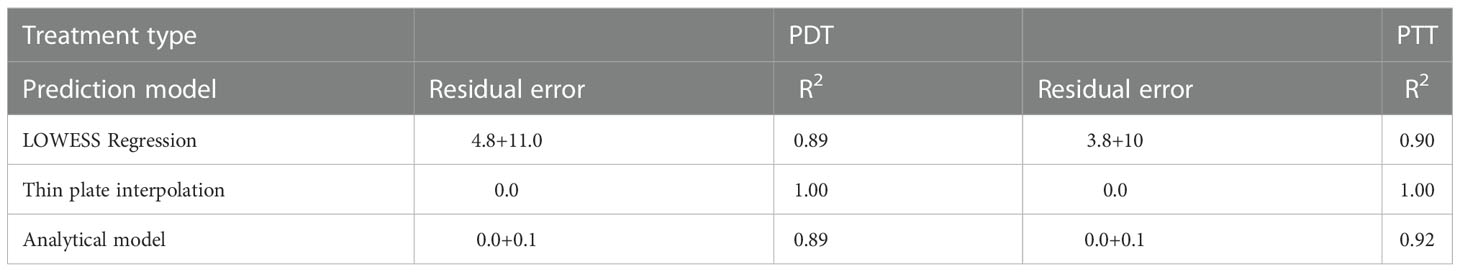
Table 1 Training error analysis results, goodness of fit.
To examine model performance, we used a separate test dataset. The test datapoints are illustrated in Figure 7, where they can be compared to the training datapoints and the predicted curve generated by each of the three prediction models. The mean, standard deviation error, and R2 for each model with respect to the test data are summarized in Table 2. Overall, the error at test was significantly higher than the training error, as expected. In addition, outcome estimates were less accurate for PDT compared to PTT, due to the more complex shape of the PDT curve in relation to treatment duration. In the case of LOWESS regression, the error at test was twice as high as the training error, with similar standard deviation values. The mean error at test for the interpolation model was ≈20% and ≈10% for PDT and PTT, respectively. This was higher than the analytical function fitting model, which generated an error of ≈20% and ≈3% for the PDT and PTT, respectively. The regression model produced a lower mean error at test, but this was associated with a high standard deviation. The relatively high error values at test can be explained by a small degree of overfitting to the training datapoints, which constrained the curve-fitting and the model’s predictions. With the addition of more training data points, prediction error should also be minimized in the case of the interpolation model. The R2 values for the two treatments were highest in the case of the interpolation model, poorest in the case of the regression model, and mid-range in the case of the analytical function approximation. Similarly, considering the usability of the analytical curve, we can conclude that the analytical function offers reasonable performance with high usability. This set of results is expected on the basis of the theoretical properties of each of the three prediction models. The parameter tuning employed in the analytical function method results in a smoother curve due to the minimization of error over all data points, while the interpolation method generates the highest local errors as measured by R2, and the regression model produces the best local error results as a result of the regression cost function criterion. Higher- order analytical function fitting can provide even greater performance, with sufficient usability.
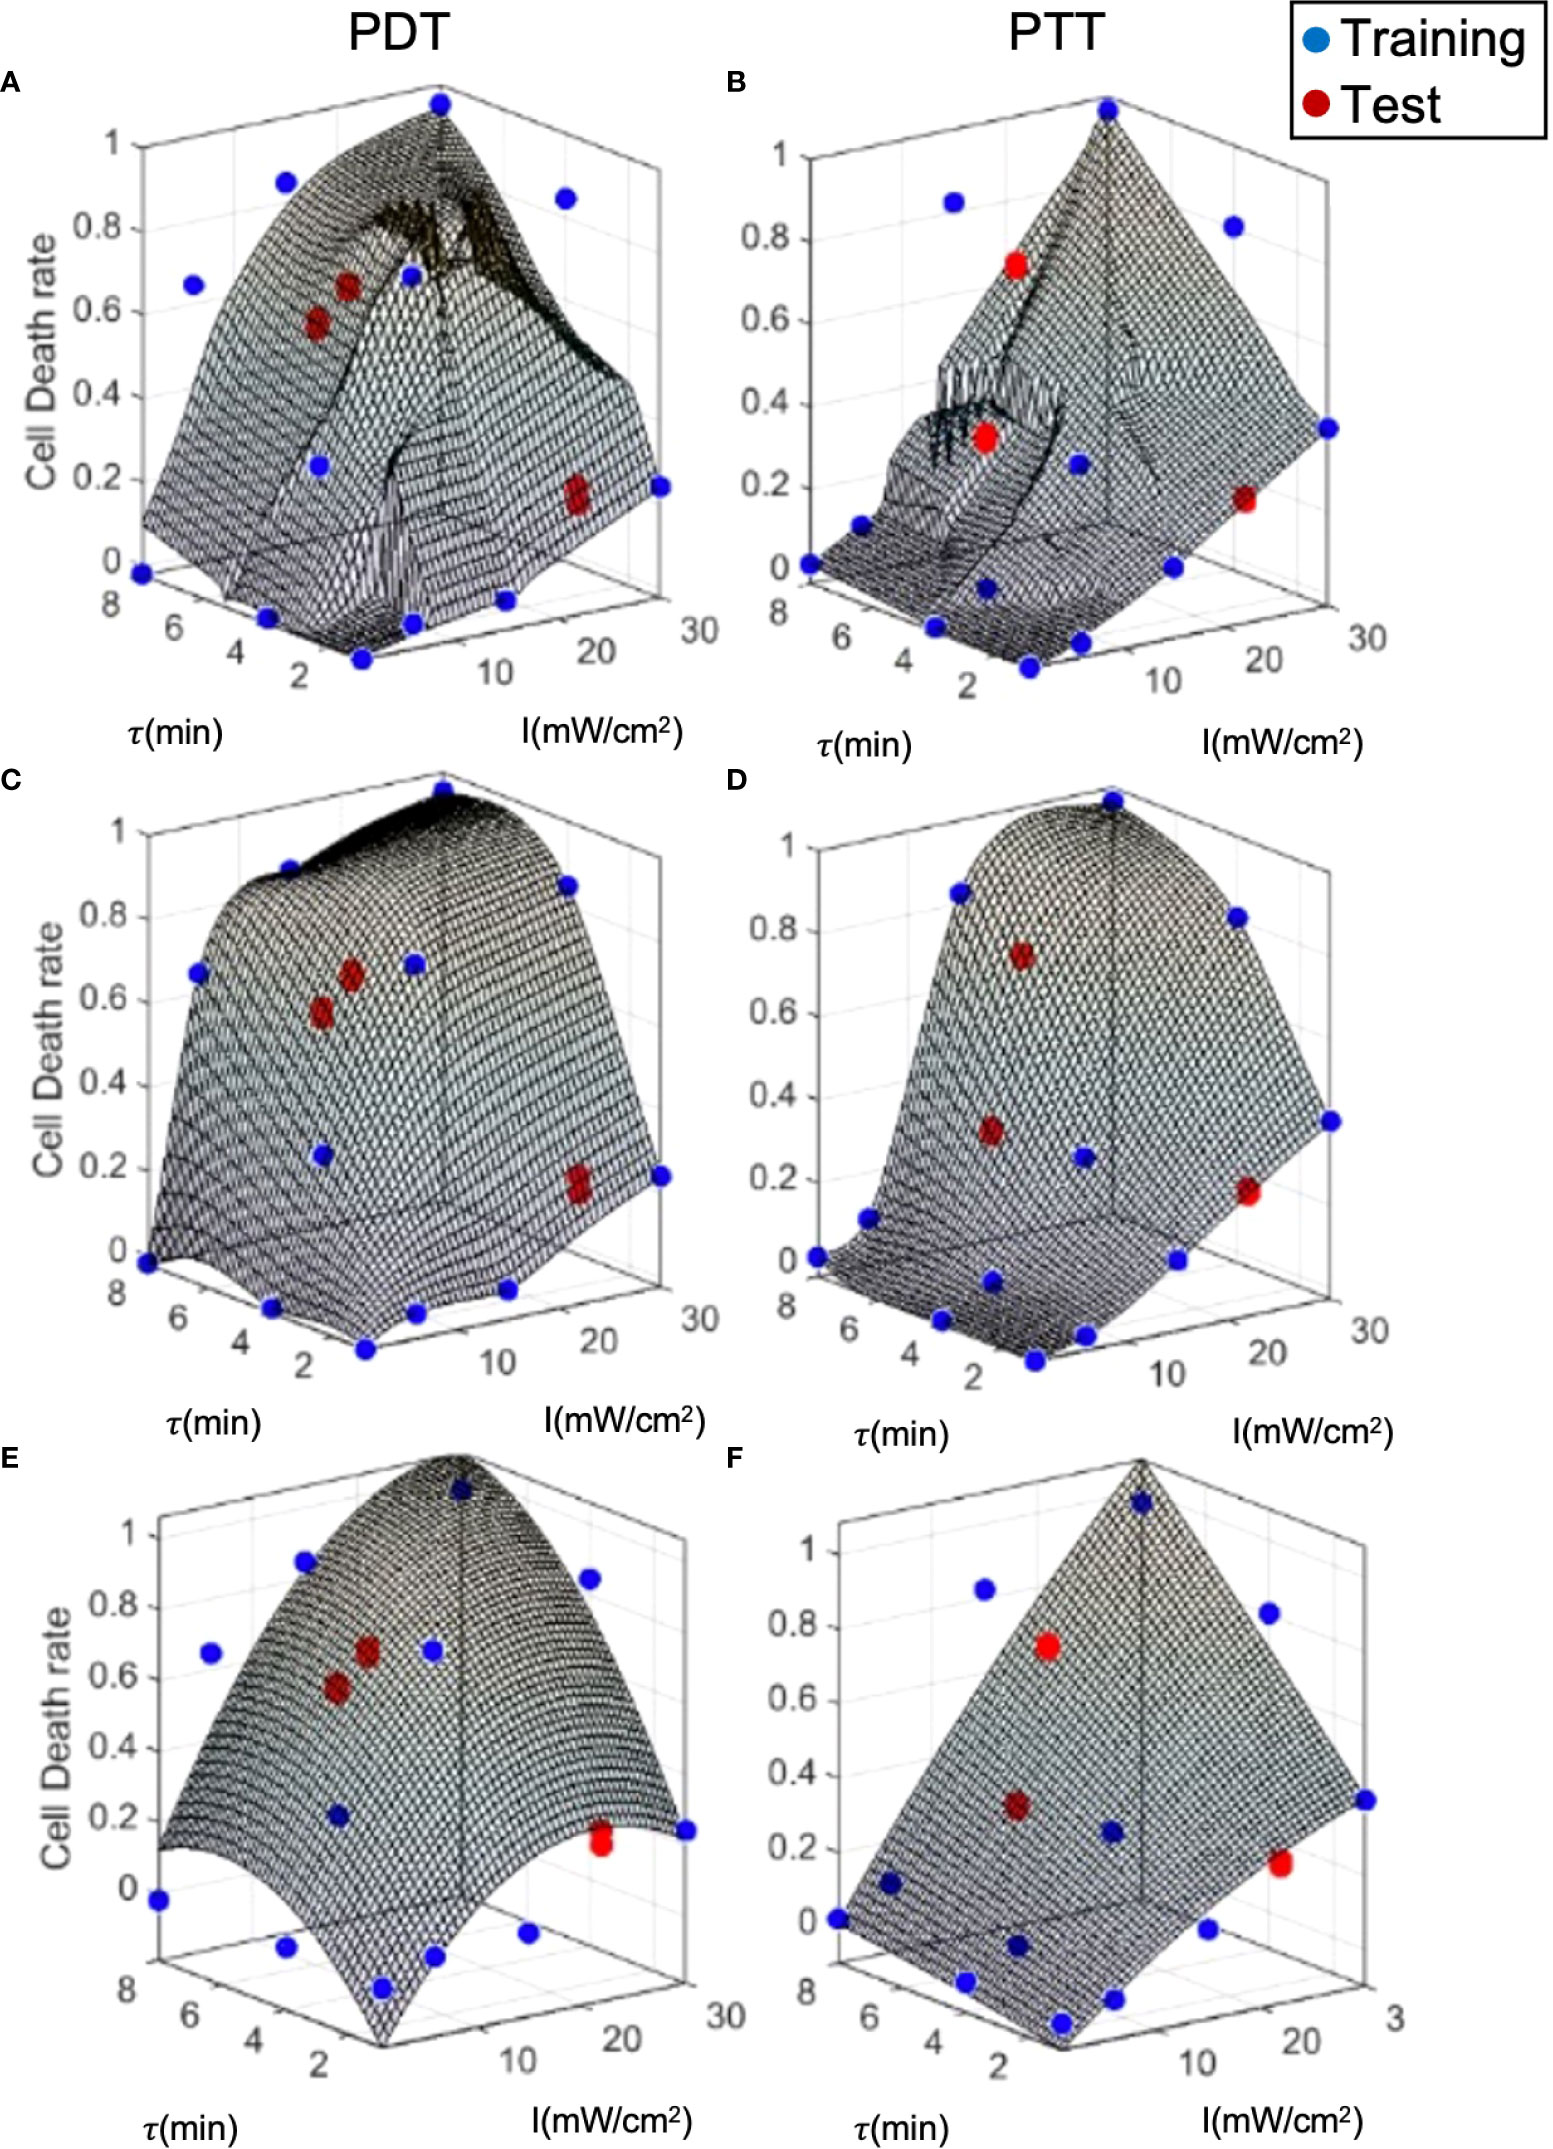
Figure 7 Model prediction error analysis for the three prediction methods. (A, B) LOWESS regression, (C, D) interpolation, (E, F) analytical function.
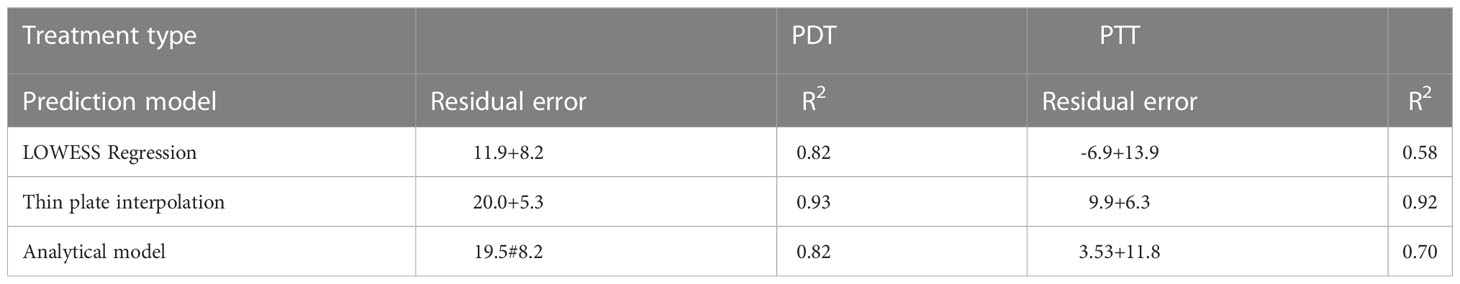
Table 2 Test error analysis results, goodness of fit.
To evaluate and calculate the probability of a given cell falling into each state after treatment, we present the cell death rate predictions of each model on two dimensions, as a function of laser radiation intensity and duration, in Figure 7. In a similar way to a three-dimensional representation, this illustrates the locality of the predictions of the regression model compared to the other two models. The analytical function model appears to be more similar to the regression model in the case of PTT, and more similar to the interpolation model in the case of PDT. Nevertheless, for PDT, the cell death region has a more rectangular shape.
Clustering can be applied to the outputs of the prediction models (Figure 8) to derive the probabilities of cells being unaffected, affected, or dead conditional on the treatment parameters. This clustering takes a different form to the clustering process described in (12), where the cell state probabilities Pd, Pa, and Pna were determined in relation to the physiological properties of the cells after treatment. In this case, the clustering is based on the initial Pd, with the prediction model outputs over the entire cell population and two repetitions of the experiment. The objective was to estimate the cell state probabilities as a function of the conditions applied in the laser radiation treatment.
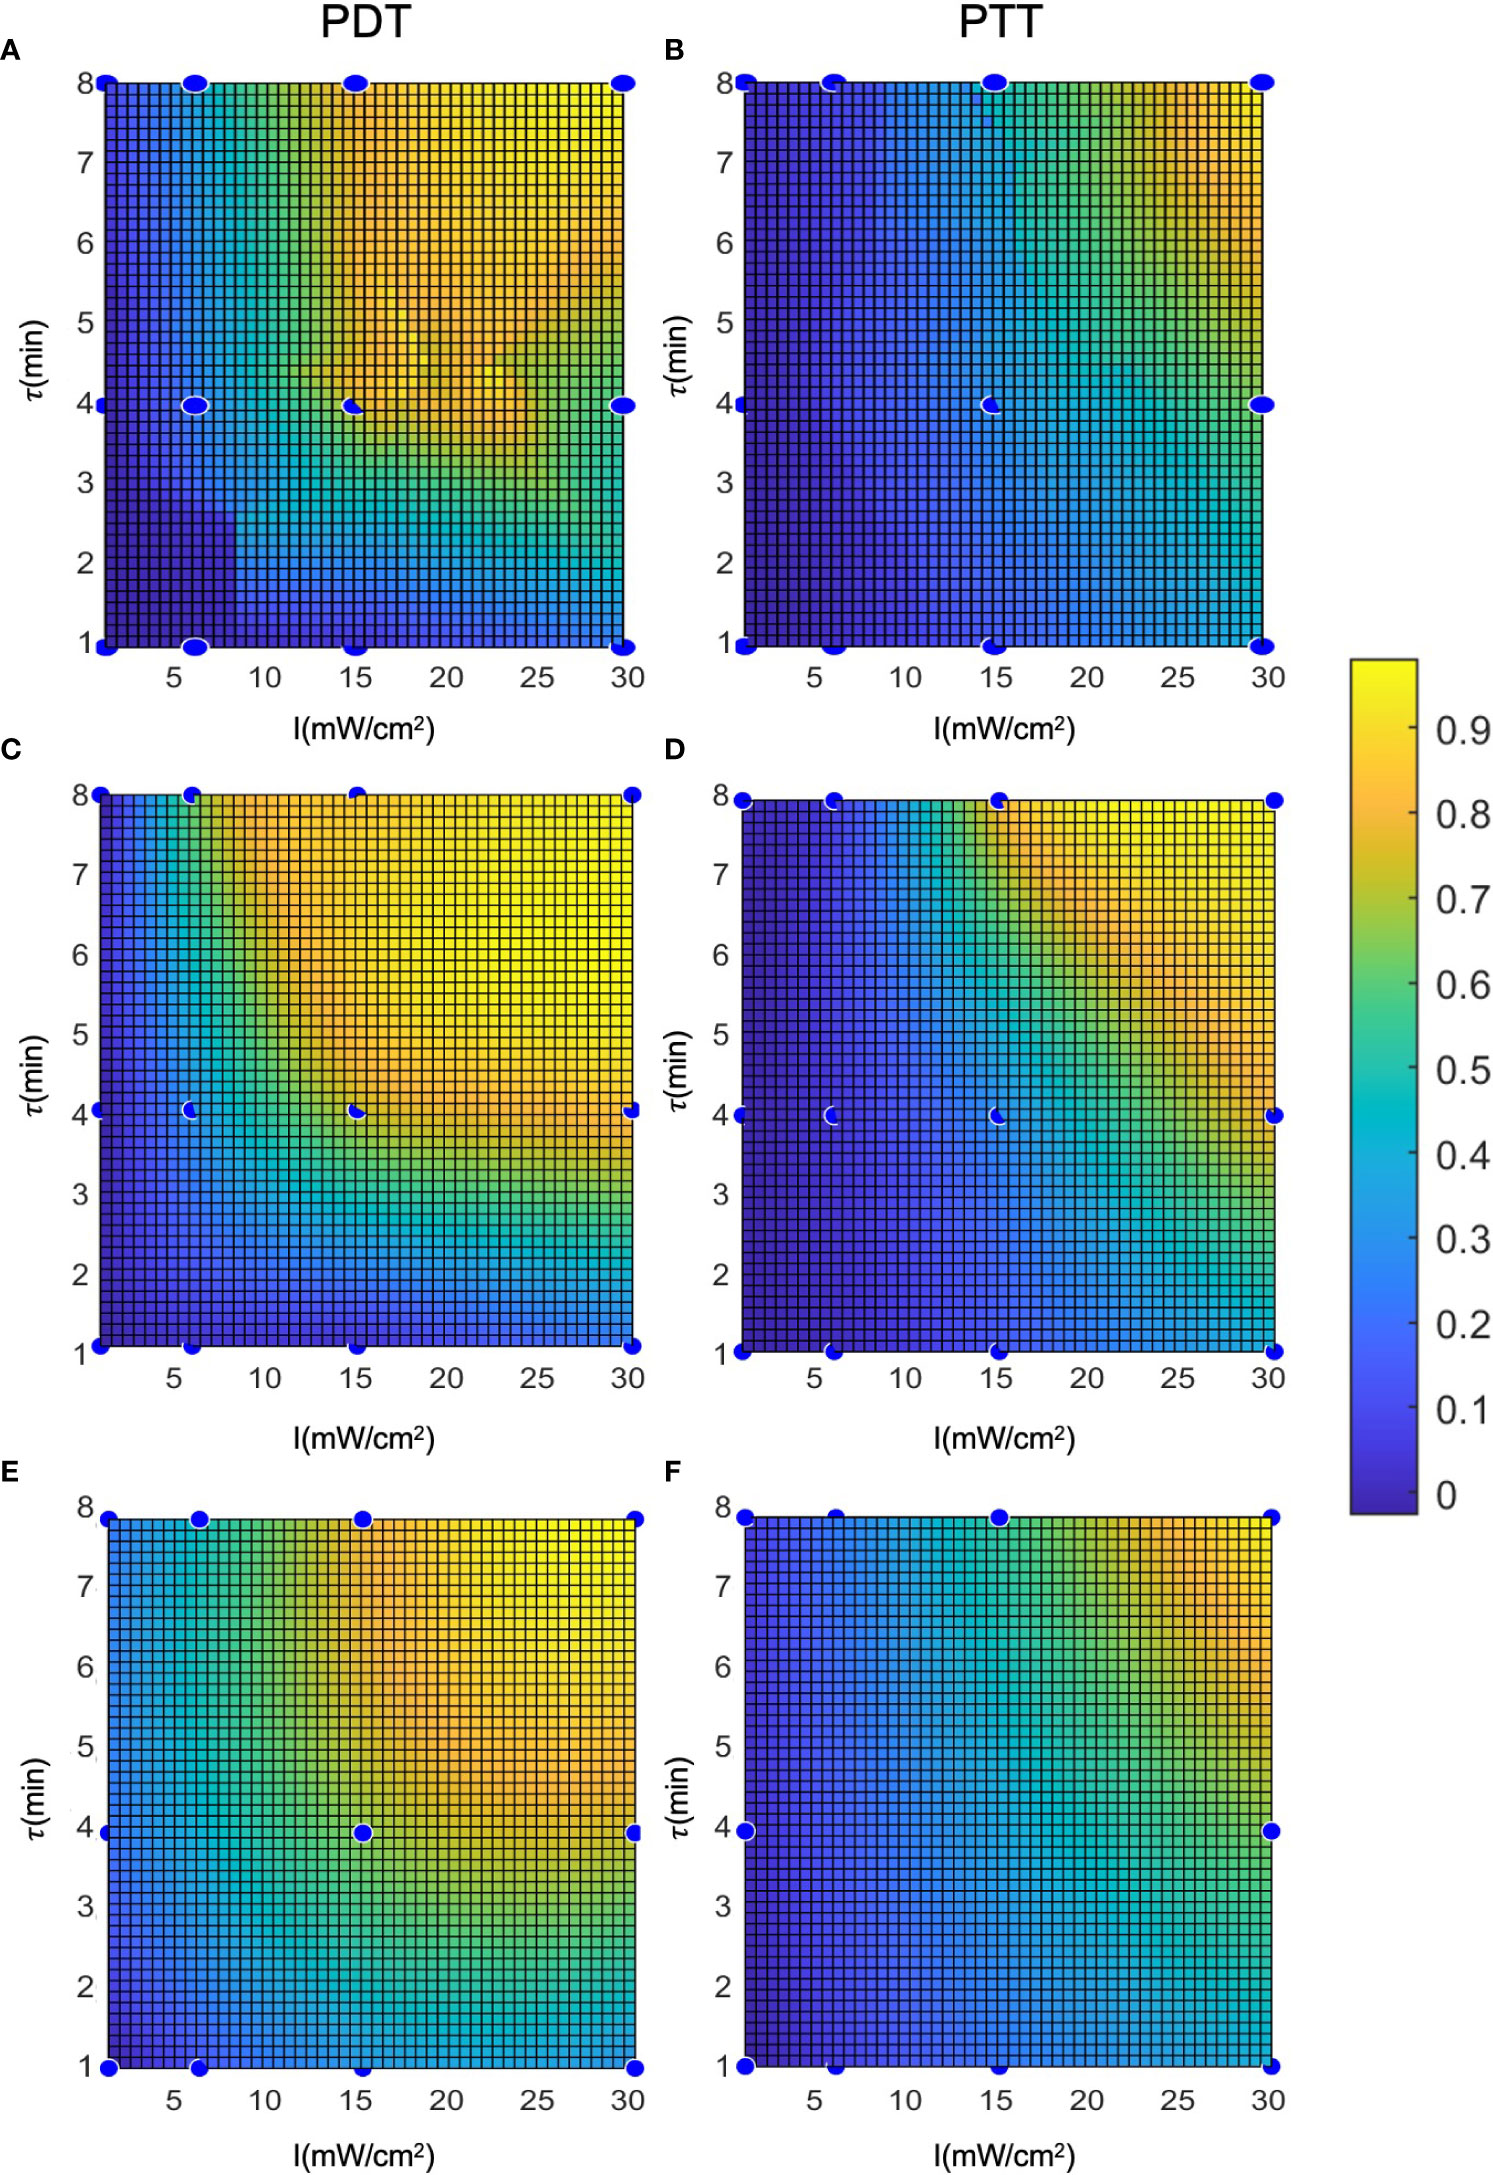
Figure 8 Representation of the cell death rate in two dimensions: (A, B) LOWESS regression, (C, D) interpolation, (E, F) analytical function.
Figure 9 shows an example of clustering of the cells with a cell death threshold of greater than 60% of the cell population (DTH = 0.6), an affected cell population between 30 and 60% (HTH = 0.3), and a proportion of live cells of less than 30%. The unaffected cell population (live cells) was pre-specified in such a manner as to ensure that the median population would be comparable to that of the control samples (≈ 3% death rate). The high degree of overlap between the clusters for the three prediction models appears to reduce prediction error compared to the continuous model. This can be explained by the filtering- like effect of the clustering process, which is based on cell population statistics and exclusion of artifacts (51). The clusters can be cross- validated by tracking cell survival rate or by observing the properties of the cells, as in Galluzzi etal. (53). This would determine the sensitivity and specificity of the threshold values. Cluster validation through additional experiments can also be used to measure prediction strength (54).
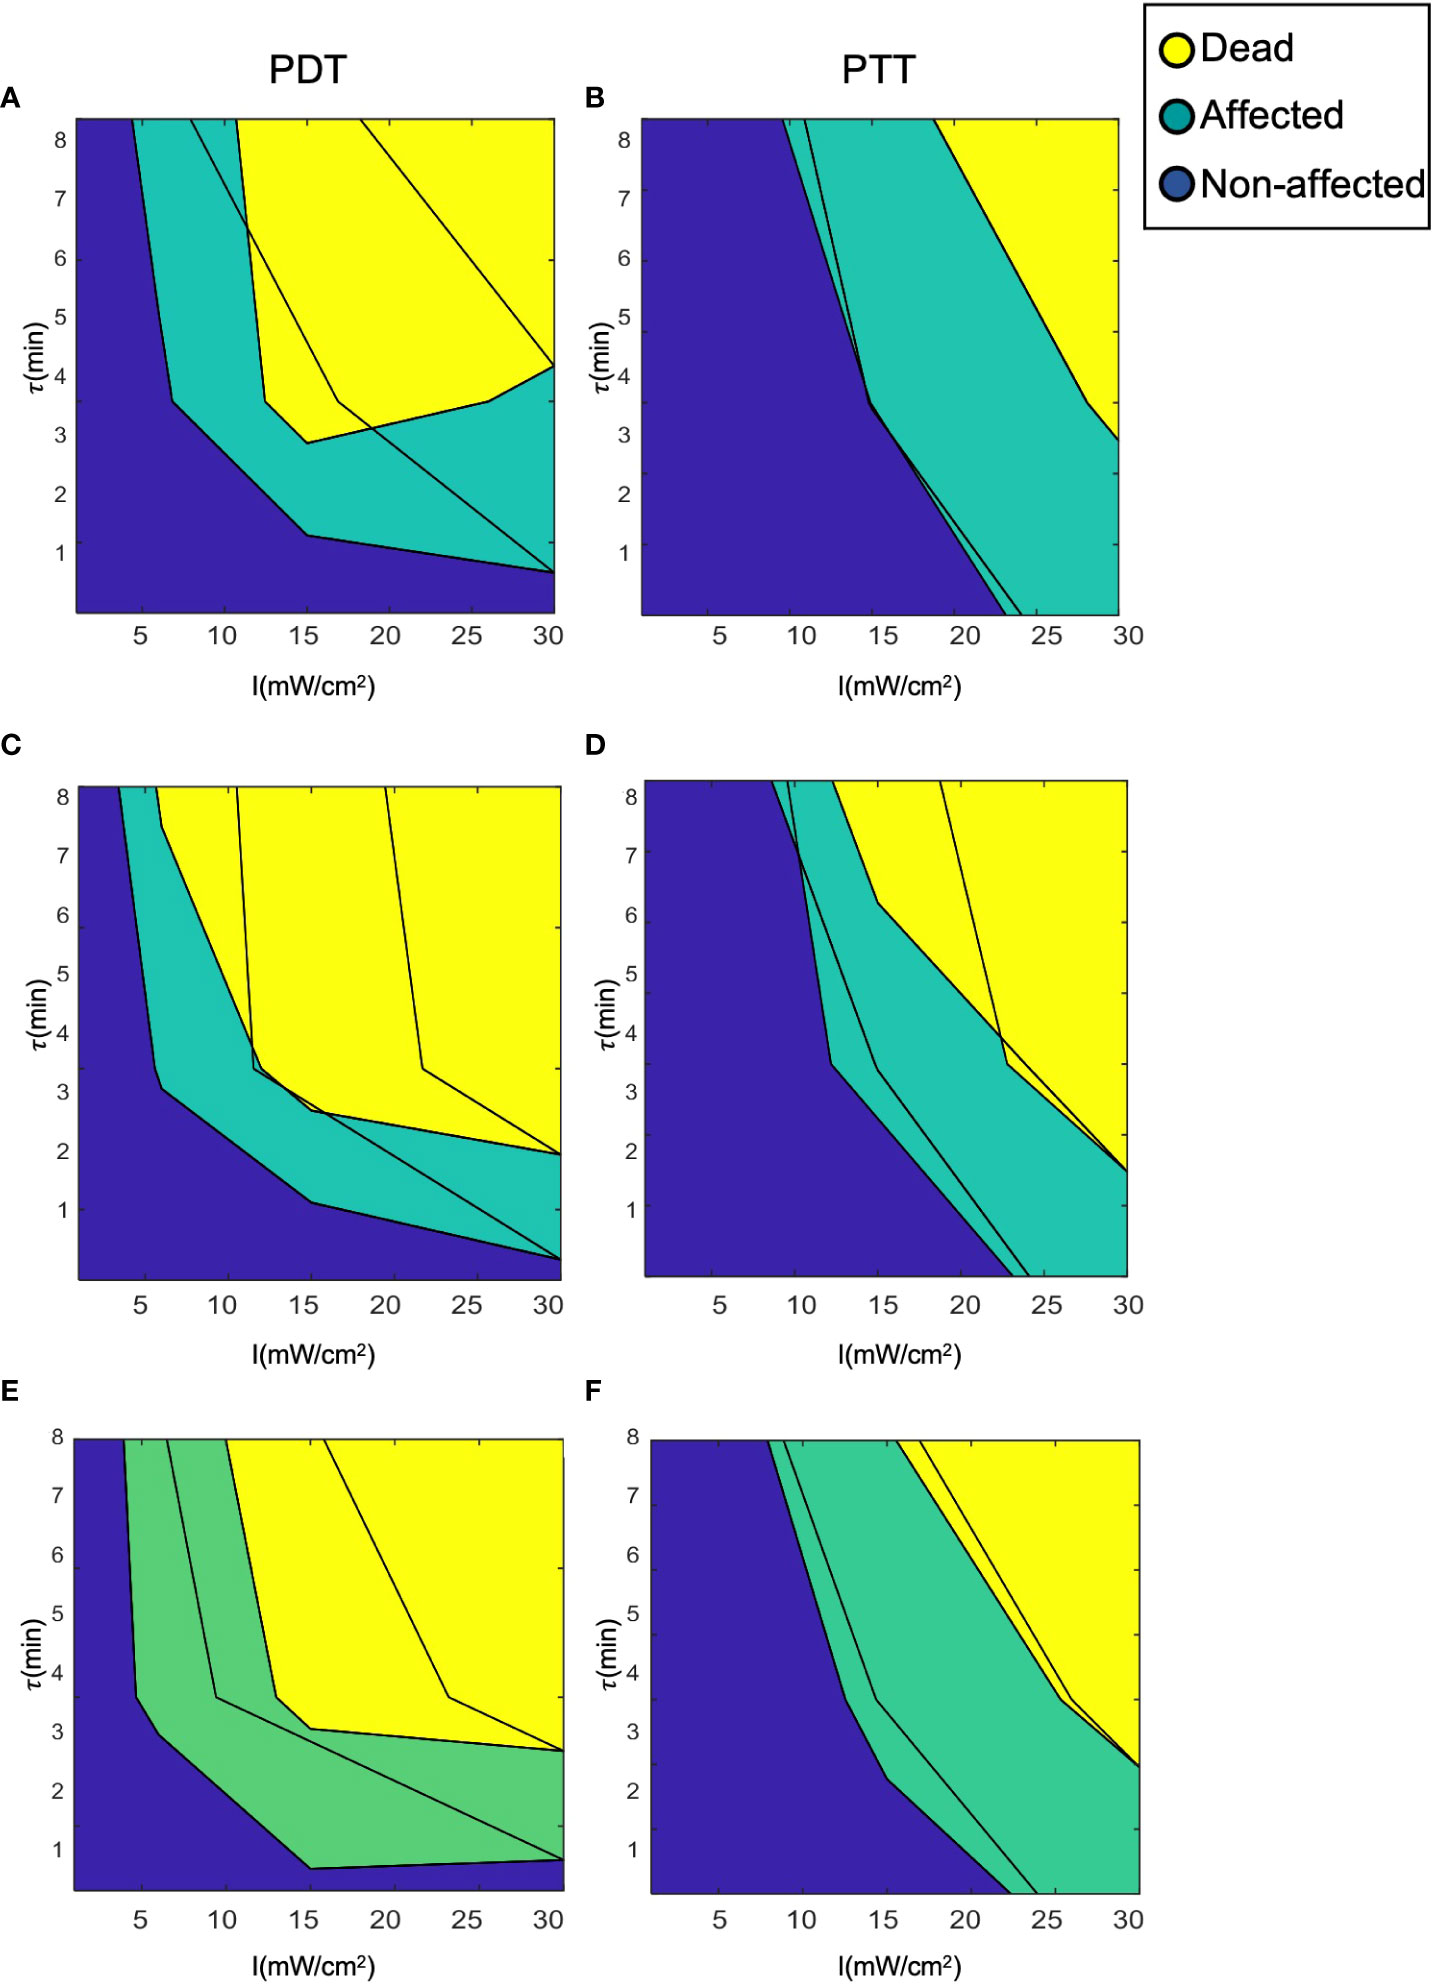
Figure 9 Clustering of cells into the three clinical classes (dead, affected, and unaffected). (A, B) LOWESS regression, (C, D) interpolation, (E, F) analytical function.
Combining multiple cancer treatments is essential in cancer therapy. The gain from doing so is equal to the relative gain for the application of two consecutive treatments compared with continuation of the first treatment. In this case, we examined identical laser radiation PDT and PTT treatments of 4- and 8 -minute durations for a fair comparison with the results of combined PDT and PTT treatment. Subsequently, we estimated a lower bound for the predicted gain (representing additive treatment gain), , based on estimations of the results of PDT and PTT separately as in (18).
For the first dataset, in which treatment duration was 4 minutes, the cell death rates in the controls were and , and the rate for the combined treatment was . For the second dataset, in which treatment duration was 8 minutes, the corresponding cell death rates were and =81.16±4.75% for the controls, and for the combined treatment.
For the first dataset, PDT and PTT were administered separately for a duration of 4 minutes in each case, and in the combined condition, each was administered for a duration of 2 minutes (25). For the second dataset, each treatment was administered separately for a duration of 8 minutes, and in the combined condition, each was administered for a duration of 4 minutes. In both data sets, the laser radiation intensity was set at 6 and 15 mW/cm2 for PDT and PTT, respectively. The lower bound estimated for the cell death rate is reported for the regression, interpolation, and analytical function models (LB1, LB2, LB3).
The results of the experiment, in terms of mean and standard deviation of the cell death rate, along with the mean values of the estimated lower bounds for the combined treatment, are shown in Figure 10. As expected, we observed a significantly higher cell death rate following the more prolonged treatment. The increase in the efficiency of the treatment under this setup, at the predetermined range of intensities, is greater than the linear response that can be explained by the accumulation effect (27). The lower bounds calculated using each model presume an additive effect; these lower bounds are significantly lower than the experimental results for the lengthier 8- minute treatment in the case of all three treatments (PDT, PTT, and combined). This can be explained by inertial processes that cause cell death, which are not considered in calculating the lower bounds. Using the data for the combined treatment, or alternatively estimating the probability that a given cell will be affected, would be a possible way to achieve a closer estimate of the lower bound. The lower bounds calculated based on an additive effect (assuming there are no affected cells) are more accurate for the short- duration treatment (4 minutes), due to the relatively linearity of the curve in this region. At higher intensities, the bounds are less accurate due to non-linear accumulation of the treatment effect on the cells.
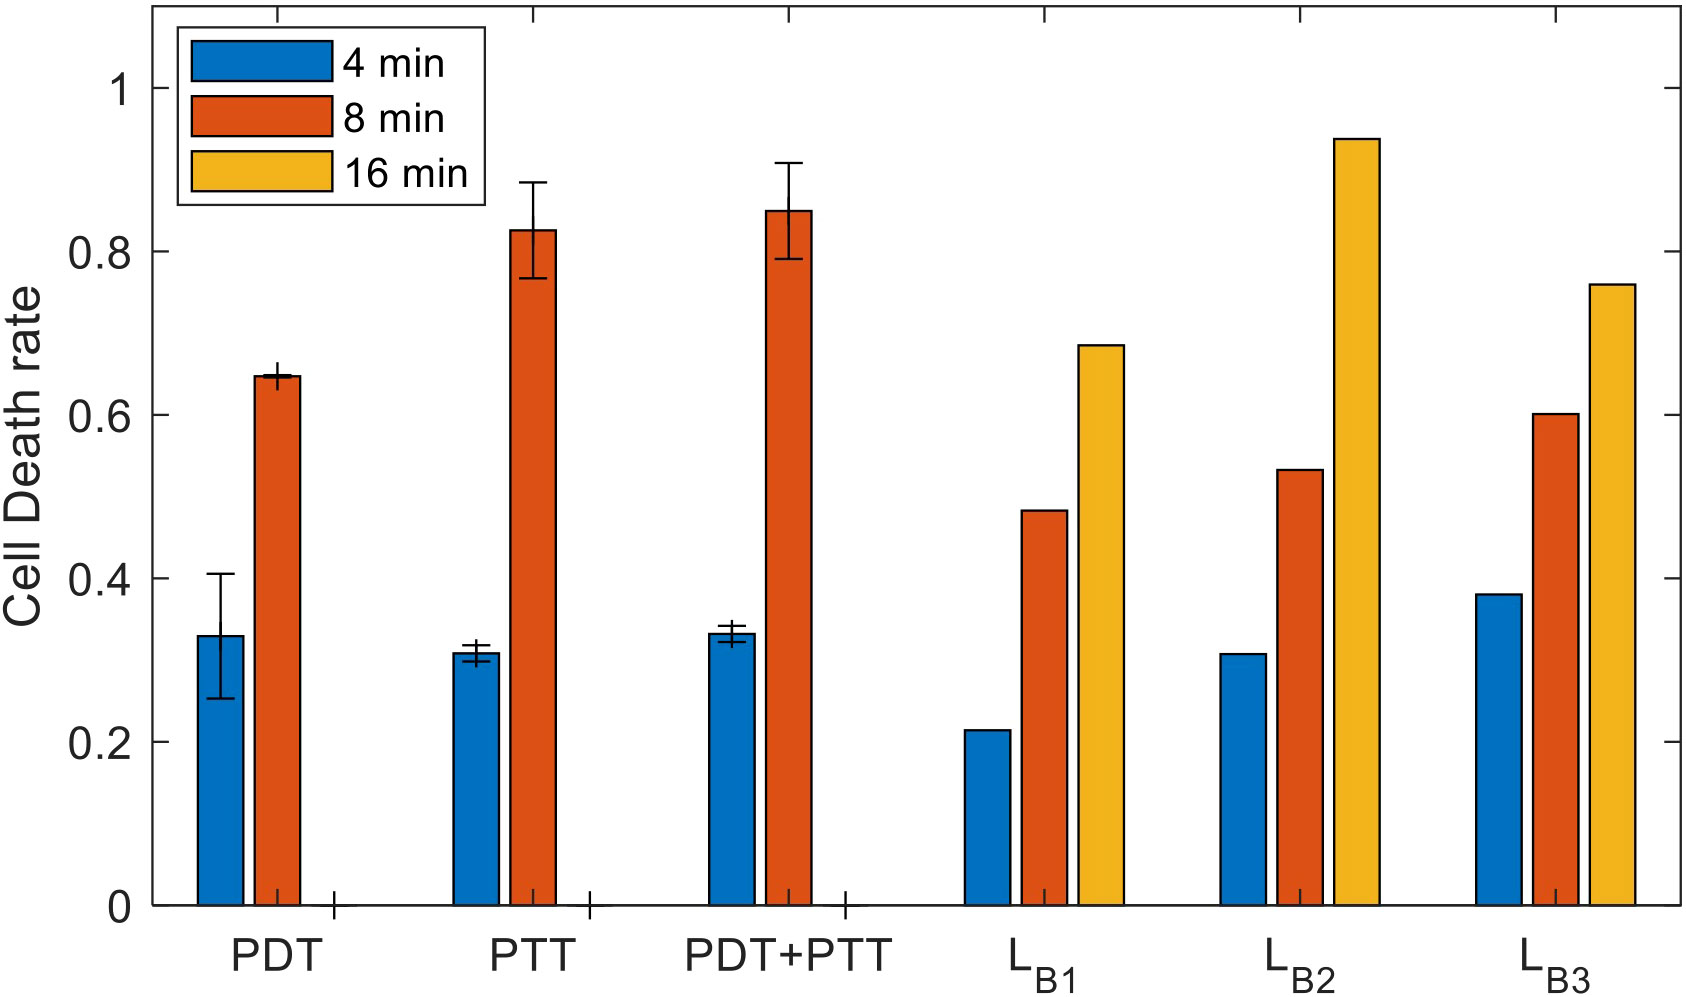
Figure 10 Experimental results for the sets of experiments with treatment durations of 4, 8, and 16 minutes (mean and inter-session standard deviation); estimated lower bounds for the outcome of combined treatment at durations of 4, 8, and 16 minutes.
To determine the type of gain arising from the combined treatment (synergetic, additive, or antagonistic) and to quantify this gain, we substituted the results in (14). The results of doing so indicated gains of SG,4 (PDT) = 14.68±4.9 and SG,4 (PTT) = 47-23 = 14.25±2.1 for the combined treatment compared to PDT and PTT separately; these values represent synergetic gains of 49 and 47 percent, respectively. The results indicated that there was a high synergetic gain for shorter treatment durations. For the longer treatment duration of 8 minutes, the gains were SG,8 (PDT) = 15.77±4.2 and SG,8 (PTT)=0.94±5.4, values which represent a synergetic gain of 23 percent for PDT and 1 percent for PTT.
The results imply that there is a substantial synergetic effect for PDT, at both long and short treatment durations. In contrast, PTT treatment provides only an additive combined gain at long treatment durations. This indicates that, following 4 minutes of PTT treatment, there is no expected difference in outcome between switching to PDT and resuming PTT. This finding can be explained by a high death rate among damaged cells that do not undergo recovery under both the combined and the PTT treatments. The elevated efficiency of the PTT treatment when the NPs are heated to an elevated temperature is close to saturation, causing significant damage to the cell. Thus, damaged cells can be expected to die at similar rates under both treatments. Following this, the influence of the second treatment is restricted to unaffected cells, and is therefore additive.
In this article we provide a framework for a dual cancer treatment combining laser radiation with light- sensitive nanoparticles. After administering in vitro dual phototherapies (PDT and PTT) to SH-SY5Y cells, we modeled the efficiency and selectivity of both treatments. We used NPs that have been shown to be optimized for size and shape, and to be biocompatible. Subsequently, in order to maximize the treatment efficiency, we focused on optimization of the fundamental treatment parameters to identify the minimal laser radiation intensity and treatment duration that can be used to amplify the cancer cell death rate and the overall treatment efficiency.
We constructed several biomedical statistical models and defined three cell state probabilities: affected, unaffected, and dead. These probabilities were used to model the gain achieved by administering multiple consecutive treatments (combined treatment gain). We hypothesize that affected cells respond to subsequent treatment to a greater extent, consequently producing a synergetic effect. Following this analysis, we defined an optimization criterion based on the biomedical model.
We have demonstrated the feasibility of using a computational model and methods for modeling of combined laser radiation and NPs in the context of two new dual treatments (PDT and PTT) and their combination. Since there was no available dataset on which to train our models, we created a data set to solve this issue. Subsequently, to identify the optimal parameters for laser radiation, we constructed three prediction models that can provide predictions for continuous values on the basis of training data: a regression model, an interpolation model, and a model using fitting of an analytical function. We computed the performance of each model using error analysis on the test data. The preliminary results showed that the performance of all three models was sufficient, with death rate error values of 0.09, 0.15, and 0.12 for the regression, interpolation, and analytical function fitting approaches, respectively. However, due to its modest form, the analytical function model has a clinical advantage and can be further used for sensitivity analysis of the effect of the treatment parameters on performance.
In all, this framework constitutes a first step toward a toolkit for medical decision-making that can support the clinician in optimizing the use of separate or combined treatments involving a variety of cancer treatment methods, particularly PDT and PTT.
In the future, we plan to collect more in vitro data, add further treatment setup parameters (alongside radiation duration and intensity), enhance the classification accuracy of the model using deep learning networks, use enhanced in vitro 3D models to predict the effects of treatment under conditions more similar to an in vivo setting, and eventually apply our computational model to predict the efficiency of other cancer treatment combinations and examine its performance based on experiments involving clinical data.
The raw data supporting the conclusions of this article will be made available by the authors, without undue reservation.
Conceptualization, EV, GB and OS; methodology, EV, GB and OS; software, EV and GB; validation, EV and GB; formal analysis, EV, and GB; investigation, data curation, EV, and GB; writing—original draft preparation, EV, GB, and OS; writing—review and editing, EV, GB, and OS; supervision, OS; project administration, OS; funding acquisition, OS. All authors have read and agreed to the published version of the manuscript.
We thank the Bar-Ilan Institute of Nanotechnology and Advanced Materials for the use of its facilities. OS thanks the Ministry of Science and Technology for partial support (#3-15629, #3-15705). EV thanks the Bar-Ilan Institute of Nanotechnology and Advanced Materials for receipt of its scholarship for excellent Ph.D. students. We would like to thank Dr. Hagit Hauschner for the assistance with cell death analysis, and Ethan Treihaft for technical assistance with data collection, for the initial presentation of the raw data, and for reviewing the literature on synergetic effects. Illustrations were created using BioRender.com.
The authors declare that the research was conducted in the absence of any commercial or financial relationships that could be construed as a potential conflict of interest.
All claims expressed in this article are solely those of the authors and do not necessarily represent those of their affiliated organizations, or those of the publisher, the editors and the reviewers. Any product that may be evaluated in this article, or claim that may be made by its manufacturer, is not guaranteed or endorsed by the publisher.
1. Bray F, Laversanne M, Weiderpass E, Soerjomataram I. The ever-increasing importance of cancer as a leading cause of premature death worldwide. Cancer (2021) 127(16):3029–30. doi: 10.1002/cncr.33587
2. Baskar R, Lee KA, Yeo R, Yeoh K-W. Cancer and radiation therapy: Current advances and future directions. Int J Med Sci (2012) 9(3):193–9. doi: 10.7150/ijms.3635
3. Chabner BA, Roberts TG. Timeline: Chemotherapy and the war on cancer. Nat Rev Cancer (2005) 5(1):65–72. doi: 10.1038/nrc1529
4. Yang Y. Cancer immunotherapy: Harnessing the immune system to battle cancer. J Clin Invest (2015) 125(9):3335–7. doi: 10.1172/JCI83871
5. Alexis F, Rhee J-W, Richie JP, Radovic-Moreno AF, Langer R, Farokhzad OC. New frontiers in nanotechnology for cancer treatment. Urol. Oncol (2008) 26(1):74–85. doi: 10.1016/j.urolonc.2007.03.017
6. Warren JL, Yabroff KR, Meekins A, Topor M, Lamont EB, Brown ML. Evaluation of trends in the cost of initial cancer treatment. J Natl Cancer Instit (2008) 100(12):888–97. doi: 10.1093/jnci/djn175
7. Bentzen SM. Preventing or reducing late side effects of radiation therapy: radiobiology meets molecular pathology. Nat Rev Cancer (2006) 6(9):702–13. doi: 10.1038/nrc1950
8. De Ruysscher D, Niedermann G, Burnet NG, Siva S, Lee AWM, Hegi-Johnson F. ‘Radiotherapy toxicity.’, nature reviews. Dis Primers (2019) 5(1):13. doi: 10.1038/s41572-019-0064-5
9. Song G, Cheng L, Chao Y, Yang K, Liu Z. Emerging nanotechnology and advanced materials for cancer radiation therapy. Adv Mater (2017) 29(32):1700996. doi: 10.1002/adma.201700996
10. Bergs JWJ, Wacker MG, Hehlgans S, Piiper A, Multhoff G, Rödel C, et al. The role of recent nanotechnology in enhancing the efficacy of radiation therapy. Biochim Biophys Acta (2015) 1856(1):130–43. doi: 10.1016/j.bbcan.2015.06.008
11. Brannon-Peppas L, Blanchette JO. Nanoparticle and targeted systems for cancer therapy. Adv Drug Deliv Rev (2004) 56(11):1649–59. doi: 10.1016/j.addr.2004.02.014
12. Foote CS. Definition of type I and type II photosensitized oxidation. Photochem Photobiol (1991) 54(5):659. doi: 10.1111/j.1751-1097.1991.tb02071.x
13. Allison RR, Moghissi K. Photodynamic therapy (PDT): PDT mechanisms. Clin Endoscopy (2013) 46(1):24–9. doi: 10.5946/ce.2013.46.1.24
14. Haimov E, Weitman H, Polani S, Schori H, Zitoun D, Shefi O. Meso-Tetrahydroxyphenylchlorin-Conjugated gold nanoparticles as a tool to improve photodynamic therapy. ACS Appl Mater Interfaces (2018) 10(3):2319–27. doi: 10.1021/acsami.7b16455
15. Li X, Lovell JF, Yoon J, Chen X. Clinical development and potential of photothermal and photodynamic therapies for cancer. Nat Rev Clin Oncol (2020) 17:657–74. doi: 10.1038/s41571-020-0410-2
16. Liu Y, Crawford BM, Vo-Dinh T. Gold nanoparticles-mediated photothermal therapy and immunotherapy. Immunotherapy (2018) 10(13). doi: 10.2217/imt-2018-0029
17. Min C, Zou X, Yang Q, Liao L, Zhou G, Liu L. Near-infrared light responsive polymeric nanocomposites for cancer therapy. Curr Topics Med (2017) 17(16):1805–14. doi: 10.2174/1568026617666161122120153
18. Deo RC. Machine learning in medicine. Circulation (2015) 132(20):1920–30. doi: 10.1161/CIRCULATIONAHA.115.001593
19. Benov L. Photodynamic therapy: current status and future directions. Med Princ Pract (2015) 24 Suppl 1:14–28. doi: 10.1159/000362416
20. Fang RH, Hu C-MJ, Luk BT, Gao W, Copp JA, Tai Y, et al. Cancer cell membrane-coated nanoparticles for anticancer vaccination and drug delivery. Nano Lett (2014) 14(4):2181–8. doi: 10.1021/nl500618u
21. Liu T, Wang C, Cui W, Gong H, Liang C, Shi X, et al. Combined photothermal and photodynamic therapy delivered by PEGylated MoS2nanosheets. Nanoscale (2014) 6:11219–25. doi: 10.1039/c4nr03753g
22. Zhao ZX, Huang YZ, Shi SG, Tang SH, Li DH, Chen XL. Cancer therapy improvement with mesoporous silica nanoparticles combining photodynamic and photothermal therapy. Nanotechnology (2014) 25(28):285701. doi: 10.1088/0957-4484/25/28/285701
23. Zhang D, Wu M, Zeng Y, Wu L, Wang Q, Han X, et al. Chlorin e6 conjugated poly(dopamine) nanospheres as PDT/PTT dual-modal therapeutic agents for enhanced cancer therapy. ACS Appl Mater Interfaces (2015) 7(15):8176–87. doi: 10.1021/acsami.5b01027
24. Yuan H, Ma Q, Cui H, Liu G, Zhao X, Li W, et al. How can synergism of traditional medicines benefit from network pharmacology? Molecules (2017) 22(7):1135. doi: 10.3390/molecules22071135
25. Varon E, Blumrosen G, Sinvani M, Haimov E, Polani S, Natan M, et al. An engineered nanocomplex with photodynamic and photothermal synergistic properties for cancer treatment. Int J Mol Sci (2022) 23(4):2286. doi: 10.3390/ijms23042286
26. Lambin P, van Stiphout RGPM, Starmans MHW, Rios-Velazquez E, Nalbantov G, Aerts HJWL, et al. Predicting outcomes in radiation oncology–multifactorial decision support systems. Nat Rev Clin Oncol (2013) 10(1):27–40. doi: 10.1038/nrclinonc.2012.196
28. Esposito M, Villaggi E, Bresciani S, Cilla S, Falco MD, Garibaldi C, et al. Estimating dose delivery accuracy in stereotactic body radiation therapy: A review of in-vivo measurement methods. Radiother Oncol (2020) 149:158–67. doi: 10.1016/j.radonc.2020.05.014
29. Grégoire V, Guckenberger M, Haustermans K, Lagendijk JJW, Ménard C, Pötter R, et al. Image guidance in radiation therapy for better cure of cancer. Mol Oncol (2020) 14(7):1470–91. doi: 10.1002/1878-0261.12751
30. Verschoor CP, Lelic A, Bramson JL, Bowdish DME. An introduction to automated flow cytometry gating tools and their implementation. Front Immunol (2015) 6:380. doi: 10.3389/fimmu.2015.00380
31. Shafirstein G, Bellnier DA, Oakley E, Hamilton S, Habitzruther M, Tworek L, et al. Irradiance controls photodynamic efficacy and tissue heating in experimental tumours: implication for interstitial PDT of locally advanced cancer. Br J Cancer (2018) 119(10):1191–9. doi: 10.1038/s41416-018-0210-y
32. Blumrosen G, Porrat D, Rubinsky B, Dolev D. Exploitation of electromagnetic radiation properties for medical diagnostic. In: 2011 IEEE international conference on microwaves, communications, antennas and electronic systems (COMCAS 2011). IEEE (2011). p. 1–7. doi: 10.1109/COMCAS.2011.6105853
33. Brizhik L, Cruzeiro-Hansson L, Eremko A. Electromagnetic radiation influence on nonlinear charge and energy transport in biosystems. J Biol Phys (1999) 24(2–4):223–32. doi: 10.1023/A:1005121820566
34. Pradhan A, Pal P, Durocher G, Villeneuve L, Balassy A, Babai F, et al. Steady state and time-resolved fluorescence properties of metastatic and non-metastatic malignant cells from different species. J Photochem Photobiol B Biol (1995) 31(3):101–12. doi: 10.1016/1011-1344(95)07178-4
35. Raj S, Khurana S, Choudhari R, Kesari KK, Kamal MA, Garg N, et al. Specific targeting cancer cells with nanoparticles and drug delivery in cancer therapy. Semin Cancer Biol (2021) 69:166–77. doi: 10.1016/j.semcancer.2019.11.002
36. Ilovitsh A, Polak P, Zalevsky Z, Shefi O. Selective inactivation of enzymes conjugated to nanoparticles using tuned laser illumination. Cytometry Part A (2017) 91(8):767–74. doi: 10.1002/cyto.a.23005
37. Marcus M, Smith A, Maswadeh A, Shemesh Z, Zak I, Motiei M, et al. Magnetic targeting of growth factors using iron oxide nanoparticles. Nanomater (Basel Switzerland) (2018) 8(9):707. doi: 10.3390/nano8090707
38. Bhandari C, Guirguis M, Savan NA, Shrivastava N, Oliveira S, Hasan T, et al. What NIR photodynamic activation offers molecular targeted nanomedicines: Perspectives into the conundrum of tumor specificity and selectivity. Nano Today (2021) 36:101052. doi: 10.1016/j.nantod.2020.101052
39. Blumrosen G, Abazari A, Golberg A, Tonner M, Yarmush ML. Efficient procedure and methods to determine critical electroporation parameters. In: 2014 IEEE 27th international symposium on computer-based medical systems. IEEE (2014). p. 314–8. doi: 10.1109/CBMS.2014.18
40. Wolfram J, Zhu M, Yang Y, Shen J, Gentile E, Paolino D, et al. Safety of nanoparticles in medicine. Curr Drug Targets (2015) 16(14):1671–81. doi: 10.2174/1389450115666140804124808
41. Baranes K, Shevach M, Shefi O, Dvir T. Gold nanoparticle-decorated scaffolds promote neuronal differentiation and maturation. Nano Lett (2016) 16(5):2916–20. doi: 10.1021/acs.nanolett.5b04033
42. Hataminia F, Ghanbari H. Predicting the effect of phototherapy method on breast cancer cells by mathematical modeling: UV-IR non-ionization radiation with gold nanoparticles. Nanotoxicology (2020) 14(8):1127–36. doi: 10.1080/17435390.2020.1814441
43. Blumrosen G, Abazari A, Golberg A, Yarmush ML, Toner M. Single-step electrical field strength screening to determine electroporation induced transmembrane transport parameters. Biochim Biophys Acta (2016) 1858(9):2041–9. doi: 10.1016/j.bbamem.2016.05.022
44. Meehan S, Kolyagin GA, Parks D, Youngyunpipatkul J, Herzenberg LA, Walther G, et al. Automated subset identification and characterization pipeline for multidimensional flow and mass cytometry data clustering and visualization. Commun Biol (2019) 2:229. doi: 10.1038/s42003-019-0467-6
45. Toropova AP, Toropov AA, Benfenati E, Korenstein R, Leszczynska D, Leszczynski J. Optimal nano-descriptors as translators of eclectic data into prediction of the cell membrane damage by means of nano metal-oxides. Environ Sci pollut Res Int (2015) 22(1):745–57. doi: 10.1007/s11356-014-3566-4
46. Pattarone G, Acion L, Simian M, Mertelsmann R, Follo M, Iarussi E. Learning deep features for dead and living breast cancer cell classification without staining. Sci Rep (2021) 11(1):10304. doi: 10.1038/s41598-021-89895-w
47. Huber PE, Bischof M, Jenne J, Heiland S, Peschke P, Saffrich R, et al. Trimodal cancer treatment: beneficial effects of combined antiangiogenesis, radiation, and chemotherapy. Cancer Res (2005) 65(9):3643–55. doi: 10.1158/0008-5472.CAN-04-1668
48. Lorraine J, Vicol P, Duvenaud D. Optimizing millions of hyperparameters by implicit differentiation (2019). Available at: http://arxiv.org/abs/1911.02590.
49. Prabhakar PK, Doble M. Synergistic effect of phytochemicals in combination with hypoglycemic drugs on glucose uptake in myotubes. Phytomedicine (2009) 16(12):1119–26. doi: 10.1016/j.phymed.2009.05.021
50. Yin Z, Deng Z, Zhao W, Cao Z. Searching synergistic dose combinations for anticancer drugs. Front Pharmacol (2018) 9:535. doi: 10.3389/fphar.2018.00535
51. Cheung M, Campbell JJ, Whitby L, Thomas RJ, Braybrook J, Petzing J. Current trends in flow cytometry automated data analysis software. Cytometry Part: A (2021) 99(10):1007–21. doi: 10.1002/cyto.a.24320
52. Kern SE, Xie G, White JL, Egan TD. A response surface analysis of propofol-remifentanil pharmacodynamic interaction in volunteers. Anesthesiology (2004) 100(6):1373–81. doi: 10.1097/00000542-200406000-00007
53. Galluzzi L, Vitale I, Aaronson SA, Abrams JM, Adam D, Agostinis P. Molecular mechanisms of cell death: recommendations of the nomenclature committee on cell death 2018. Cell Death differ. (2018) 25(3):486–541. doi: 10.1038/s41418-017-0012-4
Keywords: cancer, radiation, prediction medicine, biomedical model development, PDT (photodynamic therapy), PTT (photothermal therapy), personalized medicine
Citation: Varon E, Blumrosen G and Shefi O (2023) A predictive model for personalization of nanotechnology-based phototherapy in cancer treatment. Front. Oncol. 12:1037419. doi: 10.3389/fonc.2022.1037419
Received: 11 September 2022; Accepted: 21 November 2022;
Published: 04 January 2023.
Edited by:
Valdir Carlos Colussi, University Hospitals Cleveland Medical Center, United StatesReviewed by:
Carine Michiels, University of Namur, BelgiumCopyright © 2023 Varon, Blumrosen and Shefi. This is an open-access article distributed under the terms of the Creative Commons Attribution License (CC BY). The use, distribution or reproduction in other forums is permitted, provided the original author(s) and the copyright owner(s) are credited and that the original publication in this journal is cited, in accordance with accepted academic practice. No use, distribution or reproduction is permitted which does not comply with these terms.
*Correspondence: Orit Shefi, b3JpdC5zaGVmaUBiaXUuYWMuaWw=
†These authors have contributed equally to this work and share first authorship
Disclaimer: All claims expressed in this article are solely those of the authors and do not necessarily represent those of their affiliated organizations, or those of the publisher, the editors and the reviewers. Any product that may be evaluated in this article or claim that may be made by its manufacturer is not guaranteed or endorsed by the publisher.
Research integrity at Frontiers
Learn more about the work of our research integrity team to safeguard the quality of each article we publish.