 Quan-Hao He
 Hao Tan
 Fang-Tong Liao1
 Yi-Neng Zheng
 Fa-Jin Lv
 Ming-Zhao Xiao
95% of researchers rate our articles as excellent or good
Learn more about the work of our research integrity team to safeguard the quality of each article we publish.
Find out more
ORIGINAL RESEARCH article
Front. Oncol. , 25 October 2022
Sec. Cancer Imaging and Image-directed Interventions
Volume 12 - 2022 | https://doi.org/10.3389/fonc.2022.1028577
This article is part of the Research Topic Cancer Imaging Techniques to Distinguish Benign and Malignant Tumors View all 13 articles
Using nephrographic phase CT images combined with pathology diagnosis, we aim to develop and validate a fusion feature-based stacking ensemble machine learning model to distinguish malignant renal neoplasms from cystic renal lesions (CRLs). This retrospective research includes 166 individuals with CRLs for model training and 47 individuals with CRLs in another institution for model testing. Histopathology results are adopted as diagnosis criterion. Nephrographic phase CT scans are selected to build the fusion feature-based machine learning algorithms. The pretrained 3D-ResNet50 CNN model and radiomics methods are selected to extract deep features and radiomics features, respectively. Fivefold cross-validated least absolute shrinkage and selection operator (LASSO) regression methods are adopted to identify the most discriminative candidate features in the development cohort. Intraclass correlation coefficients and interclass correlation coefficients are employed to evaluate feature’s reproducibility. Pearson correlation coefficients for normal distribution features and Spearman’s rank correlation coefficients for non-normal distribution features are used to eliminate redundant features. After that, stacking ensemble machine learning models are developed in the training cohort. The area under the receiver operator characteristic curve (ROC), calibration curve, and decision curve analysis (DCA) are adopted in the testing cohort to evaluate the performance of each model. The stacking ensemble machine learning algorithm reached excellent diagnostic performance in the testing dataset. The calibration plot shows good stability when using the stacking ensemble model. Net benefits presented by DCA are higher than the Bosniak 2019 version classification when employing any machine learning algorithm. The fusion feature-based machine learning algorithm accurately distinguishes malignant renal neoplasms from CRLs, which outperformed the Bosniak 2019 version classification, and proves to be more applicable for clinical decision-making.
The detection rate of cystic renal lesions (CRLs) is increasing rapidly due to the growing use of computed tomography (CT). However, a considerable number of CRLs are simple renal cysts or benign cystic renal neoplasms according to histopathologic results after surgery; only a proportion of CRLs are malignant renal neoplasms. Cystic renal neoplasms refer to a diverse category of kidney tumors according to the WHO kidney tumor classification, which have a wide range of biological profiles, and the necessity of early surgical treatment for malignant CRL cannot be overstated (1). Since the components of CRL must be identified correctly in order to determine the appropriate treatment strategies, CT imaging is routinely used to distinguish CRLs. Meanwhile, CRLs are difficult to diagnose and manage especially in the early stage as they show a complex pattern in CT images including thickness of septation, enhancement of the mural nodule, and calcifications (2). In an attempt to identify malignant CRL at early stage, standardize the terminology explaining complicated renal cysts, and provide classification standards for stratifying surgically required renal lesions, the Bosniak classification system was created (3). In the 2019 version of the Bosniak classification system, more discriminative and quantitative criteria were introduced to improve the specificity in identifying higher-risk CRL categories and explicit detailed meanings about key terms to promote agreement and consistency among different readers. Based on the updated Bosniak classification, one or more enhancing nodules in CRL with obtuse margins (more than 4 mm) or with acute margins represent malignant renal neoplasms. Thickened wall or septa with enhancement in CRL also suggests the possibility of malignancy (4). However, according to the Bosniak classification, these high-risk CRL (IIF, III, and IV) could still be benign renal cysts rather than malignant neoplasms. Inaccurate treatment and related diagnostic errors caused by the misapplication of Bosniak classification may increase excessive medical care following undesirable outcomes including renal function impairment, re-operation, and neoplastic transplantation (5, 6). It has been shown that the diagnostic performances of the Bosniak 2019 classification criteria do not improve considerably compared with the previous version. A large number of previous Class III lesions will be reclassified as IIF according to the 2019 Bosniak version, resulting in decreased sensitivity (7, 8). The majority of Bosniak I and II lesions are benign renal cysts and Bosniak IIF, III, and IV lesions are more likely to be renal neoplasms. Approximately 10%–20% of Bosniak IIF lesions, 50% of Bosniak III lesions, and 90% of Bosniak IV lesions are considered to be renal neoplasms according to the latest research (9). To increase the diagnosis sensitivity and overcome the limits of biased visual image assessment, quantitative image analysis approaches using machine learning techniques also known as radiomics have gained popularity in recent years (10). In this study, we aim to develop and validate a stacking ensemble-based machine learning model using deep learning and radiomics features to stratify malignant cystic renal neoplasm more precisely.
In this retrospective study, data originated from abdominal CT scans or dedicated CT urography (CTU) scans in two separate institutions comprising unenhanced phases, corticomedullary phases, and nephrographic phases (Vue PACS, Carestream Health Inc & General Electric Advantage Workstation). Ethics committees in both institutions approved this retrospective investigation. Candidate participants included those with renal cysts larger than 1 cm, those with no surgery history (renal needle biopsy, nephrolithotomy, nephrectomy, or partial nephrectomy), those without conditions linked to multiple renal cysts (polycystic disease, Von Hippel–Lindau syndrome, or autosomal dominant polycystic kidney disease), and those with less than 25% solid portion in cystic lesions. Each individual in this study could only include verified cystic renal masses based on the final pathology findings, ensuring a realistic and reliable model’s presentation. The detailed selection process and the pathological results of two cohorts are displayed in Figure 1.
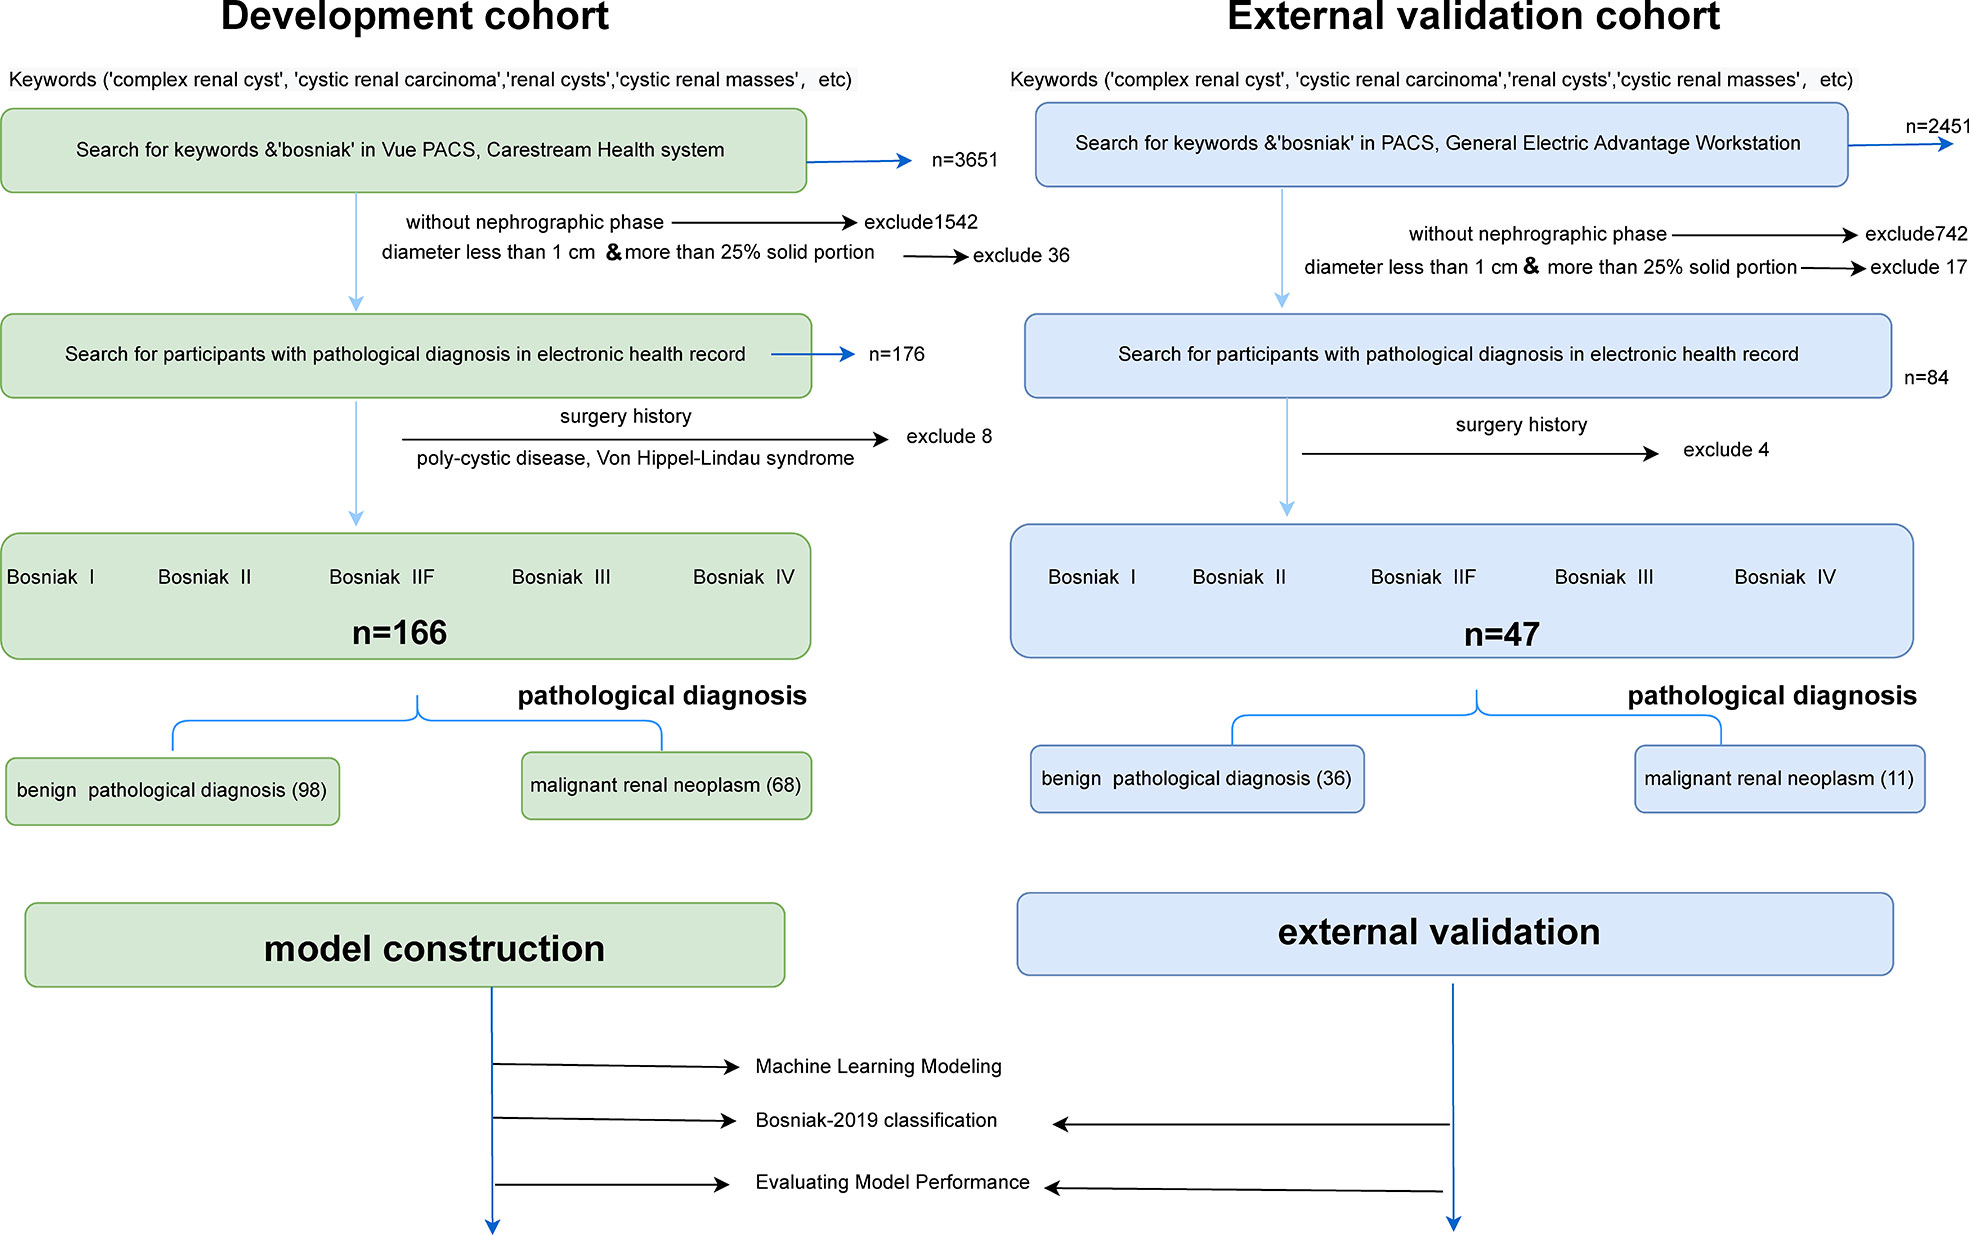
Figure 1 Flowchart illustrating how the cystic renal masses were enrolled and the distribution of pathology results in the final datasets. Detailed inclusion and exclusion criteria are also displayed in the flowchart. CRLs were classified as benign or malignant CRL based on pathological findings. After that, training datasets were applied to build machine learning models, and testing datasets were adopted to reclassify cystic renal masses based on the Bosniak 2019 version and assess model performance.
For extracting handcrafted radiomics features, radiomics feature class can be divided into three groups (1): first-order statistics, (2) shape features, and (3) second-order features. The image type of radiomics features can be divided into three groups: (1) original, (2) log, and (3) wavelet. Using the standard sample parameters setting provided in the official Pyradiomics YAML file, we extracted 1,231 handcrafted radiomics features in each individual.
For extracting deep learning features, we defined a 3D-cropbox containing CRL area. The 3D-cropbox’s width and length match the maximum cross-section area of the CRL, while its height matches the dimensions comprising the CRL area. In the 3D-cropbox, the area outside the ROI will be filled with black. After CRL regions have been segmented, the informative slices (the consecutive axial slices containing the full CRL area) will be cropped and resized to 14 mm * 128 mm * 128 mm (14-layer CT scans, default Voxel spacing is 1mm). The preprocessed images will be selected as the input of the convolutional neural network (CNN) model with pretrained weights. Deep learning features in each individual originated from the preprocessed CT images in the ROI area with 14 consecutive slices. Figure 2 displays the detailed workflow of the 3D-cropbox. By removing the last layer of the pretrained model, disabling gradient updates, and adding a 3D maximum pooling layer, we extracted 2,048 deep learning features in each individual. The detailed 3DResnet50 structure can be found in the Supplementary Table 1.

Figure 2 Detailed workflow of the 3D-cropbox. To assure that deep learning features retrieved from the 3D-cropbox are entirely tumor characteristics, the area outside the ROI will be filled with black.
CT acquisition and reconstruction parameters have a direct impact on handcrafted radiomics features. However, it is impractical to standardize platforms and parameters in advance across different institutions (11). ComBat harmonization, one of the strategies designed to deal with the batch effect, has been widely used in genomics-related research. In this study, ComBat harmonization methods are used to address the difference in extracted radiomics features originating from different image acquisition procedures.
The intraclass correlation coefficients and interclass correlation coefficients are utilized to determine selected features with high reproducibility and robustness in image processing setting parameters. The interclass correlation coefficient results are extracted from two independent readers who randomly selected 25% participants in the enrolled datasets. The intraclass correlation coefficient results are calculated from one reader who randomly outlined the same participants in the enrolled datasets at different times (1 month interval) (12).
The quality control approach for radiomics analysis and deep learning feature extraction consists of five steps: (1) image quality control, (2) region-of-interest (ROI) quality control, (3) feature extraction quality control, (4) feature selection quality control, and (5) machine learning algorithm quality control. We follow the recommendations from the Image Biomarker Standardization Initiative (IBSI) (13). Radiomics quality scores (RQS) are adopted to assess the reliability in this research (14). Detailed quality control methods and RQS calculation results are introduced in the Supplementary File.
All ROIs are achieved through ITK-SNAP (version 3.6.0), and radiomics features extraction are executed using Pyradiomics package (version 3.0.1). The pretrained 3DResnet50 model weights come from 23 medical datasets (including brain MR images and lung CT images), which has been an open source published in Tencent’s Medicalnet project (https://github.com/Tencent/MedicalNet). Deep learning features are extracted after adding a 3D maximum pooling layer in the 3DResnet50 model. After feature extraction, the least absolute shrinkage and selection operator (LASSO) approach is selected to choose the most recognized feature subsets in the training datasets (15, 16). We use the fivefold cross-validation method to select candidate variables. Pearson correlation coefficients for normal distribution and Spearman’s rank correlation coefficients for non-normal distribution are used to identify whether redundant features existed in the primary selected radiomic features. Meanwhile, the intraclass correlation coefficients and interclass correlation coefficients are used to assess the final selected feature’s reproducibility. Fivefold cross-validation Grid Search methods are adopted for parameter tuning in the stacking model construction. Figure 3 depicts the detailed workflow in model construction. Receiver operating characteristic (ROC) curve analysis and accuracy score (ACC) are used to evaluate each model’s performance. DeLong tests are used to evaluate whether the statistical significance of area under the ROC curve (AUC) value exists in four models compared with the Bosniak 2019 version. Calibration curve is adopted to evaluate consistency performances of four models in the testing dataset. Decision curve analysis (DCA) is adopted to assess the clinical practicality. Two-sided p-value less than 0.05 is considered statistically significant. All four machine learning models are implemented using the scikit-learn package, and all statistical analysis and plot drawings are implemented using python (3.9 version) and R software (4.0.5 version).
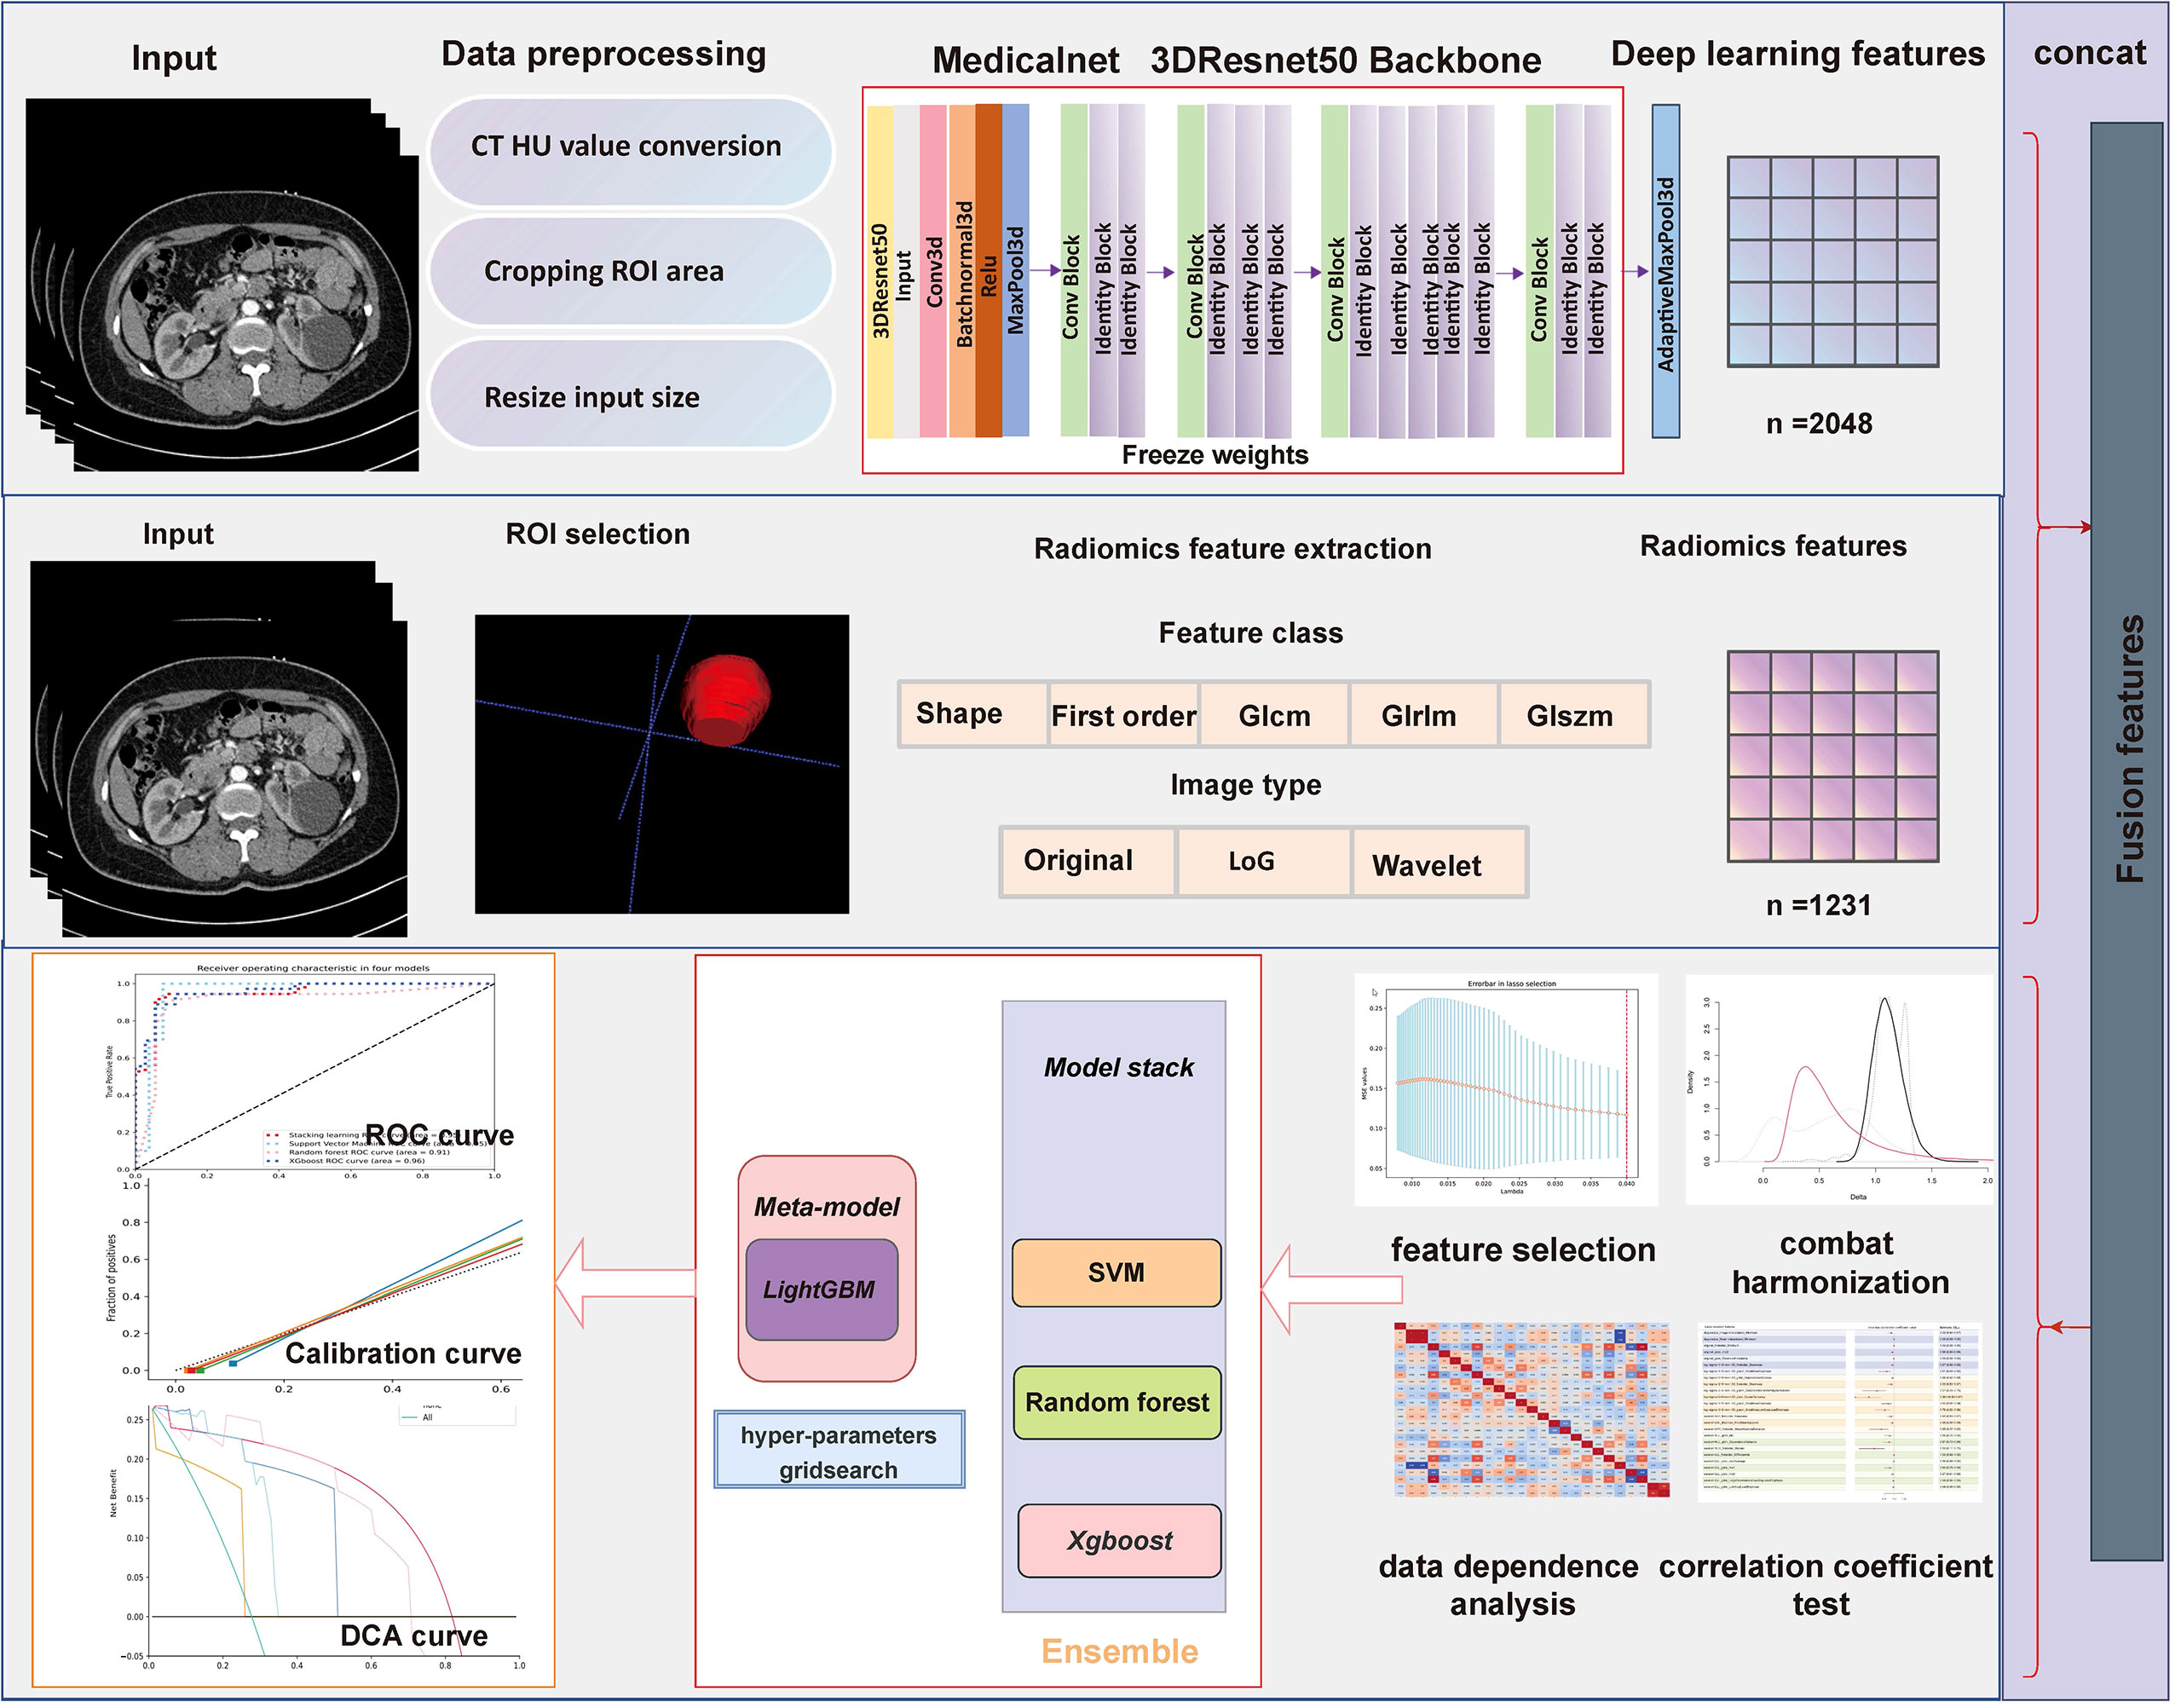
Figure 3 Flowchart presents the detailed procedure in fusion feature-based model construction and assessment methodology.
This retrospective study was approved by both hospital ethics committees, and private information of all patients had been de-identified. Among those participants included in development cohort (The First Affiliated Hospital of Chongqing Medical University), 98 individuals were diagnosed as benign CRL and 68 individuals were diagnosed as malignant CRL. In the pathological results of testing cohort (The Second Affiliated Hospital of Chongqing Medical University), 11 individuals have malignant CRL diagnosed and 36 individuals have benign CRL diagnosed. Detailed characteristic distributions are displayed in Table 1.
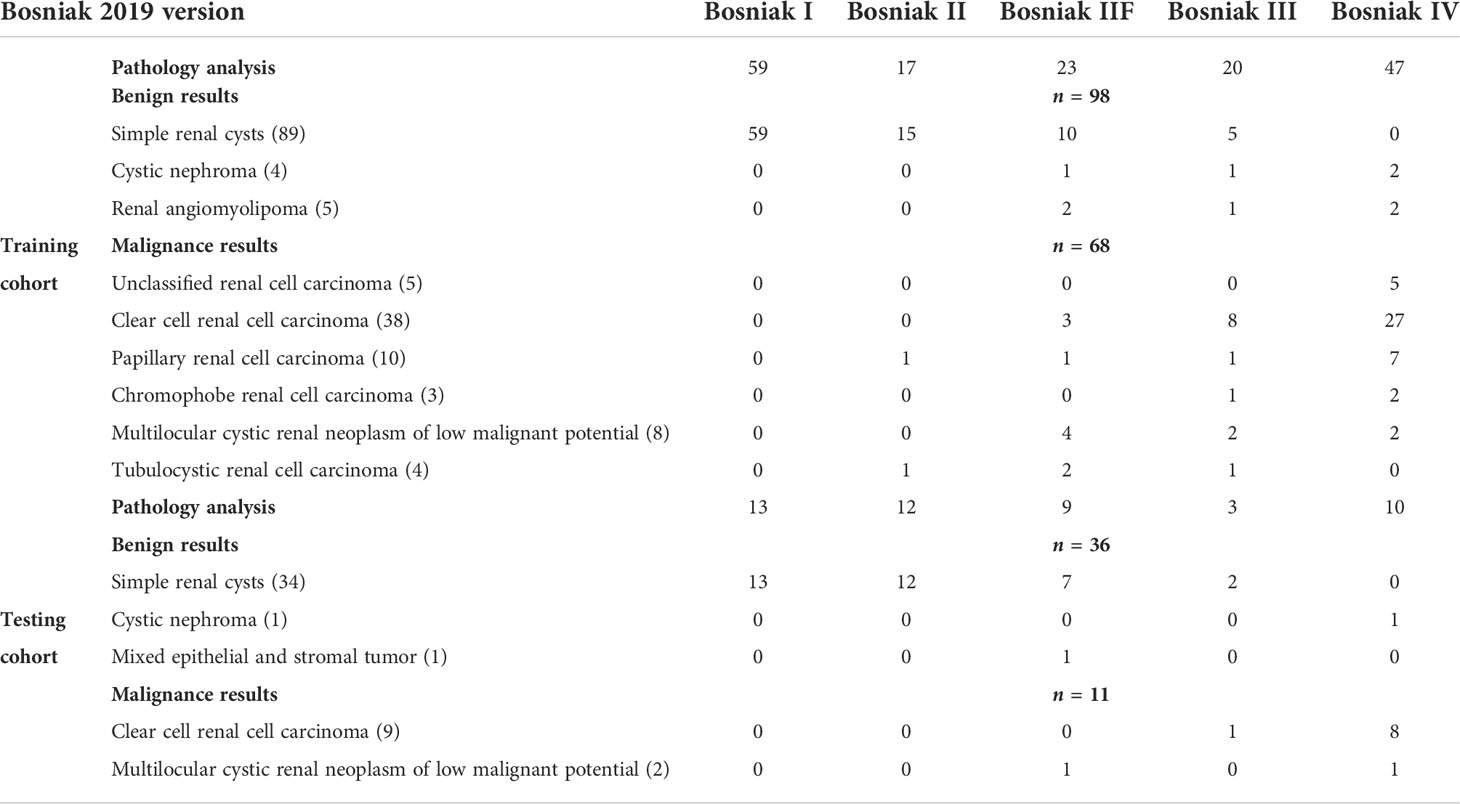
Table 1 Detailed distribution of the Bosniak 2019 classification and pathology results in the training cohort and testing cohort.
Figures 4 and 5 show the detailed performance of base models and stacking ensemble model, respectively. The AUC values in the base models (Random Forest, Support Vector Machine, Xgboost) and the final model all demonstrate good discriminative ability (Figure 4). The p-value in the DeLong test shows that the results of the stacking ensemble radiomics model are statistically significant when compared to the Bosniak classification (p < 0.05). Detailed performance of four machine learning models compared with the Bosniak 2019 version classification in the training and testing cohorts is displayed in Table 2. In Figure 5, all four machine learning models illustrate good calibration performance.
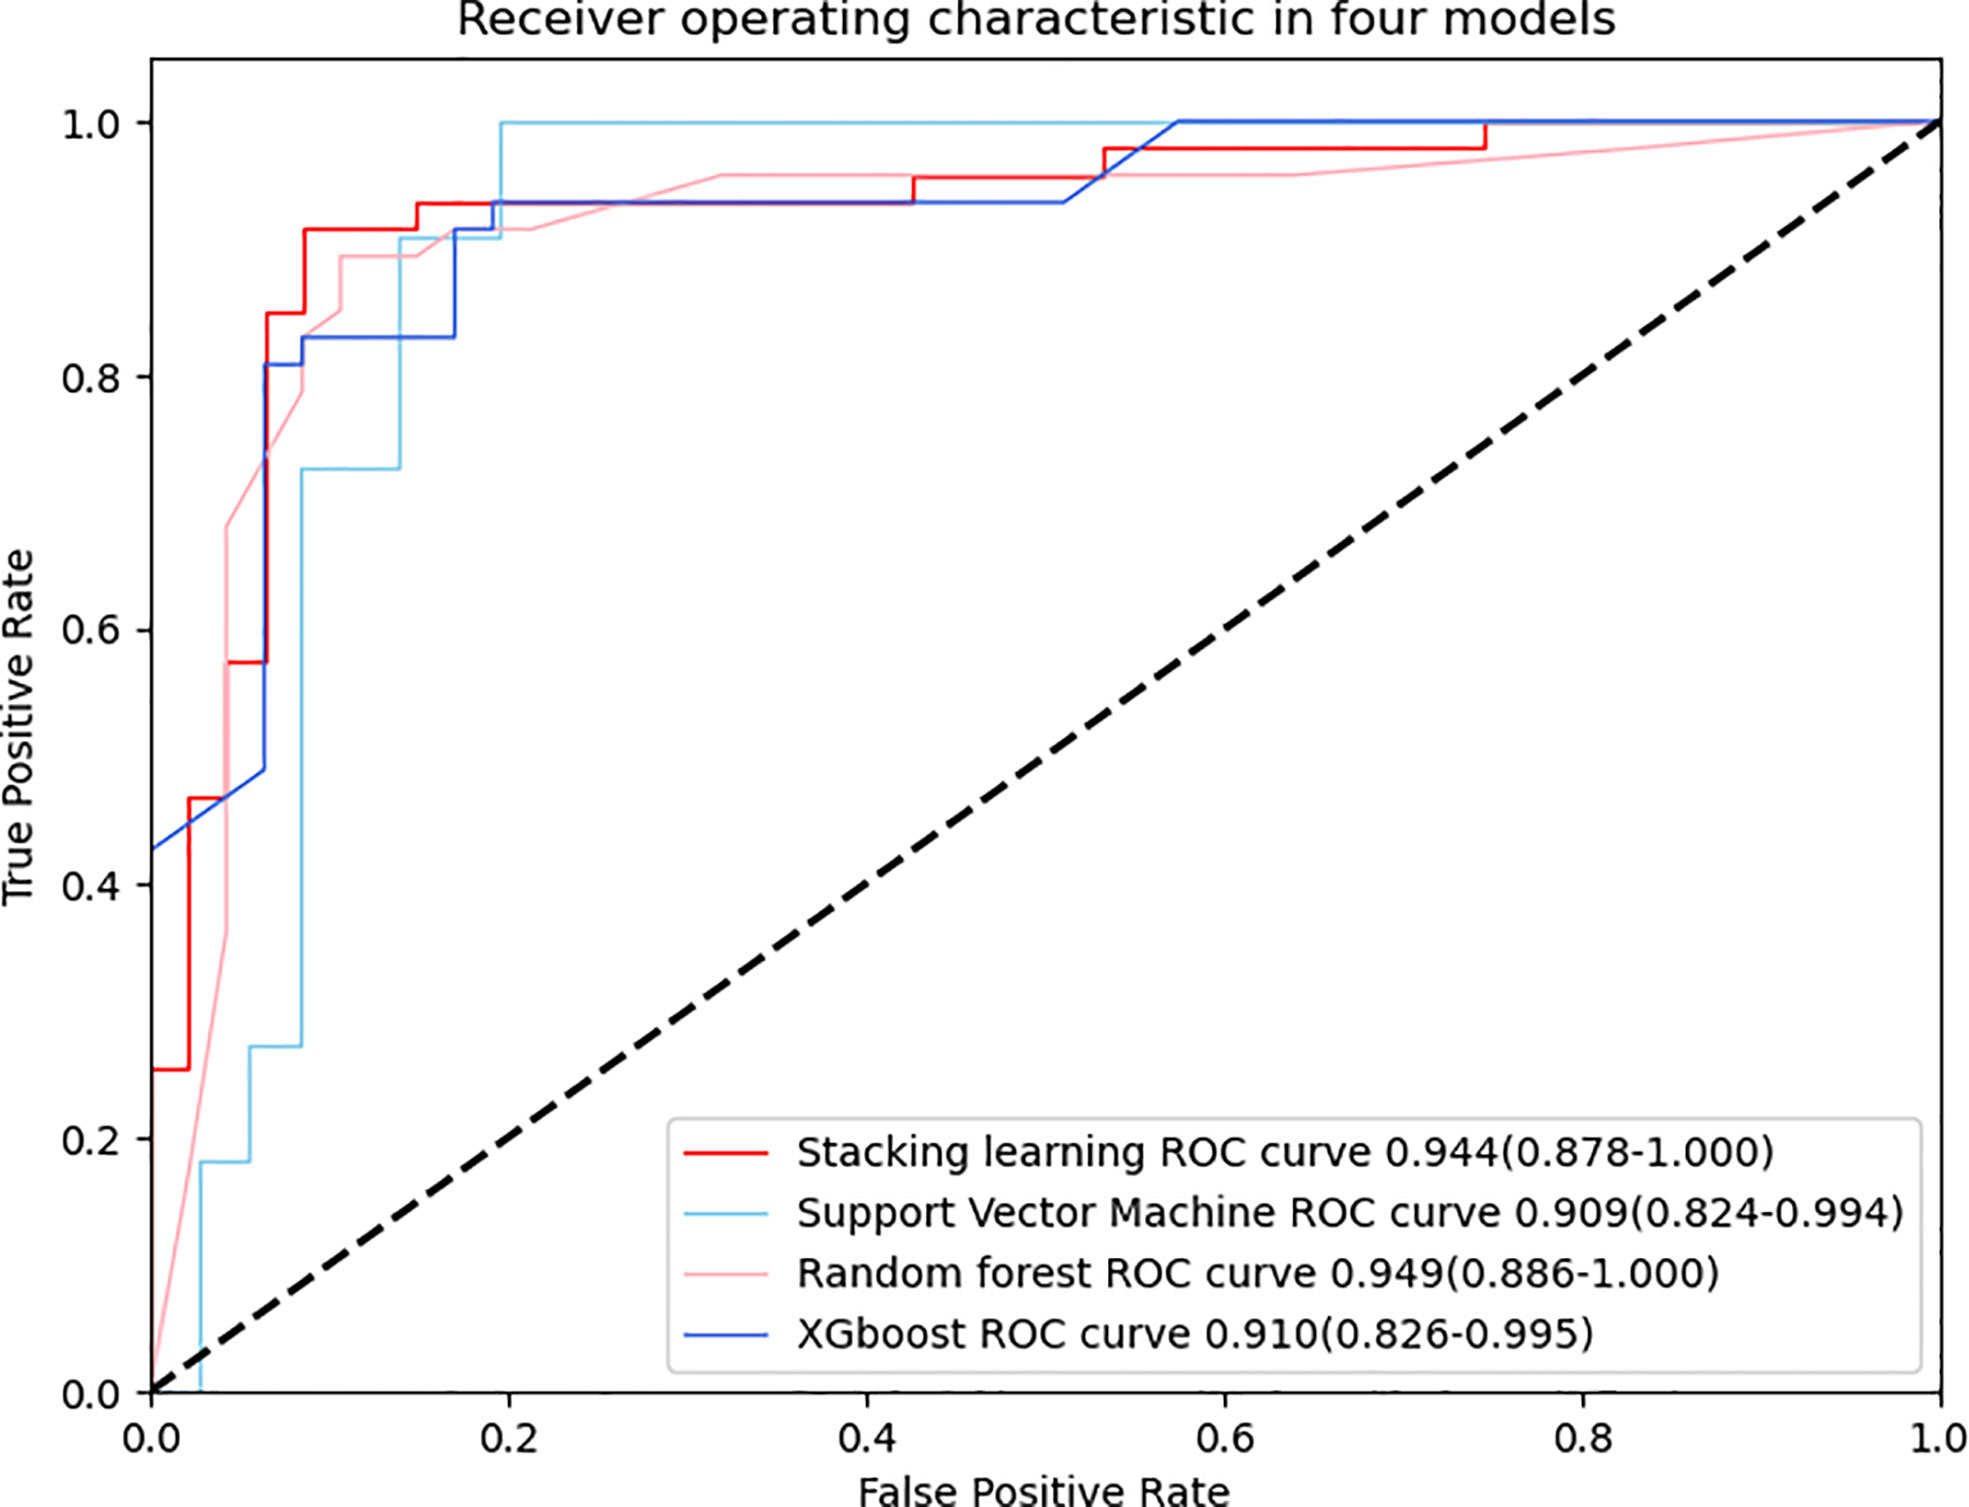
Figure 4 ROC curve is adopted to evaluate the diagnostic efficacy in four models. All four models have similar and excellent performance and detailed AUC values are respectively displayed in the graph, indicating the robust performance of quantitative features after LASSO selection.
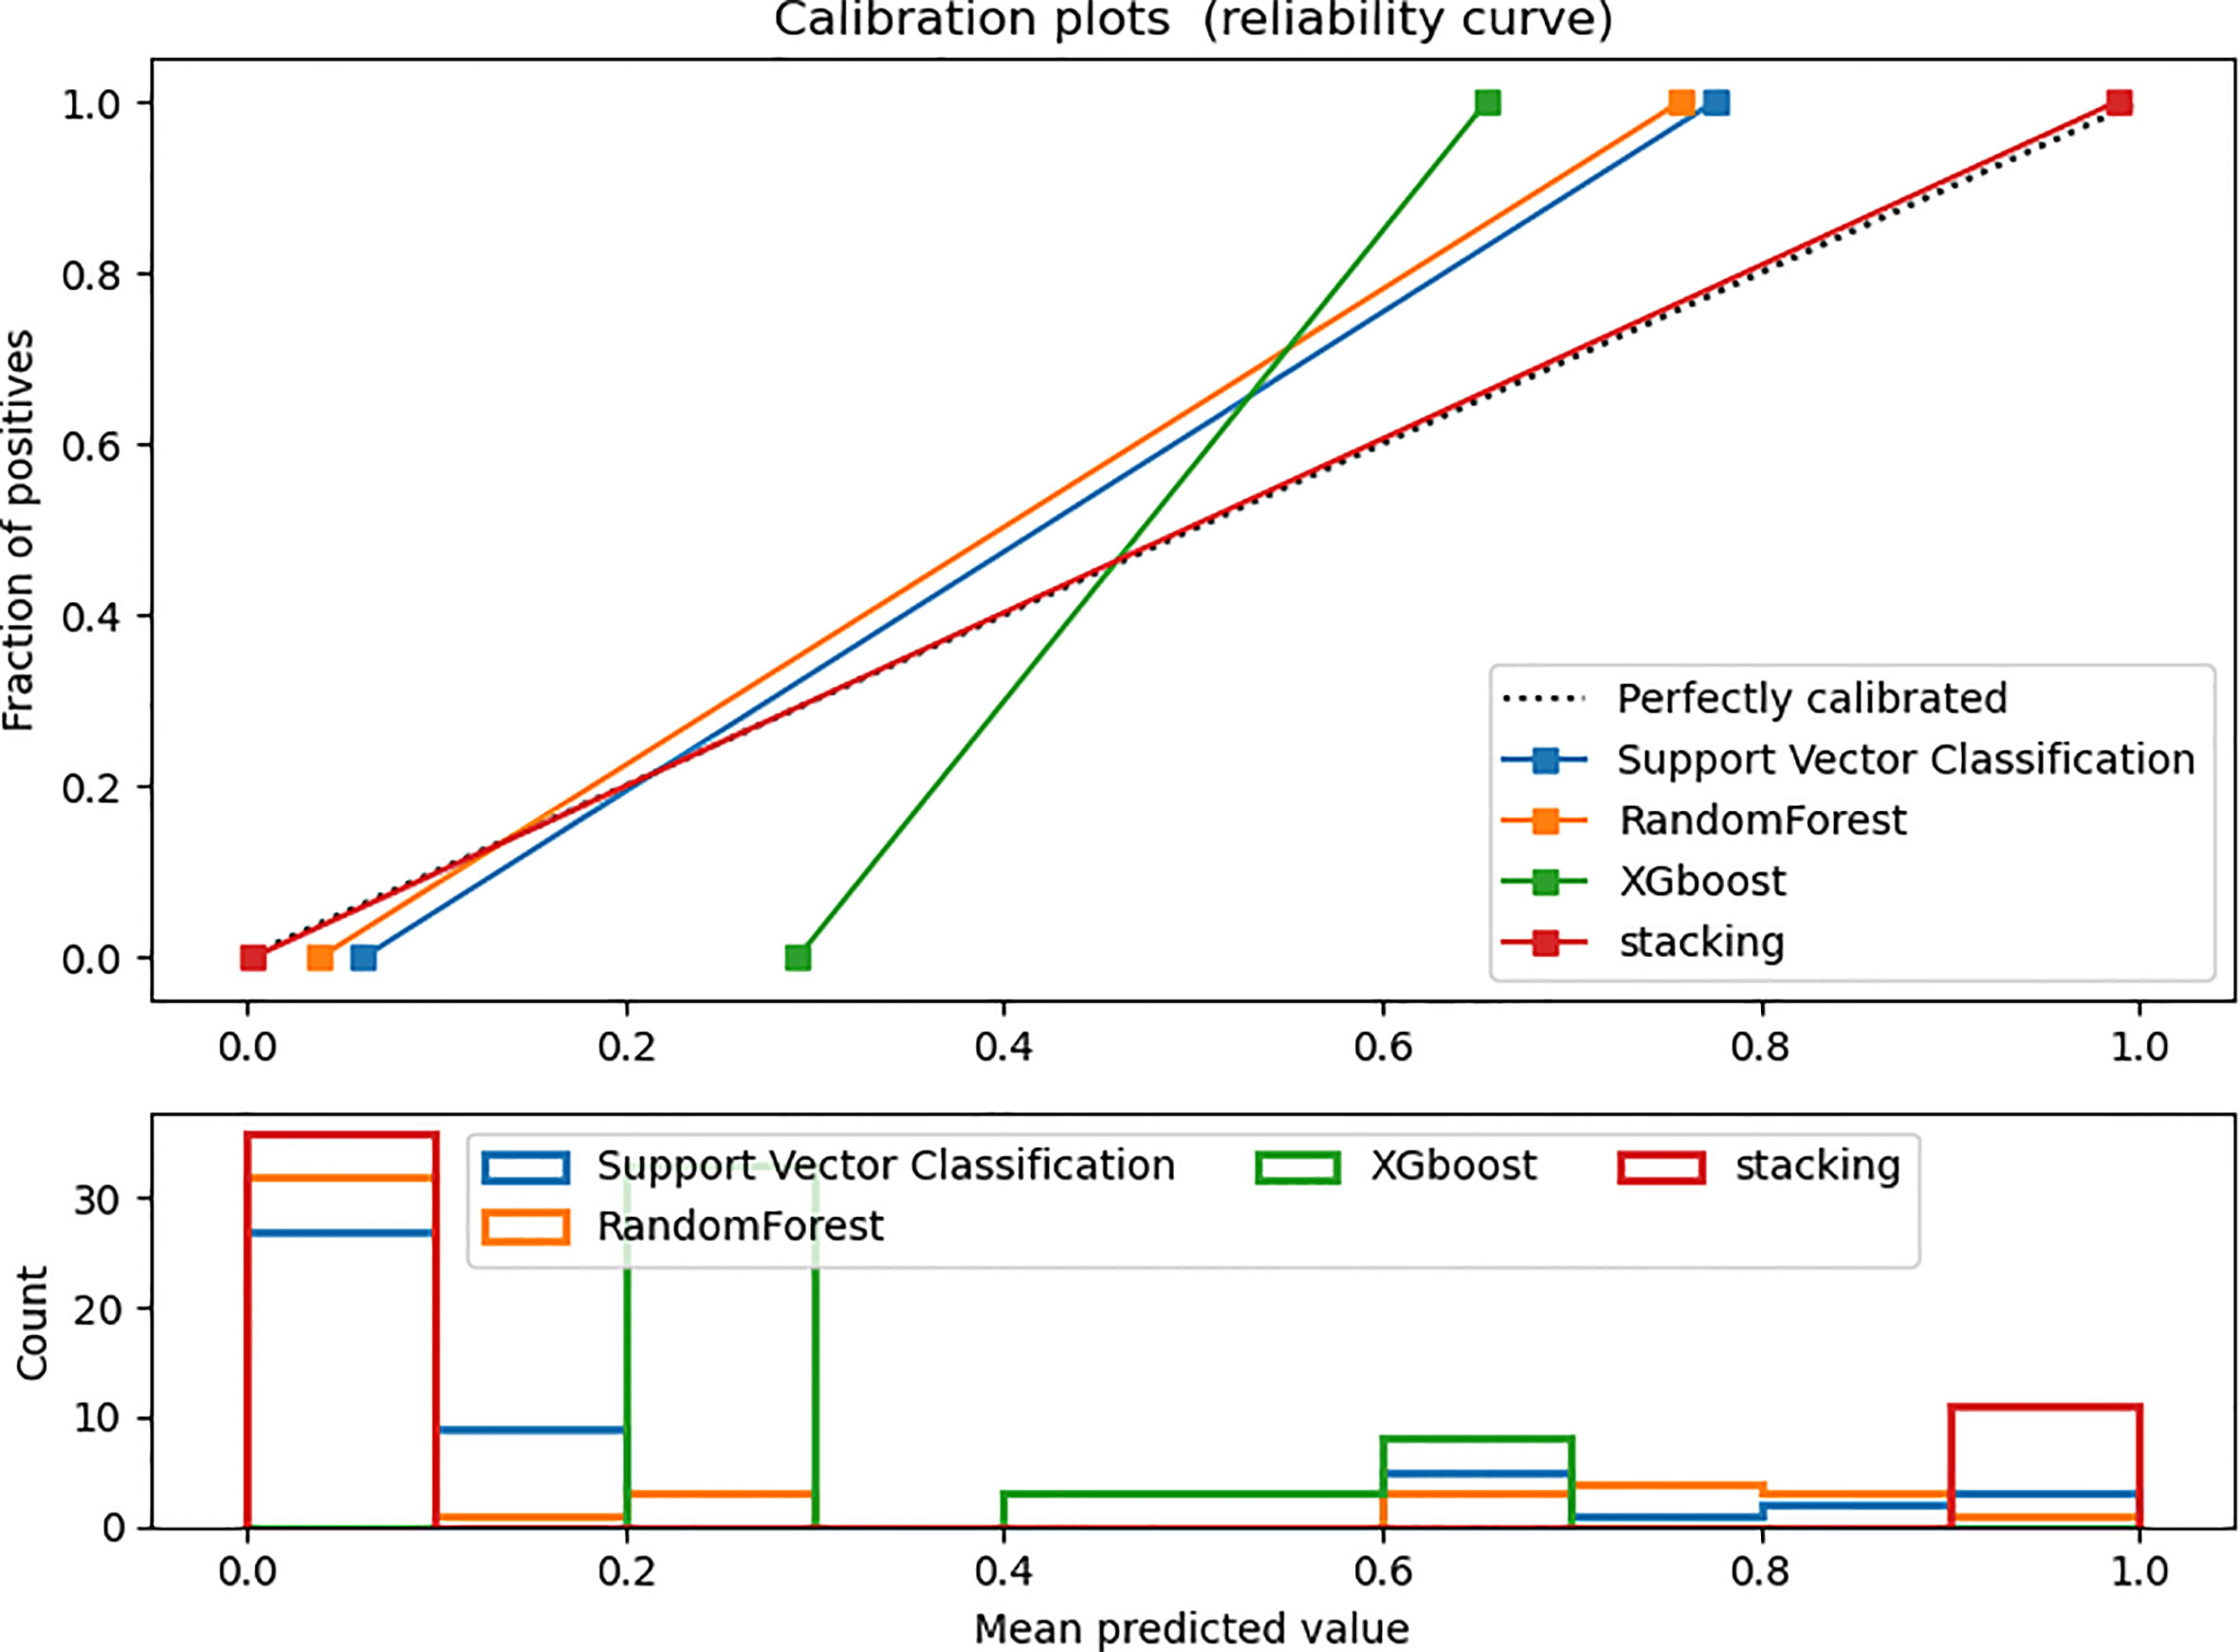
Figure 5 Calibration curve in the testing dataset. The ideal prediction curve is represented by the black dashed line. The model is more accurate as the actual prediction curve gets closer to the dashed line. The bar chart below depicts the average distribution of four models’ predicted probabilities.
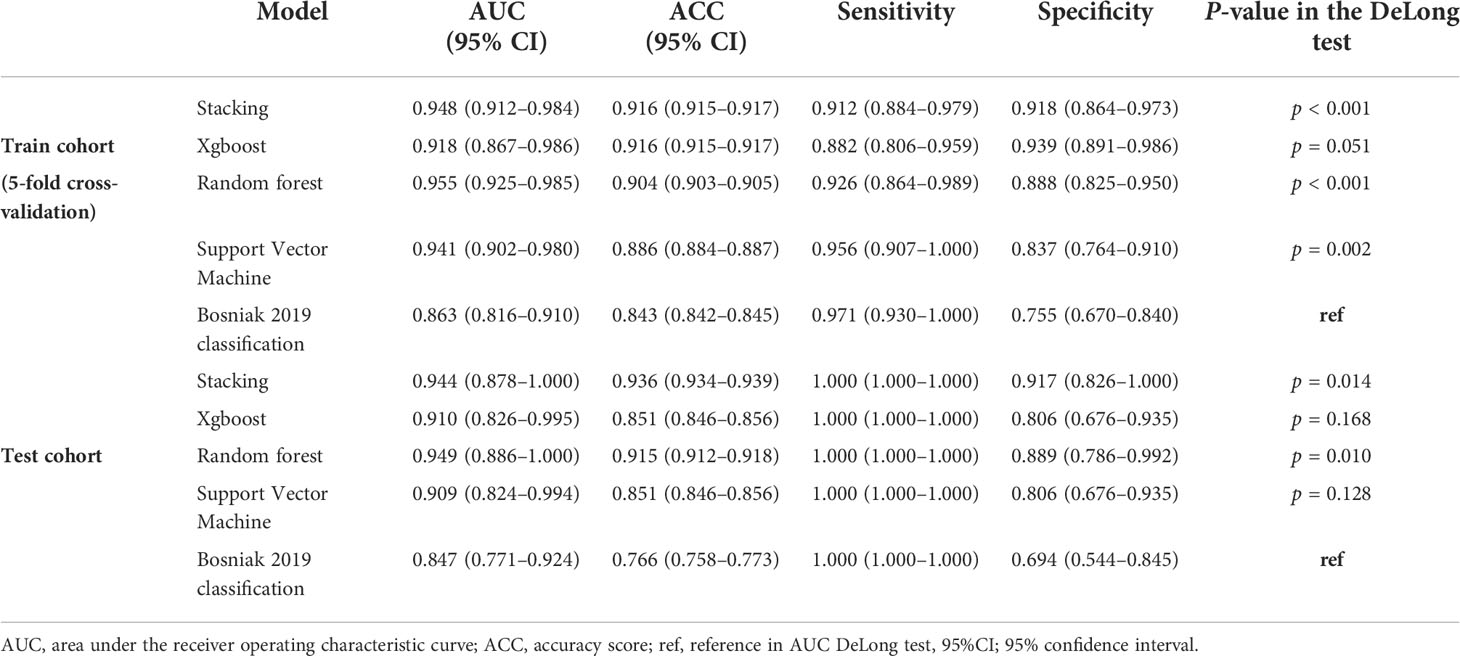
Table 2 The performance of predictive models and the Bosniak 2019 version classification in the testing cohort and training cohort.
DCA for four machine learning models in the testing dataset reveal that all four machine learning models deliver a higher net benefit than “none” and “all” treatment methods under most threshold probabilities (Figure 6). Meanwhile, according to the histopathologic results in the testing dataset, all four machine learning models provide a higher net benefit than the management guideline based on the Bosniak classification in terms of correctly stratifying cyst lesions into malignant renal neoplasms and benign renal masses, implying that using machine learning algorithm will provide better clinical decision support. Four instances of the final model’s performance in the testing cohort are presented in Figure 7. Detailed confusion matrixes for four machine learning models and the Bosniak classification are displayed in Supplementary Material.
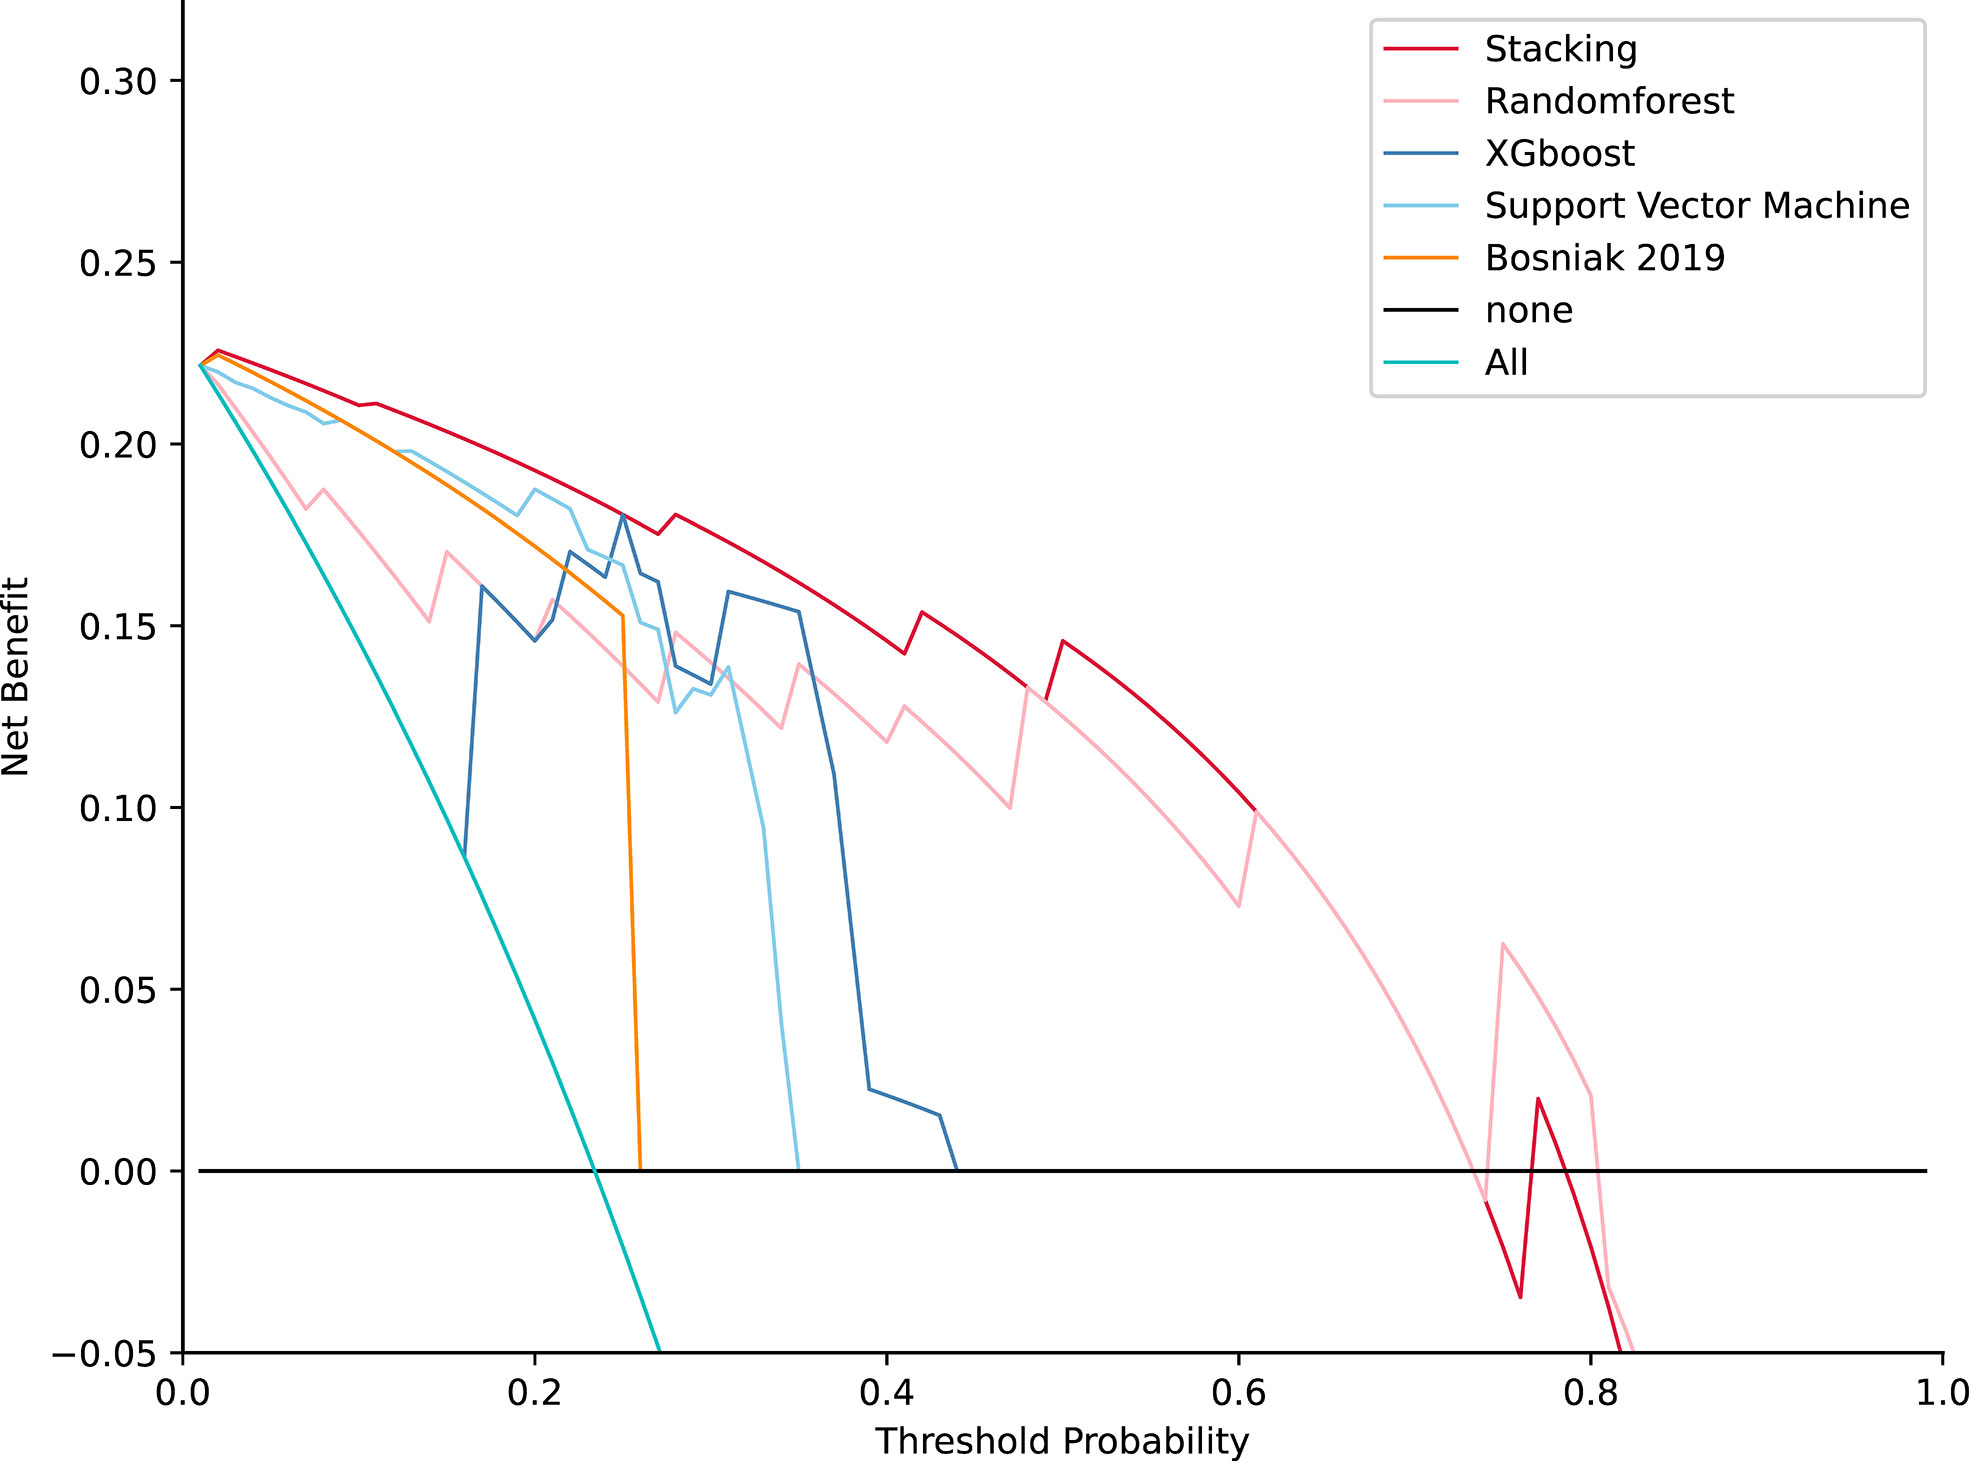
Figure 6 Decision curve analysis for four models compared with the Bosniak 2019 version in testing datasets. The net benefit is represented on the y-axis and the corresponding threshold probability is represented on the x-axis. The stacking model is represented by the red line. The Bosniak 2019 version is represented by the yellow line. All machine learning models present better performance and offered more net benefit than the Bosniak model.
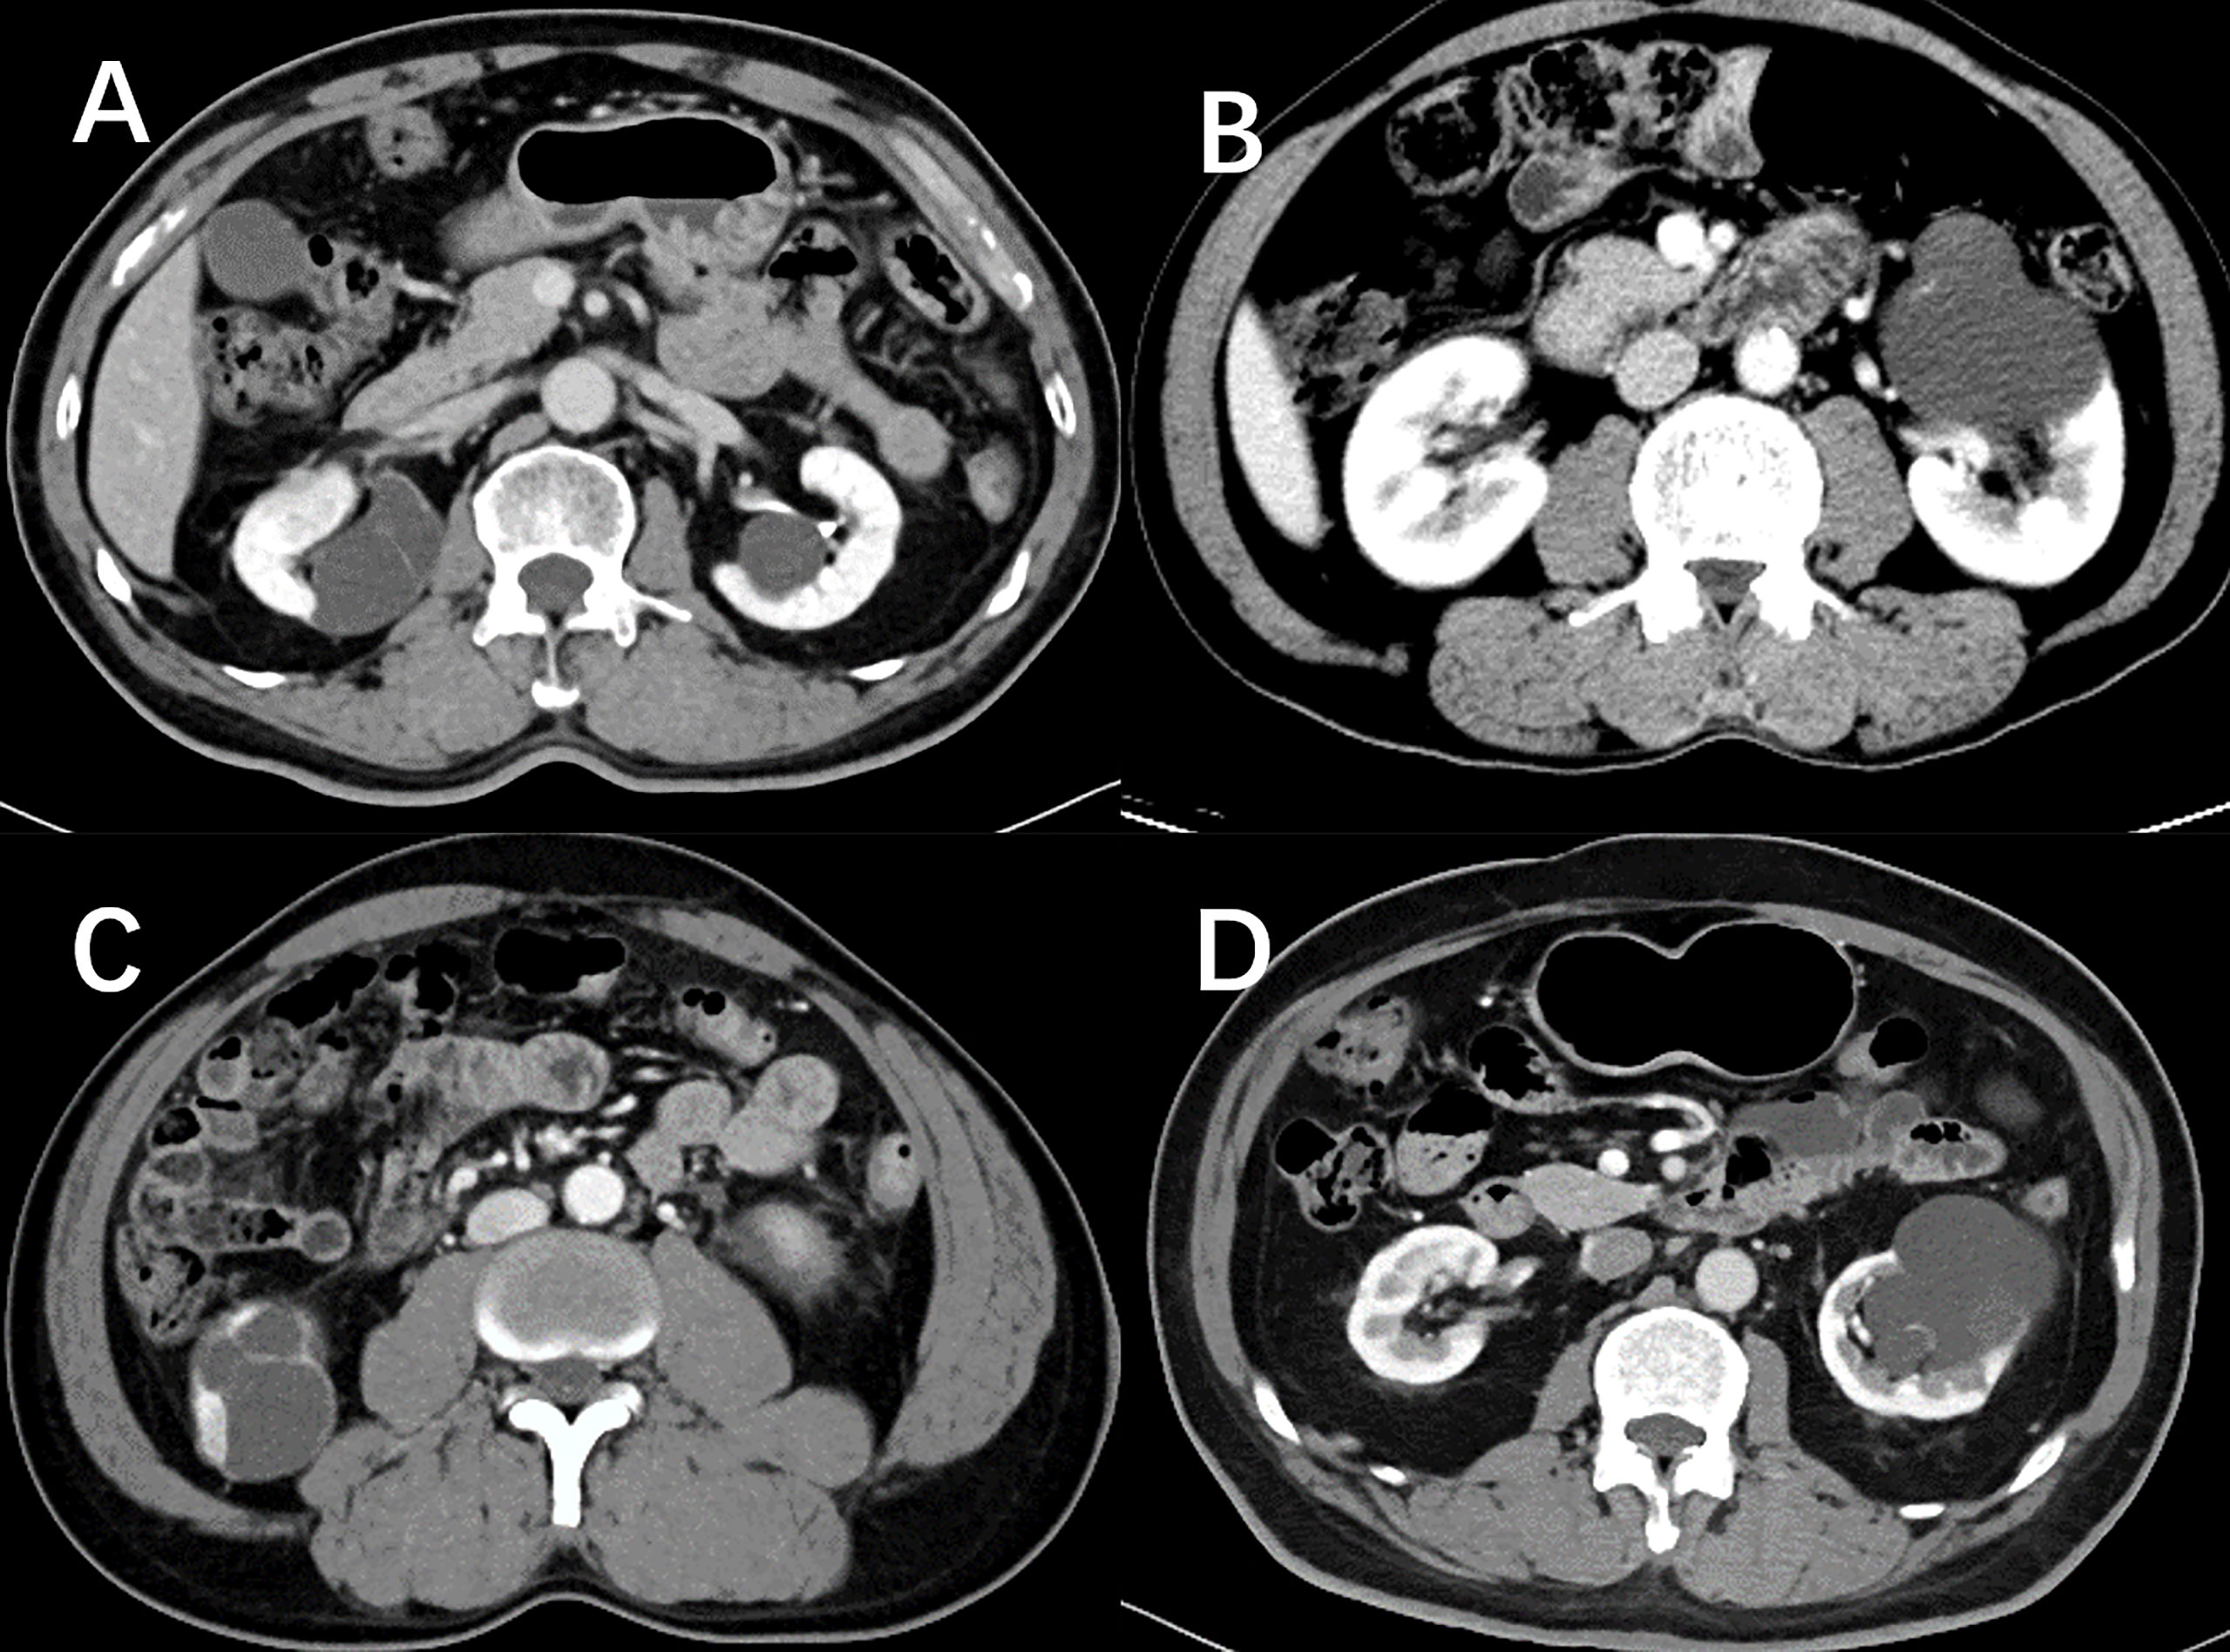
Figure 7 Nephrographic phase images for four cystic renal lesions in the testing datasets. Cystic renal lesion in (A) is benign 2019 Bosniak II lesion and cystic renal lesion in (C) is identified as clear cell renal cell carcinoma according to the histopathologic results after surgery, which stacking model properly predicted as cystic renal neoplasms. Cystic renal lesion in (B, D) are classified as 2019 Bosniak IIF, which are accurately identified as benign CRL by the stacking machine learning model.
Although the updated Bosniak classification system has a close correlation with cystic renal tumors, it has limits when analyzing the pathological results of Bosniak IIF, III, and IV classified CRLs, leading to inappropriate surgical operations and excessive follow-up costs. Identifying low-risk Bosniak classified CRLs can help prevent overtreatment and an increase in healthcare costs (17, 18). Previous findings suggested that the progression of Bosniak IIF cystic renal masses was 4 years (19). The high-risk Bosniak CRL had a quick progression that required radical nephrectomy rather than inappropriate surgical procedures like renal cyst decortication (20, 21). In this retrospective study, using stacking ensemble machine learning methods, we achieved excellent diagnostic performance in discriminating benign CRLs from malignant CRLs, which outperformed the Bosniak classification system. In the final model, we included 19 reproducible and discriminating radiomics features and 5 deep learning features, which displayed robust and consistent performance between cross-validation datasets and testing datasets.
The following elements contribute to the stacking ensemble model’s reliability (1): The research procedure adheres to IBSI guidelines. (2) By using histopathologic examinations as diagnostic criterion, the diagnostic accuracy in this study is confirmed. (3) A stacking ensemble machine learning algorithm prevents overfitting in the training dataset. (4) In the testing step, the stacking model shows good diagnostic performance. (5) The RQS analysis results of this study was 16, which indicated that the quality of this radiomics study was reliable and reproducible. The points were accumulated by adhering to the following criteria: image protocol quality compliance (+1), feature reduction or adjustment for multiple testing compliance (+3), discrimination method with resampling method compliance (+2), calibration statistics method compliance (+1), validation from another institute compliance (+3), comparison to “gold standard” compliance (+2), potential clinical utility (+2), open-sourced code (+1), and open-sourced radiomics features compliance (+1). The updated 2019 version of the Bosniak classification intends to address inter-reader variability and improve diagnostic performance in predicting malignancy CRL. However, the proposed classification ability has yet to be confirmed (22). In this study, two different well-trained readers still disagreed on some CRL issues. In contrast, the stacking decision algorithm demonstrated strong and consistent performance without requiring subjective judgment across the testing datasets.
Many earlier studies have shown that machine learning approaches can be used to stratify CRL (23, 24). However, only a few studies rely on pathology as the diagnostic criteria (25). Miskin et al. used a CT texture-based machine learning method to distinguish CRLs as benign cysts and potentially malignant cysts based on cystic renal mass reclassification using the Bosniak 2019 version (26). However, the Bosniak classification does not have a precise pathological standard, and benign lesions may still be present in these potentially malignant groups, which limited the clinical value. Recently, Reinhold et al. used a CT-based radiomics model with a clinical decision algorithm to distinguish malignant CRLs from CRLs (27). However, they defined benign CRLs as non-imaging changes over 4 years’ follow-up rather than pathological diagnostic criteria that could lead to actual biases, and the ability to distinguish benign from malignant CRLs remains debatable since benign CRLs were not defined by a pathological standard. In this study, all included CRLs have postoperative pathological results, which ensured that the model performance was reliable. Stacking algorithms demonstrated high specificity and sensibility, which may potentially impact clinical practice when radiologists or urologists try to evaluate and determine the right surgical procedure for CRLs.
Although the final machine learning model effectively predicted the outcome of CRL pathology, several limitations should also be mentioned. First, limited by the clinical sample size of CRLs, the diagnostic performance of our machine learning model in large samples still needs to be validated while testing datasets were used in this work. Second, we adopted nephrographic phase CT images to build the machine learning algorithm rather than using triple-phase CT images. In the Bosniak 2019 version, MRI standard features were formally added, whereas there is very little research focusing on renal cysts’ textural features in MR images (28, 29). Previous studies have shown that using renal mass protocol MRI (with subtraction images) can help identify whether there are underlying enhancing features related to malignancy (2, 30). Nephrographic phase CT images and corticomedullary phase CT images for the radiomics model all demonstrated good discriminatory capability when compared with the Bosniak 2019 version categories (31). Future studies could attempt to integrate the triple-phase CT images and MR images by sequence-to-sequence models like the recurrent neural network (RNN) and vision transformer (VIT) (32, 33). Meanwhile, cystic nephroma is typically prevalent in female patients aged 50 to 60 years, which indicates that clinical variables such as age and gender may be potential predictors, and a mixture model that combines radiomics features with clinical features may further improve diagnostic performance (34).
In summary, a stacking fusion feature-based machine learning meta model demonstrates good discrimination capability in stratifying malignant cystic renal neoplasms in CRLs across the testing datasets, which will be beneficial in diagnosing malignant CRLs at a curable stage, reducing overdiagnosis and overtreatment in CRLs.
The raw data supporting the conclusions of this article will be made available by the authors, without undue reservation.
Written informed consent was not obtained from the individual(s) for the publication of any potentially identifiable images or data included in this article.
Q-HH and HT contributed equally to this work and share the first authorship. Q-HH, HT, F-JL, and Y-NZ designed the study; Q-HH, HT, and F-TL performed the experiments and collected the data. Q-HH analyzed the data and wrote the manuscript. M-ZX and QJ reviewed and edited the manuscript. All authors read and approved the final manuscript.
This study was supported by the National Key Research and Development Project, No. 2020YFC2005900.
We appreciate all radiologists and related staff in the First Affiliated Hospital of Chongqing Medical University for their assistance in data collection and ROI sketching.
The authors declare that the research was conducted in the absence of any commercial or financial relationships that could be construed as a potential conflict of interest.
All claims expressed in this article are solely those of the authors and do not necessarily represent those of their affiliated organizations, or those of the publisher, the editors and the reviewers. Any product that may be evaluated in this article, or claim that may be made by its manufacturer, is not guaranteed or endorsed by the publisher.
The Supplementary Material for this article can be found online at: https://www.frontiersin.org/articles/10.3389/fonc.2022.1028577/full#supplementary-material
1. Moch H, Cubilla AL, Humphrey PA, Reuter VE, Ulbright TM. The 2016 who classification of tumours of the urinary system and Male genital organs-part a: Renal, penile, and testicular tumours. Eur Urol (2016) 70(1):93–105. doi: 10.1016/j.eururo.2016.02.029
2. Hu EM, Zhang A, Silverman SG, Pedrosa I, Wang ZJ, Smith AD, et al. Multi-institutional analysis of ct and mri reports evaluating indeterminate renal masses: Comparison to a national survey investigating desired report elements. Abdom Radiol (2018) 43(12):3493–502. doi: 10.1007/s00261-018-1609-x
3. Smith AD, Allen BC, Sanyal R, Carson JD, Zhang H, Williams JH, et al. Outcomes and complications related to the management of bosniak cystic renal lesions. AJR Am J roentgenol (2015) 204(5):W550–6. doi: 10.2214/ajr.14.13149
4. Dana J, Gauvin S, Zhang M, Lotero J, Cassim C, Artho G, et al. Ct-based bosniak classification of cystic renal lesions: Is version 2019 an improvement on version 2005? Eur Radiol (2022). doi: 10.1007/s00330-022-09082-x
5. Yang B, Qiu C, Wan S, Liu J, Li Q, Mai Z, et al. Long-term follow-up study of the malignant transformation potential of the simple renal cysts. Trans Androl Urol (2020) 9(2):684–9. doi: 10.21037/tau.2020.03.29
6. Soputro NA, Kapoor J, Zargar H, Dias BH. Malignant ascites following radical nephrectomy for cystic renal cell carcinoma. BMJ Case Rep (2021) 14(7):e243103. doi: 10.1136/bcr-2021-243103
7. Schoots IG, Zaccai K, Hunink MG, Verhagen P. Bosniak classification for complex renal cysts reevaluated: A systematic review. J Urol (2017) 198(1):12–21. doi: 10.1016/j.juro.2016.09.160
8. Yan JH, Chan J, Osman H, Munir J, Alrasheed S, Flood TA, et al. Bosniak classification version 2019: Validation and comparison to original classification in pathologically confirmed cystic masses. Eur Radiol (2021) 31(12):9579–87. doi: 10.1007/s00330-021-08006-5
9. Spiesecke P, Reinhold T, Wehrenberg Y, Werner S, Maxeiner A, Busch J, et al. Cost-effectiveness analysis of multiple imaging modalities in diagnosis and follow-up of intermediate complex cystic renal lesions. BJU Int (2021) 128(5):575–85. doi: 10.1111/bju.15353
10. Corrias G, Micheletti G, Barberini L, Suri JS, Saba L. Texture analysis imaging “What a clinical radiologist needs to know”. Eur J Radiol (2022) 146:110055. doi: 10.1016/j.ejrad.2021.110055
11. Hu Y, Xie C, Yang H, Ho JWK, Wen J, Han L, et al. Computed tomography-based deep-learning prediction of neoadjuvant chemoradiotherapy treatment response in esophageal squamous cell carcinoma. Radiother Oncol (2021) 154:6–13. doi: 10.1016/j.radonc.2020.09.014
12. Pleil JD, Wallace MAG, Stiegel MA, Funk WE. Human biomarker interpretation: The importance of intra-class correlation coefficients (Icc) and their calculations based on mixed models, anova, and variance estimates. J Toxicol Environ Health Part B Crit Rev (2018) 21(3):161–80. doi: 10.1080/10937404.2018.1490128
13. Zwanenburg A, Vallières M, Abdalah MA, Aerts H, Andrearczyk V, Apte A, et al. The image biomarker standardization initiative: Standardized quantitative radiomics for high-throughput image-based phenotyping. Radiology (2020) 295(2):328–38. doi: 10.1148/radiol.2020191145
14. Lambin P, Leijenaar RTH, Deist TM, Peerlings J, de Jong EEC, van Timmeren J, et al. Radiomics: The bridge between medical imaging and personalized medicine. Nat Rev Clin Oncol (2017) 14(12):749–62. doi: 10.1038/nrclinonc.2017.141
15. Perez-Ortiz M, Gutierrez PA, Tino P, Hervas-Martinez C. Oversampling the minority class in the feature space. IEEE Trans Neural Networks Learn Syst (2016) 27(9):1947–61. doi: 10.1109/tnnls.2015.2461436
16. Vasquez MM, Hu C, Roe DJ, Chen Z, Halonen M, Guerra S. Least absolute shrinkage and selection operator type methods for the identification of serum biomarkers of overweight and obesity: Simulation and application. BMC Med Res Method (2016) 16(1):154. doi: 10.1186/s12874-016-0254-8
17. Campbell SC, Clark PE, Chang SS, Karam JA, Souter L, Uzzo RG. Renal mass and localized renal cancer: Evaluation, management, and follow-up: Aua guideline: Part I. J Urol (2021) 206(2):199–208. doi: 10.1097/ju.0000000000001911
18. Campbell SC, Uzzo RG, Karam JA, Chang SS, Clark PE, Souter L. Renal mass and localized renal cancer: Evaluation, management, and follow-up: Aua guideline: Part ii. J Urol (2021) 206(2):209–18. doi: 10.1097/ju.0000000000001912
19. Boissier R, Ouzaid I, Nouhaud FX, Khene Z, Dariane C, Chkir S, et al. Long-term oncological outcomes of cystic renal cell carcinoma according to the bosniak classification. Int Urol Nephrol (2019) 51(6):951–8. doi: 10.1007/s11255-019-02085-6
20. Huang Z, Wang H, Ji Z. Giant polycystic papillary renal cell carcinoma: A case report and literature review. Front Oncol (2022) 12:876217. doi: 10.3389/fonc.2022.876217
21. Xv Y, Lv F, Guo H, Liu Z, Luo D, Liu J, et al. A ct-based radiomics nomogram integrated with clinic-radiological features for preoperatively predicting Who/Isup grade of clear cell renal cell carcinoma. Front Oncol (2021) 11:712554. doi: 10.3389/fonc.2021.712554
22. Pacheco EO, Torres US, Alves AMA, Bekhor D, D’Ippolito G. Bosniak classification of cystic renal masses version 2019 does not increase the interobserver agreement or the proportion of masses categorized into lower bosniak classes for non-subspecialized readers on ct or Mr. Eur J Radiol (2020) 131:109270. doi: 10.1016/j.ejrad.2020.109270
23. Gillingham N, Chandarana H, Kamath A, Shaish H, Hindman N. Bosniak iif and iii renal cysts: Can apparent diffusion coefficient-derived texture features discriminate between malignant and benign iif and iii cysts? J Comput assist tomogr (2019) 43(3):485–92. doi: 10.1097/rct.0000000000000851
24. Lee Y, Kim N, Cho KS, Kang SH, Kim DY, Jung YY, et al. Bayesian Classifier for predicting malignant renal cysts on mdct: Early clinical experience. AJR Am J roentgenol (2009) 193(2):W106–11. doi: 10.2214/ajr.08.1858
25. Li Y, Dai C, Bian T, Zhou J, Xiang Z, He M, et al. Development and prospective validation of a novel weighted quantitative scoring system aimed at predicting the pathological features of cystic renal masses. Eur Radiol (2019) 29(4):1809–19. doi: 10.1007/s00330-018-5722-6
26. Miskin N, Qin L, Matalon SA, Tirumani SH, Alessandrino F, Silverman SG, et al. Stratification of cystic renal masses into benign and potentially malignant: Applying machine learning to the bosniak classification. Abdom Radiol (New York) (2021) 46(1):311–8. doi: 10.1007/s00261-020-02629-w
27. Dana J, Lefebvre TL, Savadjiev P, Bodard S, Gauvin S, Bhatnagar SR, et al. Malignancy risk stratification of cystic renal lesions based on a contrast-enhanced ct-based machine learning model and a clinical decision algorithm. Eur Radiol (2022) 32(6):4116–27. doi: 10.1007/s00330-021-08449-w
28. Ferreira AM, Reis RB, Kajiwara PP, Silva GEB, Elias J, Muglia VF. Mri evaluation of complex renal cysts using the bosniak classification: A comparison to ct. Abdom Radiol (2016) 41(10):2011–9. doi: 10.1007/s00261-016-0797-5
29. Krishna S, Schieda N, Pedrosa I, Hindman N, Baroni RH, Silverman SG, et al. Update on mri of cystic renal masses including bosniak version 2019. J magn reson Imaging JMRI (2021) 54(2):341–56. doi: 10.1002/jmri.27364
30. Davenport MS, Hu EM, Smith AD, Chandarana H, Hafez K, Palapattu GS, et al. Reporting standards for the imaging-based diagnosis of renal masses on ct and mri: A national survey of academic abdominal radiologists and urologists. Abdom Radiol (2017) 42(4):1229–40. doi: 10.1007/s00261-016-0962-x
31. Zhang Y, Zhao Y, Lv Y, Gu X. Value of quantitative ctta in differentiating malignant from benign bosniak iii renal lesions on ct images. J Comput assist tomogr (2021) 45(4):528–36. doi: 10.1097/rct.0000000000001181
32. van Griethuysen JJM, Fedorov A, Parmar C, Hosny A, Aucoin N, Narayan V, et al. Computational radiomics system to decode the radiographic phenotype. Cancer Res (2017) 77(21):e104–e7. doi: 10.1158/0008-5472.Can-17-0339
33. Han K, Wang Y, Chen H, Chen X, Guo J, Liu Z, et al. A survey on vision transformer. IEEE Trans Pattern Anal Mach Intell (2022). doi: 10.1109/tpami.2022.3152247
Keywords: renal neoplasms, machine learning, Bosniak-2019 classification, cystic renal lesions, radiomics analysis
Citation: He Q-H, Tan H, Liao F-T, Zheng Y-N, Lv F-J, Jiang Q and Xiao M-Z (2022) Stratification of malignant renal neoplasms from cystic renal lesions using deep learning and radiomics features based on a stacking ensemble CT machine learning algorithm. Front. Oncol. 12:1028577. doi: 10.3389/fonc.2022.1028577
Received: 26 August 2022; Accepted: 07 October 2022;
Published: 25 October 2022.
Edited by:
Margarida Julià-Sapé, Universitat Autònoma de Barcelona, SpainReviewed by:
Ran Zhang, Huiying Medical Technology Co., Ltd., ChinaCopyright © 2022 He, Tan, Liao, Zheng, Lv, Jiang and Xiao. This is an open-access article distributed under the terms of the Creative Commons Attribution License (CC BY). The use, distribution or reproduction in other forums is permitted, provided the original author(s) and the copyright owner(s) are credited and that the original publication in this journal is cited, in accordance with accepted academic practice. No use, distribution or reproduction is permitted which does not comply with these terms.
*Correspondence: Ming-Zhao Xiao, eG16LjIwMDRAMTYzLmNvbQ==; Qing Jiang, MzAwODk5QGhvc3BpdGFsLmNxbXUuZWR1LmNu
†These authors have contributed equally to this work and share first authorship
Disclaimer: All claims expressed in this article are solely those of the authors and do not necessarily represent those of their affiliated organizations, or those of the publisher, the editors and the reviewers. Any product that may be evaluated in this article or claim that may be made by its manufacturer is not guaranteed or endorsed by the publisher.
Research integrity at Frontiers
Learn more about the work of our research integrity team to safeguard the quality of each article we publish.