 Zijian Li
 Tao Zeng1†
 Chong Zhou
 Wu Yin
94% of researchers rate our articles as excellent or good
Learn more about the work of our research integrity team to safeguard the quality of each article we publish.
Find out more
ORIGINAL RESEARCH article
Front. Oncol., 01 November 2022
Sec. Thoracic Oncology
Volume 12 - 2022 | https://doi.org/10.3389/fonc.2022.1019442
This article is part of the Research TopicNovel Biomarkers for Potential Clinical Applications in Lung CancerView all 41 articles
A more accurate prognosis is important for clinical treatment of lung adenocarcinoma. However, due to the limitation of sample and technical bias, most prognostic signatures lacked reproducibility, and few were applied to clinical practice. In addition, understanding the molecular driving mechanism is indispensable for developing more promising therapies for lung adenocarcinoma. Here, we built an unbiased prognostic significance model to perform an integrative analysis, including differentially expressed genes and clinical data with lung adenocarcinoma patients from TCGA. Multivariable Cox proportional hazards model with the Lasso penalty and 10-fold cross-validate were used to identify the best gene signature. We generated a 17-gene signature for prognostic risk prediction based on the overall survival time of lung adenocarcinoma patients. To further test the model’s predictive ability, we have applied an independent GEO database to verify the predictive ability of prognostic signature. The model can more objectively describe several biological processes related to tumors and reveal important molecular mechanisms in tumor development by GO and KEGG analysis. Furthermore, differential expression analysis by GSEA revealed that tumor microenvironments such as ER stress, exosome, and immune microenvironment were enriched. Using single-cell RNA sequence technology, we found that risk score was positively correlated with lung adenocarcinoma marker genes and copy number variation but negatively correlated with lung epithelial marker genes. High-risk cell populations with the model had stronger cancer stemness and tumor-related pathway activation. As we expected, the risk score was in accordance with the malignancy of each cluster from tumor progression. In conclusion, the risking model established in this study is more reliable than others in evaluating the prognosis of LUAD patients.
Lung adenocarcinoma (LUAD) is the most common subtype of lung cancer and a significant cause of cancer-related death worldwide (1, 2). Most LUAD patients are diagnosed in advanced or metastatic stages, which is the primary cause of mortality in lung cancer (3). However, LUAD patients’ prognosis is far from satisfying, and its associated microenvironments remain poorly understood (1). Even stage I lung cancer has a poor prognosis with 5-year overall survival (OS) after surgical resection (4), revealing the need for treatment escalation, such as adjuvant therapy. Notably, LUAD is a complex disease involving multiple pathways in pathogenesis. Thus, an in-depth understanding of the driven molecular mechanisms of LUAD is indispensable for developing more promising therapies.
Investigators have continued to seek prognostic signature that are predictive of survival benefit, as it is the basis for developing personalized approaches to improve the survival of early-stage lung cancer patients (5, 6). Many studies have proposed genomic signatures for risk score and survival prediction in lung cancer patients (7–9). However, most prognostic signatures lacked reproducibility due to problematic issues such as limited sample size, individual heterogeneity, and technical bias, few prognostic signatures were applied to routine clinical practice (6). The study built a significant prognostic model to perform an integrative analysis including differentially expressed genes (DEGs) and clinical data with lung adenocarcinoma patients from The Cancer Genome Atlas (TCGA) Program. Multivariable Cox proportional hazards model with the Lasso penalty and ten-fold cross-validation were used to identify the best gene signatures among different gene categories. We generated a 17-gene signature for prognostic risk prediction based on OS time with LUAD patients.
Efforts for understanding lung cancer progression have primarily focused on the profiling of cancer cells with genetic aberrations (10, 11). However, progression also can be influenced by complex and dynamic features from the tumor surroundings (12). For learning more about tumor progression, genetically engineered mice (GEM) with somatic mutation of Kras-G12D with or without TP53 deletion in alveolar type 2 cells (termed ‘K’ mice and ‘KP’ mice) can spontaneously suffer lung adenoma (13, 14), and the adenoma in ‘KP’ mice can progress into advanced LUAD over more than 12 weeks (15–17). This technique can control the tumor progress with increased accuracy. Single-cell RNA sequence (scRNA-seq) can offer more details about tumor, while bulk RNA sequence can only offer an overview description. Additionally, it can be a powerful tool to characterize each cell in a tumor, which could help us understand more about tumor characteristics (18–20). To validate the survival, scRNA-seq and GEM were used to identify more details regarding tumor progression through the prognostic signature.
RNA sequence and clinical data with lung adenocarcinoma patients from TCGA were downloaded and prepared using the R ‘TCGAbiolinks’ package (21). The gene expression profiles include 520 primary tumor samples, which could correspond with clinical data and 59 normal tissue. Gene expression omnibus (GEO) database including GSE43458 (110 samples), GSE10072 (107 samples), GSE32863 (116 samples), GSE31210 (246 samples) and GSE50081 (181 samples) were downloaded by ‘GEOquery’ R package (22). Probs in GSE43458 (110 samples), GSE10072 (107 samples) and GSE32863 (116 samples) were annotated by ‘hgu133a.db’ and ‘annotate’ R packages; Probs in GSE31210 and GSE50081 were annotated by ‘hgu133plus2.db’ and ‘annotate’ R package (23). When a gene was mapped to different probes, the genic expression value was calculated by the average expression value. Furthermore, gene expression data from the GEO (https://www.ncbi.nlm.nih.gov/geo/) and GDC databases (https://cancergenome.nih.gov/) were z-score transformed for survival analysis. The clinical features of the TCGA and GEO patients is shown in Table S1 and Table S2.
The ‘limma’ R package performed differential expression analysis on primary tumor and normal tissues (24). P-values and fold changes were controlled for false discovery rate (FDR< 0.05 and |logFC| > 0.5). The ‘survival’ R package performed univariate Cox analyses of OS to identify the prognostic signature (25). The “Coxph” function was used to build a Univariate Cox model and calculate the p-value and C-index (consistency index). In addition, the “Cox.zph” function was used to test the proportional hazards assumption for a Cox regression model fit. (p< 0.05 and C-index > 0.58 and p-value of Proportional Hazards Assumption larger than 0.4).
Multivariable Cox regression analysis was performed to analyze the overall probability of survival. Lasso regression was performed by the ‘glmnet’ R package to reduce the number of genes, and a 10-fold cross-validation was performed to set proper lambda, and finally, 17 genes were left (26).
w represents the Lasso coefficient index of risk genes, mRNA represent gene expression, and the gene expression level of each gene, respectively.
The differential between high risk (HR > 1) and low risk (LR< 1) was confirmed by Kaplan-Meier method (log-rank test). The ‘timeROC’ R package performed a receiver operating characteristic curve (ROC) analysis to assess the predictive efficiency of the prognostic signature (27). C-index was used to evaluate the model’s predictive ability. Multivariable Cox regression was used to integrate different predictive factors (upper and lower limits of 95% confidence interval). The GEO database, including GSE31210 and GSE50081, validated the model. C20orf197 in GSE31210 and GSE50081 is missing, and the expression of C20orf197 in two databases was assigned 0.
Endoplasmic reticulum (ER) stress-related genes were collected from ‘Msigdb’ (28), and exosome-related genes were collected from ExoCarta (29, 30). The ‘GSVA’ R package was applied to perform a single-sample gene set enrichment analysis (ssGSEA) to quantify the ssGSEA score of immune signatures and endoplasmic reticulum stress and exosome-related genes (31). Differential genes in LUAD samples ad. pavlue< 0.05 and logFC > 0.5 or logFC< -0.5. Gene Ontology (GO) and Kyoto Encyclopedia of Genes and Genomes (KEGG) enrichment analyses were performed by the ‘clusterProfiler’ R package. Gene sets were collected from ‘Msigdb’ based on the DEGs, which was done by the ‘limma’ R package between high-risk and low-risk groups (28, 32). To estimate the activation of hallmark pathways, the GSEA analysis was applied with standard settings (32). To analyze the tumor immune microenvironment of the LUAD samples, the ‘GSVA’ R package was used to perform ssGSEA to quantify the ssGSEA score of 29 immune cell-related gene sets (33, 34). The Wilcox test tested the differential expression analysis of immune-related signatures, and the correlation between risk score and immune signatures was performed by Spearman correlation analysis. Differentially expressed genes about immune signatures were done by ‘limma’ R package (P.Value< 0.005). The same methods are performed in ER stress and exosome analysis.
Single-cell RNA sequence data (after depth normalization) was downloaded from GEO database (GSE154989). Seurat v4.0.4 was used for single-cell analysis (35–38). The count for the genes in each cell was log normalized, and the ScaleData function was used for scaling. SCTransform function was used for correcting different animals and plates, and the top 40 principal components were used to construct the SNN graph and embedding. FindClusters function was used for clustering cells at 0.5 resolution. AUCell v1.15.0 was used for scoring the ER stress and exosome gene sets in scRNA-seq (39). InferCNV v1.9.1 was used for the copy number variation (CNV) assignment with default parameters (40). Raw CNV score for each cell was collected from ‘infercnv.observations.txt’ file and transformed into 3-level scoring (0.7~1.3 assign 0; 0~0.3 or larger than 1.5 assigns 2; 0.3 ~ 0.7 or 1.3~1.5 assigns 1). Cluster 11, the earliest cell type T, was considered as the control and had no CNV. The CNV score for each cell was the sum of every gene’s CNV Score.
For estimating the trajectory of scRNA-seq, Monocle v2.21.1 was used to estimate and order cells in pseudotime along a trajectory (41). Several ablation experiments were done to select proper genes to estimate pseudotime. High variable genes calculated by Monocle and stemness genes collected from ‘Msigdb’ were used to estimate pseudotime. Cluster 11, which appeared in the early stage of LUAD, was set to the original point of pseudotime. Monocle V2 was used to obtain highly variable genes, DDRtree was used to establish the minimum spanning tree after dimensionality reduction.
Multivariable and univariate Cox regression were used to analyze the probability of OS, and KM method was used to test the difference between high-risk and low-risk patients. Chi-squared test tested differences between risk scores and clinical information. ER stress scores, exosome scores, and immune signatures between the two groups were examined using Wilcox test and Spearman correlation analysis. Statistical analyses were performed using R v.4.1.1. The detailed analysis methods in the website (https://github.com/ZengTaox/xlw/blob/main/upload.R).
Five hundred ninety-two LUAD and adjacent non-tumorous samples from the TCGA database were included in DEGs and prognostic genes for OS. Meanwhile, 520 LUAD samples from the TCGA database and 427 patients from two GEO cohorts were incorporated into the following study about prognostic model.
Firstly, compared tumor and adjacent non-tumorous tissues from TCGA and get DEGs. Secondly, we use univariate Cox regression analysis in tumor tissue from TCGA to get prognostic genes (p< 0.05), 90 of 205 prognostic genes were DEGs (Figures 1A, B). To further construct a risk scoring model for predicting possibility of OS in LUAD patients, LASSO Cox regression was used to build a prognostic model, which included PLEK2, PTPRH, OGFRP1, CHRNA5, CBFA2T3, SMIM15, AVEN, MELTF, KRT8, RGS20, FAM207A, SOWAHC, ELF5, LSP1P4, C20orf197, C11orf16 and DNALI1 (Figure 1C). The univariate Cox regression analysis suggests that these genes can be used as prognostic genes (Figure 1D), and can also be used to distinguish tumor from adjacent tissues. In addition, we evaluated three extra GEO cohorts (Figures 1F–H), the prognostic genes in the above GEO databases are consistent with TCGA databases (Figure 1E).
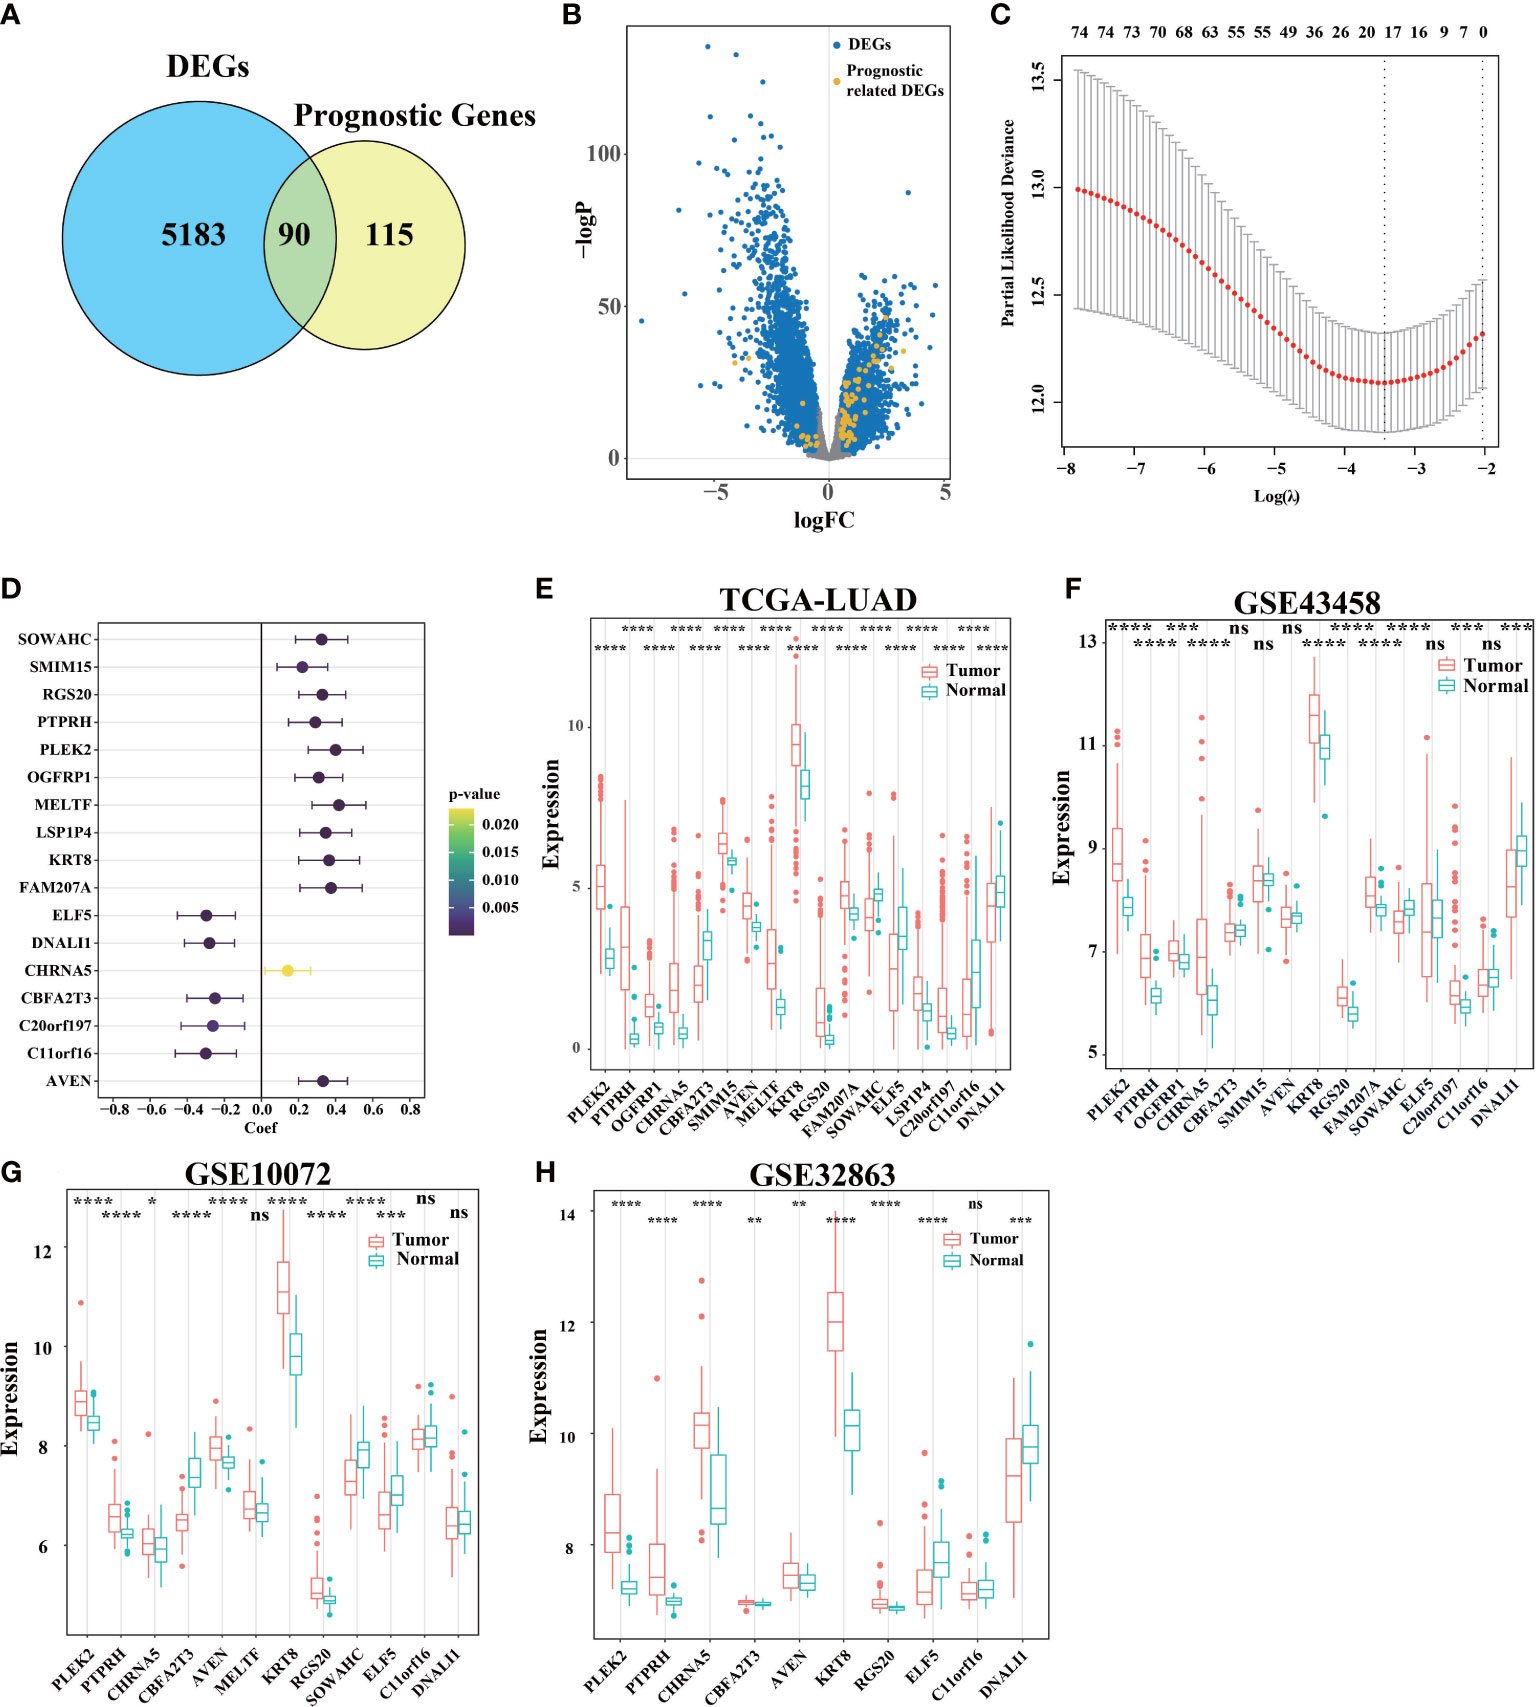
Figure 1 Identification of signature genes and establishment of a survival model. (A) A total of 5273 DEGs with adj. pvalue< 0.05 and logFC > 0.5 or logFC< -0.5 were selected by limma. 205 genes related to survival were found by stationarity test and univariate Cox regression analysis. Of these, 90 genes were associated with both survival and differential between the cancer and para-cancer groups. (B) Use volcano map to describe the distribution of DEGs in all genes. (C) LASSO Cox regression model was used to establish a multivariable model, and 10-fold cross validation was used to calculate the total deviation corresponding to differe nt penalty coefficients. (D) Univariate Cox regression test (C) The influence of the gene on survival (upper and lower 95% confidence intervals, color significance). (E) Analysis of gene expression differences between primary cancer (n = 533) and adjacent tissue (n = 59) in TCGA-LUAD. (F–H) DEGs in tumor tissue and para-cancer tissue in GEO databases (ns was non-significant, *P< 0.05, **P< 0.01, ***P< 0.001, ****P< 0.0001).
For predictive performance of the 17-gene prognostic model in TCGA cohort, the area under the curve (AUC) in the time-dependent ROC analysis reached 0.69, 0.72, 0.75, and 0.78 (Figure 2A), indicating excellent specificity and sensitivity of the risk score for predicting OS. According to the median value of risk score, the patients were divided into high-risk and low-risk groups. PCA analysis confirmed that patients in two groups were stratified into two directions (Figure 2B). KM analysis indicated that worse prognosis and significantly poorer OS were detected in high-risk patients (two-stage test P< 0.0001, log-rank test P< 0.001, Figure 2C). Compared with low-risk group, the patients had a higher proportion of death and shorter survival time in high-risk group (Figures 2D, E). ELF5, DNALI1, C11orf16, CBFA2T3, and C20orf197 had higher expression levels in low-risk group, while the other genes in the prognostic signature had higher expression levels in high-risk group (Figure 2F).
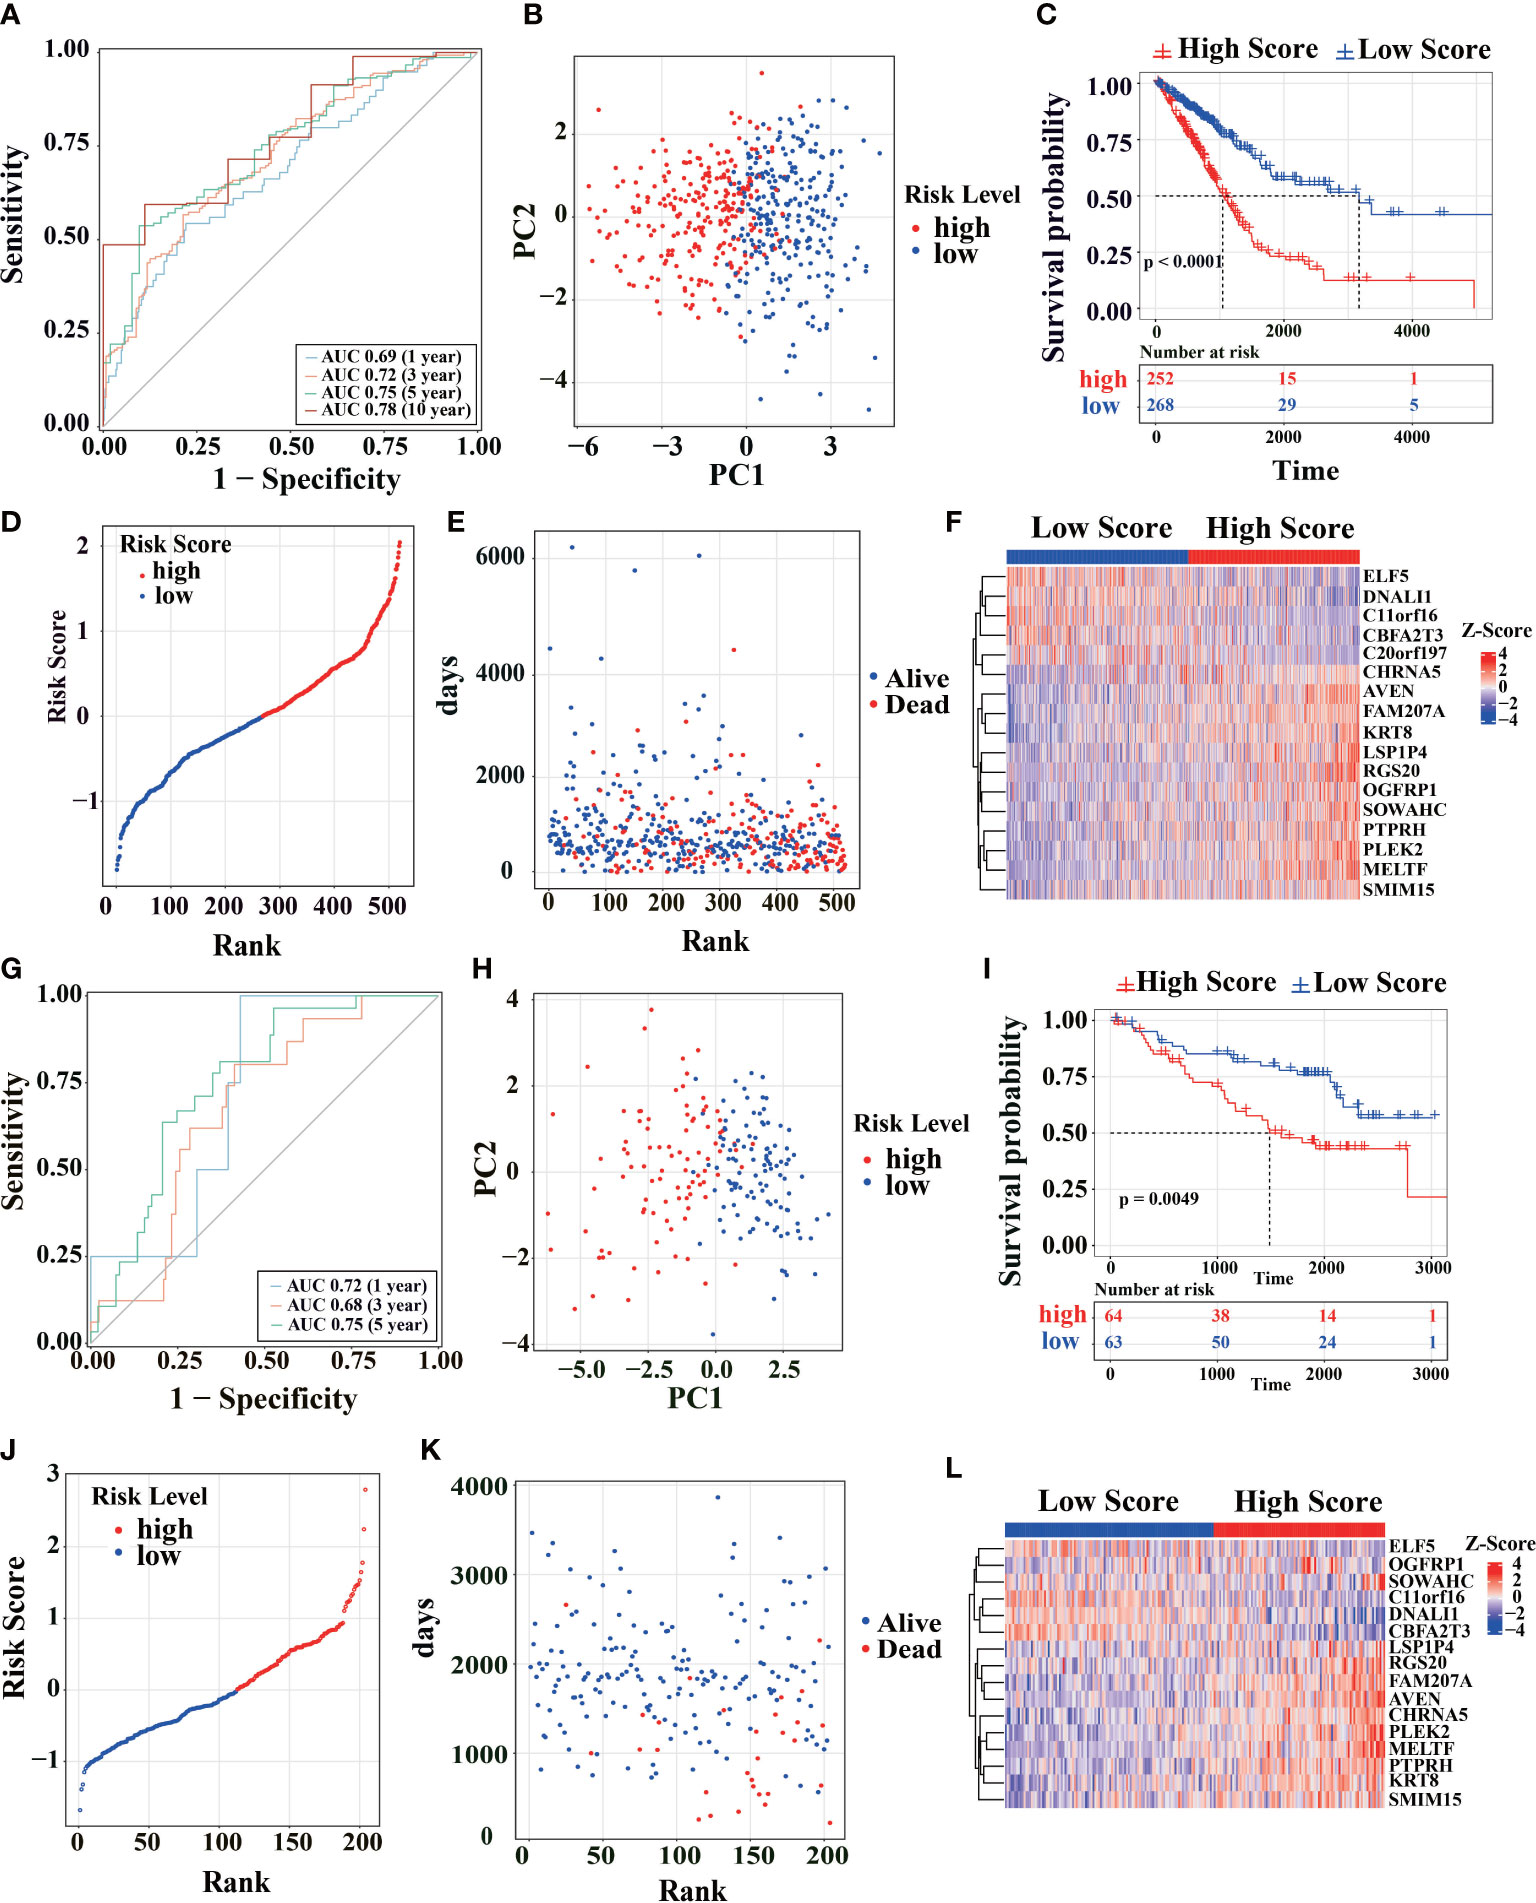
Figure 2 Survival analysis of the model in TCGA cohort. (A) Using TCGA-LUAD primary cancer samples and corresponding clinical records (n = 520) to calculate the AUC of time-dependent ROC curves of the risk score at 1, 3, 5 and 10 years. (B) PCA analysis was performed using the genes in Figure 1C of the primary LUAD sample in TCGA cohort. (C) The survival rates of LUAD patients were tested to test by KM survival analysis in the TCGA database. (D) Distribution map of different survival risks of LUAD patients in TCGA database. (E) Time distribution of LUAD patients with different survival risks and death in TCGA database (ordinate: follow-up time, abscissa: risk ranking). (F) Gene expression trends in Figure 1C of LUAD patients in TCGA database (top note: blue: low-risk, red: high-risk; Heat map below: Red: high expression, blue: low expression). (G-L) Patients from the GEO cohort (GSE31210) were analyzed similarly to the above analysis in TCGA cohort.
To further estimate the model’s generalization performance, we have validated the predictive ability of prognostic signatures in the GEO database (GSE31210, Figures 2G–L; GSE50081, Figures S1A–F). In GSE31210 cohort, the AUC was 0.72 at 1 year, 0.68 at 3 years, and 0.75 at 5 years (Figure 2G). Similar to TCGA, the patients from GSE31210 cohort were divided into different directions by PCA analysis (Figure 2H). KM survival analysis indicated that high-risk patients had a higher proportion of death (log-rank test P< 0.0049, Figure 2I) and shorter survival time (Figures 2J, K). The ELF5, DNALI1, C11orf16, and CBFA2T3 genes also had higher expression levels in the low-risk group in GSE31210 cohort (Figure 2L). The same results are shown in GSE50081 cohort (Figures S1A–F). These similar results show that the signature has good generalization performance and can potentially predict prognosis for LUAD patients.
After controlling for confounding variables, risk score of the signature remained statistically significant for OS. The clinical characteristics analysis of the cohorts is summarized in Table S1 and Table S2. As shown in Figure 3A, univariate Cox survival analysis indicated that risk score (p< 0.0001), invasion depth (T stage, p< 0.0001), distant metastasis (M stage, p< 0.05), lymph node metastasis (N stage, p< 0.0001) and clinical staging (TNM stage, p< 0.0001) were significant parameters that affect the prognosis of LUAD patients. Multivariable Cox survival analysis revealed that risk score was independent predictors of unfavorable prognosis in LUAD patients (p=4.33e-11 Figure 3B). Additionally, with LUAD TNM staging progress, the risk score increased in different degrees (Figure 3C–F). These results suggest that high-risk score might imply worse clinical symptoms regarding invasion depth, distant metastasis, and lymph node metastasis. By analyzing the risk score, we found that the model had a higher C-index, indicating that the risk score was more accurate than the traditional clinical stage (Figure 3G).
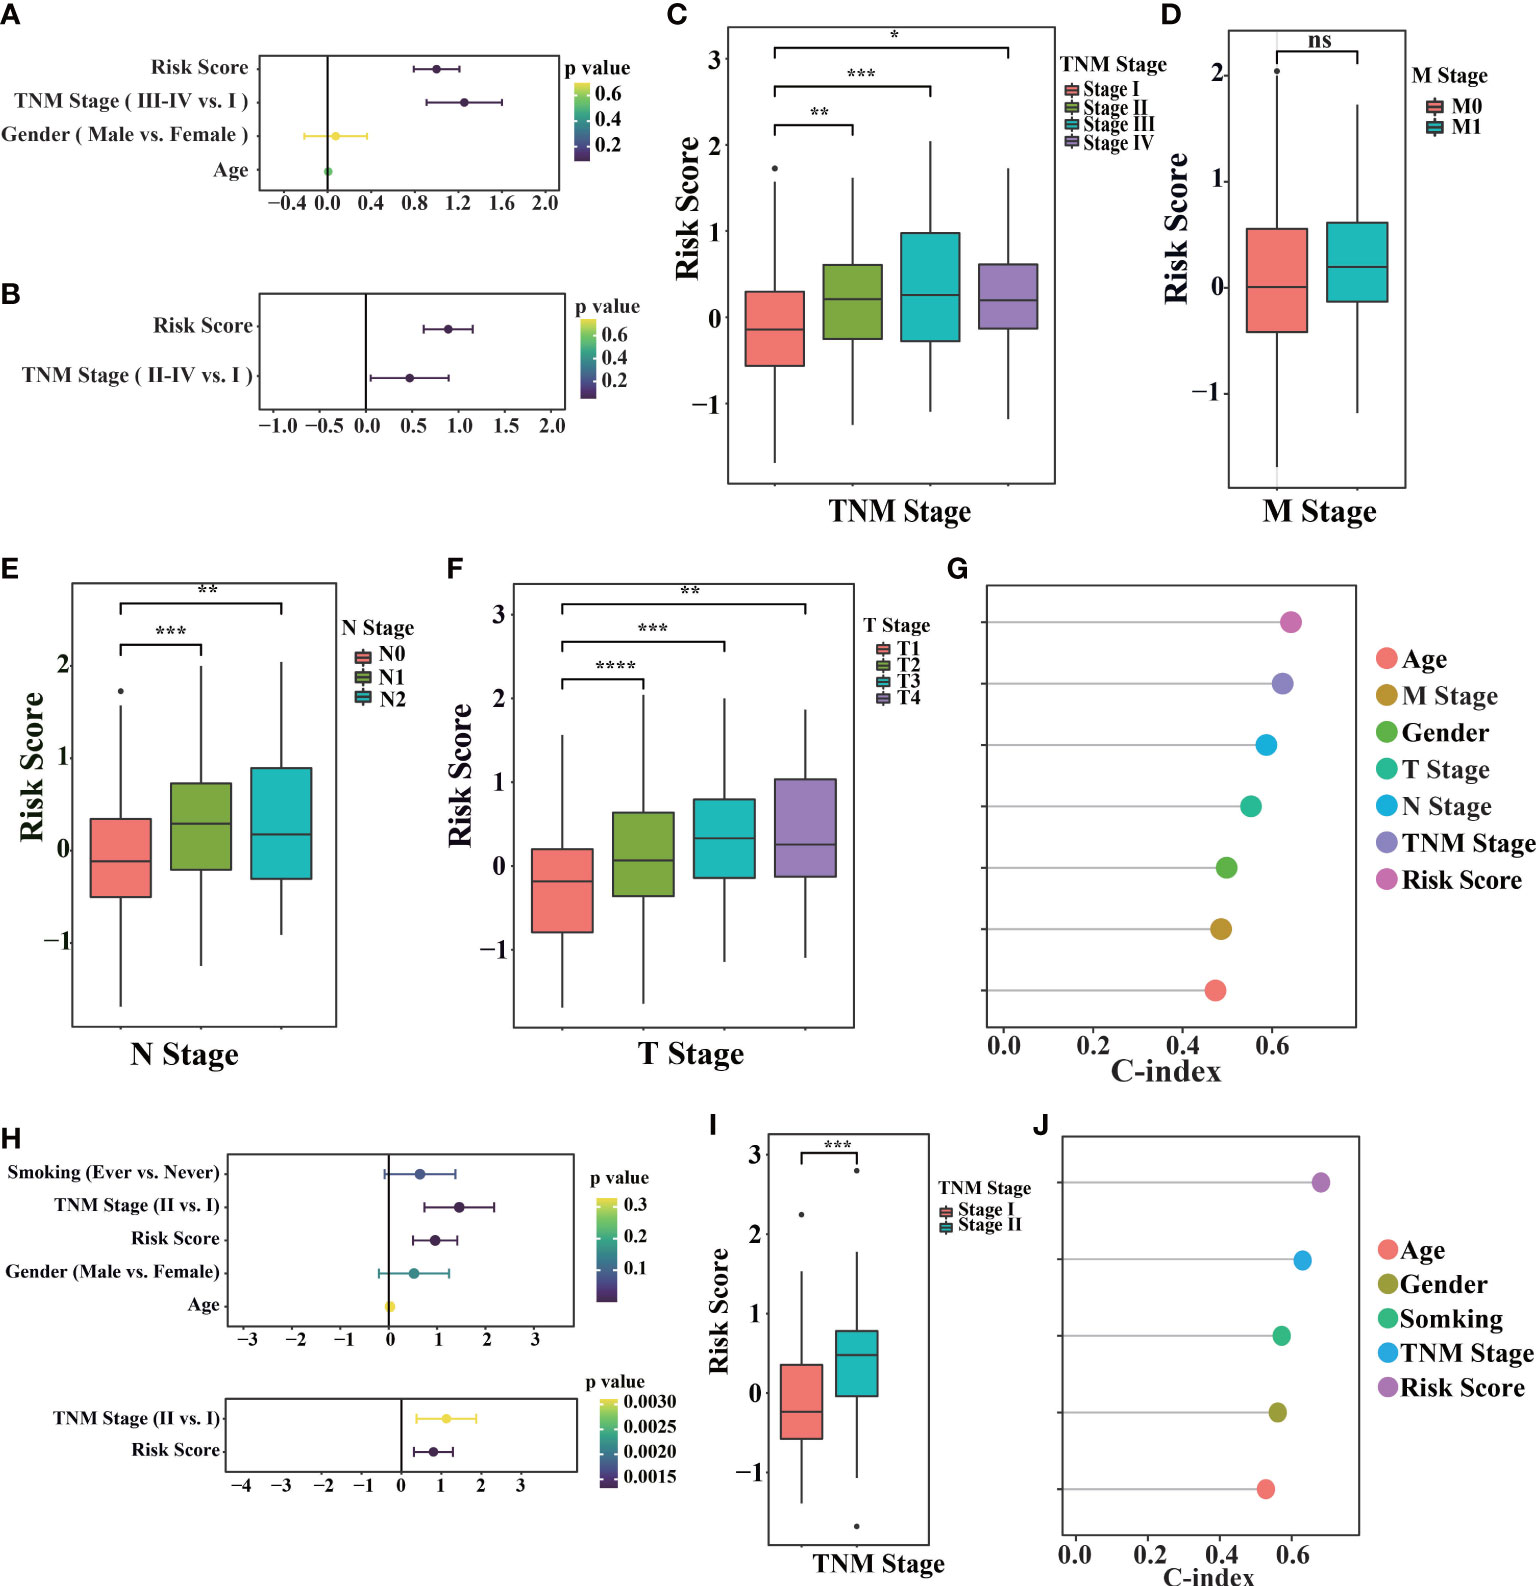
Figure 3 Prognostic values of the model in TCGA and GEO cohorts. (A) The TCGA-LUAD primary cancer samples, corresponding clinical records and corresponding risk score (n = 520) were used for univariate Cox regression. (B) Perform multivariable Cox regression on the significant factors in univariate Cox regression. (C–F) TCGA-LUAD samples with different tumor traditional clinical stage (TNM stage, M stage, N stage, T stage) and their corresponding risk scores. (G) Consistency index of TCGA-LUAD primary cancer samples, corresponding clinical records and corresponding risk score (n = 520) calculated by univariate Cox regression. (H) Using univariate Cox regression (above) in the GSE31210 cohort (n = 246), the significant factors in univariate Cox regression are performed in multivariable Cox regression (below). (I) samples with different TNM stages in GSE31210 cohort and their corresponding risk scores. (J) The consistency index of primary cancer samples, corresponding clinical records and corresponding risk scores in GSE31210 cohort was calculated by univariate Cox regression. (“ns” is non-significant, *P< 0.05, **P< 0.01, ***P< 0.001, ****P< 0.0001).
We also found the same result in GEO database (GSE31210, Figures 3H–J; GSE50081, Figures S1G–K), with LUAD TNM staging progress, the risk score increased in different degrees. These results indicate the risk scoring model, as an independent prognostic factor in clinical features, can more accurately evaluate prognosis of patients.
To analyze the prognostic signature, base on differential analysis between high-risk and low-risk groups (Figure 4A), GSEA score on 50 hallmark pathways were displayed. Notably, we found some tumor-related pathways were activated in high-risk patients, such as epithelial-mesenchymal transition, mTORC1, and PI3K/Akt/mTOR pathways (TCGA, Figure 4B). The activation of mTORC1 signaling and PI3K/Akt/mTOR pathways promotes glucose metabolism and growth regulation (42). It is also worth noting that LUAD patients with epithelial-mesenchymal transition, glycolysis, and highly proliferative state were associated with poorer survival (43). The imbalance of these pathways may be related to tumor progression, indicating the poor prognosis in high-risk patients.
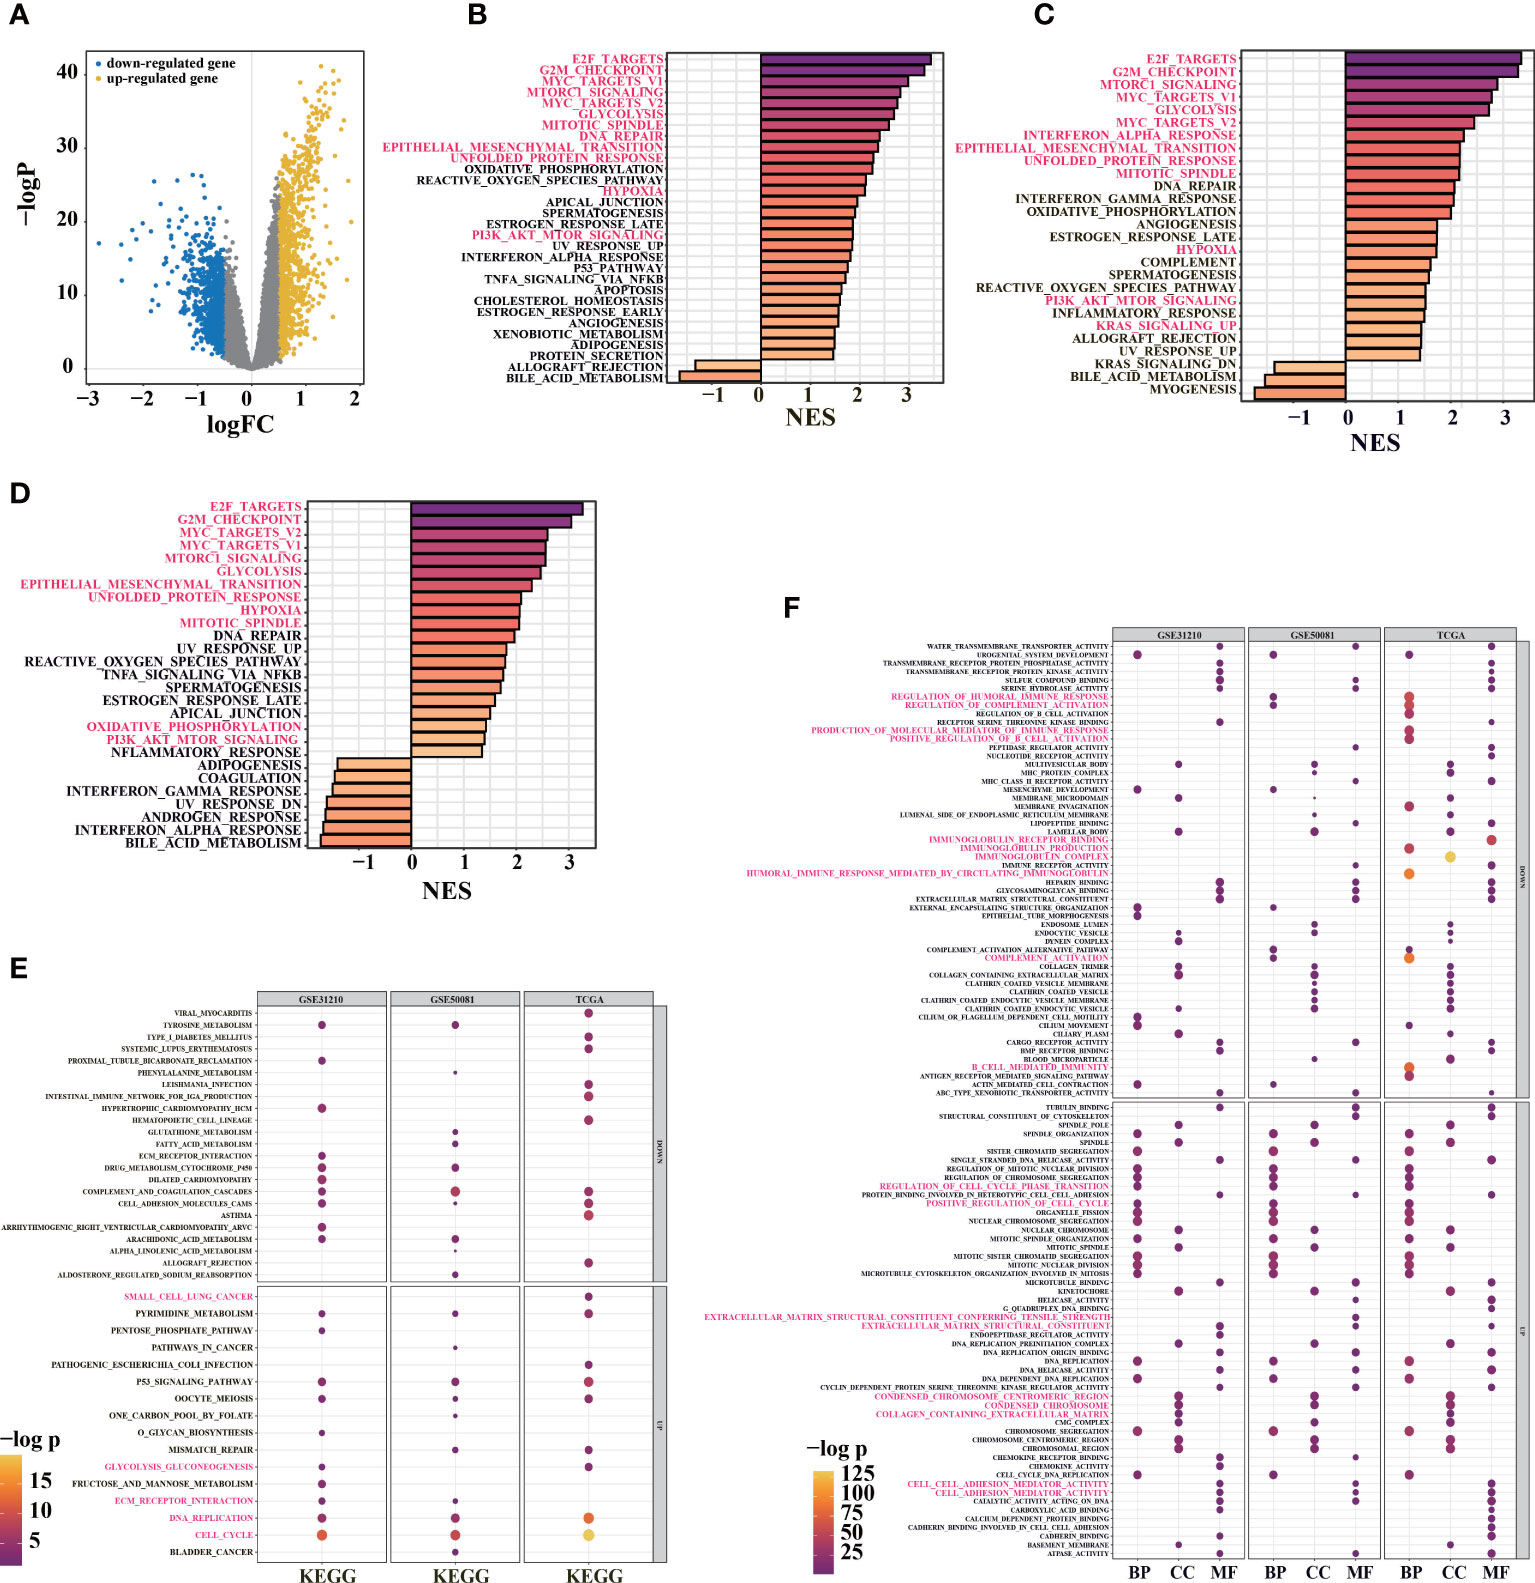
Figure 4 Functional enrichment analysis for prognosis signature. (A) volcano diagram show DEGs between high-risk and low-risk groups in TCGA-LUAD primary cancer samples. (B) GSEA enrichment analysis was performed using DEGs between high-risk and low-risk groups in TCGA cohort (30/50 genes were significant). (C) GSEA enrichment analysis was performed on the DEGs between high-risk and low-risk groups in the GSE31210 cohort (26/50 gene sets were significant). (D) 29/50 significant gene sets were obtained by GSEA enrichment analysis using DEGs between high-risk and low-risk groups in GSE50081 cohort (adj. pvalue< 0.05, color indicates the size of standardized enrichment score). (E) Based on LUAD samples in TCGA, GSE31210 and GSE50081 cohorts, the DEGs between high-risk and low-risk groups were analyzed for enrichment. Gene sets in KEGG database(E) and GO database(F) were used for enrichment analysis (FDR< 0.01; Color and dot size indicate enrichment significance).
In TCGA and GEO cohorts (TCGA, Figure 4B; GSE31210, Figure 4C; GSE50081, Figure 4D), E2F transcription factors and c-Myc signal were activated in the high-risk group. The c-Myc signal regulates differentiation and proliferation through activated transcription and amplification of target genes in various tumors (44). In addition to mediating the cell cycle, E2F transcription factors play critical roles in tumor development and metastasis, including angiogenesis, extracellular matrix remodeling, tumor cell survival, and epithelial-mesenchymal transition (44, 45). With the activation of hypoxia-related pathways in high-risk group, unfolded protein responses are markedly activated (Figures 4B–D), and tumor cells may produce tumor-specific exosomes. Increased unfolded protein responses in high-risk group may contribute to ER stress. These factors jointly promote tumor proliferation, drug resistance, metastasis, and invasion and might even cause an immunosuppressive microenvironment (46).
Furthermore, “clusterProfiler” R package was used to conduct GO and KEGG enrichment analyses between high-risk and low-risk groups in TCGA and GEO cohorts (Figures 4E, F). Interestingly, KEGG pathway analysis indicated that the signature was associated with P53 signaling pathway, immune response, DNA replication, extracellular matrix remodeling (ECM)-receptor interaction, and glycolysis (Figure 4E). Similarly, the overlapped GO functional pathways between the three cohorts were predominantly enriched in tumor microenvironments associated with multivesicular bodies, mitotic activity, immune response, ECM, focal adhesion, and others (Figure 4F). These results imply that there might be differences in ER stress, exosome pathway, immune response, ECM, cell cycle, and proliferation between high-risk and low-risk groups.
To further explore the differences in survival, we compared the effects of immune response, exosome pathway, and ER stress between two groups. It was observed that high-risk patients were associated with significantly higher ER stress scores (TCGA, Figure 5A; GEO, Figure S2). We also found that high-risk scores were related to some ER stress pathways (Figure 5A). Boxplots depicting ER stress-related ssGSEA scores showed that patients in high-risk group had higher scores than those in low-risk group (Figure 5B). To explore more detail about ER stress, a heatmap of ER stress-related genes was utilized to confirm the difference in both groups (Figure 5C). Tbl2, which is positively correlated with risk score, can cause ER stress through PERK-eIF2α-ATF4 axis (47) (Figures 5C, S2B). We also found that erlin1 and EIF4EBP1 were positively correlated with risk scores (Figure 5C). ATF4-mediated induction of erlin1 and EIF4EBP1 contributes to ER stress (48). As ER stress indicator, highly expressed erlin1 indicates the increased ER stress in high-risk group (49) (Figure S2C). Therefore, ER stress is significantly involved in high-risk patients.
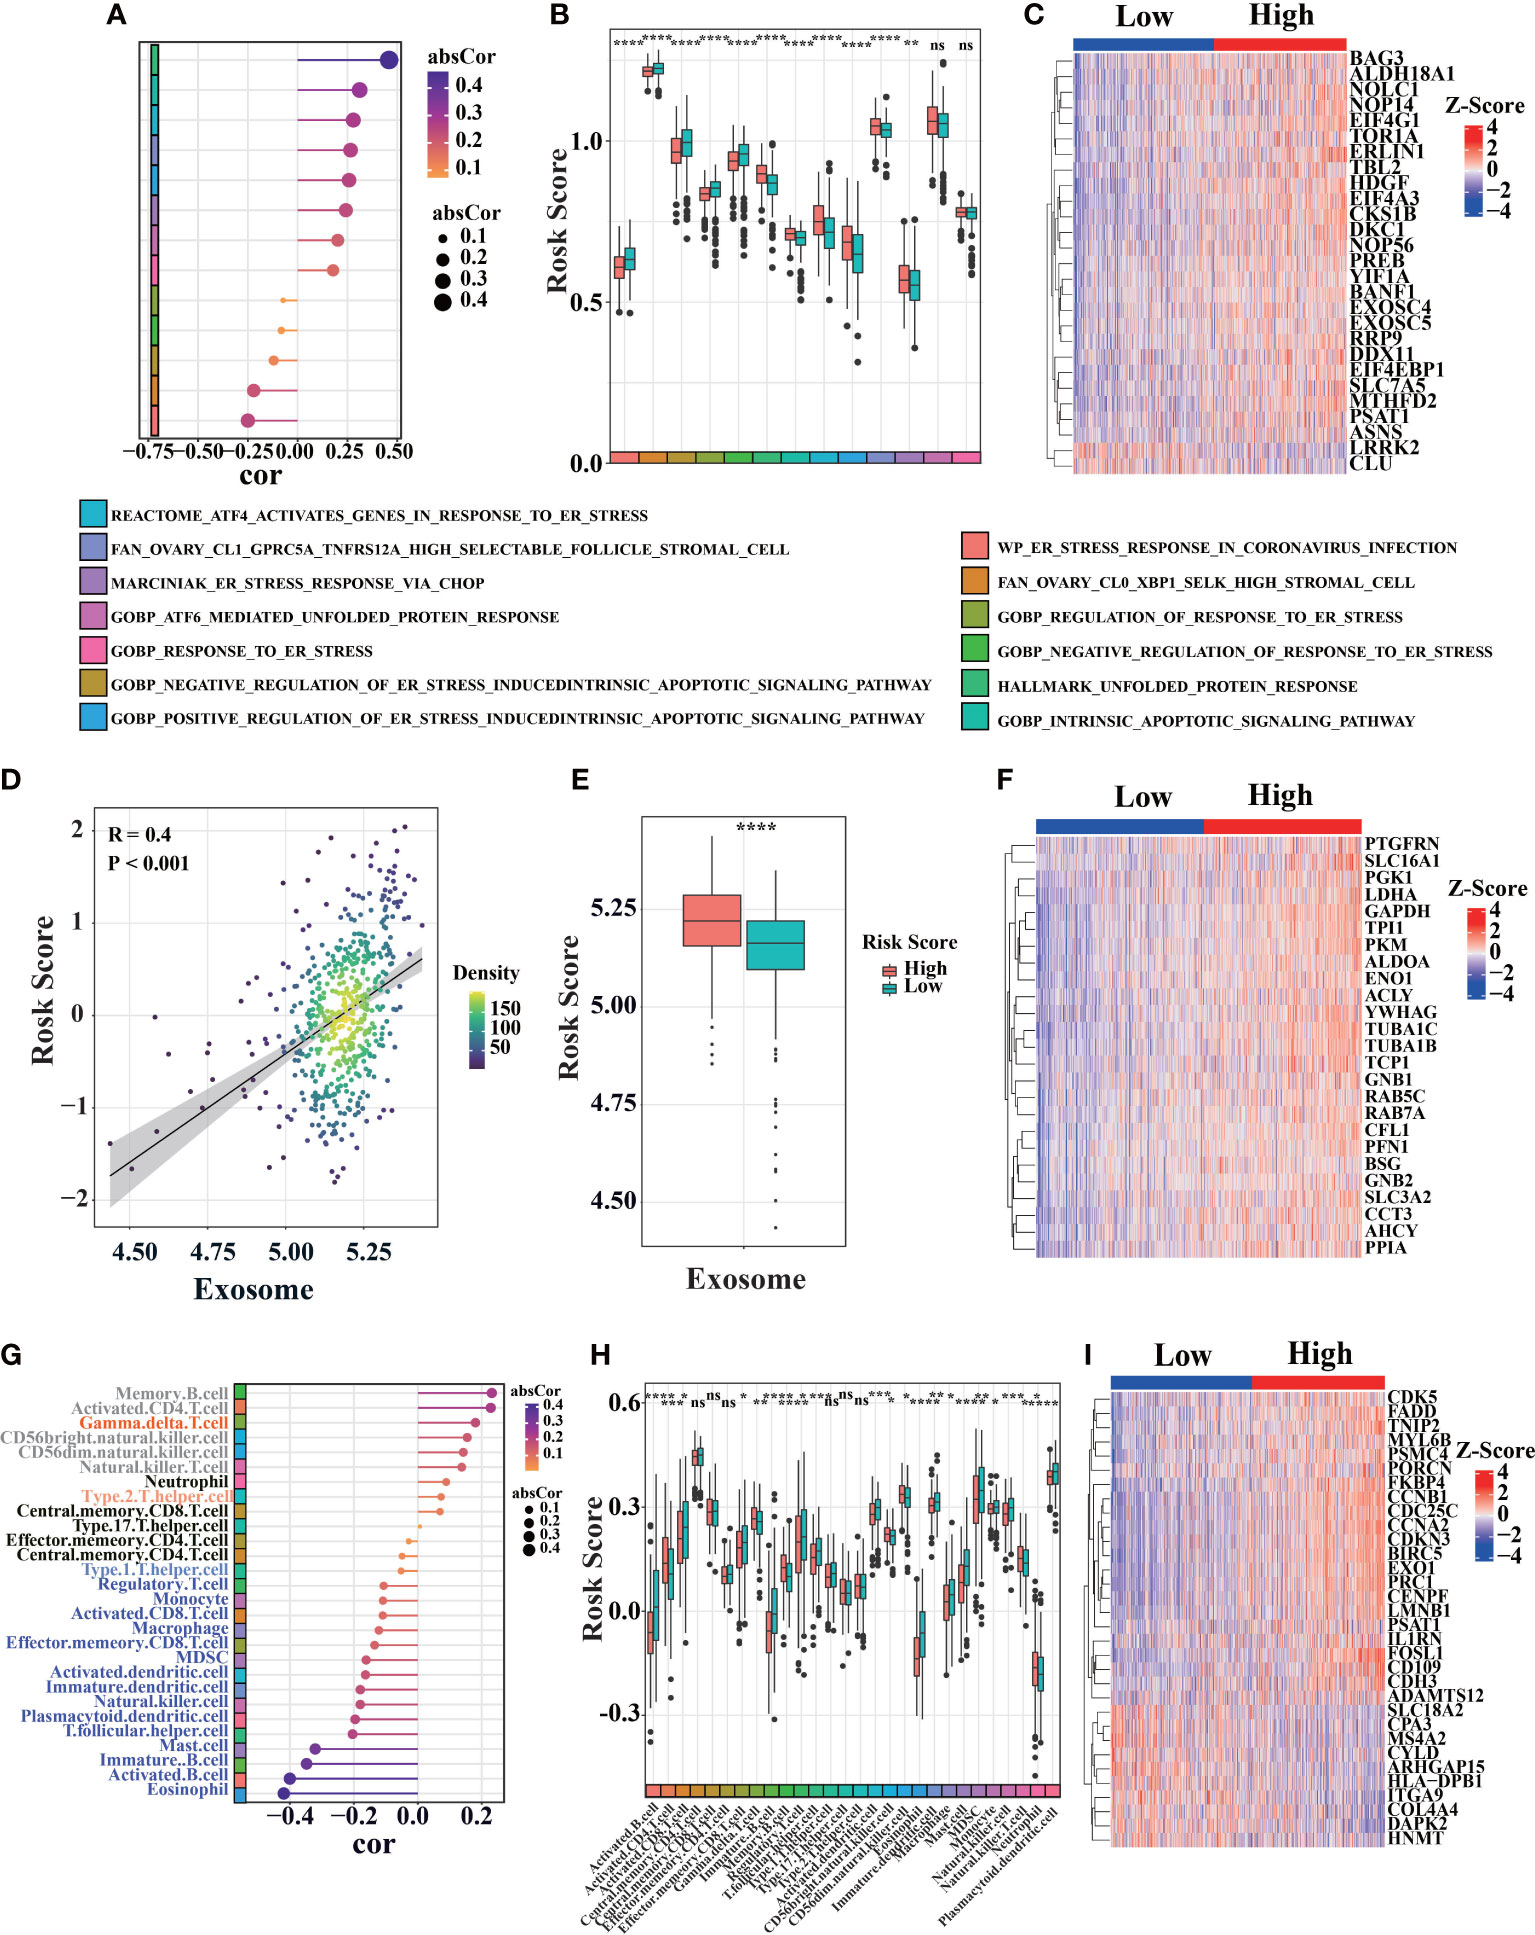
Figure 5 Bioprocess analysis base on prognosis signature. (A) Correlation diagram between risk score and ER stress-related gene set score (ssGSEA) in primary LUAD sample from TCGA cohort (n = 520). (B) Analyze ER stress-related gene set scores (ssGSEA) differences between high-risk and low-risk of primary LUAD samples in TCGA cohort. (C) Heat map of ER stress-related genes expression in LUAD patients from TCGA database. (D–F) The correlation between risk score and exosome associated score were analyzed similarly to the above ER stress pathway in TCGA cohort. (G–I) The correlation between risk score and different immune cell infiltration were analyzed similarly to the above ER stress pathway in TCGA cohort (the color block on the left represents different types of immune cells, the position indicates the magnitude of correlation coefficient, “ns” was non-significant, *P< 0.05, **P< 0.01, ***P< 0.001, ****P< 0.0001).
Meanwhile, we also found significant differences in exosome pathways. Compared with low-risk group, high-risk patients had higher exosome-related ssGSEA scores in TCGA (Figure 5D, additional data in GEO database, Figure S3). Cancer-derived exosome are implicated in various carcinogenesis processes, including malignant transformation, angiogenesis, immunosuppression, invasion, and treatment resistance (50, 51). There is also a significant correlation between exosome-related ssGSEA score and risk score in TCGA database (Figure 5E). Exosome-related genes also demonstrated different expression levels between two groups (Figure 5F). As a scaffold protein of exosomes, PTGFRN is positively correlated with risk score (Figures 5F, S3B) (52). In addition, we found that ALDOA, ENO1, YWHAG and SLC3A2 were positively correlated with risk scores (Figures 5F, S3C–F). Previous studies have shown that SLC3A2 has a higher level in lung cancer (53). Besides being the marker of exosomes, ALDOA, ENO1 and YWHAG can promote metastasis, invasion, activation and proliferation of lung cancer (54–56).
In addition, low-risk patients were correlated with significantly higher immune scores in TCGA cohort (Figure 5G). Immune cells, as shown in Figure 5H, were found to be significantly difference between high-risk and low-risk patients in TCGA database. By immune signatures, we discovered that low-risk patients had higher immune infiltration than high-risk patients. Assessment of immune-related gene expression profiles, the characteristic immune-related genes such as FADD were selected based on their expression patterns between LUAD and the adjacent non-tumorous samples in TCGA database. Then, we compared the expressions of those selected immune-related genes between LUAD patients with high and low risk score, it suggested that immune infiltration plays a vital role in prognosis in LUAD patients (Figure 5I).
Moreover, we found that mutation frequencies of genes with cancer development, such as TP53, significantly differed between high-risk and low-risk groups (Figure S5A). Compared to TP53, where mutations are randomly distributed, the distribution of KRAS is relatively focused on KRAS-G12 locus mutations (called hotspot, Figure S5B). The combined distribution of TP53 and KRAS-G12 mutation showed that most significant difference between high-risk and low-risk groups (Figure S5C). In addition, 10 genes of the prognostic signature may have TP53 binding sites in their untranslated regions (UTR, upstream and downstream 1 kb of a gene), indicating that TP53 mutations might directly affect transcription of these genes (Figure S5D). Therefore, GEM with Kras-G12D with or without TP53 deletion were utilized to evaluate the LUAD prognostic signature.
Three thousand eight hundred ninety-one high-quality, full-length single-cell transcriptomes from 39 KrasG12D/+Trp53- mutation mice, at 8 distinct LUAD evolution stages starting with normal alveolar type 2 cells (AT2) and ending with fully formed LUAD, were downloaded from GSE154989. Additionally, Seurat V4 was used for clustering cells (57) (Figures 6A, B). Stemness-related genes (Tight, Runx2, and NKX2-1) revealed that cells in cluster 1, 9, and 12 have high stemness (Figures 6C, S6A–C). After calculate risk score of different clusters (Figure 6D), we found cluster 1, 9, and 12 had higher risk scores, which was consistent with stemness-related genes in different clusters. Furthermore, the correlation between risk score and tumor progression is positive (Figures S6C–F).
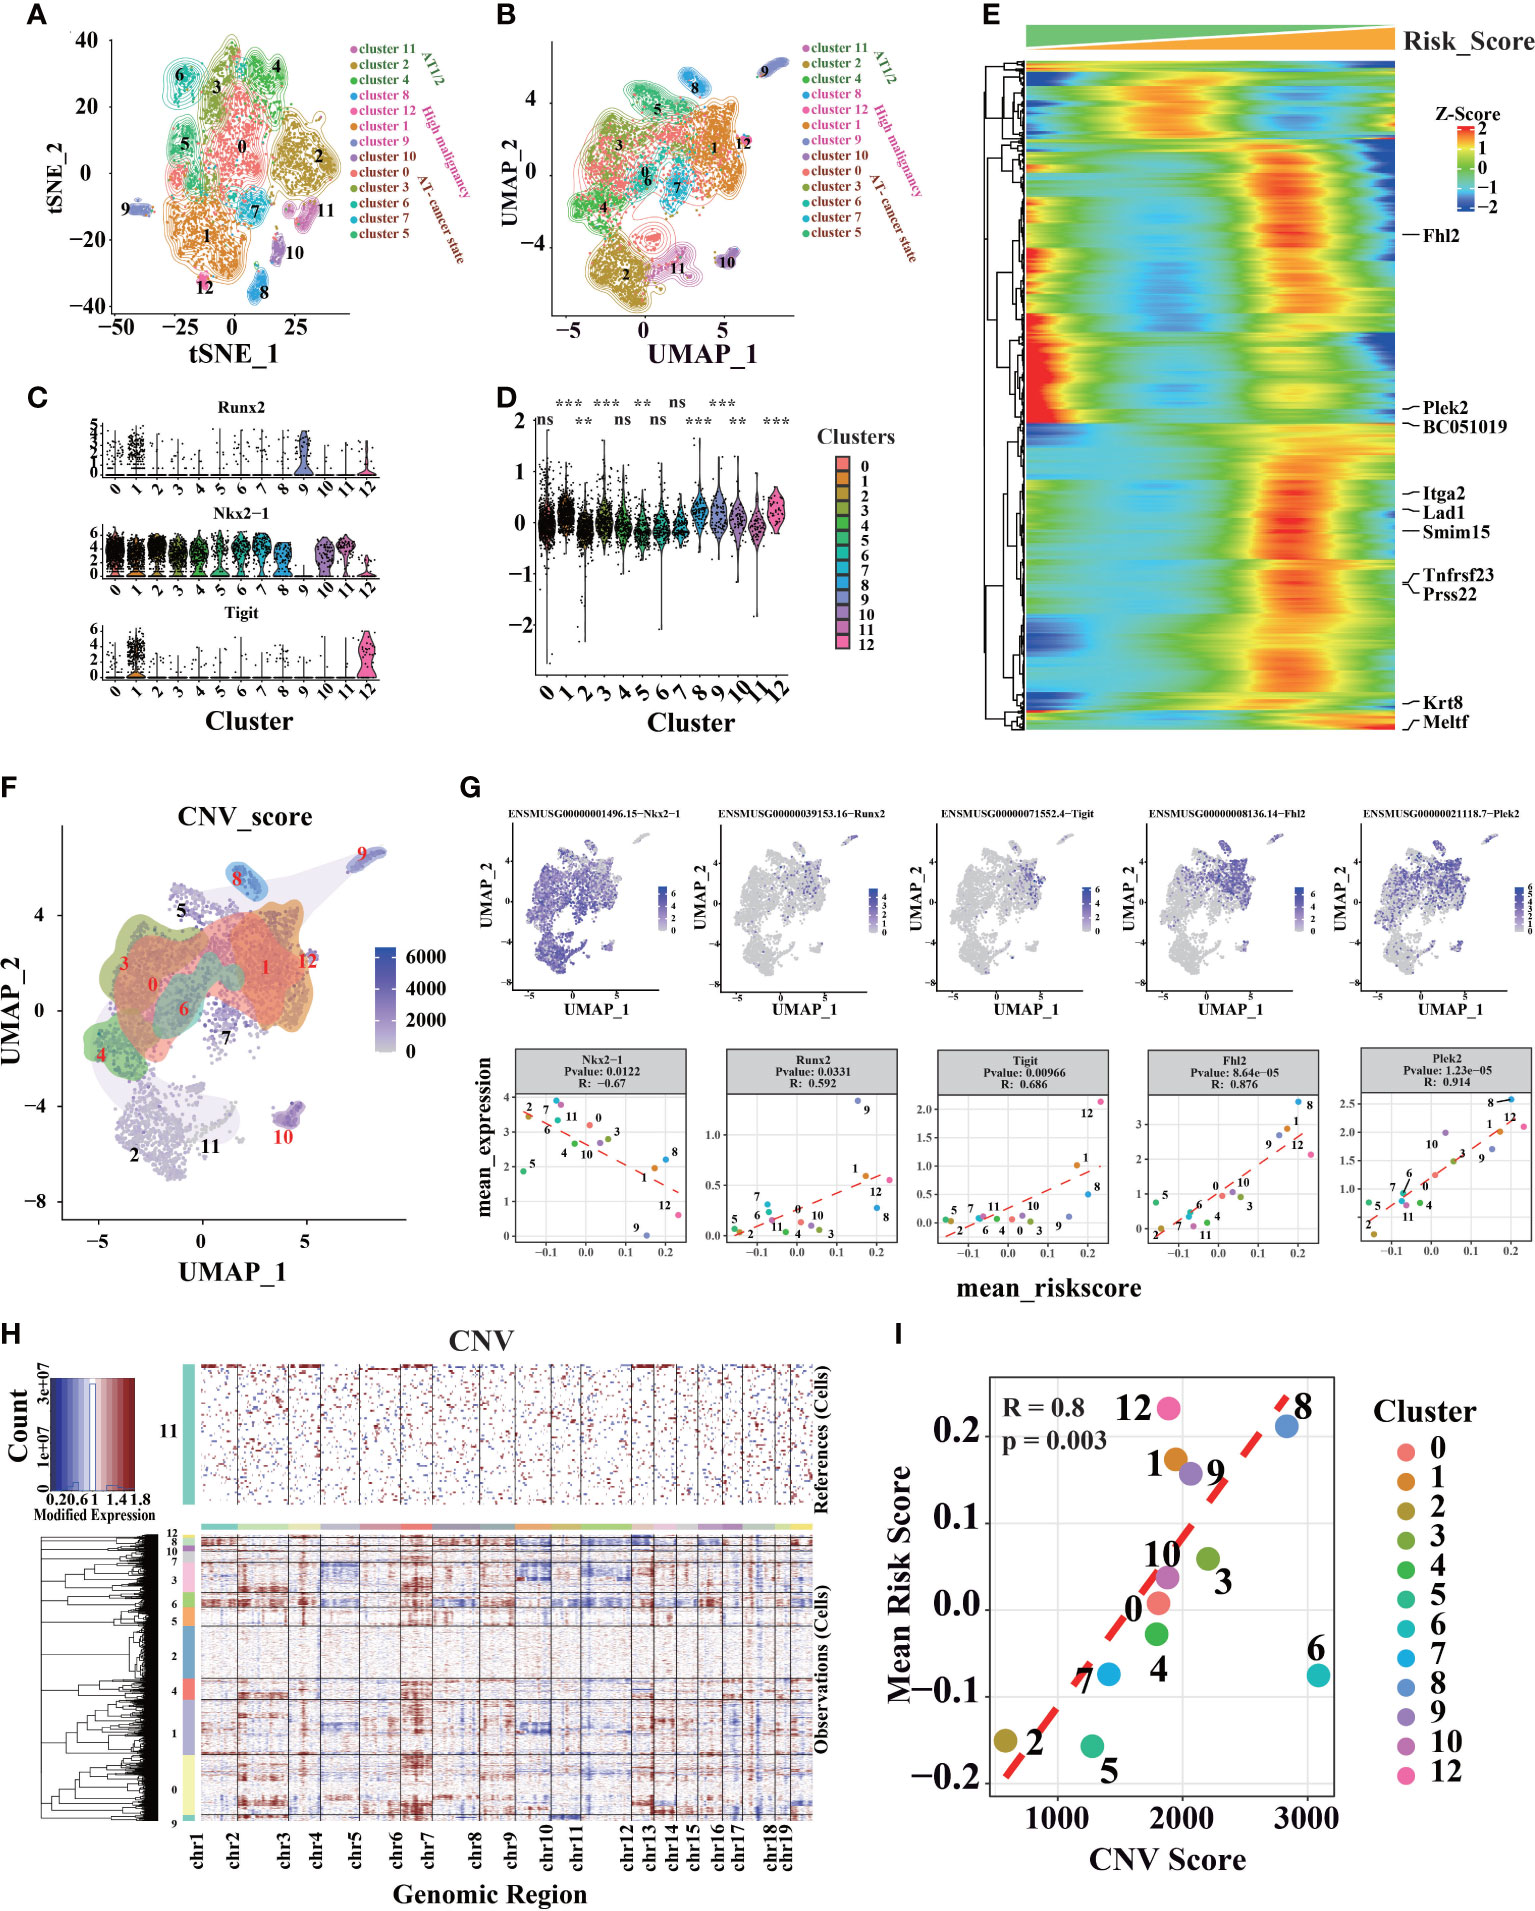
Figure 6 Different cell clusters identification and annotation in LUAD scRNA-seq data. (A) Seurat V4 was used to cluster and classify single cells, and t-SNE dimensional-reduction scatter diagram of sequencing data. (B) Sequencing data UMAP dimensional-reduction point scatter diagram. (C) Expression levels of genes associated with lung cancer development in different clusters. (D) The distribution of risk scores calculated by the prognostic signature in different cell clusters (“ns” is non-significant compared with cluster 11, *P< 0.05, **P< 0.01, ***P< 0.001, ****P< 0.0001). (E) genes associated with risk score (P.value< 10-25, the genes marked on the right are the 10 genes with the strongest correlation). (F) Distribution of CNV in UMAP dimensionality reduction map. (G) Genes associated with risk scores in scRNA-seq data. (H) InferCNV was used to predict the CNV of cells, and heat maps of the distribution of CNV of different chromatin of different cells. (I) Average CNV score and risk score points from different clusters are scattered figure.
However, we found that cluster 3, 8, and 10 also had higher risk scores than others (Figures 6D, S6G–J). Therefore, feature genes were identified to evaluate the model. Cluster 3 has a higher Vcan and Dcpp1, which involve cell adhesion, proliferation, migration, and angiogenesis, and plays a central role in tissue morphogenesis and maintenance (58, 59). Cluster 10 has a higher level of Ccnb1 and Top2a, which related to cell cycle and cell proliferation (60, 61). Cluster 8 has a higher level of Rn7sk, which was associated with Gastric Cancer (62) (Figure S6A). Fhl2, Plek2, and other cancer-related genes have a higher correlation coefficient with risk score (63–65) (Figure 6E). CNV was estimated using scRNA-seq data (Figure 6F) in contrast to cluster 11, as cluster 11 only appeared in the early stage of tumor progression (Figures S6B, C). Each cluster’s average risk score is associated with the average CNV score; for instance, malignant cells usually have serious CNV (Figures 6G–I). On the other hand, we found that CNV was higher in KP mice after 12 weeks (Figures S6K–M). It shows that the intracellular CNV accumulates with tumor progression, and tumor with higher CNV indicates a higher degree of malignancy, consistent with these results described through the risk score. Therefore, cells with higher risk scores have higher CNV and a higher degree of malignancy.
To proving the details of risk score in tumor microenvironment, AUCell calculated the score in ER stress and exosome-related gene sets by scRNA-seq data. As expected, ER stress scores (Figure 7A) and exosome scores (Figure 7B) were higher in cluster 1, 9, and 12, which have higher risk scores. There is also a high consistency between exosome score and risk score (Figure 7C), correlating with our earlier findings.
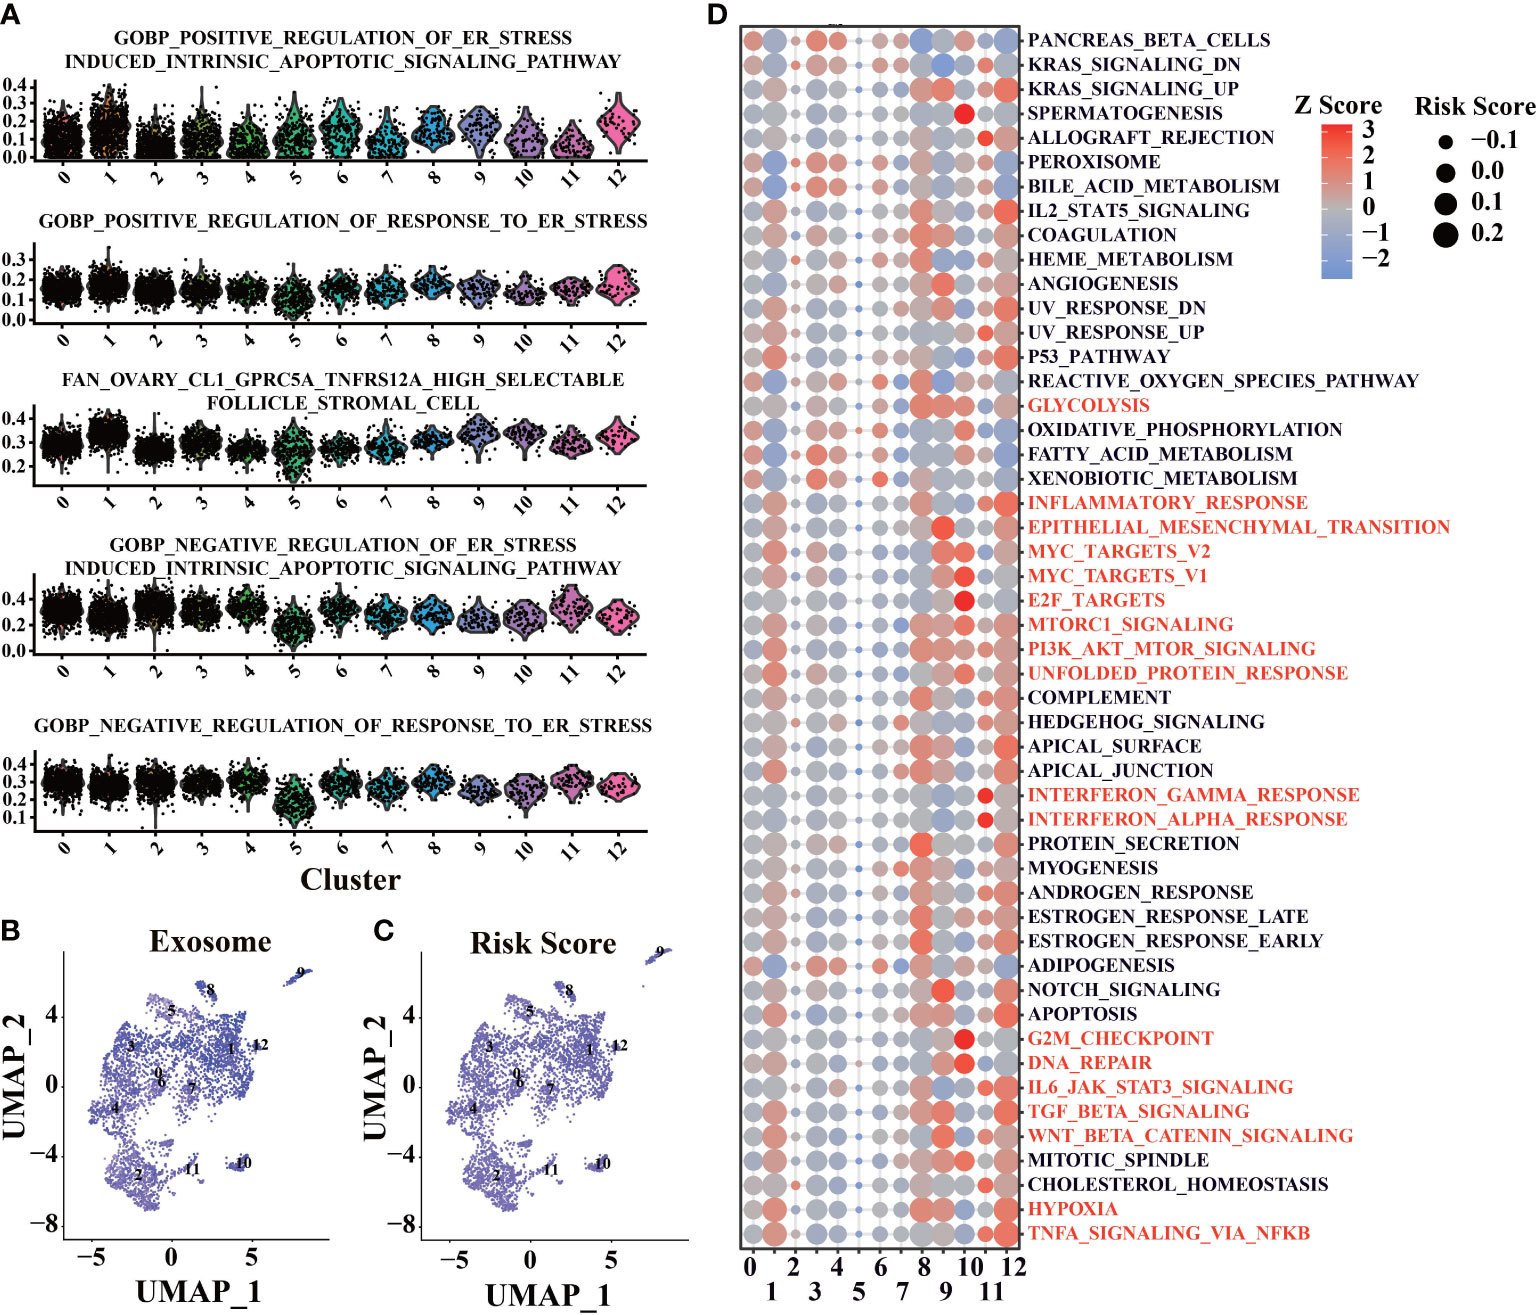
Figure 7 Functional enrichment of scRNA-seq base on the prognosis signature. (A) Enrichment analysis of ER stress-related gene sets was conducted by AUCell software. (B) Enrichment analysis of exosome related gene sets was conducted by AUCell software. (C) Use the prognostic signature to calculate the risk score of cells. (D) Enrichment analysis of tumor-associated Helmark gene sets was performed using AUCell.
Functional enrichment was performed in different clusters with hallmark gene sets to evaluate each cell’s biological process (Figure 7D). Cluster 10 has a higher activation of E2F targets and G2M checkpoint, leading to higher risk scores. Cluster 1, 8, 9, 10, and 12 have a higher level of PI3K-AKT-mTOR, which could lead to increased risk scores. Interestingly, cluster 11, which only appeared in the early stage of tumor progression, had higher risk scores than cluster 2, 5, and 6. It suggests that immune response in the early stage of LUAD could promote tumor progression (66) (Figure 7D). Cluster 8 and cluster 12, which have high-risk scores and mostly appeared in the middle stages of LUAD (12w and 18w, Figures S6C–F), showed more cellular response (such as IL2, IL6), and the abilities were lost with tumor progression, which could be related to the tumor progression (Figure 7D).
To explore the relationship between risk score and tumor progression, LUAD marker genes and lung epithelial marker genes were calculated (as “bioscore”) through UMAP to visualize tumor progression and compared with risk scores (Figure S7A). We found that LUAD-related markers were concentrated in high-risk regions, while more lung epithelial marker genes were concentrated in low-risk regions. The scRNA-seq data of different genotypes and experimental time were calculated using dimensionality reduction by UMAP. It was found that high-risk cells were concentrated in the region of KRAS and Trp53 mutations and mainly distributed in the late stage of the experiment. Meanwhile, cluster 1, 8, 9, and 12 were primarily distributed in the high-risk region. According to the pseudotime of Monocle V3, the region is also the accumulation of advanced LUAD cells (Figure S7B).
Furthermore, we found that risk score was positively correlated with most LUAD marker genes and negatively correlated with lung epithelial marker genes (Figure S7C). These results indicate that risk score can describe the development process of lung epithelial to LUAD cells.
For more details of tumor progression, high variable genes characterized by monocle V2 were used for estimating pseudotime. Cluster 11, which appeared in the early stage of LUAD, was set to the initial point of pseudotime (Figure 8A1). The minimum spanning tree, “Stemness” related genes downloaded from ‘Msigdb’, can also estimate pseudotime correctly (Figure 8A2). With tumor progression, malignant cells with strong stemness appear in LUAD, which have the potential for multi-directional differentiation, leading to intratumoral heterogeneity (67, 68). Therefore, LUAD progression should be considered in stemness levels by “Stemness” related genes (Figures S9, S10B). Igfbp5, Ros1 (54–56), and other genes related to tumor progression profoundly correlate with pseudotime (Figure 8B–D), meaning the minimum spanning tree and pseudotime can describe tumor progression in more detail. With the increase of pseudotime, the malignant degree of tumor and the proportion of high-risk cells also increased, indicating that the risk score model can reflect more advanced tumor progression (Figure 8A3). Notably, seven states have been classified by a minimum spanning tree (Figure 8A4). Previously, we found that cluster 1, cluster 8, cluster 9, and cluster 12 have higher risk scores. According to the clusters, states 6 and 7, located under branch 1, also have high-risk scores (Figures 8E–G and S8A).
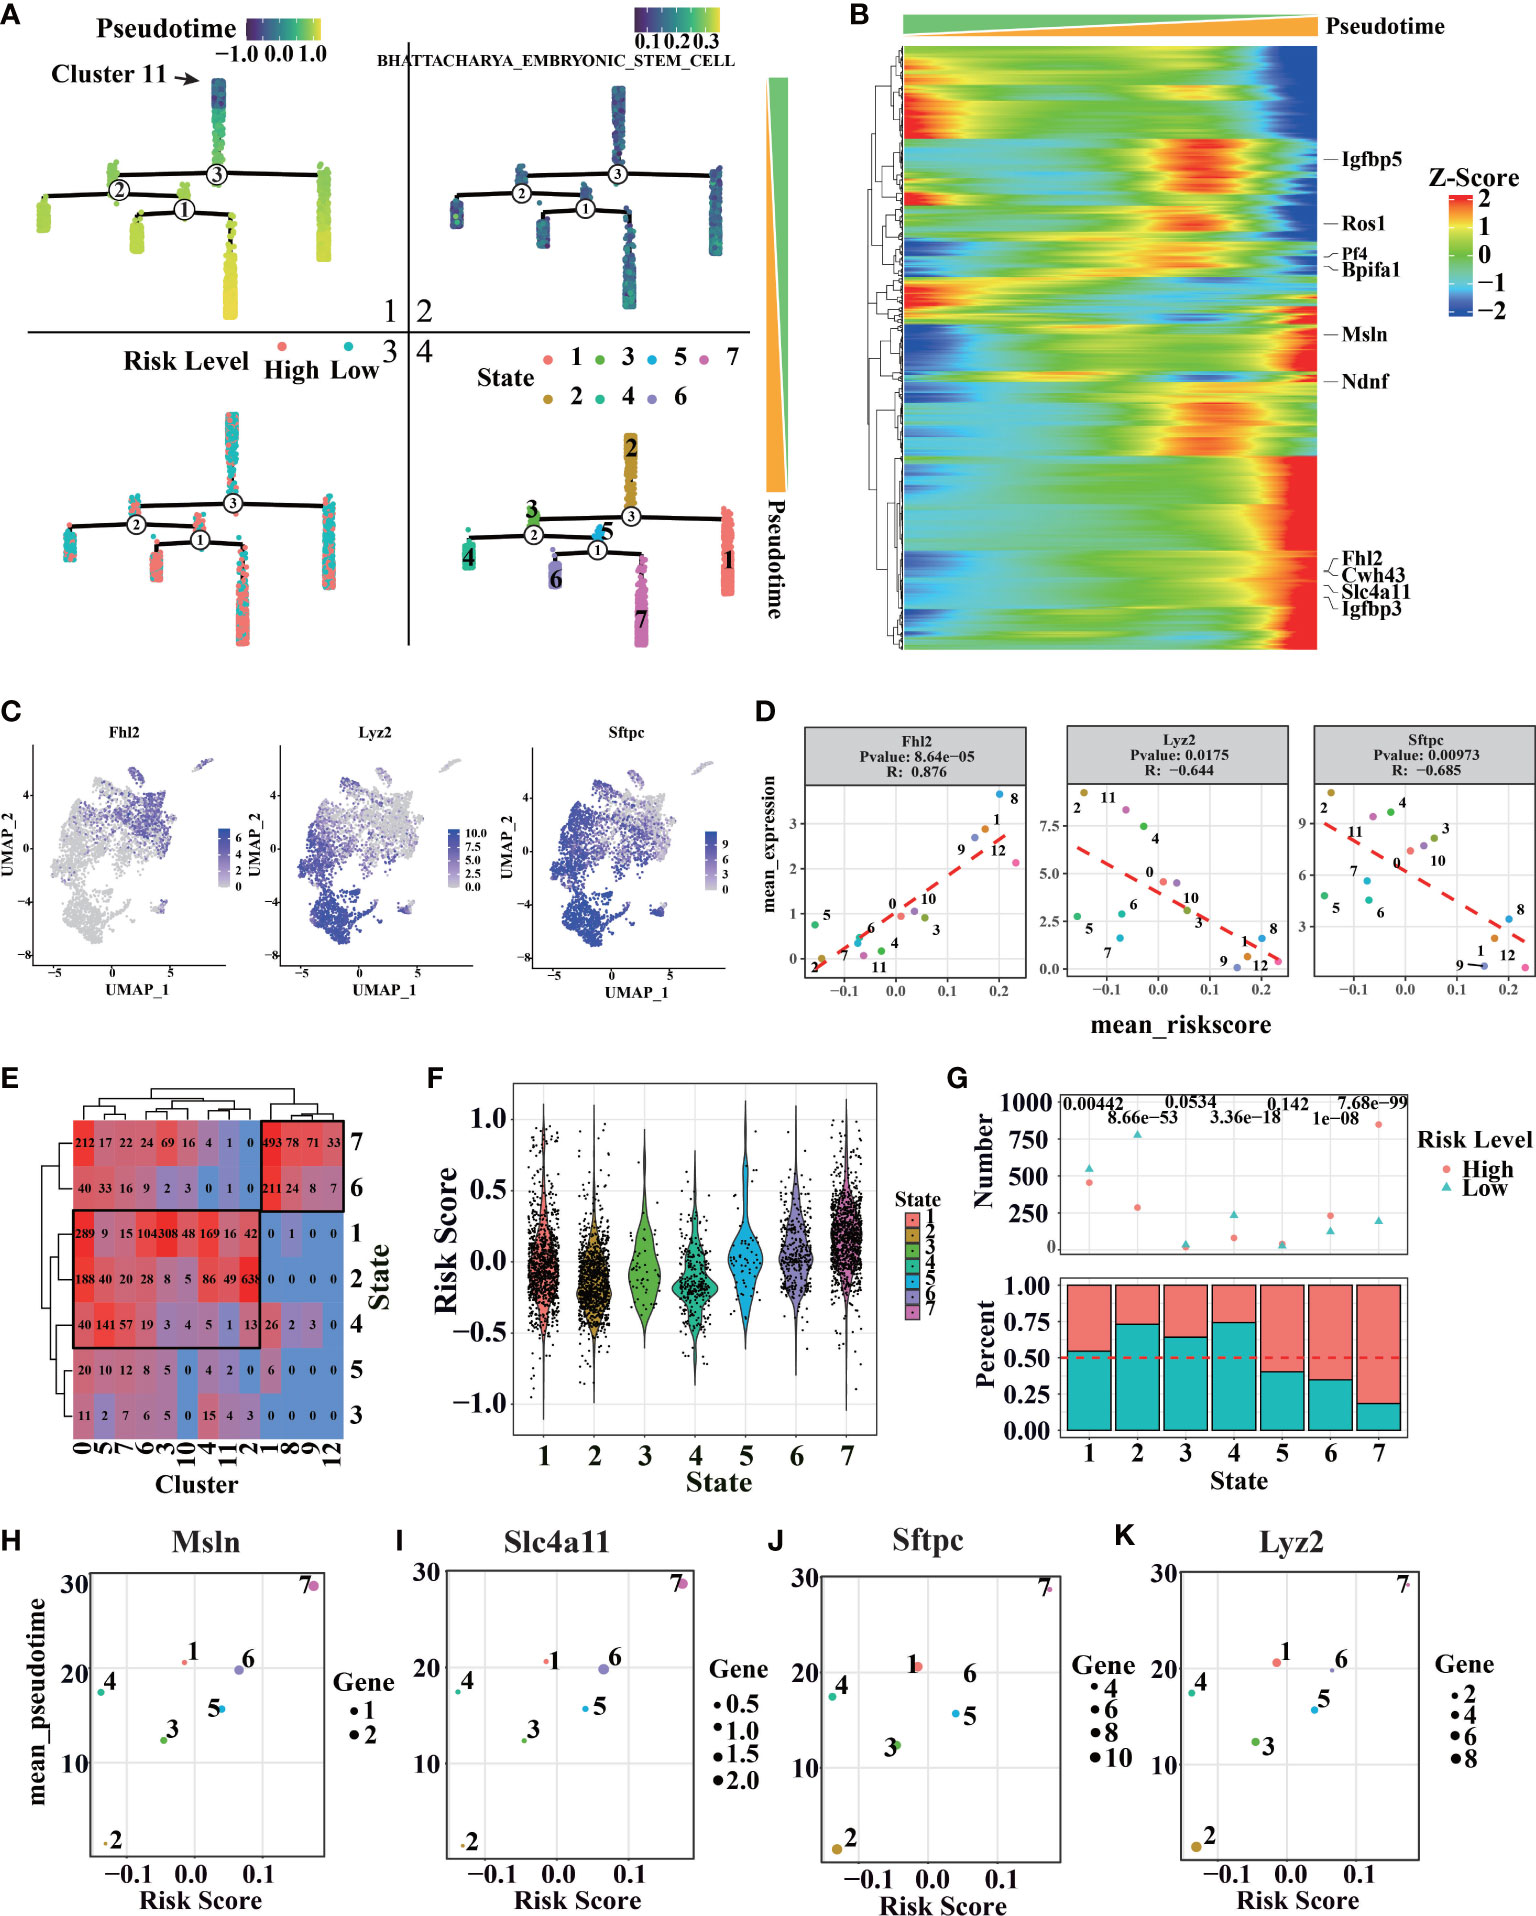
Figure 8 Cell trajectory and pseudotime analysis of LUAD by scRNA-seq. (A1) Distribution of pseudo-time values of different cells in the minimum spanning tree. (A2) The distribution of BHATTACHARYA_EMBRYONIC_STEM_CELL score in the minimum spanning tree. (A3) Distribution of risk rating in the minimum spanning tree. (A4) Distribution of different cell states in the minimum spanning tree. (B) Genes related to pseudo-time series, the genes marked on the right are the 10 genes with the strongest correlation. (C, D) Distribution and correlation of pseudo-time related genes and branching related genes. (E) The relationship between cell states and clusters in different pseudo-time series, the number represents the number of cells in the corresponding state. (F) Cell risk values corresponding to different quasi-sequential states. (G) Ratio of cell risk states corresponding to different pseudo temporal states (above: the top number represents the significance of binomial distribution test; below: the ratio of high-risk cells to low risk cells in each state). (H) Scatter plot of Msln expression mean and risk mean of cells in different states. (I) Scatter plot of Slc4a11 expression and risk score of cells in different states. (J) Scatter plot of Sftpc expression and risk score of cells in different states. (K) Scatter plot of Lyz2 expression average and risk average of cells in different states.
More pseudotime-related genes and branch-related genes were recognized (Figures 8B, S8C–E). Pseudotime related genes Msln and Slc4a11 can promote tumor progression (69, 70). Additionally, branch-related genes Sftpc and Lyz2, known as AT2 markers (19, 57), are shown as typical examples (Figures 8H–K, S10A). The genes can reflect tumor malignant degree and further describe the similarity and branching relationship in tumor clusters. So, we can infer that the AT2 cell features were missing with the cancer progress, accompanied by increased LUAD features (Figure S7). As we expect, the mean pseudotime and risk score of different states have a severe positive correlation. Interestingly, the mean expression of pseudotime-related genes and branch-related genes is used to clearly different states more clearly, showing some key points during tumor progression. Furthermore, a risk score can help us estimate the malignant of each state.
LUAD is a complex disease in which multiple pathways are involved in pathogenesis. Exploring a novel accurately prognostic biomarkers would help select patients for adjuvant chemotherapy and improve prognosis in early-stage lung cancer. We build a prognostic model in TCGA cohort by LASSO regression, which has excellent specificity and sensitivity for predicting OS. To identify whether risk score as an independent predictor of survival time, univariate and multivariable cox proportional hazards regression was analyzed in LUAD patients. After controlling for confounding variables (including age, gender, invasion depth, distant metastasis, lymph node metastasis, and TNM stage), the model remained statistically significant for OS. The model can be an independent factor with better predictive potential than the pathological stage alone.
Several factors have been proved to be related to tumor progression; however, only hypoxia and glycolysis were highly associated with LUAD prognosis (71, 72). Here, we found risk score was related to several biological processes like epithelial-mesenchymal transition, ECM, glycolysis, and proliferation, which were involved in tumor progression. The prognostic model could reveal the critical elements involved in tumor microenvironments. More details about ER stress, exosome, and immune response, which play essential roles in tumor progression, were researched, and we found that risk score relates to these biological phenomena. The prognostic differences between high and low-risk groups could be explained by the critical elements involved in tumor microenvironments (71, 72). Recently, cancer-released exosomes could modify the distant microenvironment to a pre-metastatic niche to facilitate the formation of metastatic lesions, suggesting that cancer exosomes could result in both local and distant effects (73, 74), including malignant transformation, angiogenesis, immunosuppression, invasion, and treatment resistance (51, 75). The unfavorable intratumoral microenvironment, such as nutrient deficiency, hypoxia, high metabolic demand, oxidative stress, and unfolded protein response, can also ultimately induce ER stress, enhancing tumorigenicity, metastasis, and tumor drug resistance. It is reported that ER stress regulates proliferation, migration, and invasion through active c-Myc signaling and PI3K/AKT/mTOR signaling pathways, and mediated anti-tumor immune responses by inducing immunosuppressive microenvironment (76–78). We found that low-risk patients correlated with a significantly higher immune score in TCGA cohort, and immune cell populations are different between high-risk and low-risk patients in TCGA database. Therefore, risk score could be used to evaluate immune infiltration in LUAD patients, which may be useful for immune-targeted tumor therapy. It is well known that tumor microenvironment can be classified into two immunophenotypes based on their degree of immune infiltrations, hot tumors with high immune infiltration and cold tumors with low immune cell infiltration (79, 80). Low-risk patients with a high immune score suggest the presence of a hot tumor microenviroment, those patients could benefit more from immune-targeted therapy than high-risk patients with cold tumor microenviroment. However, further studies are still needed to confirm the prognostic value of risk score in determining hot/cold tumors.
By previous studies, we found some prognostic signatures may have poor repeatability due to insufficient sample size (81, 82). One limitation of this study is the relatively small sample and the poor quality of the GEO cohort, which was used to verify the prognostic signature. To address this issue, we have used multiple GEO cohorts to further verify the prediction performance of the prognostic signature. Further, tumor progression can also be influenced by complex and dynamic features in tumor surroundings, which means a model based on several gene sets may lead to bias. To develop a good prediction model for OS, GEM were used to test the model in different dimension through scRNA-seq data. By single-cell clustering, stemness-related genes (Tight, Runx2, and NKX2-1) revealed that cells in cluster 1, 9, and 12 have high stemness. Tight, a marker of high-plasticity cell, shows high proliferative potential and can be induced chemoresistance (57). Runx2 can drive the metastatic phenotype in the primary tumors, and NKX2-1 also shows the same consequence (83–85). Furthermore, the correlation between risk score and tumor progression is positive. According to tumor-related feature genes, we found that clusters 3, 8, and 10 also have higher risk scores than other clusters. Cluster 3 was involved in cell adhesion, proliferation, migration, and angiogenesis and played a central role in tissue morphogenesis and maintenance (58, 59). Cluster 10 has a higher level of cell cycle and cell proliferation (60, 61), and cluster 8 was related to Gastric Cancer (62). In conclusion, we found that the higher risk score, the higher degree of malignancy. In addition, risk score in each cluster is associated with average CNV score, such as malignant clusters usually have serious CNV. However, cluster 6 has a lower risk score and higher CNV level, which might be induced by intratumoral heterogeneity.
Furthermore, we found that risk score was related to tumor progression calculated by Monocle. Minimum spanning tree has been applied to describe LUAD progression, which was confirmed by enrichment analysis on ‘BHATTACHARYA EMBRYONIC STEM CELL’ collected from Msigdb (86). With the advancement of LUAD, risk score and the proportion of high-risk cells were increasing. We also notice that cells under branch2 (cells in stat6 and stat7) show higher risk scores. Moreover, we found several AT2 marker genes (Sftpc and Lyz2) at the branch2, which means that branch2 is a crucial point for LUAD progression. As we expect, the pseudotime and risk score of different states have a severe positive correlation. Interestingly, pseudotime-related genes and branch-related genes is used to clearly different states more clearly, showing some key points during tumor progression. Overall, the risk score was in accordance with the grade malignancy in each cluster, which was annotated by feature genes, pathways related to tumor progress, CNVs and genotype, and growth time of GEM. Based on this, our follow-up research will focus on clinical application and molecular mechanisms.
In conclusion, the study established a risk scoring model, which can be used as an independent prognostic signature to accurately evaluate the prognosis of LUAD patients. Compared with traditional clinical indicators, the model has higher accuracy and stability, and can provide guidance for follow-up treatment. The prognostic signature related to several biological processes, which may reveal the key molecular mechanisms in tumor development.
The datasets presented in this study can be found in online repositories. The names of the repository/repositories and accession number(s) can be found in the article/Supplementary Material.
ZL, TZ and WY conceived and designed the study. ZL drafted the entire manuscript. TZ is responsible for LUAD patient data acquisition and bioinformatics support. ZL and CZ participated in figures and table preparation. WY and YC reviewed and revised the manuscript. TZ and CZ guided the selection of statistical methods. WY and YC supervised the project. All authors contributed to the article and approved the submitted version.
This project was sponsored by the Natural Science Fund of China (81673462, 82073916, 81874452, and 91540119) and the Key development project of Jiangsu Province (BE2017712).
The authors thank AiMi Academic Services (www.aimieditor.com) for the English language editing and review services. In addition, ZL would like to thank Lan Zhang for the ongoing and unwavering support, patience, and love.
The authors declare that the research was conducted in the absence of any commercial or financial relationships that could be construed as a potential conflict of interest.
All claims expressed in this article are solely those of the authors and do not necessarily represent those of their affiliated organizations, or those of the publisher, the editors and the reviewers. Any product that may be evaluated in this article, or claim that may be made by its manufacturer, is not guaranteed or endorsed by the publisher.
The Supplementary Material for this article can be found online at: https://www.frontiersin.org/articles/10.3389/fonc.2022.1019442/full#supplementary-material
1. Siegel RL, Miller KD, Fuchs HE, Jemal A. Cancer statistics, 2022. CA Cancer J Clin (2022) 72(1):7–33. doi: 10.3322/caac.21708
2. Shi J, Hua X, Zhu B, Ravichandran S, Wang M, Nguyen C, et al. Somatic genomics and clinical features of lung adenocarcinoma: A retrospective study. PloS Med (2016) 13(12):e1002162. doi: 10.1371/journal.pmed.1002162
3. Goldstraw P, Crowley J, Chansky K, Giroux DJ, Groome PA, Rami-Porta R, et al. The iaslc lung cancer staging project: Proposals for the revision of the tnm stage groupings in the forthcoming (Seventh) edition of the tnm classification of malignant tumours. J Thorac Oncol (2007) 2(8):706–14. doi: 10.1097/JTO.0b013e31812f3c1a
4. Guerrera F, Errico L, Evangelista A, Filosso PL, Ruffini E, Lisi E, et al. Exploring stage I non-Small-Cell lung cancer: Development of a prognostic model predicting 5-year survival after surgical resection†. Eur J Cardiothorac Surg (2015) 47(6):1037–43. doi: 10.1093/ejcts/ezu410
5. Zhu CQ, Pintilie M, John T, Strumpf D, Shepherd FA, Der SD, et al. Understanding prognostic gene expression signatures in lung cancer. Clin Lung Cancer (2009) 10(5):331–40. doi: 10.3816/CLC.2009.n.045
6. Subramanian J, Simon R. Gene expression-based prognostic signatures in lung cancer: Ready for clinical use? J Natl Cancer Inst (2010) 102(7):464–74. doi: 10.1093/jnci/djq025
7. Li Y, Sun N, Lu Z, Sun S, Huang J, Chen Z, et al. Prognostic alternative mrna splicing signature in non-small cell lung cancer. Cancer Lett (2017) 393:40–51. doi: 10.1016/j.canlet.2017.02.016
8. Kadara H, Behrens C, Yuan P, Solis L, Liu D, Gu X, et al. A five-gene and corresponding protein signature for stage-I lung adenocarcinoma prognosis. Clin Cancer Res (2011) 17(6):1490–501. doi: 10.1158/1078-0432.Ccr-10-2703
9. Lu Y, Lemon W, Liu PY, Yi Y, Morrison C, Yang P, et al. A gene expression signature predicts survival of patients with stage I non-small cell lung cancer. PloS Med (2006) 3(12):e467. doi: 10.1371/journal.pmed.0030467
10. Genome Atlas Research Network. Comprehensive Molecular Profiling of Lung Adenocarcinoma. Nature (2014) 511(7511):543–50. doi: 10.1038/nature13385
11. Larsen JE, Minna JD. Molecular biology of lung cancer: Clinical implications. Clin Chest Med (2011) 32(4):703–40. doi: 10.1016/j.ccm.2011.08.003
12. Popper HH. Progression and metastasis of lung cancer. Cancer Metastasis Rev (2016) 35(1):75–91. doi: 10.1007/s10555-016-9618-0
13. Sutherland KD, Song JY, Kwon MC, Proost N, Zevenhoven J, Berns A. Multiple cells-of-Origin of mutant K-Ras-Induced mouse lung adenocarcinoma. Proc Natl Acad Sci U.S.A. (2014) 111(13):4952–7. doi: 10.1073/pnas.1319963111
14. Desai TJ, Brownfield DG, Krasnow MA. Alveolar progenitor and stem cells in lung development, renewal and cancer. Nature (2014) 507(7491):190–4. doi: 10.1038/nature12930
15. Patel AP, Tirosh I, Trombetta JJ, Shalek AK, Gillespie SM, Wakimoto H, et al. Single-cell rna-seq highlights intratumoral heterogeneity in primary glioblastoma. Science (2014) 344(6190):1396–401. doi: 10.1126/science.1254257
16. Jackson EL, Olive KP, Tuveson DA, Bronson R, Crowley D, Brown M, et al. The differential effects of mutant P53 alleles on advanced murine lung cancer. Cancer Res (2005) 65(22):10280–8. doi: 10.1158/0008-5472.Can-05-2193
17. Jackson EL, Willis N, Mercer K, Bronson RT, Crowley D, Montoya R, et al. Analysis of lung tumor initiation and progression using conditional expression of oncogenic K-ras. Genes Dev (2001) 15(24):3243–8. doi: 10.1101/gad.943001
18. Tirosh I, Venteicher AS, Hebert C, Escalante LE, Patel AP, Yizhak K, et al. Single-cell rna-seq supports a developmental hierarchy in human oligodendroglioma. Nature (2016) 539(7628):309–13. doi: 10.1038/nature20123
19. Nabhan AN, Brownfield DG, Harbury PB, Krasnow MA, Desai TJ. Single-cell wnt signaling niches maintain stemness of alveolar type 2 cells. Science (2018) 359(6380):1118–23. doi: 10.1126/science.aam6603
20. Tirosh I, Izar B, Prakadan SM, Wadsworth MH 2nd, Treacy D, Trombetta JJ, et al. Dissecting the multicellular ecosystem of metastatic melanoma by single-cell rna-seq. Science (2016) 352(6282):189–96. doi: 10.1126/science.aad0501
21. Mounir M, Lucchetta M, Silva TC, Olsen C, Bontempi G, Chen X, et al. New functionalities in the tcgabiolinks package for the study and integration of cancer data from gdc and gtex. PloS Comput Biol (2019) 15(3):e1006701. doi: 10.1371/journal.pcbi.1006701
22. Davis S, Meltzer PS. Geoquery: A bridge between the gene expression omnibus (Geo) and bioconductor. Bioinformatics (2007) 23(14):1846–7. doi: 10.1093/bioinformatics/btm254
23. Carlson M, Falcon S, Pages H, Li N. Hgu133plus2. db: Affymetrix human genome U133 plus 2.0 array annotation data (Chip Hgu133plus2). R Package version 323 (2016) 3(3). Available at: https://bioconductor.org/packages/release/data/annotation/html/hgu133plus2.db.html
24. Ritchie ME, Phipson B, Wu D, Hu Y, Law CW, Shi W, et al. Limma powers differential expression analyses for rna-sequencing and microarray studies. Nucleic Acids Res (2015) 43(7):e47. doi: 10.1093/nar/gkv007
25. Lin H, Zelterman D. Modeling survival data: Extending the cox model. Technometrics (2000) 44(1):85–6. doi: 10.1198/tech.2002.s656
26. Simon N, Friedman J, Hastie T, Tibshirani R. Regularization paths for cox’s proportional hazards model Via coordinate descent. J Stat Softw (2011) 39(5):1. doi: 10.18637/jss.v039.i05
27. Blanche P, Dartigues JF, Jacqmin-Gadda H. Estimating and comparing time-dependent areas under receiver operating characteristic curves for censored event times with competing risks. Stat Med (2013) 32(30):5381–97. doi: 10.1002/sim.5958
28. Liberzon A, Subramanian A, Pinchback R, Thorvaldsdóttir H, Tamayo P, Mesirov JP. Molecular signatures database (Msigdb) 3.0. Bioinformatics (2011) 27(12):1739–40. doi: 10.1093/bioinformatics/btr260
29. Keerthikumar S, Chisanga D, Ariyaratne D, Al Saffar H, Anand S, Zhao K, et al. Exocarta: A web-based compendium of exosomal cargo. J Mol Biol (2016) 428(4):688–92. doi: 10.1016/j.jmb.2015.09.019
30. Mathivanan S, Simpson RJ. Exocarta: A compendium of exosomal proteins and RNA. Proteomics (2009) 9(21):4997–5000. doi: 10.1002/pmic.200900351
31. Hänzelmann S, Castelo R, Guinney J. Gsva: Gene set variation analysis for microarray and rna-seq data. BMC Bioinf (2013) 14(1):1–15. doi: 10.1186/1471-2105-14-7
32. Yu G, Wang L-G, Han Y, He Q-Y. Clusterprofiler: An r package for comparing biological themes among gene clusters. Omics (2012) 16(5):284–7. doi: 10.1089/omi.2011.0118
33. Rooney MS, Shukla SA, Wu CJ, Getz G, Hacohen N. Molecular and genetic properties of tumors associated with local immune cytolytic activity. Cell (2015) 160(1-2):48–61. doi: 10.1016/j.cell.2014.12.033
34. Barbie DA, Tamayo P, Boehm JS, Kim SY, Moody SE, Dunn IF, et al. Systematic RNA interference reveals that oncogenic kras-driven cancers require Tbk1. Nature (2009) 462(7269):108–12. doi: 10.1038/nature08460
35. Hao Y, Hao S, Andersen-Nissen E, Mauck Iii WM, Zheng S, Butler A, et al. Integrated analysis of multimodal single-cell data. Cell (2021) 184(13):3573–87. doi: 10.1016/j.cell.2021.04.048
36. Stuart T, Butler A, Hoffman P, Hafemeister C, Papalexi E, Mauck Iii WM, et al. Comprehensive integration of single-cell data. Cell (2019) 177(7):1888–902. doi: 10.1016/j.cell.2019.05.031
37. Satija R, Farrell JA, Gennert D, Schier AF, Regev A. Spatial reconstruction of single-cell gene expression data. Nat Biotechnol (2015) 33(5):495–502. doi: 10.1038/nbt.3192
38. Macosko EZ, Basu A, Satija R, Nemesh J, Shekhar K, Goldman M, et al. Highly parallel genome-wide expression profiling of individual cells using nanoliter droplets. Cell (2015) 161(5):1202–14. doi: 10.1016/j.cell.2015.05.002
39. Aibar S, González-Blas CB, Moerman T, Huynh-Thu VA, Imrichova H, Hulselmans G, et al. Scenic: Single-cell regulatory network inference and clustering. Nat Methods (2017) 14(11):1083–6. doi: 10.1038/nmeth.4463
40. Tickle T, Tirosh I, Georgescu C, Brown M, Haas B. Infercnv of the trinity ctat project. Cambridge, Ma, USA: Klarman Cell Observatory, Broad Institute of Mit and Harvard (2019). Available at: https://github.com/broadinstitute/inferCNV.
41. Trapnell C, Cacchiarelli D, Grimsby J, Pokharel P, Li S, Morse M, et al. The dynamics and regulators of cell fate decisions are revealed by pseudotemporal ordering of single cells. Nat Biotechnol (2014) 32(4):381–6. doi: 10.1038/nbt.2859
42. Kim EY, Kim A, Kim SK, Kim HJ, Chang J, Ahn CM, et al. Inhibition of Mtorc1 induces loss of e-cadherin through Akt/Gsk-3β signaling-mediated upregulation of e-cadherin repressor complexes in non-small cell lung cancer cells. Resp Res (2014) 15(1):26. doi: 10.1186/1465-9921-15-26
43. Tulchinsky E, Demidov O, Kriajevska M, Barlev NA, Imyanitov E. Emt: A mechanism for escape from egfr-targeted therapy in lung cancer. BBA-Rev Cancer (2019) 1871(1):29–39. doi: 10.1016/j.bbcan.2018.10.003
44. Baudino TA, McKay C, Pendeville-Samain H, Nilsson JA, Maclean KH, White EL, et al. C-myc is essential for vasculogenesis and angiogenesis during development and tumor progression. Genes Dev (2002) 16(19):2530–43. doi: 10.1101/gad.1024602
45. De Bock K, Georgiadou M, Schoors S, Kuchnio A, Wong Brian W, Cantelmo Anna R, et al. Role of Pfkfb3-driven glycolysis in vessel sprouting. Cell (2013) 154(3):651–63. doi: 10.1016/j.cell.2013.06.037
46. He G, Peng X, Wei S, Yang S, Li X, Huang M, et al. Exosomes in the hypoxic tme: From release, uptake and biofunctions to clinical applications. Mol Cancer (2022) 21(1):19. doi: 10.1186/s12943-021-01440-5
47. Tsukumo Y, Tsukahara S, Furuno A, Iemura S, Natsume T, Tomida A. Tbl2 is a novel perk-binding protein that modulates stress-signaling and cell survival during endoplasmic reticulum stress. PloS One (2014) 9(11):e112761. doi: 10.1371/journal.pone.0112761
48. Yamaguchi S, Ishihara H, Yamada T, Tamura A, Usui M, Tominaga R, et al. Atf4-mediated induction of 4e-Bp1 contributes to pancreatic beta cell survival under endoplasmic reticulum stress. Cell Metab (2008) 7(3):269–76. doi: 10.1016/j.cmet.2008.01.008
49. Martindale JL, Holbrook NJ. Cellular response to oxidative stress: Signaling for suicide and survival. J Cell Physiol (2002) 192(1):1–15. doi: 10.1002/jcp.10119
50. Kalluri R. The biology and function of exosomes in cancer. J Clin Invest (2016) 126(4):1208–15. doi: 10.1172/JCI81135
51. Muller L, Simms P, Hong C-S, Nishimura MI, Jackson EK, Watkins SC, et al. Human tumor-derived exosomes (Tex) regulate treg functions Via cell surface signaling rather than uptake mechanisms. OncoImmunology (2017) 6(8):e1261243. doi: 10.1080/2162402X.2016.1261243
52. Dooley K, McConnell RE, Xu K, Lewis ND, Haupt S, Youniss MR, et al. A versatile platform for generating engineered extracellular vesicles with defined therapeutic properties. Mol Ther (2021) 29(5):1729–43. doi: 10.1016/j.ymthe.2021.01.020
53. Pan D, Chen J, Feng C, Wu W, Wang Y, Tong J, et al. Preferential localization of Muc1 glycoprotein in exosomes secreted by non-small cell lung carcinoma cells. Int J Mol Sci (2019) 20(2):12. doi: 10.3390/ijms20020323
54. Wang C, Xu J, Yuan D, Bai Y, Pan Y, Zhang J, et al. Exosomes carrying aldoa and Aldh3a1 from irradiated lung cancer cells enhance migration and invasion of recipients by accelerating glycolysis. Mol Cell Biochem (2020) 469(1-2):77–87. doi: 10.1007/s11010-020-03729-3
55. Greening DW, Ji H, Chen M, Robinson BW, Dick IM, Creaney J, et al. Secreted primary human malignant mesothelioma exosome signature reflects oncogenic cargo. Sci Rep (2016) 6:32643. doi: 10.1038/srep32643
56. Wen J, Ma Z, Livingston MJ, Zhang W, Yuan Y, Guo C, et al. Decreased secretion and profibrotic activity of tubular exosomes in diabetic kidney disease. Am J Physiol Renal Physiol (2020) 319(4):F664–f73. doi: 10.1152/ajprenal.00292.2020
57. Marjanovic ND, Hofree M, Chan JE, Canner D, Wu K, Trakala M, et al. Emergence of a high-plasticity cell state during lung cancer evolution. Cancer Cell (2020) 38(2):229–46. doi: 10.1016/j.ccell.2020.06.012
58. Li W, Han F, Fu M, Wang Z. High expression of vcan is an independent predictor of poor prognosis in gastric cancer. J Int Med Res (2020) 48(1):0300060519891271. doi: 10.1177/0300060519891271
59. Song H, Song J, Kim YJ, Jeong HH, Min HJ, Koh SS. Dcpp1 is the mouse ortholog of human pauf that possesses functional analogy in pancreatic cancer. Biochem Bioph Res Co (2017) 493(4):1498–503. doi: 10.1016/j.bbrc.2017.10.015
60. Wang T, Lu J, Wang R, Cao W, Xu J. Top2a promotes proliferation and metastasis of hepatocellular carcinoma regulated by mir-144-3p. J Cancer (2022) 13(2):589. doi: 10.7150/jca.64017
61. Zhang H, Zhang X, Li X, Meng WB, Bai ZT, Rui SZ, et al. Effect of Ccnb1 silencing on cell cycle, senescence, and apoptosis through the P53 signaling pathway in pancreatic cancer. J Cell Physiol (2019) 234(1):619–31. doi: 10.1002/jcp.26816
62. Song H, Sun W, Ye G, Ding X, Liu Z, Zhang S, et al. Long non-coding rna expression profile in human gastric cancer and its clinical significances. J Transl Med (2013) 11(1):1–10. doi: 10.1186/1479-5876-11-225
63. Liu Y, Yang S, Wang F, Zhou Z, Xu W, Xie J, et al. Plek2 promotes osteosarcoma tumorigenesis and metastasis by activating the Pi3k/Akt signaling pathway. Oncol Lett (2021) 22(1):1–9. doi: 10.3892/ol.2021.12795
64. Algaber A, Madhi R, Hawez A, Rönnow C-F, Rahman M. Targeting Fhl2−E−Cadherin axis by Mir−340−5p attenuates colon cancer cell migration and invasion. Oncol Lett (2021) 22(2):1–11. doi: 10.3892/ol.2021.12898
65. Shen H, He M, Lin R, Zhan M, Xu S, Huang X, et al. Plek2 promotes gallbladder cancer invasion and metastasis through Egfr/Ccl2 pathway. J Exp Clin Canc Res (2019) 38(1):1–14. doi: 10.1186/s13046-019-1250-8
66. Casanova-Acebes M, Dalla E, Leader AM, LeBerichel J, Nikolic J, Morales BM, et al. Tissue-resident macrophages provide a pro-tumorigenic niche to early nsclc cells. Nature (2021) 595(7868):578–84. doi: 10.1038/s41586-021-03651-8
67. Jolly MK, Celià-Terrassa T. Dynamics of phenotypic heterogeneity associated with emt and stemness during cancer progression. J Clin Med (2019) 8(10):1542. doi: 10.3390/jcm8101542
68. Ho DW-H, Tsui Y-M, Sze KM-F, Chan L-K, Cheung T-T, Lee E, et al. Single-cell transcriptomics reveals the landscape of intra-tumoral heterogeneity and stemness-related subpopulations in liver cancer. Cancer Lett (2019) 459:176–85. doi: 10.1016/j.canlet.2019.06.002
69. Yang X, Huang M, Zhang Q, Chen J, Li J, Han Q, et al. Metformin antagonizes ovarian cancer cells malignancy through msln mediated il-6/Stat3 signaling. Cell Transplant (2021) 30:09636897211027819. doi: 10.1177/09636897211027819
70. Qin L, Li T, Liu Y. High Slc4a11 expression is an independent predictor for poor overall survival in grade 3/4 serous ovarian cancer. PloS One (2017) 12(11):e0187385. doi: 10.1371/journal.pone.0187385
71. Lambrechts D, Wauters E, Boeckx B, Aibar S, Nittner D, Burton O, et al. Phenotype molding of stromal cells in the lung tumor microenvironment. Nat Med (2018) 24(8):1277–89. doi: 10.1038/s41591-018-0096-5
72. Binnewies M, Roberts EW, Kersten K, Chan V, Fearon DF, Merad M, et al. Understanding the tumor immune microenvironment (Time) for effective therapy. Nat Med (2018) 24(5):541–50. doi: 10.1038/s41591-018-0014-x
73. Liu Y, Gu Y, Han Y, Zhang Q, Jiang Z, Zhang X, et al. Tumor exosomal rnas promote lung pre-metastatic niche formation by activating alveolar epithelial Tlr3 to recruit neutrophils. Cancer Cell (2016) 30(2):243–56. doi: 10.1016/j.ccell.2016.06.021
74. Boelens Mirjam C, Wu Tony J, Nabet Barzin Y, Xu B, Qiu Y, Yoon T, et al. Exosome transfer from stromal to breast cancer cells regulates therapy resistance pathways. Cell (2014) 159(3):499–513. doi: 10.1016/j.cell.2014.09.051
75. Becker A, Thakur BK, Weiss JM, Kim HS, Peinado H, Lyden D. Extracellular vesicles in cancer: Cell-to-Cell mediators of metastasis. Cancer Cell (2016) 30(6):836–48. doi: 10.1016/j.ccell.2016.10.009
76. Zhang F, Liu Y, Yang Y, Yang K. Development and validation of a fourteen-innate immunity-related gene pairs signature for predicting prognosis head and neck squamous cell carcinoma. BMC Cancer (2020) 20(1):1–15. doi: 10.1186/s12885-020-07489-7
77. Gu X, Wang L, Boldrup L, Coates PJ, Fahraeus R, Sgaramella N, et al. Ap001056. 1, a prognosis-related enhancer rna in squamous cell carcinoma of the head and neck. Cancers (2019) 11(3):347. doi: 10.3390/cancers11030347
78. She Y, Kong X, Ge Y, Yin P, Liu Z, Chen J, et al. Immune-related gene signature for predicting the prognosis of head and neck squamous cell carcinoma. Cancer Cell Int (2020) 20(1):1–10. doi: 10.1186/s12935-020-1104-7
79. Borcoman E, de la Rochere P, Richer W, Vacher S, Chemlali W, Krucker C, et al. Inhibition of Pi3k pathway increases immune infiltrate in muscle-invasive bladder cancer. OncoImmunology (2019) 8(5):e1581556. doi: 10.1080/2162402X.2019.1581556
80. Liu Y-T, Sun Z-J. Turning cold tumors into hot tumors by improving T-cell infiltration. Theranostics (2021) 11(11):5365. doi: 10.7150/thno.58390
81. Li Y, Gu J, Xu F, Zhu Q, Chen Y, Ge D, et al. Molecular characterization, biological function, tumor microenvironment association and clinical significance of M6a regulators in lung adenocarcinoma. Brief Bioinform (2021) 22(4):bbaa225. doi: 10.1093/bib/bbaa225
82. Cao B, Dai W, Ma S, Wang Q, Lan M, Luo H, et al. An ev-associated gene signature correlates with hypoxic microenvironment and predicts recurrence in lung adenocarcinoma. Mol Ther-Nucl Acids (2019) 17:879–90. doi: 10.1016/j.omtn.2019.07.021
83. Chuang C-H, Greenside PG, Rogers ZN, Brady JJ, Yang D, Ma RK, et al. Molecular definition of a metastatic lung cancer state reveals a targetable Cd109–janus kinase–stat axis. Nat Med (2017) 23(3):291–300. doi: 10.1038/nm.4285
84. Snyder EL, Watanabe H, Magendantz M, Hoersch S, Chen TA, Wang DG, et al. Nkx2-1 represses a latent gastric differentiation program in lung adenocarcinoma. Mol Cell (2013) 50(2):185–99. doi: 10.1016/j.molcel.2013.02.018
85. Winslow MM, Dayton TL, Verhaak RGW, Kim-Kiselak C, Snyder EL, Feldser DM, et al. Suppression of lung adenocarcinoma progression by Nkx2-1. Nature (2011) 473(7345):101–4. doi: 10.1038/nature09881
Keywords: lung adenocarcinoma, tumor microenvironment, single-cell RNA sequence, risk score, tumor progress
Citation: Li Z, Zeng T, Zhou C, Chen Y and Yin W (2022) A prognostic signature model for unveiling tumor progression in lung adenocarcinoma. Front. Oncol. 12:1019442. doi: 10.3389/fonc.2022.1019442
Received: 15 August 2022; Accepted: 17 October 2022;
Published: 01 November 2022.
Edited by:
Miao Liu, Harvard Medical School, United StatesReviewed by:
Jing Wang, Nanjing Drum Tower Hospital, ChinaCopyright © 2022 Li, Zeng, Zhou, Chen and Yin. This is an open-access article distributed under the terms of the Creative Commons Attribution License (CC BY). The use, distribution or reproduction in other forums is permitted, provided the original author(s) and the copyright owner(s) are credited and that the original publication in this journal is cited, in accordance with accepted academic practice. No use, distribution or reproduction is permitted which does not comply with these terms.
*Correspondence: Wu Yin, d3lpbkBuanUuZWR1LmNu; Yan Chen, YW1hbmRhY3lAMTYzLmNvbQ==
†These authors have contributed equally to this work
Disclaimer: All claims expressed in this article are solely those of the authors and do not necessarily represent those of their affiliated organizations, or those of the publisher, the editors and the reviewers. Any product that may be evaluated in this article or claim that may be made by its manufacturer is not guaranteed or endorsed by the publisher.
Research integrity at Frontiers
Learn more about the work of our research integrity team to safeguard the quality of each article we publish.