 Adam Hermawan
 Herwandhani Putri2
 Naufa Hanif
- 1Laboratory of Macromolecular Engineering, Department of Pharmaceutical Chemistry, Faculty of Pharmacy, Universitas Gadjah Mada Sekip Utara II, Yogyakarta, Indonesia
- 2Cancer Chemoprevention Research Center, Faculty of Pharmacy, Universitas Gadjah Mada Sekip Utara II, Yogyakarta, Indonesia
- 3Laboratory of Advanced Pharmaceutical Sciences, Faculty of Pharmacy, Universitas Gadjah Mada Sekip Utara II, Yogyakarta, Indonesia
Background: Honokiol (HON) inhibits epidermal growth factor receptor (EGFR) signaling and increases the activity of erlotinib, an EGFR inhibitor, in human head and neck cancers. In this study, using a bioinformatics approach and in vitro experiments, we assessed the target genes of HON against breast cancer resistance to tamoxifen (TAM).
Materials and methods: Microarray data were obtained from GSE67916 and GSE85871 datasets to identify differentially expressed genes (DEGs). DEGs common between HON-treated and TAM-resistant cells were analyzed by Gene Ontology (GO) and Kyoto Encyclopedia of Genes and Genomes (KEGG) pathway enrichment analyses and protein-protein interaction (PPI) networks were constructed. Selected genes were analyzed for genetic alterations, expression, prognostic value, and receiver operating characteristics (ROC). TAM-resistant MCF-7 (MCF-7 TAM-R) cells were generated and characterized for their resistance toward TAM. A combination of HON and TAM was used for cytotoxicity and gene expression analyses. Molecular docking was performed using the Molecular Operating Environment software.
Results: PPI network analysis revealed that FN1, FGFR2, and RET were the top three genes with the highest scores. A genetic alteration study of potential target genes revealed MMP16 and ERBB4 as the genes with the highest alterations among the breast cancer samples. Pathway enrichment analysis of FGFR2, RET, ERBB4, SOX2, FN1, and MMP16 showed that the genetic alterations herein were likely to impact the RTK-Ras pathway. The expression levels of RET, MMP16, and SOX2 were strongly correlated with prognostic power, with areas under the ROC curves (AUC) of 1, 0.8, and 0.8, respectively. The HON and TAM combination increased TAM cytotoxicity in MCF-7 TAM-R cells by regulating the expression of potential target genes ret, ERBB4, SOX2, and FN1, as well as the TAM resistance regulatory genes including HES1, VIM, PCNA, TP53, and CASP7. Molecular docking results indicated that HON tended to bind RET, ErbB4, and the receptor protein Notch1 ankyrin domain more robustly than its native ligand.
Conclusion: HON could overcome breast cancer resistance to TAM, potentially by targeting FGFR2, RET, ERBB4, MMP16, FN1, and SOX2. However, further studies are required to validate these results.
Introduction
Tamoxifen (TAM), a selective estrogen receptor modulator, is the most commonly used drug in the estrogen receptor (ER)-positive breast cancer treatment (1). The effectiveness of TAM therapy in breast cancer decreases because of the drug resistance (2). The mechanisms of TAM resistance have been widely studied, including the downregulation of ER-alpha (3) and ligand-independent signaling activation (4). Ligand-independent signaling activation can occur due to the crosstalk with epidermal growth factor receptor (EGFR), for example, crosstalk between EGFR, insulin-like growth factor receptor type 1, and human epidermal growth factor receptor 2 (HER2) (5). Therefore, the inhibition of EGFR and HER2 signaling is a strategic approach to overcoming TAM resistance.
Honokiol (3,5-di-2-propenyl-1,1-biphenyl-2,4-diol, HON) (Figure 1A) is a lignan isolated from the Magnolia plant species (6). HON has been widely studied as an anticancer treatment for breast cancer (7) and head and neck squamous cell carcinoma (8). Toxicity studies have shown that HON has a high safety profile and no reported adverse effects (9). A review article that discussed the anticancer activity of HON both in vitro and in vivo showed that HON inhibits the proliferation, invasion, and migration of cancer cells. Moreover, the molecular targets of HON in cancer cells include NF-κB, mTOR, EGFR, BMP7, STAT3, and hedgehog (10).
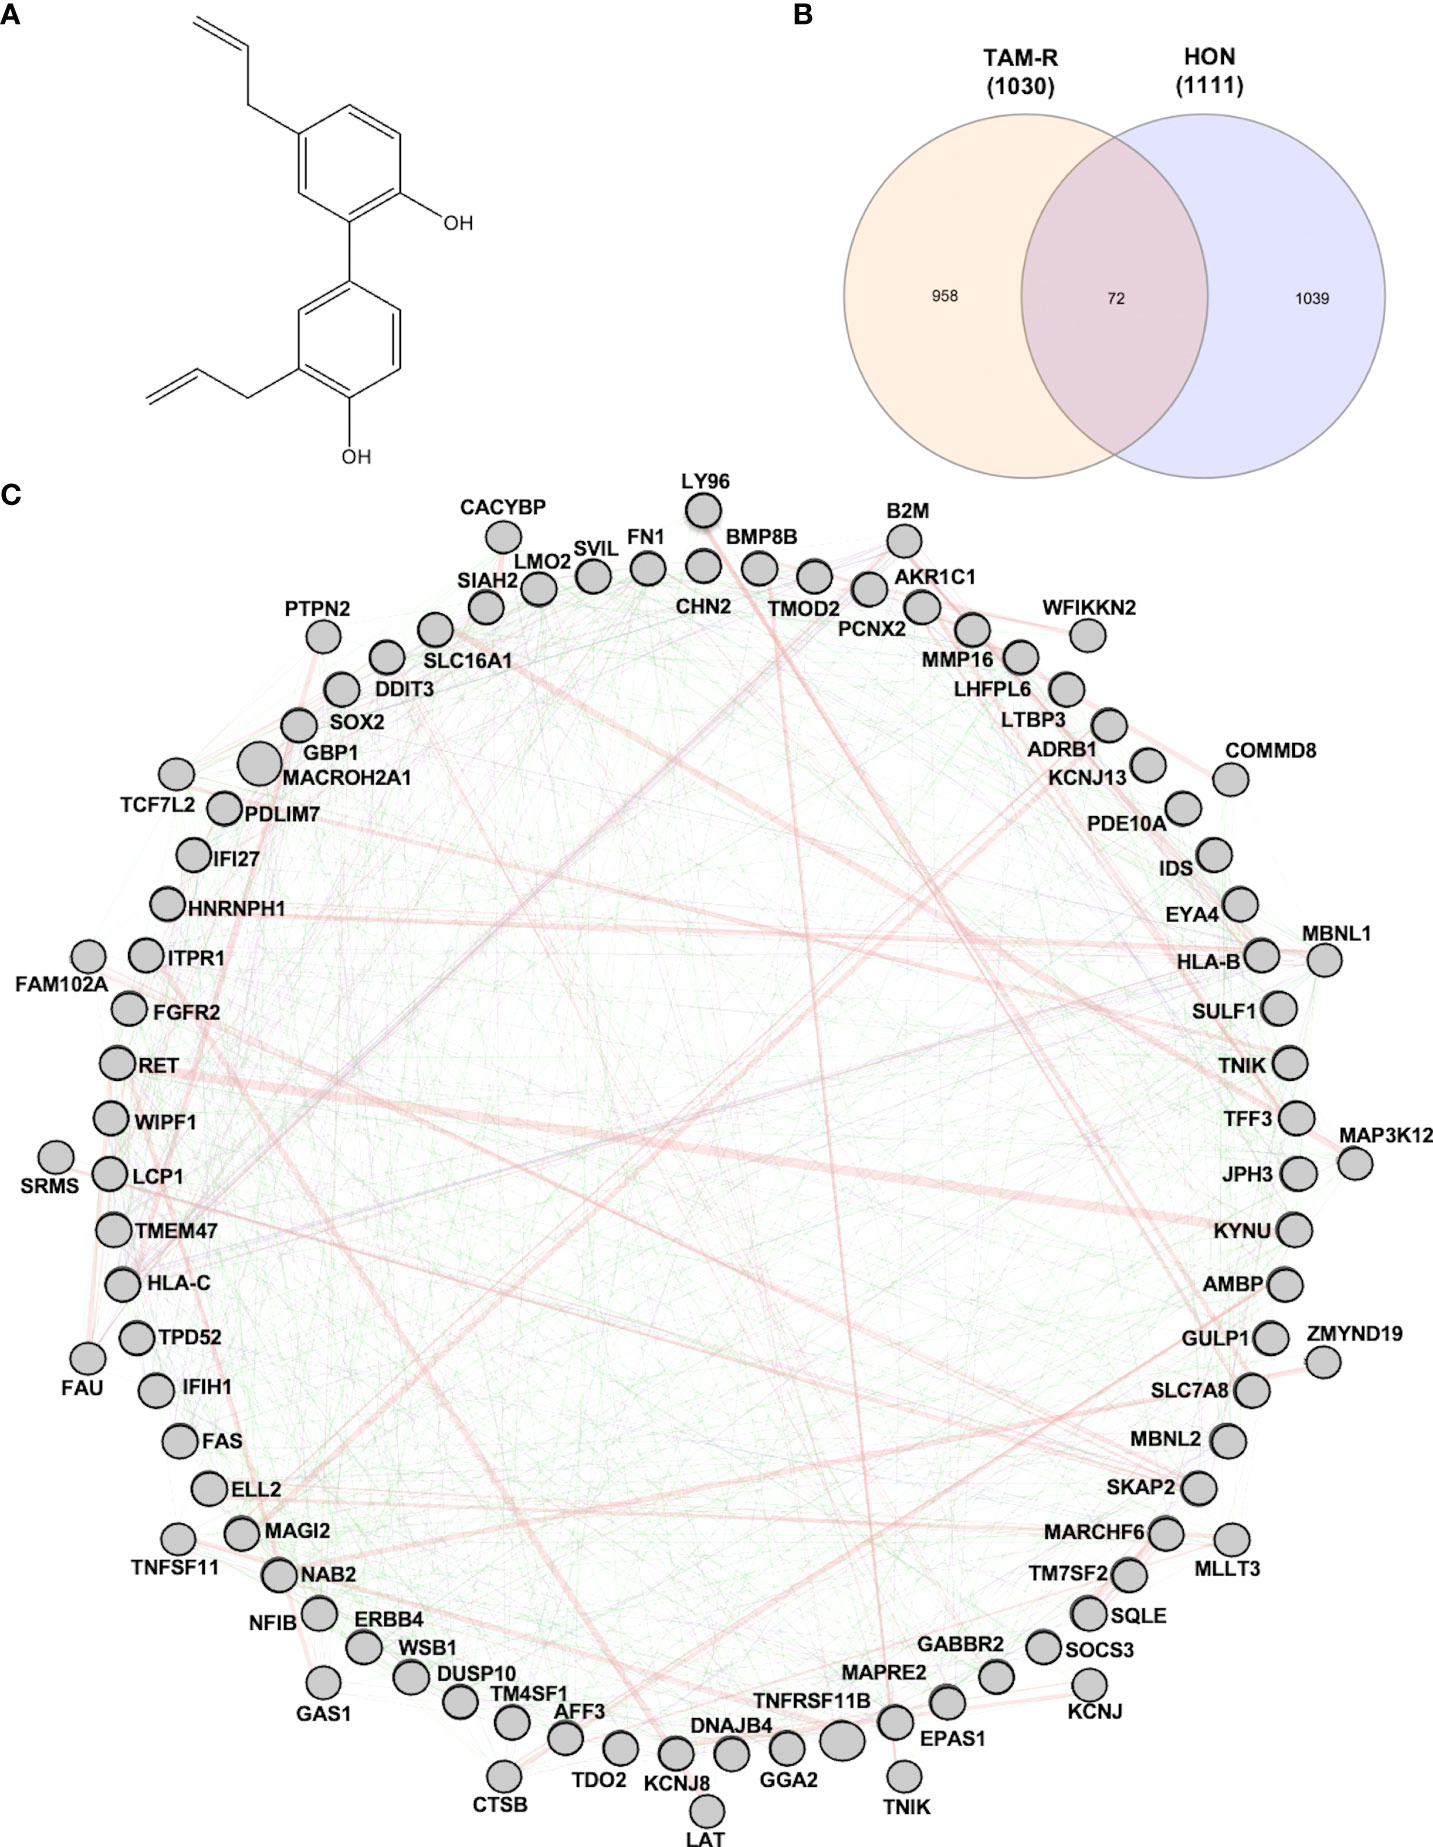
Figure 1 (A) Structure of honokiol (HON). (B) Venn diagram of differentially expressed genes (DEGs) from tamoxifen-resistant (TAM-R) and HON-treated MCF-7 cells. (C) Protein-protein interaction network of the protein related to overcoming TAM resistance by HON as analyzed using GeneMANIA.
HON has also been used in combination with other anticancer agents. HON increased the cytotoxicity of bleomycin in MCF-7, PANC1, and UACC903 cells (11). The combination of HON and doxorubicin exerted a synergistic effect on doxorubicin-resistant breast cancer cell lines by inducing apoptosis (7). Furthermore, HON had cytotoxic effects on the ER+ TAM-resistant breast cancer cells having HER2 overexpression (7). One of the mechanisms of TAM resistance in breast cancer cells involves crosstalk with the human EGFR (2). In head and neck cancer, HON inhibits the EGFR signaling and increases the activity of the EGFR inhibitor erlotinib (8). Therefore, we hypothesized that HON could overcome TAM resistance in breast cancer cells by targeting EGFR signaling.
This study aimed to explore the potential downstream targets and mechanisms of HON’s action in circumventing breast cancer resistance to TAM using a bioinformatics approach.
Materials and methods
Data mining
Microarray data of MCF-7 TAM-R cells were obtained from GSE67916 (12). It contains the two cell lines, the TAM-R and TAM-sensitive MCF-7 cells. Microarray data of HON-treated MCF-7 cells were obtained from GSE85871 (13). Data processing was conducted using GEO2R, an online tool for GEO data analysis, based on the R programming language (https://www.ncbi.nlm.nih.gov/geo/geo2r/). DEGs between TAM-sensitive and TAM-resistant cells, and HON-treated and control were screened. The adjusted p-value < 0.05 and log |Fold Change| > 2 were used to select significant DEGs.
GO and KEGG pathway enrichment analyses
GO and KEGG pathway enrichment analyses were conducted using DAVID v6.7 (14). A p < 0.05 was considered the cutoff value.
Construction of PPI network and hub gene selection
The PPI network was visualized using GENEMANIA and default parameters (https://genemania.org/). Genes having the highest degree score of 5, analyzed using the cytoHubba plugin, were selected as hub genes (15, 16).
Genetic alterations in the potential target genes
The genetic alterations in selected genes were analyzed using cBioPortal (http://www.cbioportal.org) (17, 18). In this study, the protein-coding genes, FGFR2, RET, ERBB4, SOX2, FN1, and MMP16 were screened for genetic alterations in all the breast cancer studies available in the cBioPortal database. The breast cancer study with the highest genetic alterations was chosen for further oncoprinting, copy number alterations, gene network connectivity, pathways related to genetic alterations, and mutual exclusivity analysis. A p < 0.05 was considered the cutoff for mutual exclusivity analysis. Statistical analysis was conducted using one-way ANOVA with Tukey’s multiple comparison test, and Student’s t-test was used to analyze copy number alterations. *p < 0.05, **p < 0.01, ***p < 0.001, and ****p < 0.001.
Gene expression analysis
Gene expression analysis of FGFR2, ERBB4, RET, FN1, MMP16, and SOX2 in breast cancer patients from the TCGA study was performed using Gene Expression Profiling Interactive Analysis (GEPIA) (http://gepia2.cancer-pku.cn) (19). Briefly, gene symbols were submitted to GEPIA and analyzed in tumor vs. normal tissues. Gene expression was assessed in stage I–IV breast cancer samples. Statistical significance was set at p < 0.01.
Prognostic value
Prognostic values related to FGFR2, ERBB4, RET, FN1, MMP16, and SOX2 were analyzed using the KMPlotter of breast cancer patients (https://kmplot.com) (20). Briefly, gene symbols were submitted to KMPlotter, and several parameters were selected, including ER status positive, relapse-free survival (RFS), overall survival (OS), and patients receiving endocrine therapy with TAM only. Statistical significance was set at p < 0.05.
ROC Plot
The correlation between gene expression and sensitivity to TAM in breast cancer patients was analyzed using the ROC plotter (http://www.rocplot.org) (21). Briefly, gene symbols were submitted to the ROC plotter, and several parameters were selected, including ER status positive, RFS at five years, OS, and patients receiving endocrine therapy with TAM. Statistical significance was set at p < 0.05.
Cell culture
MCF-7 cells (ATCC) were cultured in Dulbecco’s Modified Eagle Medium-high glucose (Gibco) containing 20% of fetal bovine serum (FBS; Gibco), L-glutamine (Gibco), and penicillin-streptomycin, and kept at 37 °C in a 5% CO2 incubator. MCF-7 TAM-R cells were prepared as previously described (22). Briefly, MCF-7 cells were treated with 10 µM TAM for 72 h. The cells were cultured in a fresh medium and maintained until recovery. After recovery, the cells retreated with 10 µM TAM, and the previous steps were repeated seven times.
Cytotoxicity
Cells were seeded (3,000 cells/well) in a 96-well plate and incubated until they reached 80% confluency. TAM (purchased from Sigma), HON (HON, purchased from Sigma), or a combination of both was added to the wells and incubated for 72 h. After incubation, MTT solution was added and cells were reincubated for 3 h. The resulting formazan crystals were dissolved in DMSO. The cell viability was calculated to be 5 for the control. We calculated the IC50 value with GraphPad Prism 5.0 using non-linear regression (curve fit) log (agonist) vs. normalized response-variable slope. Moreover, statistical analyses for the cytotoxicity data of TAM alone in MCF-7 and MCF-7 TAM-R, and HON alone and in combination in MCF-7 TAM-R, were conducted using two-way ANOVA with Sidak’s multiple comparison test. *p < 0.05, **p < 0.01, ***p < 0.001, and ****p < 0.001.
Quantitative real-time polymerase chain reaction (qRT-PCR)
Cells were cultured, seeded (3 × 10⁶ cells in a 10-cm plate), incubated until 80% confluency, and treated with 10 μM of TAM, 10 μM of HON, a combination of TAM and HON, or DMSO for 72 h. Next, the cells were lysed and RNA was extracted using a QIAGEN RNA isolation kit. RNA was then transcribed into cDNA using a SensiFAST cDNA synthesis kit (Meridian Bioscience). Gene expression was measured in Bio-Rad CFX using the SensiFAST SYBR® No-ROX Kit (Meridian Biosciences) with the selected primers (Supplementary Table 1). Gene expression was analyzed using the comparative threshold cycle (ΔΔCT). Statistical analyses of the MCF-7 vs. MCF-7 TAM-R cells were conducted using the Student’s t-test. Statistical analyses of the combination treatments were conducted using one-way ANOVA with Tukey’s multiple comparison test. *p < 0.05, **p < 0.01, ***p < 0.001, and ****p < 0.001.
Molecular docking
To predict the binding characteristics between HON and RET, ErbB4, FGFR2, and the ankyrin domain of Notch1, molecular docking was conducted. The computational prediction was simulated on a Windows 10 operating system, Intel Core(TM) i5-10th Gen processor with 8 GB of RAM. The software MOE 2010 (licensed by the Faculty of Pharmacy, UGM) was used for docking simulation, RMSD-docking score calculation, and visualization interaction. The PDB ID of the RET (2IVU), ErbB4 (3BBT), FGFR2 (2PVF), and the ankyrin domain of Notch1 (2HE0) was used for the search on rcsb.org. The chemical structure of HON and the natural ligand of the protein, were constructed using MarvinSketch. These structures were then subjected to conformational search and minimized in MOE using the energy-minimizing menu. For the docking simulation setting, London dG was used for both Rescoring 1 and Rescoring 2, Triangle Matcher was used for score function and placement setting, and Forcefield was used to refine the docking results from 30 retained settings. The results of this method helped determine which conformation has the lowest binding energy for interaction between the ligand and its receptor.
Results
Data mining
To explore the target genes of HON in circumventing breast cancer resistance to tamoxifen (TAM), we first used GSE67916, which contained microarray data from MCF-7 TAM-R cells and MCF-7 parental cells. We obtained DEGs and considered them to be regulatory genes of TAM-R in MCF-7 cells. We also used GSE85871, which contained microarray data from HON-treated and DMSO-treated MCF-7 cells to retrieve the DEGs of HON-treated MCF-7 cells to obtain the DEGs of HON-treated cells. A total of 1,030 and 1,111 genes were extracted from the GSE67916 (Supplementary Table 2) and GSE85871 (Supplementary Table 3) datasets, respectively. Moreover, a Venn diagram of DEGs from GSE67916 and GSE85871 was generated using InteractiVenn (http://www.interactivenn.net) (23), resulting in 72 overlapping DEGs (Figure 1B and Supplementary Table 4). Here we used 2 DEGs from 2 GSEs as a data mining model to search for target genes that regulate TAM resistance in MCF-7 cells, and also target HON in MCF-7 cells.
GO and KEGG pathway enrichment analyses
The GO analysis was divided into three categories: biological processes, cellular components, and molecular functions. Several DEGs (Table 1) participated in the biological responses to steroid hormones, endogenous stimuli, toxins, nutrient levels, and extracellular stimuli. DEGs were located in the plasma membrane, cell fraction, vesicular fraction, and insoluble fraction. The DEGs also had a molecular function in transmembrane receptor protein tyrosine kinase activity and calcium ion binding. KEGG pathway enrichment analysis of the DEGs revealed their regulation of endocytic pathways (Table 2).
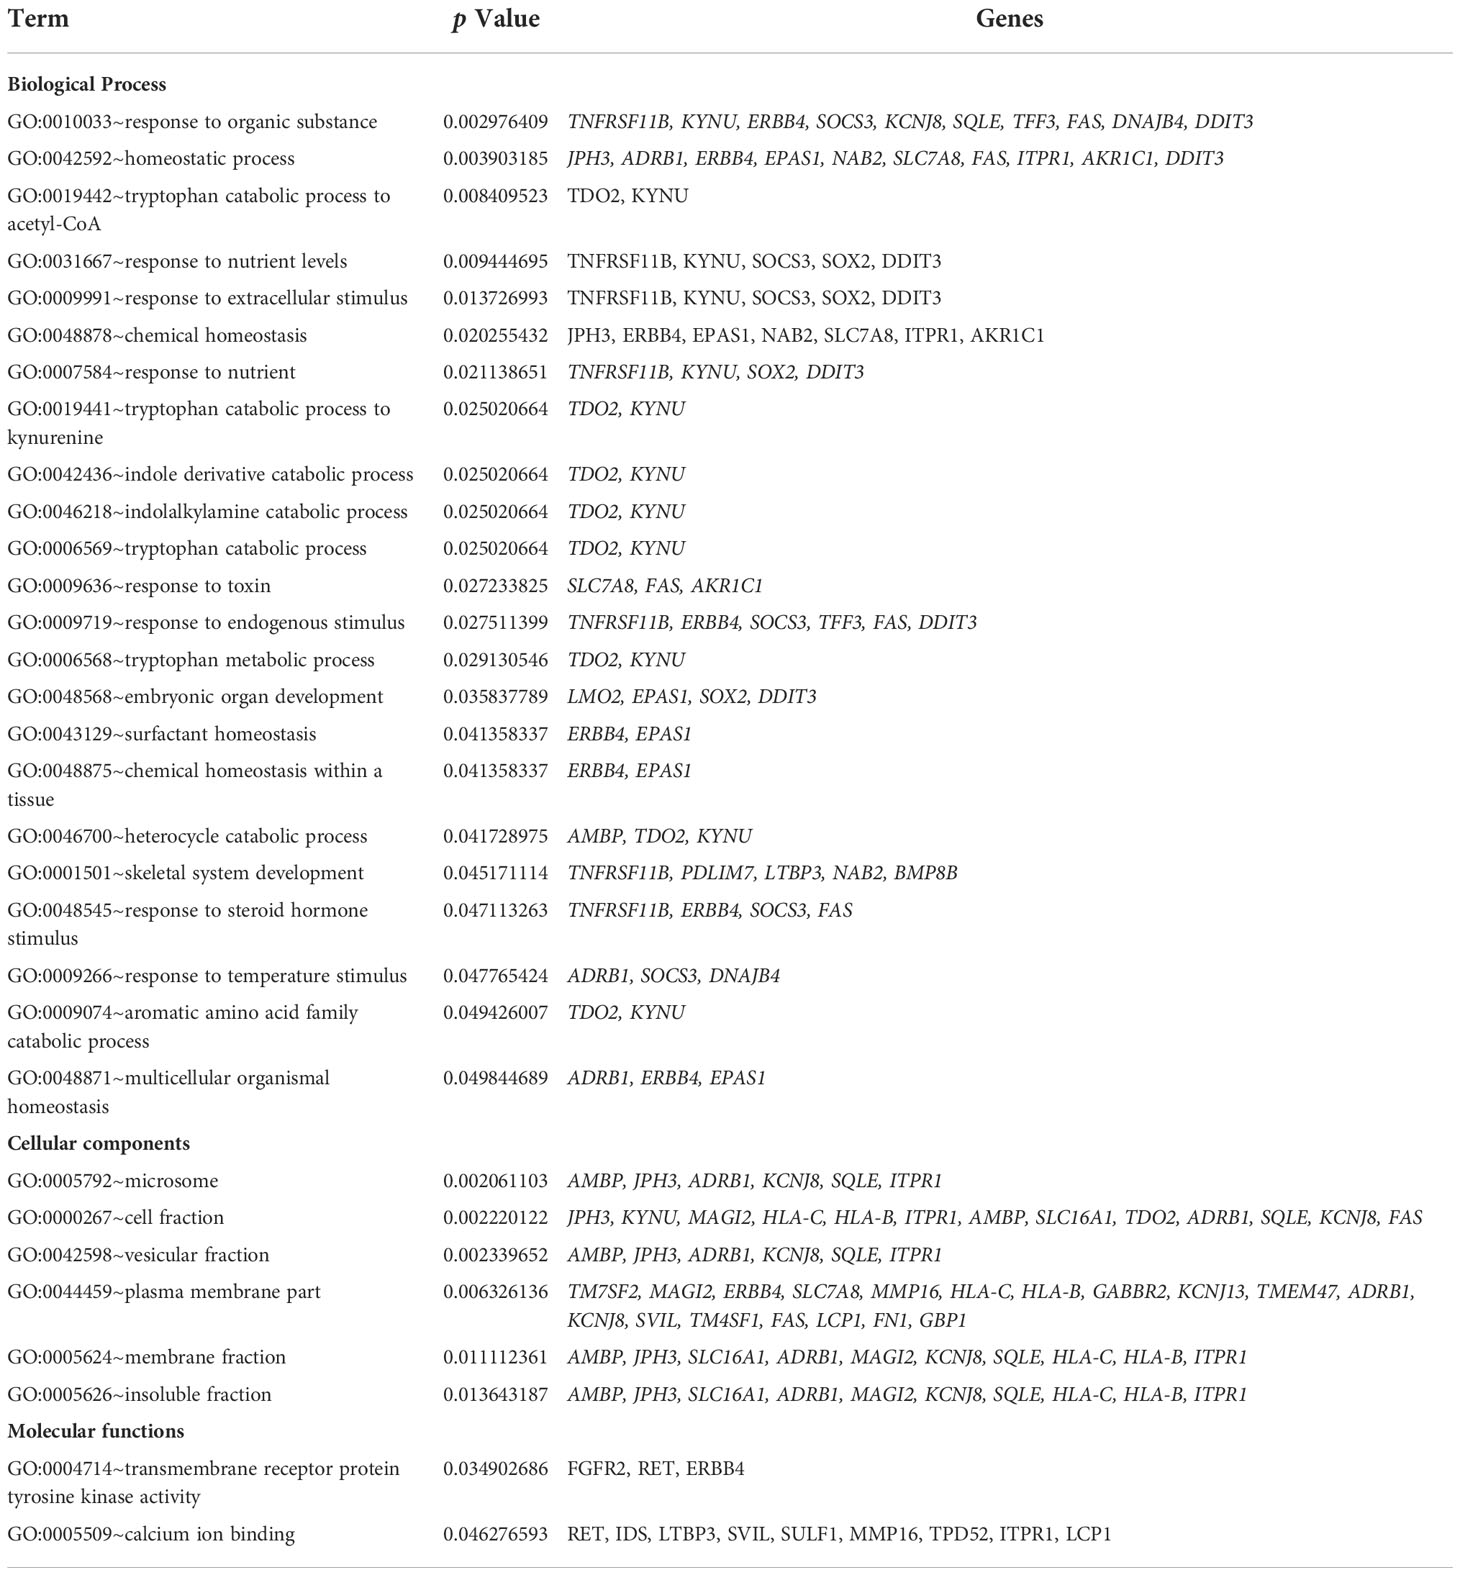
Table 1 GO enrichment analysis of the overlapping DEGs.
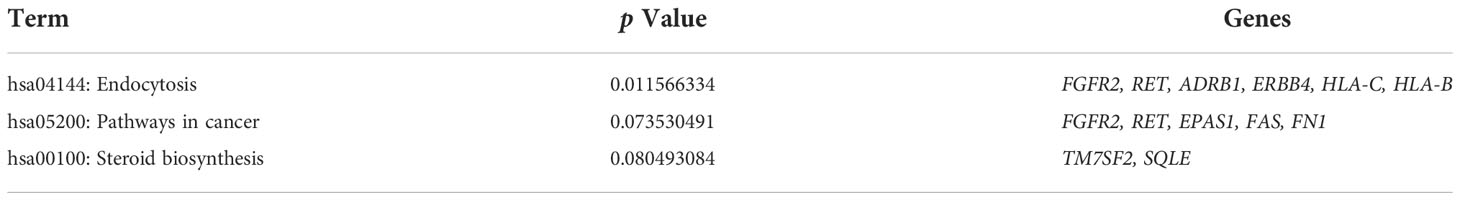
Table 2 KEGG pathway enrichment analysis of the overlapping DEGs.
PPI network construction and hub gene selection
A total of 72 genes were constructed in the PPI network complex with a confidence level of 0.4, containing 67 nodes and 40 edges, with an average node degree of 1.19, an average local clustering coefficient of 0.417, and a PPI enrichment p-value of 0.00288 (Figure 1C), which showed the complexity of the networks and highlighted that one protein interacted with another. Therefore, targeting several proteins in the PPI network is important for overcoming TAM resistance by HON. In order to reduce the complexity and select the most important protein in the PPI network, we performed hub gene selection based on the highest degree score. The top 10 genes with the highest degree scores were FN1, SOX2, FGFR2, EPAS1, LMO1, LTBP3, MMP16, TNFRSF11B, AMBP, and RET (Table 3).
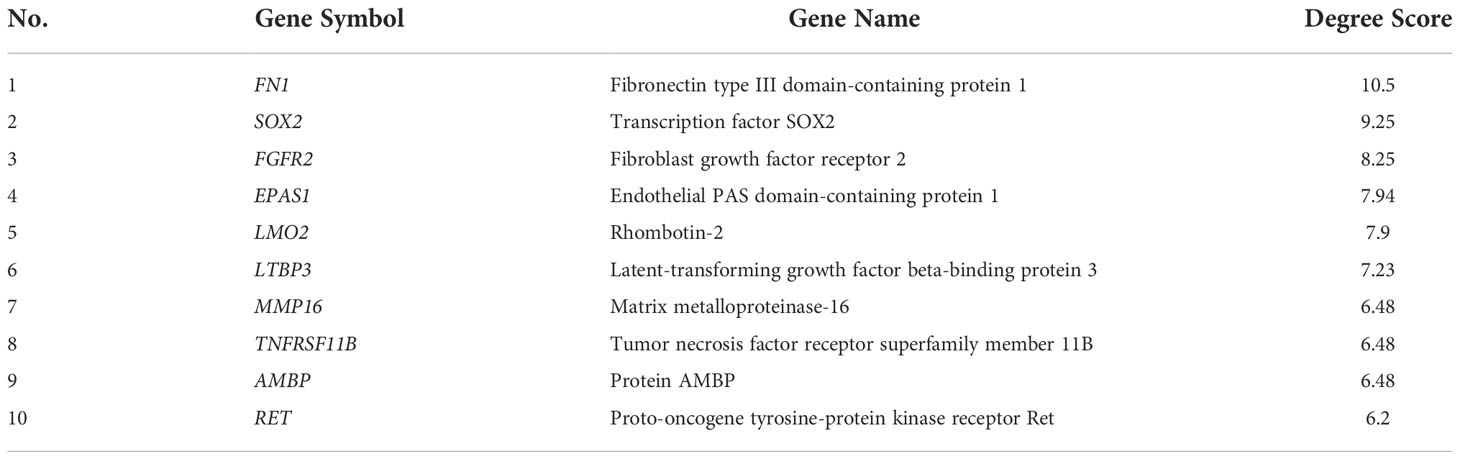
Table 3 Top 10 hub genes based on degree score.
Genetic alterations in FGFR2, RET, ERBB4, SOX2, FN1, and MMP16
Six target genes (FGFR2, RET, ERBB4, SOX2, FN1, and MMP16) were analyzed across breast cancer studies using the cBioPortal to assess genomic alterations. FGFR2, RET, and ERBB4 were selected based on the KEGG pathway enrichment analysis results, which suggested the regulatory function of these genes in the endocytosis process. The genes, FN1, SOX2, and MMP16, were selected given their highest scores. ERBB4 encodes HER4, a member of the tyrosine kinase receptor family, and a large membrane glycoprotein, playing a critical role in response to external stimuli (24). FGFR2 encodes fibroblast growth factor receptor 2 (FGFR2), a member of the tyrosine kinase receptor family. MMP16 encodes matrix metalloproteinase 16, a proteolytic enzyme that plays a role in extracellular matrix degradation during cancer metastasis (25). FN1 encodes fibronectin 1, a glycoprotein that binds to receptors on the cell membrane and activates downstream signaling for cell survival, migration, invasion, and chemoresistance (26). SOX2 is a key gene involved in the maintenance of stemness in embryonic and adult stem cells (27).
The INSERM project (28) previously showed the highest genetic alterations among breast cancer studies, which were selected for further analysis (Figure 2A). Genetic alterations in each target gene were as follows: 2.8% (RET), 2.8% (FN1), 3% (FGFR2), 3% (SOX2), 9% (ERBB4), and 13% (MMP16) (Figure 2B). Moreover, most of the gene alterations were amplifications (Figure 2B). Further mutual exclusivity analysis showed that only one gene pair (ERBB4–FN1) exhibited significant co-occurrence (p < 0.05) in a breast cancer study of the INSERM project (Table 4). These results indicated the pivotal roles of ERBB4 and FN1 in HON treatment. Further analysis of copy number alterations revealed significant results. Copy number alteration analysis for FGFR2, RET, ERBB4, SOX2, FN1, and MMP16 showed that only the mutation count of MMP16 was significantly lower in cases with gain than in diploid or unchanged cases (Figure 2C). Analysis of the gene network associated with FGFR2, RET, ERBB4, SOX2, FN1, and MMP16 suggested that FGFR2, ERBB4, and FN1 may play important roles in this network (Figure 2D, upper part). PIK3CA and FGF3 were found to be gene neighbors with the highest connectivity. To reduce network complexity, we screened neighbors according to 20% alterations, and the results yielded only four query genes, including ERBB4, RET, FGFR2, and FN1 (Figure 2D, lower part). Pathway enrichment analysis of FGFR2, RET, ERBB4, SOX2, FN1, and MMP16 showed that RTK-Ras is related to corresponding genetic alterations (Figure 2E).
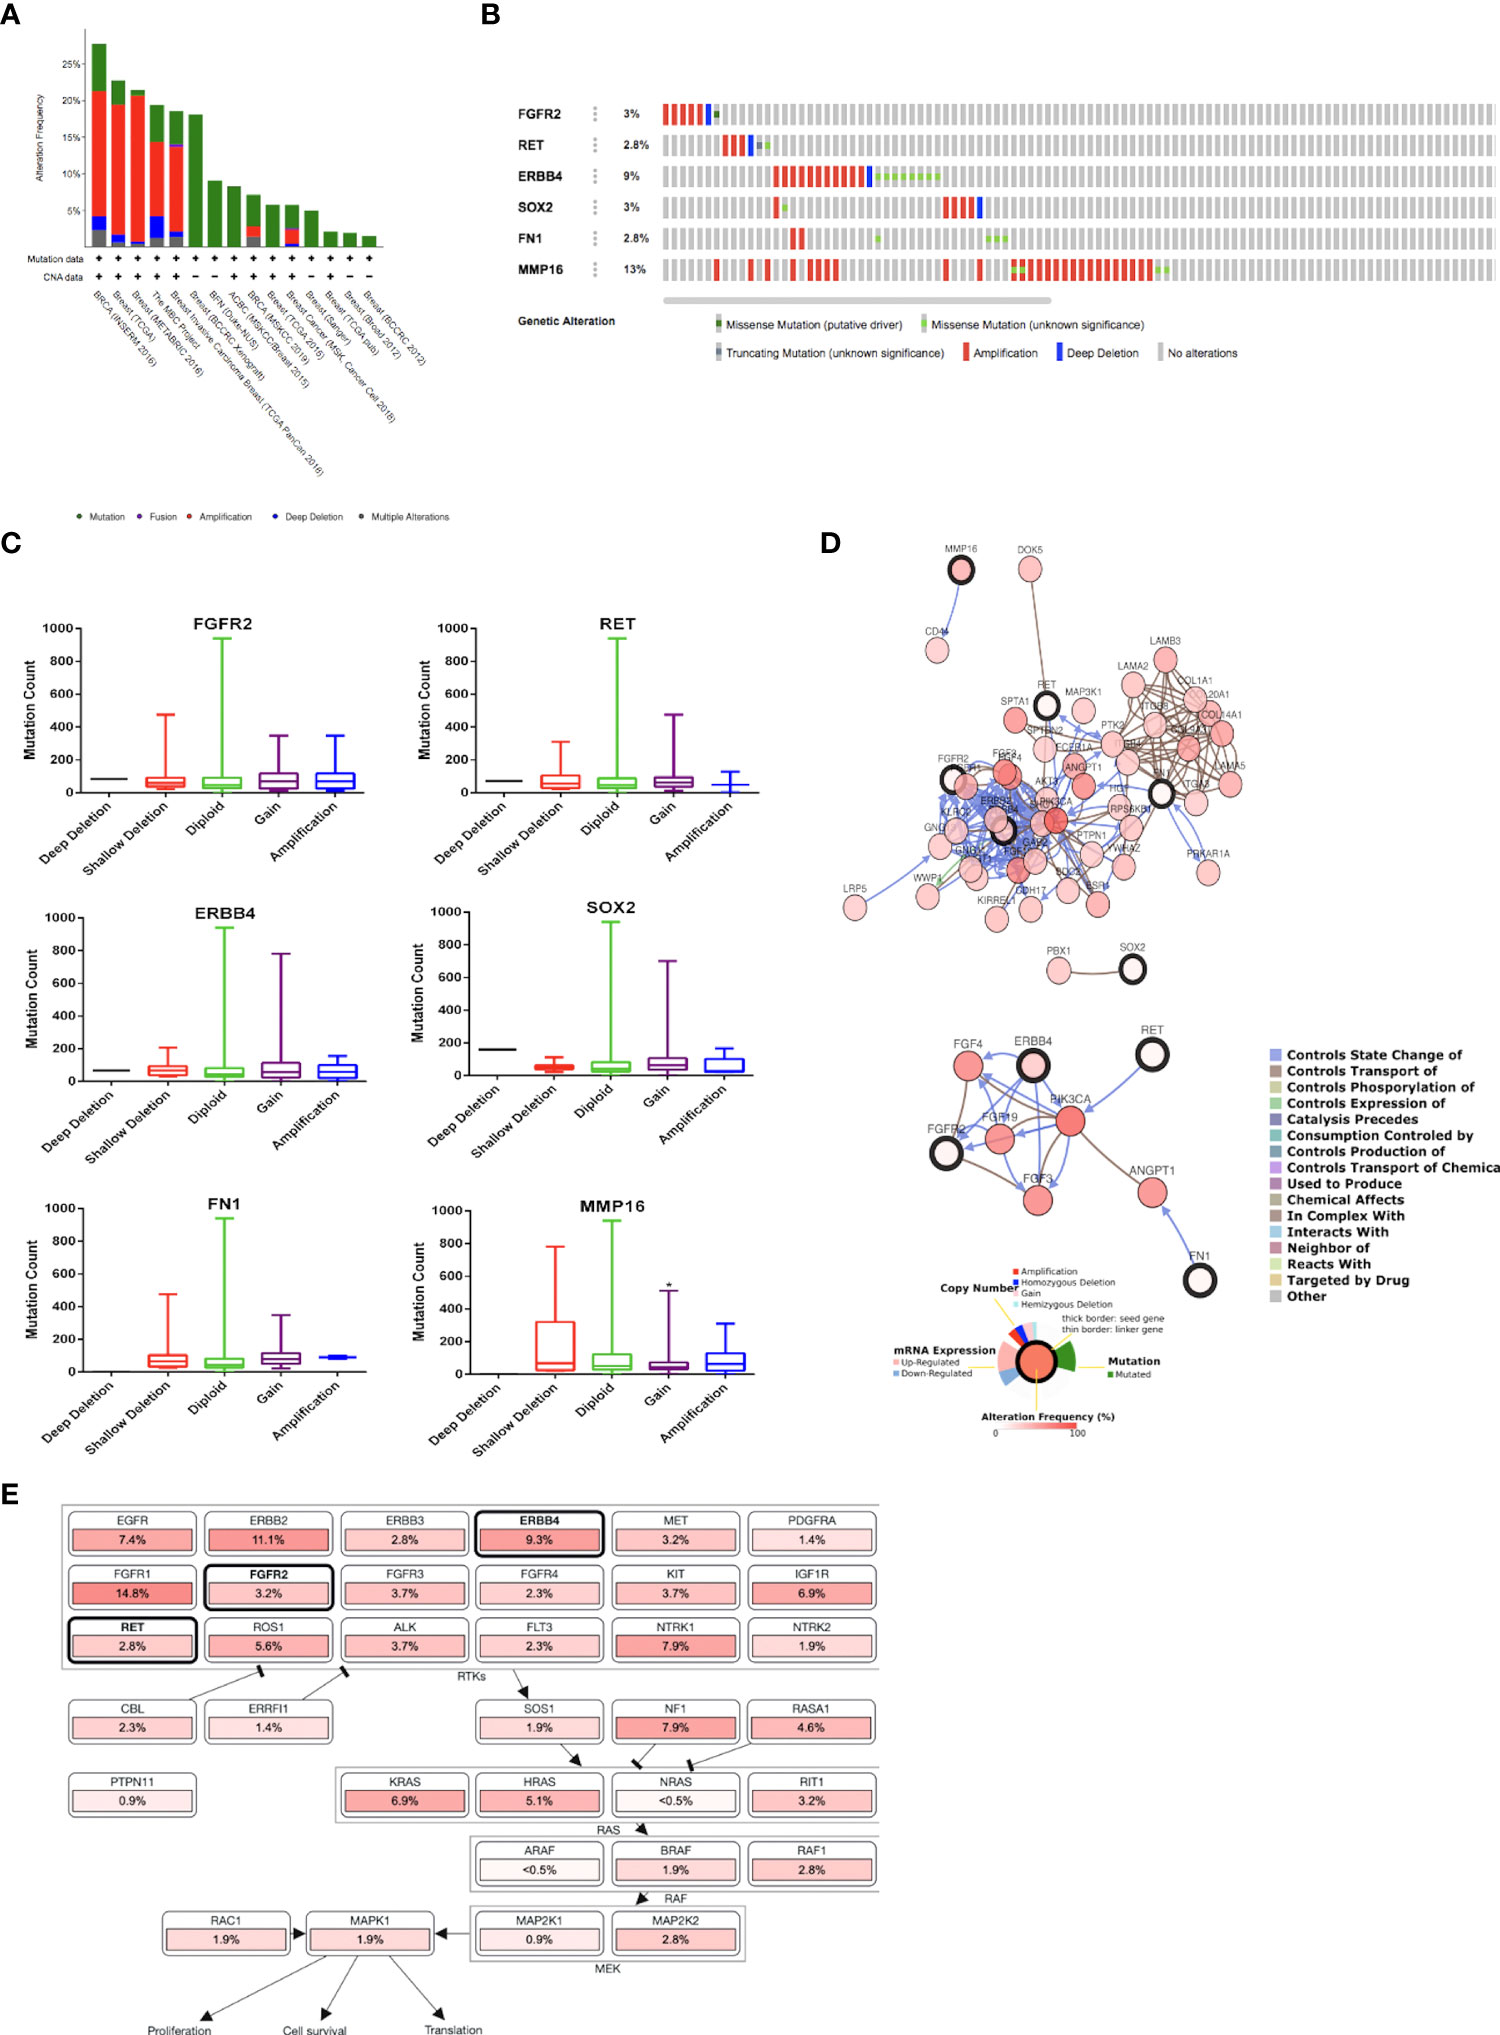
Figure 2 (A) Overview of changes in FGFR2, RET, ERBB4, SOX2, FN1, and MMP16 in genomics dataset from 15 studies on breast cancer. (B) Summary of alterations of FGFR2, RET, ERBB4, SOX2, FN1, and MMP16 across breast cancer samples [based on a study by Lefebvre et al. (2016)]. (C) Copy number of alterations of FGFR2, RET, ERBB4, SOX2, FN1, and MMP16 across breast cancer samples [based on a study by Lefebvre et al. (2016)]. Statistical analysis was conducted using the one-way ANOVA with Tukey’s multiple comparison test. * indicates p < 0.05. (D) Gene network connected with FGFR2, RET, ERBB4, SOX2, FN1, and MMP16 in breast cancer samples [based on a study by Lefebvre et al. (2016)]. (E) Pathway enrichment analysis related to the genetic alterations in FGFR2, RET, ERBB4, SOX2, FN1, and MMP16 across breast cancer samples [based on a study by Lefebvre et al. (2016)].

Table 4 Mutual exclusivity analysis of selected genes in metastatic breast cancer study.
Gene expressions of FGFR2, RET, ERBB4, SOX2, FN1, and MMP16 in breast cancer samples
Using GEPIA, RET and FN1 levels were found to be significantly higher in breast tumor tissues than in normal tissues (Figure 3A). We also analyzed the relationship between the mRNA levels of FGFR2, ERBB4, RET, FN1, MMP16, and SOX2 and tumor stages in breast cancer using GEPIA (Figure 3B) and found that the levels of FGFR2 were significantly upregulated in stage I and remained stable across stages II–X. The levels of ERBB4 were upregulated in stage I, downregulated in stages I–II and upregulated in stages III–X. The mRNA levels of SOX2, MMP16, and FN1 remained stable across stages I–X. The levels of RET mRNA were upregulated in stages I–II, downregulated in stages III–IV, and upregulated in stages IV–X.
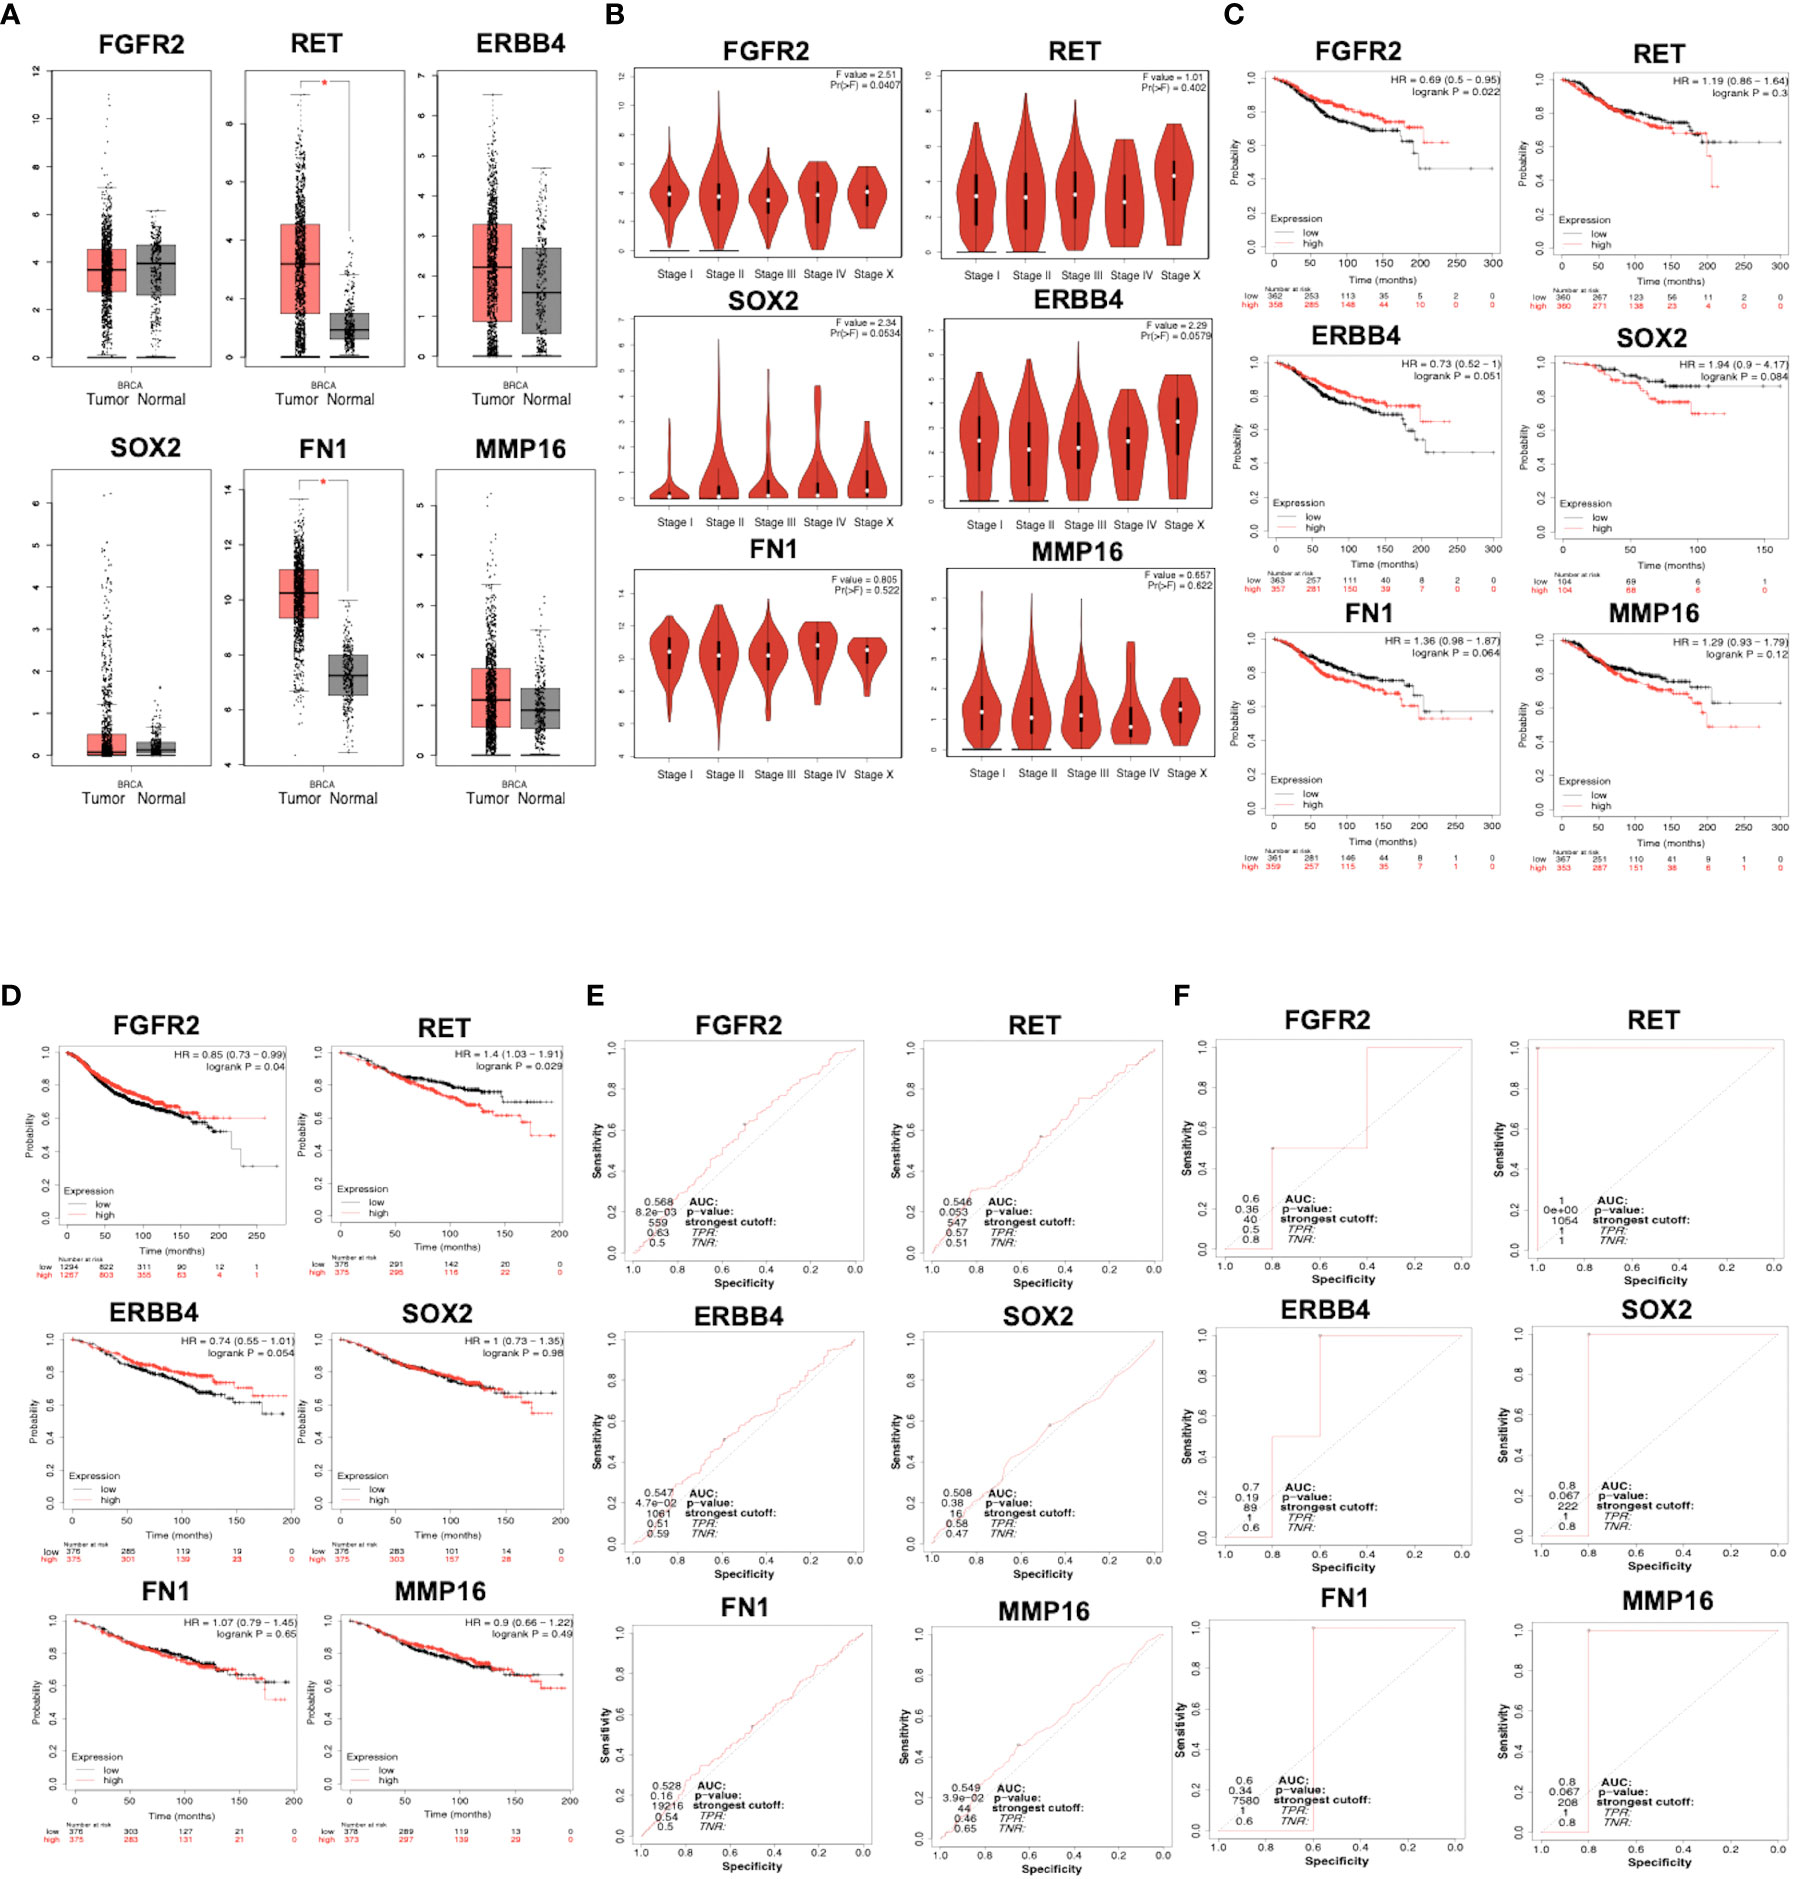
Figure 3 (A) mRNA expression of FGFR2, ERBB4, RET, FN1, MMP16, and SOX2 in normal and breast cancer tissues, as analyzed by GEPIA. Breast tumor samples = 1085; normal tissues samples = 291. p < 0.01 was selected as a significant value. (B) The relationship between mRNA level and tumor stages in patients with breast cancer, as analyzed by GEPIA. p < 0.01 was selected as a significant value. (C) Overall survival related to the expression of FGFR2, ERBB4, RET, FN1, MMP16, and SOX2, as analyzed by KMPlotter. (D) Relapse-free survival related to the expression of FGFR2, ERBB4, RET, FN1, MMP16, and SOX2, as analyzed by KMPlotter. The ROC plotter of the correlation between FGFR2, ERBB4, RET, FN1, MMP16, and SOX2 expression and TAM sensitivity, as analyzed by relapse-free survival (E) and pathological complete response (F).
Prognostic value
The prognostic value of mRNA expressions of FGFR2, ERBB4, RET, FN1, MMP16, and SOX2 was analyzed using two parameters, OS and RFS. Patients with breast cancer showing low levels of FGFR2 and ERBB4 had worse OS relative to the other groups (p = 0.022) (Figure 3C). Moreover, patients with breast cancer having low mRNA levels of RET, MMP16, FN1, and SOX2 had better OS; however, the difference was not significant. RFS analysis suggested that patients with breast cancer having low mRNA levels of FGFR2 had significantly worse RFS relative to the other groups (p = 0.04), whereas patients with high levels of ERBB4 had a better RFS than the opposite group (p = 9.5 × 10⁻⁵) (Figure 3D). In addition, patients with breast cancer with low mRNA levels of RET, MMP16, FN1, and SOX2 had better RFS, but this was not significant in the opposite groups (p > 0.05).
ROC plot shows strong prognostic power for RET, MMP16, and SOX2 expression
The correlation between gene expression levels with TAM response according to RFS and pathological complete response (PCR) based on transcriptome data from patients with breast cancer was analyzed. The expression levels of FGFR2, ERBB4, and MMP16 were significantly moderately correlated with AUC values of 0.568, 0.547, and 0.549, respectively (Figure 3E). The expression levels of RET, FN1, and SOX2 were not correlated with the RFS of patients treated with TAM. Using the PCR parameter, the expression levels of RET, MMP16, and SOX2 showed strong prognostic power, with AUC values of 1, 0.8, and 0.8, respectively (Figure 3F).
Generation and characterization of MCF-7 TAM-R cells
We successfully generated MCF-7 TAM-R cells by consecutive TAM treatment, as described in the methods section. MCF-7 TAM-R cells were more resistant towards TAM than the parental MCF-7 cells (Figure 4A). Moreover, TAM, at the concentrations of 25, 100, 200, and 400 μM, resulted in a significant increase in cell viability in MCF-7 TAM-R cells. The IC50 value of TAM in MCF-7 and MCF-7 TAM-R were 52.78 μM and 605.5 μM, respectively (or more than 400 μM, the highest concentration we used in the experiments). We then characterized the chemoresistance marker in TAM-R MCF-7 by qRT-PCR, and the results showed a significant increase in the mRNA levels of the ABC transporter genes MDR1, BCRP1, and MRP1 (Figure 4B). We also observed a significant downregulation of ESR1 and a significant upregulation of SOX2 in MCF-7 TAM-R cells. Among the potential target genes, we observed a significant downregulation of ERBB4 and a significant upregulation of FN1 (Figure 4C). We further analyzed the expression of the downstream signaling genes of TAM resistance regulatory pathways, including VIM, MMP9, NOTCH1, HES1, and TP53, and found a significant upregulation of VIM, NOTCH1, HES1, and TP53 in MCF-7 TAM-R cells (Figure 4D). In addition, the mRNA levels of pro-apoptosis regulatory genes CASP7 were significantly decreased, the mRNA levels of the anti-apoptosis gene BCL2 were significantly increased, and the expression levels of the proliferation marker PCNA were significantly decreased in MCF-7 TAM-R cells compared to that in the parental MCF-7 cells (Figure 4D).
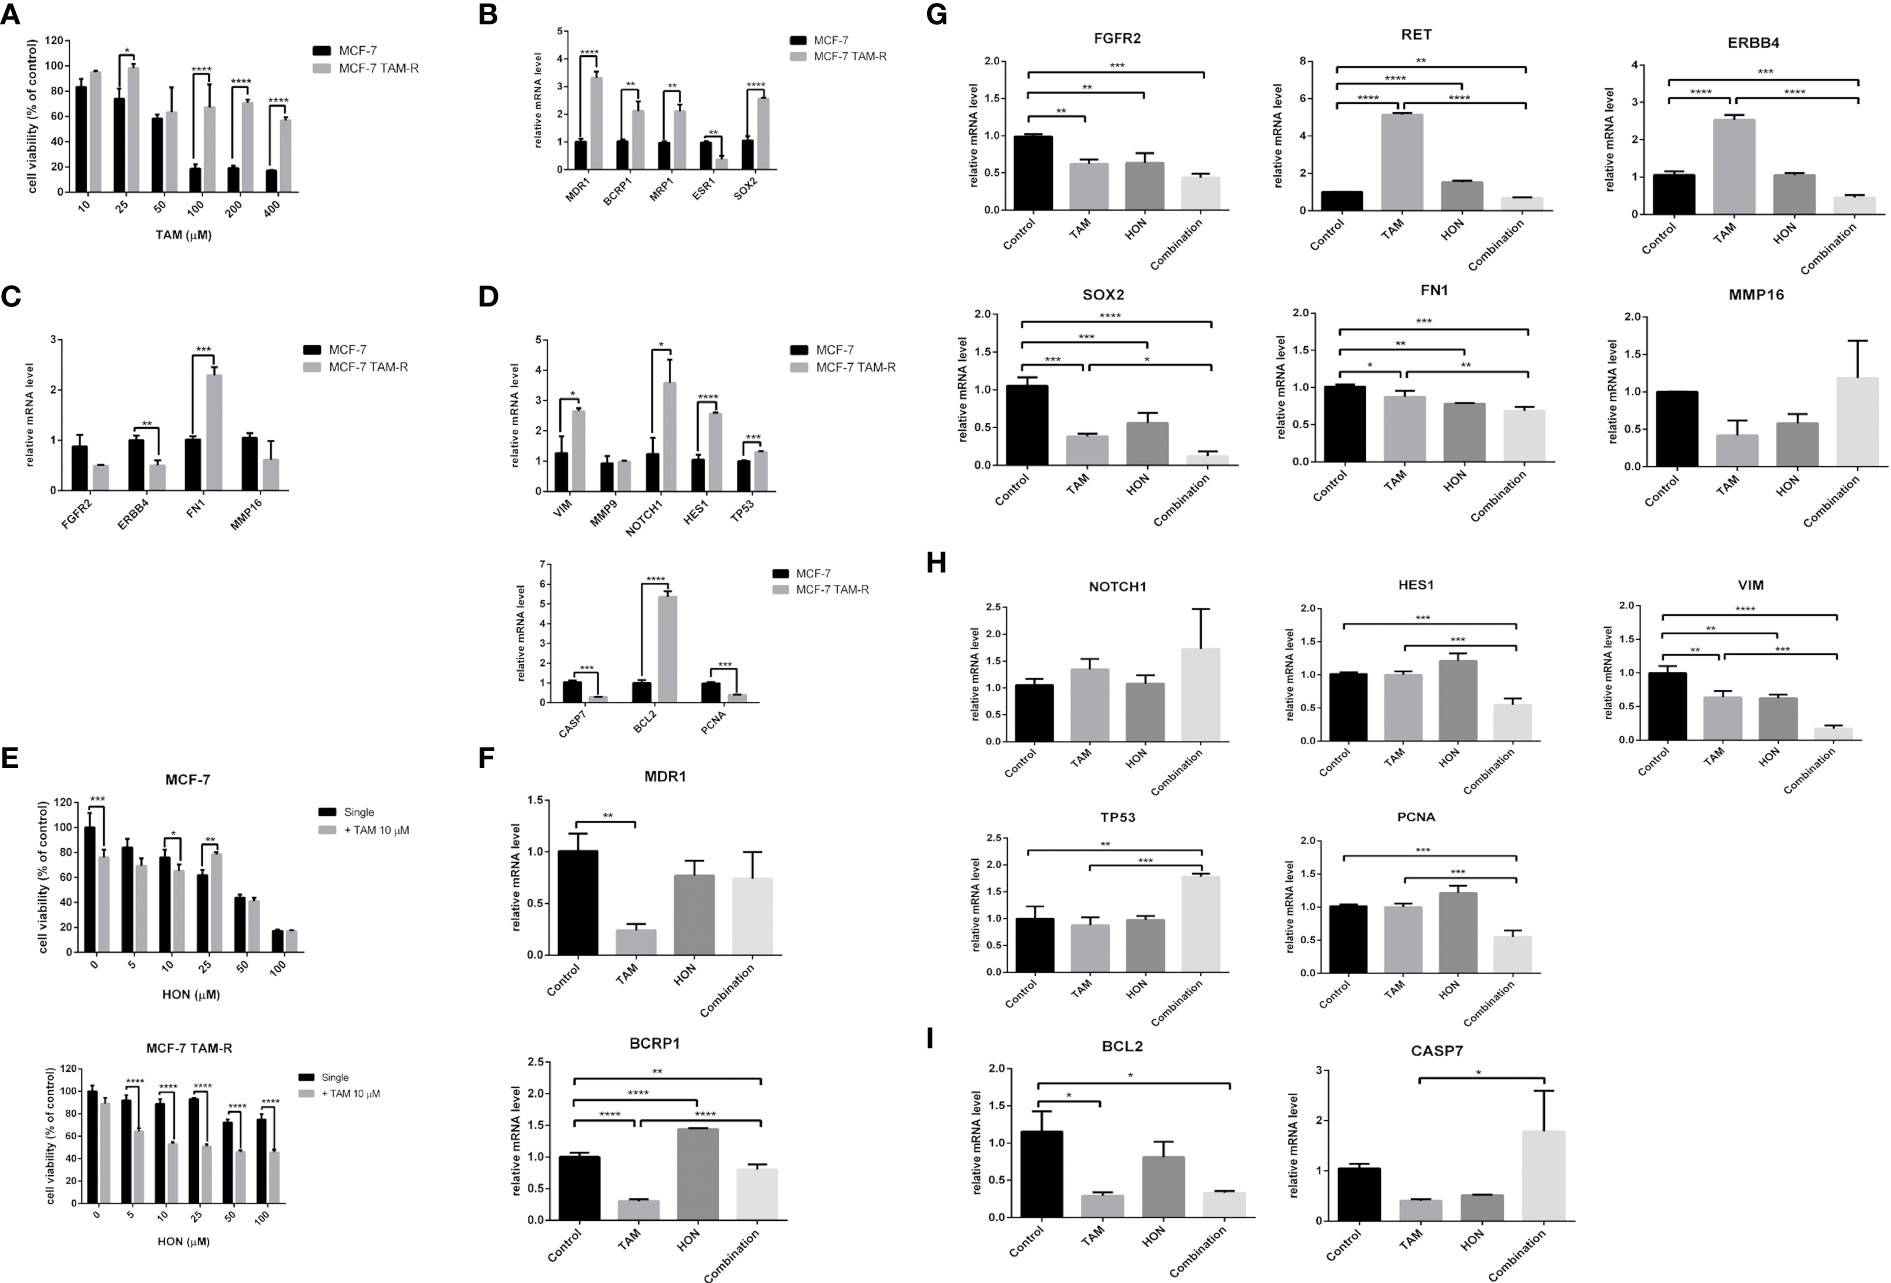
Figure 4 (A) Cytotoxicity of TAM in MCF-7 parental and MCF-7 TAM-R cells. Cells were seeded, incubated, and treated with a serial concentration of TAM. Cytotoxicity was determined using MTT assay and presented as cell viability as explained in the methods section. Results are shown as the average of three independent experiments (mean ± SD). Statistical analysis of the cytotoxicity of TAM single in MCF-7 and MCF-7 TAM-R cells was conducted using two-way ANOVA with Sidak’s multiple comparison test. *,**,***,**** indicates p < 0.05 or p < 0.01 or p < 0.001 or p < 0.0001, respectively. (B) mRNA expression of ABC transporter genes (MDR1, BCRP1, MRP1), ESR1, and SOX2 in MCF-7 and MCF-7 TAM-R cells. (C) mRNA expression of potential target genes (FGFR2, ERBB4, FN1, and MMP16) in MCF-7 and MCF-7 TAM-R cells. (D) mRNA expression of apoptosis regulatory genes (CASP7, BCL2), VIM, MMP9, NOTCH1, HES1, TP53, and PCNA in MCF-7 and MCF-7 TAM-R cells. (E) HON increased the cytotoxicity of TAM in MCF-7 parental and MCF-7 TAM-R cells. Cells were seeded, incubated, and treated with a serial concentration of TAM. Cytotoxicity was determined using an MTT assay and presented as cell viability as explained in the methods section. Results are shown as the average of three independent experiments (mean ± SD). Statistical analyses of the HON single and in combination in MCF-7 TAM-R were conducted using two-way ANOVA with Sidak’s multiple comparison test. *,**,***,**** indicates p < 0.05 or p < 0.01 or p < 0.001 or p < 0.0001, respectively. (F) A combination of 10 μM of TAM and 10 μM of HON decreased the mRNA expression levels of ABC transporter gene BCRP1, but not MDR1 in MCF-7 TAM-R cells. (G) The combination of TAM and HON decreased the mRNA expression levels of RET, ERBB4, SOX2, and FN1, but did not affect mRNA levels of FGFR2 and MMP16 in MCF-7 TAM-R cells. (H) The combination of 10 μM of TAM and 10 μM of HON decreased the mRNA expression levels of HES1, VIM, PCNA, and increased mRNA levels of TP53 in MCF-7 TAM-R cells. (I) The combination of 10 μM of TAM and 10 μM of HON decreased the mRNA expression levels of BCL2, but increased mRNA levels of CASP7 in MCF-7 TAM-R cells. Gene expression was calculated by q-RT PCR. GAPDH was used as an internal control. The results were analyzed using a comparative threshold cycle (ΔΔCT) and showed as a fold change relative to the control. Results are shown as the average of three independent experiments (mean ± SD). Statistical analyses of the mRNA in MCF-7 vs. MCF-7 TAM-R cells or HON, TAM, and combination-treated MCF-7 TAM-R cells were conducted using a student’s t-test. Statistical analyses of the mRNA upon combination treatment were conducted using one-way ANOVA with Tukey’s multiple comparison test. *,**,***,**** indicates p < 0.05 or p < 0.01 or p < 0.001 or p < 0.0001, respectively.
HON increased the sensitivity of TAM-R cells toward TAM
We evaluated the cytotoxicity of a series of concentrations of HON (0–100 μM) alone and in combination with 10 μM of TAM in both parental and MCF-7 TAM-R cells. The results revealed that the combination of TAM with HON at concentrations of 10 μM significantly increased the cytotoxicity compared to HON treatment alone in MCF-7 parental cells (Figure 4E, upper part). In addition, the combination of TAM with HON at concentrations of 5, 10, 25, 50, and 100 μM significantly increased the cytotoxicity compared to HON treatment alone, highlighting the importance of the HON-TAM combination in increasing TAM sensitivity in MCF-7 TAM-R cells (Figure 4E, lower part). The IC50 value in MCF-7 TAM-R was 600 μM for HON on its own and 32.13 μM for combined HON and TAM. The IC50 value in parental MCF-7 was 33.53 μM for HON on its own and 32.42 μM for combined HON and TAM. We then performed qRT-PCR to measure the mRNA levels upon treatment of HON, TAM, and combination in MCF-7 TAM-R cells. The combination of 10 μM TAM and 10 μM HON decreased the mRNA expression levels of the ABC transporter gene BCRP1, but not MDR1 (Figure 4F). Moreover, the combination of TAM and HON decreased the mRNA expression levels of the potential target genes RET, ERBB4, SOX2, and FN1 but did not affect the mRNA levels of FGFR2 and MMP16 (Figure 4G). We also examined the effect of the combination of 10 μM TAM and 10 μM HON on the TAM-R regulatory pathway, and observed a decrease in the mRNA expression levels of HES1, VIM, and PCNA, and increased mRNA levels of TP53 (Figure 4H). The combination of 10 μM TAM and 10 μM HON also decreased the mRNA expression levels of anti-apoptotic BCL2 but increased the mRNA levels of pro-apoptosis protein CASP7 (Figure 4I).
Molecular docking shows that HON inhibits RET, ErbB4, and Notch1
Molecular docking studies for HON with RET, ErbB4, FGFR2, and Notch1 were performed. RET, ErbB4, and FGFR2 were selected from the results of the previous step. FGFR2 was involved in the crosstalk with Notch signaling; therefore, we performed a molecular docking study of HON with Notch1. RET (PDB ID: 2IVU) docked with HON and its native ligand, vandetanib. ErbB4 (PDB ID: 3BBT) docked with HON and its native ligand, lapatinib. FGFR2 (PDB ID: 2PVF) docked with HON and its native ligand, phosphomethylphosphonic acid guanylate ester. The ankyrin domain of Notch1 (PDB ID: 2HE0) docked with HON and its native ligand, 1,2-ethanediol. An RMSD < 2 indicated the validity of the docking method (Table 5). HON had a slightly higher score than vandetanib. Three amino acids bound to HON and vandetanib, whereby Leu881 was the common amino acid (Table 5 and Figure 5A). HON had a lower docking score than lapatinib; these results indicated that HON tended to bind to ErbB4 much better than lapatinib, even though only four amino acids were bound to HON as compared to five that were bound to lapatinib. Leu825 was the main amino acid bound to HON, stabilizing and making the binding between HON and ErbB4 stronger than that with lapatinib (Table 5 and Figure 5B). HON had a higher docking score than phosphomethylphosphonic acid guanylate ester, and lower amino acid binding to FGFR2, with only two residues (Table 5 and Figure 5C). HON had a lower score than 1,2-ethanediol, the native ligand of Notch1 (Table 5). This result indicated that HON tended to bind the receptor protein Notch1 ankyrin domain much better and in a more robust manner than 1,2-ethanediol. The amino acids that interacted with HON, including Gln86, His122, and Asp155, were more abundant than those of the native ligand, with only two amino acid residues (Arg120 and Asp155) (Table 5 and Figure 5D).
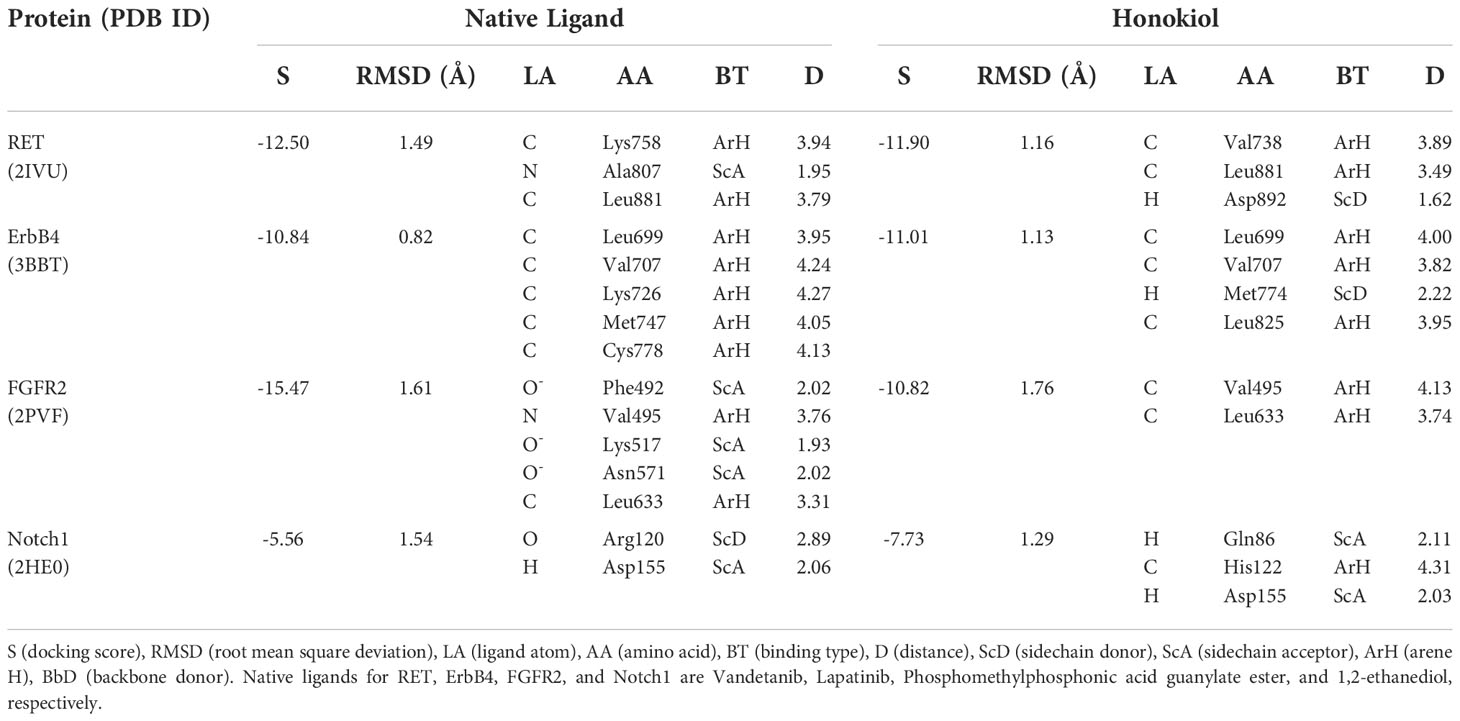
Table 5 Molecular docking results of RET, ErbB4, FGFR2, ankyrin domain of NOTCH1, its native ligand, and Honokiol.
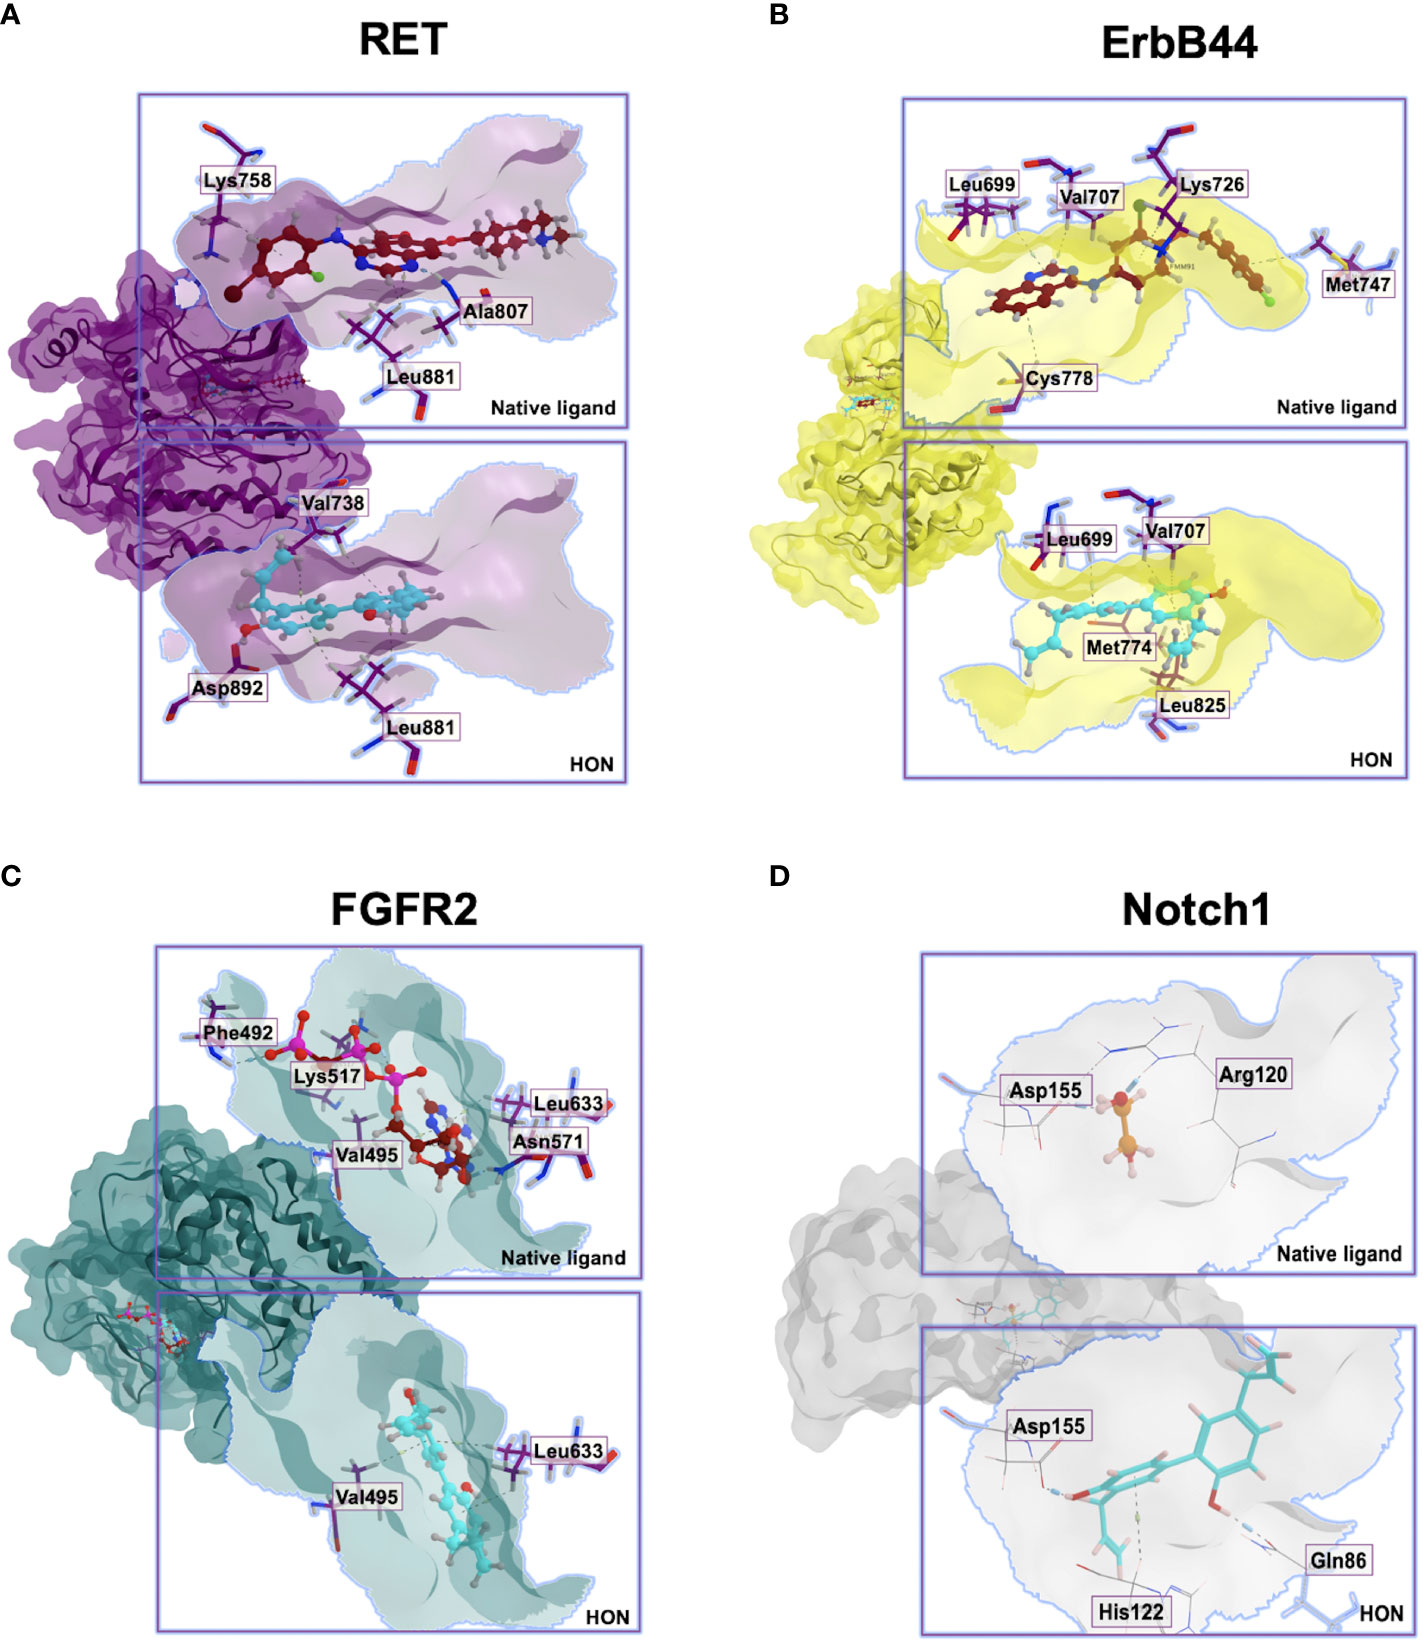
Figure 5 Molecular docking interactions between the (A). RET, (B). ErbB4, (C). FGFR2, (D). Ankyrin domain of Notch1, their native ligands, and HON.
Discussion
Using a bioinformatics approach, this study explored the potential targets and mechanisms of HON in circumventing breast cancer resistance to TAM. In vitro experiments were used to validate the results of bioinformatics analysis. GO analysis showed that the DEGs, located in the plasma membrane fraction, were involved in the biological response to endogenous stimuli. Moreover, DEGs play a role in the molecular functions of transmembrane receptor protein tyrosine kinase activity and calcium ion binding. KEGG pathway enrichment analysis revealed the regulation of endocytosis by DEGs. Receptor-mediated endocytosis involves the uptake of molecules into cytoplasmic vesicles mediated by membrane receptors, including EGFRs (29). One of the hallmarks of cancer is the perturbation in the cycles of endocytosis, both trafficking and recycling EGFRs to the membrane (30). Therefore, targeting endocytosis can be a strategy for cancer therapy to deal with TAM resistance. HON interferes with the process of dengue virus endocytosis by abrogating the colocalization of viral glycoprotein envelopes and early endosomes (31). However, the role of HON in the endocytosis of TAM-resistant breast cancer cells remains unclear.
The PPI network and hub gene selection revealed the top three genes with the highest score degree, namely FN1, FGFR2, and SOX2. A genetic alteration study of the potential target genes revealed MMP16 and ERBB4 as the genes with the highest alterations among the breast cancer samples, with most of the alterations belonging to amplification. Mutual exclusivity analysis using cBioPortal revealed ERBB4–FN1 was the only gene pair with significant co-occurrence. These results indicate that ERBB4 and FN1 are the key genes in HON treatment. Network analysis showed that FGFR2, ERBB4, and FN1 were important players in the gene network. Moreover, when network complexity was reduced by 20%, four genes were revealed, namely, FGFR2, ERBB4, FN1, and RET.
We found that RTK-Ras is a pathway linked to genetic changes in FGFR2, RET, ERBB4, SOX2, FN1, and MMP16, according to the pathway enrichment analysis. Using GEPIA, we discovered that the levels of RET and FN1 in tumor tissues were much higher than those in normal tissues. Patients with low RET, MMP16, FN1, and SOX2 had a higher overall survival rate, but this was not statistically significant. The expression levels of RET, MMP16, and SOX2 demonstrated substantial prognostic power associations, with AUC values of 1, 0.8, and 0.8, respectively. MCF-7 TAM-R cells were successfully produced, with increased mRNA levels of ABC transporter genes MDR1, BCRP1, MRP1, and SOX2, and considerable downregulation of ESR1, ERBB4, CASP7, and PCNA, as well as a large overexpression of FN1. Furthermore, we found that VIM, NOTCH1, HES1, BCL2, and TP53 were significantly upregulated in MCF-7 TAM-R cells compared with MCF-7 parental cells.
In ER+ breast cancer cells, the effect of TAM is diminished by activation of the FGFR2 signaling (32). A point mutation in FGFR2 has been detected in breast cancer cells (33). A study demonstrated that single-nucleotide polymorphisms in FGFR2 reduce the expression of FGFR2 and increase cell sensitivity of breast cancer towards estrogen (34). The RET gene, a member of the tyrosine kinase receptor family, encodes for rearrangement during the transfection (35). The RET gene is overexpressed in ER+ breast cancer cells (36). Inhibition of RET signaling enhances TAM sensitivity in the ER+ breast cancer (37). The ERBB4 gene encodes human EGFR4 (HER4), a tyrosine kinase receptor that regulates signaling pathways through the proteolytic release of intracellular and extracellular receptor fragments (38). ERBB4 overexpression occurs in ER+ breast cancer cells (39). Taken together, FGFR2, RET, and ERBB4 are potential targets of HON for overcoming ER+ breast cancer resistance to TAM.
MMP16 promotes the migration and invasion of cancer cells in the breast cancer (40). SOX2 is a cancer stem cell marker that is highly expressed in breast cancer stem cells and mediates resistance to chemotherapy (41). A previous study demonstrated that SOX2 reduces breast cancer cell sensitivity to TAM by activating Wnt signaling (42). Collectively, further studies targeting MMP16, FN1, and SOX2 using HON will reveal the mechanism of overcoming TAM resistance.
FGFR2 and ERBB4 are human epidermal growth factor receptors, in which signaling is important for the maintenance of proliferation, survival, and stemness (43–46). FGFR signaling is known to cross-talk with Notch signaling. Notch signaling mediates FGFR signaling in the nephron progenitors (47). In addition, FGFR signaling stimulates radial glial identity and interacts with Notch1 signaling in the telencephalic progenitors (48). Moreover, FGFR2 signaling induces SOX2 expression during the osteoblast differentiation (49). Overexpression of SOX2 is correlated with FGFR fusion in human lung cancer cells (50). Inhibition of FGFR signaling leads to the downregulation of SOX2, which maintains the stemness of pancreatic cancer cells (51). A previous study demonstrated that HON inhibits Notch signaling in colon cancer stem cells (52) and melanoma stem cells (53). Therefore, future studies on the mechanism of HON targeting FGFR2 and Notch signaling in overcoming breast cancer resistance to TAM are needed.
Molecular docking results showed that HON can inhibit RET and ErbB4. HON had a slightly higher score than Vandetanib to bind with RET. Due to Leu825 stabilizing and making the binding between HON and ErbB4 stronger than Lapatinib, they have a higher tendency to bind together. This finding is supported by previous studies that demonstrated the binding of HON to the kinase domain of ErbB (54–56). Results of this study showed that HON has a higher docking score than Phosphomethylphosphonic acid guanylate ester to bind FGFR2; however, HON has been shown to inhibit FGFR signaling in lung squamous cell carcinoma (57). Therefore, further investigations on the effect of HON on FGFR2 are still needed. After validating the axis between SOX2, Notch, and FGFR2, we performed a molecular docking study to determine whether HON can act as a Notch inhibitor. Molecular docking results showed that HON is a potent inhibitor of the ankyrin domain of the Notch receptor. The ankyrin domain is an intracellular domain of the Notch receptor that plays a role in the Notch1 signaling (58). Ankyrins link membrane proteins to the cytoskeleton and function in protein expression and stability (59). The ankyrin domain in Notch plays a role in converting the transcriptional repression complex into an active complex (60). Ankyrin inhibition causes transcriptional repression of target genes in Notch1 signaling. HON was shown to inhibit the ankyrin domain of Notch1, as indicated by its lower binding energy than that of its native ligand (1,2-ethanediol). Results of the molecular docking study need to be confirmed using in vitro studies such as enzymatic assay, western blotting of the downstream signaling of RTK-Ras, and crystallographic study.
The results of this study showed modulation of gene expression in TAM-R MCF-7 cells. ERBB4 was downregulated while FN1 was upregulated in TAM-R cells. These findings are supported by previous studies that demonstrated the downregulation of ERBB4 (61), and the upregulation of FN1 in TAM resistance (62–64). Significant upregulation of VIM, NOTCH1, HES1, and TP53 in was observed in TAM-R MCF-7 cells, indicating increased Notch signaling, epithelial to mesenchymal transition, and inhibition of cell cycle in TAM-R cells. The expression levels of the proliferation marker PCNA were significantly decreased in TAM-R MCF-7 cells, this result is supported by a study reported by Post (2020) which showed the downregulation of PCNA and genes involved in the cell cycle (65).
This study revealed that the cytotoxic effects of HON and TAM in TAM-R MCF-7 cells potentiated TAM efficacy. This effect is stronger in MCF-7 TAM-R than in MCF-7 parental cells, in which the combination of TAM and 25 μM of HON generated higher cell viability. Molecularly, the combination of HON and TAM decreased the mRNA expression levels of ABC transporter gene BCRP1, potential target genes, including RET, ERBB4, SOX2, FN1, regulatory genes of TAM-R, including HES1, VIM, PCNA, and BCL2; and increased the mRNA levels of TP53 and CASP7. The combination of 10 μM TAM and 10 μM HON decreased the mRNA expression levels of the ABC transporter gene BCRP1, but not MDR1. In addition, TAM single treatment decreases the mRNA levels of MDR1 and BCRP1 in TAM-R cells. This finding is supported by data in previous studies that TAM treatment in colon cancer cells can reduce the expression level of MDR1 (66). In addition, the decrease in BCRP1 expression due to TAM treatment in MCF-7 TAM-R cells was also in accordance with a previous study by Selevar et al., 2011 which showed downregulation of BCRP1 due to TAM in TAM-R cells (67). Furthermore, the increase in BCRP1 expression in the HON treatment is probably because HON is a substrate of BCRP1, according to a previous study by (68). The same group also stated that HON was also able to inhibit the BCRP1 activity (68). In this study, we did not measure BCRP1 activity due to HON treatment, so although BCRP1 mRNA increased, its activity may be decreased due to HON treatment. This topic becomes interesting for further research.
The combination of TAM and HON decreased the mRNA expression levels of the potential target genes RET, ERBB4, SOX2, and FN1 but did not affect the mRNA levels of FGFR2 and MMP16. The decrease in mRNA levels of RET was supported by a study by Plaza-Menacho (2010), in which the downregulation of RET increases the sensitivity of MCF-7 cells toward TAM (69). Downregulation of ERBB4 is supported by a previous study that downregulation of ERBB leads to the increased sensitivity of breast cancer cells to TAM (70). Decrease expression of FN1 and SOX2 indicating the inhibition of migration, invasion, and maintenance of cancer stem cell stemness. We observed a decrease in the mRNA expression levels of HES1, VIM, and PCNA, and increased mRNA levels of TP53, indicating the inhibition of Notch signaling, EMT, and a decrease in cell cycle and DNA repair activity due to HON treatment.
In this study, we postulated the mechanism of HON in overcoming breast cancer resistance towards TAM (Figure 6). Activation of ErbB and FGFR signaling leads to the activation of its downstream signaling, PI3K/Akt (71, 72) and the Ras/MAPK pathway (73). Activation of RET signaling promotes the activation of its downstream signaling Ras/MAPK and the PI3K/Akt pathways (74) Activation of Mapk signaling leads to the overexpression of SOX2 (75, 76) other studies demonstrated that activation of PI3k/Akt signaling was found to upregulate the expression of SOX-2 (77). The crosstalk between PI3K/Akt signaling and Notch was observed in the regulation of breast cancer development (78). In addition, Notch1 signaling regulates the expression of PTEN, an inhibitor of PI3K/AKT signaling, via HES1 (79). FN1 regulates the Notch signaling pathway (80). Another study showed that SOX2 is a transcription factor of FN1 that promotes the migration and invasion of ovarian cancer cells (81). Activation of FGFR2 signaling promotes downstream signaling PI3K/Akt and subsequently increases the expression level of MMP16 (82). A recent study demonstrated that SOX2 also promotes the expression of FGFR2 (75)
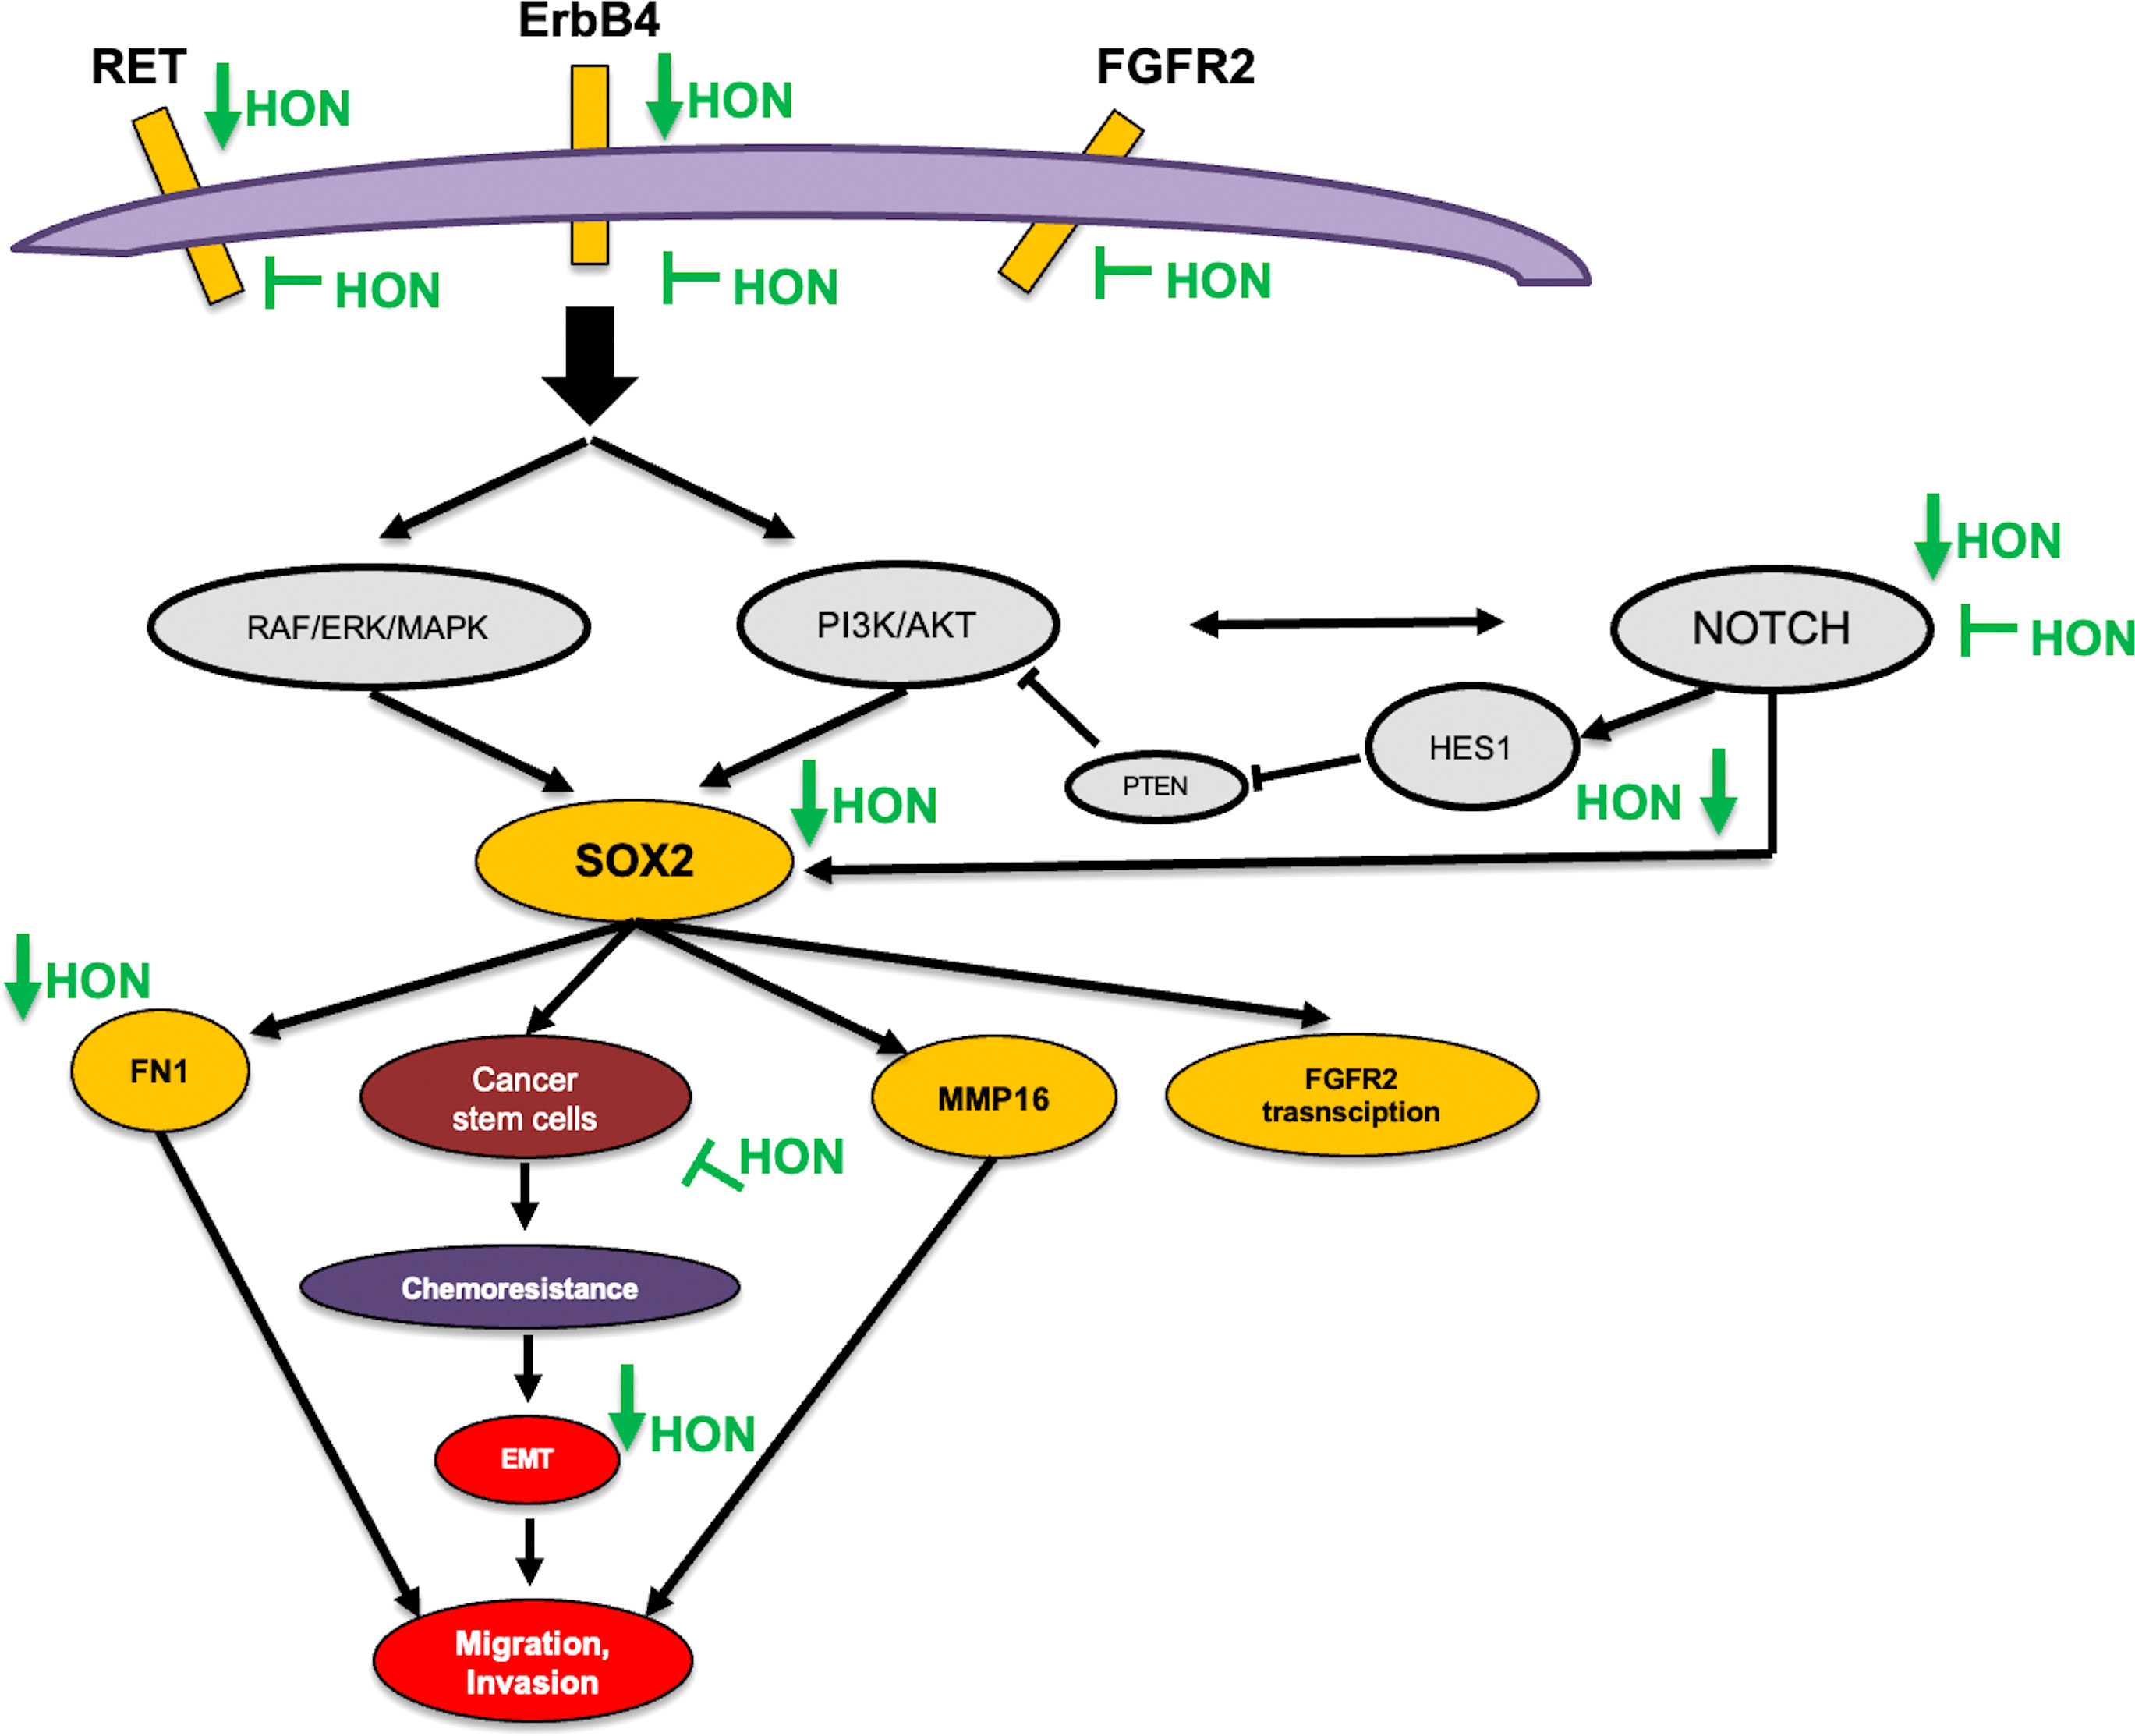
Figure 6 Proposed mechanism of HON in overcoming breast cancer resistance to TAM.
The ErbB signaling pathway is involved in the activation of alternative signaling pathways involved in TAM resistance (83). Moreover, upregulation of the receptor tyrosine kinase has been observed in TAM-R breast cancer cells (84). FGFR2 signaling plays a role in cancer-associated fibroblast-dependent breast cancer resistance to TAM (85). Downregulation of RET increased the sensitivity of MCF-7 breast cancer cells to TAM (69). Piva et al. (2014) showed that SOX2 is upregulated in TAM-R breast cancer cells and promotes breast cancer resistance to TAM (42). These results are also supported by those of Sommer et al. (2018), which demonstrated the upregulation of SOX2 in TAM-R breast cancer cells (22). Recently, SOX2 was shown to be a predictive marker for the early detection of TAM resistance in ER-positive breast cancer patients (86). Sox-2 promotes chemoresistance, maintains cancer stem cell properties, and induces epithelial-mesenchymal transition (87). The results of this study indicate that HON can inhibit RET, ErbB4, and Notch activity based on molecular docking studies. Moreover, the combination of HON and TAM reduced the expression of the potential target genes SOX2, RET, ERBB4, and FN1, as well as the neighboring genes HES1, VIM, and PCNA. This proves the potential of HON to overcome the resistance of breast cancer cells to TAM by inhibiting the expression of these target genes.
One limitation of this study is that the data mining was carried out indirectly on MCF-7 TAM-R cells treated with HON. However, this data mining model was further validated with MCF-7 TAM-R cells whose data are presented in our results. Another limitation is that the microarray data were derived from only one cell line. Therefore, it is necessary to conduct research using microarray data from other types of ER+ breast cancer cells such as T47D. Another limitation is that the molecular mechanism was studied at the mRNA level, and therefore, it needs further clarification at the protein level. This study used a bioinformatics approach to identify the potential target genes of HON and in vitro experiments to validate the bioinformatics findings via mRNA level measurements. Collectively, this study has accelerated the discovery of molecular targets and mechanisms of HON as a therapeutic agent to overcome the resistance of breast cancer cells to TAM. However, the results of this study need to be validated by measurement of protein levels in vitro as well as in vivo and by conducting clinical trials.
Conclusions
In conclusion, FGFR2, RET, ERBB4, MMP16, FN1, and SOX2 are potential targets of HON for overcoming TAM resistance in breast cancer. The combination of HON and TAM in TAM-R MCF-7 cells promoted TAM sensitivity. It also induced the downregulation of BCRP1 and potential target genes, including RET, ERBB4, SOX2, FN1, HES1, VIM, PCNA, and BCL2, and elevated the mRNA levels of TP53 and CASP7. In addition, molecular docking revealed that HON inhibits RET, ErbB4, and Notch signaling to overcome TAM resistance in breast cancer cells. However, further in vitro and in vivo and clinical studies are required to validate the results of this study.
Data availability statement
The datasets presented in this study can be found in online repositories. The names of the repository/repositories and accession number(s) can be found in the article/Supplementary Material.
Author contributions
AH conceptualized and designed the study; acquired, analyzed, and interpreted the data; and drafted and revised the article. HP and NH analyzed, and interpreted the data, and drafted the article, NF and HP acquired the data. All authors contributed to the article and approved the submitted version.
Acknowledgments
The authors thank Badan Penerbit dan Publikasi Universitas Gadjah Mada for their writing assistance.
Conflict of interest
The authors declare that the research was conducted in the absence of any commercial or financial relationships that could be construed as a potential conflict of interest.
Publisher’s note
All claims expressed in this article are solely those of the authors and do not necessarily represent those of their affiliated organizations, or those of the publisher, the editors and the reviewers. Any product that may be evaluated in this article, or claim that may be made by its manufacturer, is not guaranteed or endorsed by the publisher.
Supplementary material
The Supplementary Material for this article can be found online at: https://www.frontiersin.org/articles/10.3389/fonc.2022.1019025/full#supplementary-material
Abbreviations
DEGs, differentially expressed genes; EGFR, epidermal growth factor receptor; Hon, honokiol; PPI, protein-protein-interaction; TAM, tamoxifen; TAM-R, tamoxifen-resistance GO, Gene Ontology; KEGG, Kyoto Encyclopedia of Genes and Genomes; ROC, receiver operating characteristic; AUC, Area Under the Curve.
References
1. Shagufta, Ahmad I. Tamoxifen a pioneering drug: An update on the therapeutic potential of tamoxifen derivatives. Eur J Med Chem (2018) 143:515–31. doi: 10.1016/j.ejmech.2017.11.056
2. Ojo D, Wei F, Liu Y, Wang E, Zhang H, Lin X, et al. Factors promoting tamoxifen resistance in breast cancer via stimulating breast cancer stem cell expansion. Curr Med Chem (2015) 22:2360–74. doi: 10.2174/0929867322666150416095744
3. Ring A, Dowsett M. Mechanisms of tamoxifen resistance. Endocrine-related Cancer (2004) 11:643–58. doi: 10.1677/erc.1.00776
4. Poulard C, Jacquemetton J, Tredan O, Cohen PA, Vendrell J, Ghayad SE, et al. Oestrogen non-genomic signalling is activated in tamoxifen-resistant breast cancer. Int J Mol Sci (2019) 20:2773. doi: 10.3390/ijms20112773
5. Kruger DT, Alexi X, Opdam M, Schuurman K, Voorwerk L, Sanders J, et al. IGF-1R pathway activation as putative biomarker for linsitinib therapy to revert tamoxifen resistance in ER-positive breast cancer. Int J Cancer (2019) 146:2348–59. doi: 10.1002/ijc.32668
6. Prasad R, Katiyar SK. Honokiol, an active compound of magnolia plant, inhibits growth, and progression of cancers of different organs. Adv Exp Med Biol (2016) 928:245–65. doi: 10.1007/978-3-319-41334-1_11
7. Liu H, Zang C, Emde A, Planas-Silva MD, Rosche M, Kuhnl A, et al. Anti-tumor effect of honokiol alone and in combination with other anti-cancer agents in breast cancer. Eur J Pharmacol (2008) 591:43–51. doi: 10.1016/j.ejphar.2008.06.026
8. Leeman-Neill RJ, Cai Q, Joyce SC, Thomas SM, Bhola NE, Neill DB, et al. Honokiol inhibits epidermal growth factor receptor signaling and enhances the antitumor effects of epidermal growth factor receptor inhibitors. Clin Cancer Res (2010) 16:2571–9. doi: 10.1158/1078-0432.CCR-10-0333
9. Sarrica A, Kirika N, Romeo M, Salmona M, Diomede L. Safety and toxicology of magnolol and honokiol. Planta Med (2018) 84:1151–64. doi: 10.1055/a-0642-1966
10. Rauf A, Patel S, Imran M, Maalik A, Arshad MU, Saeed F, et al. Honokiol: An anticancer lignan. Biomed pharmacother = Biomed pharmacother (2018) 107:555–62. doi: 10.1016/j.biopha.2018.08.054
11. Gowda AS, Suo Z, Spratt TE. Honokiol inhibits DNA polymerases beta and lambda and increases bleomycin sensitivity of human cancer cells. Chem Res Toxicol (2017) 30:715–25. doi: 10.1021/acs.chemrestox.6b00451
12. Elias D, Vever H, Laenkholm AV, Gjerstorff MF, Yde CW, Lykkesfeldt AE, et al. Gene expression profiling identifies FYN as an important molecule in tamoxifen resistance and a predictor of early recurrence in patients treated with endocrine therapy. Oncogene (2015) 34:1919–27. doi: 10.1038/onc.2014.138
13. Lv C, Wu X, Wang X, Su J, Zeng H, Zhao J, et al. The gene expression profiles in response to 102 traditional Chinese medicine (TCM) components: A general template for research on TCMs. Sci Rep (2017) 7:352. doi: 10.1038/s41598-017-00535-8
14. Huang da W, Sherman BT, Lempicki RA. Bioinformatics enrichment tools: paths toward the comprehensive functional analysis of large gene lists. Nucleic Acids Res (2009) 37:1–13. doi: 10.1093/nar/gkn923
15. Szklarczyk D, Franceschini A, Wyder S, Forslund K, Heller D, Huerta-Cepas J, et al. STRING v10: protein-protein interaction networks, integrated over the tree of life. Nucleic Acids Res (2015) 43:D447–52. doi: 10.1093/nar/gku1003
16. Shannon P, Markiel A, Ozier O, Baliga NS, Wang JT, Ramage D, et al. Cytoscape: A software environment for integrated models of biomolecular interaction networks. Genome Res (2003) 13:2498–504. doi: 10.1101/gr.1239303
17. Cerami E, Gao J, Dogrusoz U, Gross BE, Sumer SO, Aksoy BA, et al. The cBio cancer genomics portal: an open platform for exploring multidimensional cancer genomics data. Cancer Discov (2012) 2:401–4. doi: 10.1158/2159-8290.CD-12-0095
18. Gao J, Aksoy BA, Dogrusoz U, Dresdner G, Gross B, Sumer SO, et al. Integrative analysis of complex cancer genomics and clinical profiles using the cBioPortal. Sci Signaling (2013) 6:l1. doi: 10.1126/scisignal.2004088
19. Tang Z, Li C, Kang B, Gao G, Li C, Zhang Z. GEPIA: A web server for cancer and normal gene expression profiling and interactive analyses. Nucleic Acids Res (2017) 45:W98–102. doi: 10.1093/nar/gkx247
20. Győrffy B. Survival analysis across the entire transcriptome identifies biomarkers with the highest prognostic power in breast cancer. Comput Struct Biotechnol J (2021) 19:4101–9. doi: 10.1016/j.csbj.2021.07.014
21. Fekete JT, Győrffy B. ROCplot.org: Validating predictive biomarkers of chemotherapy/hormonal therapy/anti-HER2 therapy using transcriptomic data of 3,104 breast cancer patients. Int J Cancer (2019) 145:3140–51. doi: 10.1002/ijc.32369
22. Sommer AK, Hermawan A, Mickler FM, Ljepoja B, Knyazev P, Bräuchle C, et al. Salinomycin co-treatment enhances tamoxifen cytotoxicity in luminal a breast tumor cells by facilitating lysosomal degradation of receptor tyrosine kinases. Oncotarget (2016) 7:50461–76. doi: 10.18632/oncotarget.10459
23. Heberle H, Meirelles GV, da Silva FR, Telles GP, Minghim R. InteractiVenn: A web-based tool for the analysis of sets through Venn diagrams. BMC Bioinf (2015) 16:169. doi: 10.1186/s12859-015-0611-3
24. Xu J, Gong L, Qian Z, Song G, Liu J. ERBB4 promotes the proliferation of gastric cancer cells via the PI3K/Akt signaling pathway. Oncol Rep (2018) 39:2892–8. doi: 10.3892/or.2018.6343
25. Jiang C, Wang J, Dong C, Wei W, Li J, Li X. Membranous type matrix metalloproteinase 16 induces human prostate cancer metastasis. Oncol Lett (2017) 14:3096–102. doi: 10.3892/ol.2017.6536
26. Topalovski M, Brekken RA. Matrix control of pancreatic cancer: New insights into fibronectin signaling. Cancer Lett (2016) 381:252–8. doi: 10.1016/j.canlet.2015.12.027
27. Novak D, Huser L, Elton JJ, Umansky V, Altevogt P, Utikal J. SOX2 in development and cancer biology. Semin Cancer Biol (2019) 67:74–82. doi: 10.1016/j.semcancer.2019.08.007
28. Lefebvre C, Bachelot T, Filleron T, Pedrero M, Campone M, Soria JC, et al. Mutational profile of metastatic breast cancers: A retrospective analysis. PloS Med (2016) 13:e1002201. doi: 10.1371/journal.pmed.1002201
29. Mellman I, Yarden Y. Endocytosis and cancer. Cold Spring Harbor Perspect Biol (2013) 5:a016949. doi: 10.1101/cshperspect.a016949
30. Mosesson Y, Mills GB, Yarden Y. Derailed endocytosis: an emerging feature of cancer. Nat Rev Cancer (2008) 8:835–50. doi: 10.1038/nrc2521
31. Fang C-Y, Chen S-J, Wu H-N, Ping Y-H, Lin C-Y, Shiuan D, et al. Honokiol, a lignan biphenol derived from the magnolia tree, inhibits dengue virus type 2 infection. Viruses (2015) 7:4894–910. doi: 10.3390/v7092852
32. Turczyk L, Kitowska K, Mieszkowska M, Mieczkowski K, Czaplinska D, Piasecka D, et al. FGFR2-driven signaling counteracts tamoxifen effect on ERalpha-positive breast cancer cells. Neoplasia (New York N.Y.) (2017) 19:791–804. doi: 10.1016/j.neo.2017.07.006
33. Lei H, Deng C-X. Fibroblast growth factor receptor 2 signaling in breast cancer. Int J Biol Sci (2017) 13:1163–71. doi: 10.7150/ijbs.20792
34. Campbell TM, Castro MAA, de Santiago I, Fletcher MNC, Halim S, Prathalingam R, et al. FGFR2 risk SNPs confer breast cancer risk by augmenting oestrogen responsiveness. Carcinogenesis (2016) 37:741–50. doi: 10.1093/carcin/bgw065
35. Morandi A, Plaza-Menacho I, Isacke CM. RET in breast cancer: functional and therapeutic implications. Trends Mol Med (2011) 17:149–57. doi: 10.1016/j.molmed.2010.12.007
36. Griseri P, Garrone O, Lo Sardo A, Monteverde M, Rusmini M, Tonissi F, et al. Genetic and epigenetic factors affect RET gene expression in breast cancer cell lines and influence survival in patients. Oncotarget (2016) 7:26465–79. doi: 10.18632/oncotarget.8417
37. Alao JP, Michlikova S, Diner P, Grotli M, Sunnerhagen P. Selective inhibition of RET mediated cell proliferation in vitro by the kinase inhibitor SPP86. BMC Cancer (2014) 14:853. doi: 10.1186/1471-2407-14-853
38. Hollmén M, Liu P, Kurppa K, Wildiers H, Reinvall I, Vandorpe T, et al. Proteolytic processing of ErbB4 in breast cancer. PloS One (2012) 7:e39413. doi: 10.1371/journal.pone.0039413
39. Sundvall M, Iljin K, Kilpinen S, Sara H, Kallioniemi O-P, Elenius K. Role of ErbB4 in breast cancer. J Mammary Gland Biol Neoplasia (2008) 13:259–68. doi: 10.1007/s10911-008-9079-3
40. Zhang W, Chen CJ, Guo GL. MiR-155 promotes the proliferation and migration of breast cancer cells via targeting SOCS1 and MMP16. Eur Rev Med Pharmacol Sci (2018) 22:7323–32. doi: 10.26355/eurrev_201811_16269
41. Kashii-Magaribuchi K, Takeuchi R, Haisa Y, Sakamoto A, Itoh A, Izawa Y, et al. Induced expression of cancer stem cell markers ALDH1A3 and sox-2 in hierarchical reconstitution of apoptosis-resistant human breast cancer cells. Acta histochem cytochem (2016) 49:149–58. doi: 10.1267/ahc.16031
42. Piva M, Domenici G, Iriondo O, Rábano M, Simões BM, Comaills V, et al. Sox2 promotes tamoxifen resistance in breast cancer cells. EMBO Mol Med (2014) 6:66–79. doi: 10.1002/emmm.201303411
43. Dorry SJ, Ansbro BO, Ornitz DM, Mutlu GM, Guzy RD. FGFR2 is required for AEC2 homeostasis and survival after bleomycin-induced lung injury. Am J Respir Cell Mol Biol (2020) 62:608–21. doi: 10.1165/rcmb.2019-0079OC
44. Frey MR, Hilliard VC, Mullane MT, Polk DB. ErbB4 promotes cyclooxygenase-2 expression and cell survival in colon epithelial cells. Lab Invest (2010) 90:1415–24. doi: 10.1038/labinvest.2010.117
45. Kawane T, Qin X, Jiang Q, Miyazaki T, Komori H, Yoshida CA, et al. Runx2 is required for the proliferation of osteoblast progenitors and induces proliferation by regulating Fgfr2 and Fgfr3. Sci Rep (2018) 8:13551. doi: 10.1038/s41598-018-31853-0
46. Liang X, Ding Y, Lin F, Zhang Y, Zhou X, Meng Q, et al. Overexpression of ERBB4 rejuvenates aged mesenchymal stem cells and enhances angiogenesis via PI3K/AKT and MAPK/ERK pathways. FASEB J (2019) 33:4559–70. doi: 10.1096/fj.201801690R
47. Zhou M, Sutliff RL, Paul RJ, Lorenz JN, Hoying JB, Haudenschild CC, et al. Fibroblast growth factor 2 control of vascular tone. Nat Med (1998) 4:201–7. doi: 10.1038/nm0298-201
48. Yoon K, Nery S, Rutlin ML, Radtke F, Fishell G, Gaiano N. Fibroblast growth factor receptor signaling promotes radial glial identity and interacts with Notch1 signaling in telencephalic progenitors. J Neurosci (2004) 24:9497–506. doi: 10.1523/JNEUROSCI.0993-04.2004
49. Mansukhani A, Ambrosetti D, Holmes G, Cornivelli L, Basilico C. Sox2 induction by FGF and FGFR2 activating mutations inhibits wnt signaling and osteoblast differentiation. J Cell Biol (2005) 168:1065–76. doi: 10.1083/jcb.200409182
50. Zheng S, Pan Y, Wang R, Li Y, Cheng C, Shen X, et al. SOX2 expression is associated with FGFR fusion genes and predicts favorable outcome in lung squamous cell carcinomas. OncoTargets Ther (2015) 8:3009–16. doi: 10.2147/OTT.S91293
51. Quan M-Y, Guo Q, Liu J, Yang R, Bai J, Wang W, et al. An FGFR/AKT/SOX2 signaling axis controls pancreatic cancer stemness. Front Cell Dev Biol (2020) 8. doi: 10.3389/fcell.2020.00287
52. Ponnurangam S, Mammen JM, Ramalingam S, He Z, Zhang Y, Umar S, et al. Honokiol in combination with radiation targets notch signaling to inhibit colon cancer stem cells. Mol Cancer Ther (2012) 11:963–72. doi: 10.1158/1535-7163.MCT-11-0999
53. Kaushik G, Venugopal A, Ramamoorthy P, Standing D, Subramaniam D, Umar S, et al. Honokiol inhibits melanoma stem cells by targeting notch signaling. Mol Carcinog (2015) 54:1710–21. doi: 10.1002/mc.22242
54. Saeed M, Kuete V, Kadioglu O, Börtzler J, Khalid H, Greten HJ, et al. Cytotoxicity of the bisphenolic honokiol from magnolia officinalis against multiple drug-resistant tumor cells as determined by pharmacogenomics and molecular docking. Phytomedicine (2014) 21:1525–33. doi: 10.1016/j.phymed.2014.07.011
55. Singh T, Gupta NA, Xu S, Prasad R, Velu SE, Katiyar SK. Honokiol inhibits the growth of head and neck squamous cell carcinoma by targeting epidermal growth factor receptor. Oncotarget (2015) 6:21268–82. doi: 10.18632/oncotarget.4178
56. Song JM, Anandharaj A, Upadhyaya P, Kirtane AR, Kim JH, Hong KH, et al. Honokiol suppresses lung tumorigenesis by targeting EGFR and its downstream effectors. Oncotarget (2016) 7:57752–69. doi: 10.18632/oncotarget.10759
57. Cen M, Yao Y, Cui L, Yang G, Lu G, Fang L, et al. Honokiol induces apoptosis of lung squamous cell carcinoma by targeting FGF2-FGFR1 autocrine loop. Cancer Med (2018) 7:6205–18. doi: 10.1002/cam4.1846
58. Ehebauer MT, Chirgadze DY, Hayward P, Martinez Arias A, Blundell TL. High-resolution crystal structure of the human notch 1 ankyrin domain. Biochem J (2005) 392:13–20. doi: 10.1042/BJ20050515
59. Cunha SR, Mohler PJ. Ankyrin protein networks in membrane formation and stabilization. J Cell Mol Med (2009) 13:4364–76. doi: 10.1111/j.1582-4934.2009.00943.x
60. Lubman OY, Kopan R, Waksman G, Korolev S. The crystal structure of a partial mouse notch-1 ankyrin domain: repeats 4 through 7 preserve an ankyrin fold. Protein sci: Publ Protein Soc (2005) 14:1274–81. doi: 10.1110/ps.041184105
61. Hutcheson IR, Knowlden JM, Hiscox SE, Barrow D, Gee JM, Robertson JF, et al. Heregulin beta1 drives gefitinib-resistant growth and invasion in tamoxifen-resistant MCF-7 breast cancer cells. Breast Cancer Res (2007) 9:R50. doi: 10.1186/bcr1754
62. Xu D, Zhang Y, Jin F. The role of AKR1 family in tamoxifen resistant invasive lobular breast cancer based on data mining. BMC Cancer (2021) 21:1321. doi: 10.1186/s12885-021-09040-8
63. You D, Jung SP, Jeong Y, Bae SY, Lee JE, Kim S. Fibronectin expression is upregulated by PI-3K/Akt activation in tamoxifen-resistant breast cancer cells. BMB Rep (2017) 50:615–20. doi: 10.5483/BMBRep.2017.50.12.096
64. Zhou C, Zhong Q, Rhodes LV, Townley I, Bratton MR, Zhang Q, et al. Proteomic analysis of acquired tamoxifen resistance in MCF-7 cells reveals expression signatures associated with enhanced migration. Breast Cancer Res (2012) 14:R45. doi: 10.1186/bcr3144
65. Post AEM, Bussink J, Sweep F, Span PN. Changes in DNA damage repair gene expression and cell cycle gene expression do not explain radioresistance in tamoxifen-resistant breast cancer. Oncol Res (2020) 28:33–40. doi: 10.3727/096504019X15555794826018
66. Shen L-Z, Hua Y-B, Yu X-M, Xu Q, Chen T, Wang J-H, et al. Tamoxifen can reverse multidrug resistance of colorectal carcinoma in vivo. World J Gastroenterol: WJG (2005) 11:1060. doi: 10.3748/wjg.v11.i7.1060
67. Selever J, Gu G, Lewis MT, Beyer A, Herynk MH, Covington KR, et al. Dicer-mediated upregulation of BCRP confers tamoxifen resistance in human breast cancer cells. Clin Cancer Res (2011) 17:6510–21. doi: 10.1158/1078-0432.CCR-11-1403
68. Yu CP, Li PY, Chen SY, Lin SP, Hou YC. Magnolol and honokiol inhibited the function and expression of BCRP with mechanism exploration. Molecules (2021) 26:7390. doi: 10.3390/molecules26237390
69. Plaza-Menacho I, Morandi A, Robertson D, Pancholi S, Drury S, Dowsett M, et al. Targeting the receptor tyrosine kinase RET sensitizes breast cancer cells to tamoxifen treatment and reveals a role for RET in endocrine resistance. Oncogene (2010) 29:4648–57. doi: 10.1038/onc.2010.209
70. Yin L, Pan X, Zhang X-T, Guo Y-M, Wang Z-Y, Gong Y, et al. Downregulation of ER-α36 expression sensitizes HER2 overexpressing breast cancer cells to tamoxifen. Am J Cancer Res (2015) 5:530–44.
71. Holzhauser S, Wild N, Zupancic M, Ursu RG, Bersani C, Näsman A, et al. Targeted therapy with PI3K and FGFR inhibitors on human papillomavirus positive and negative tonsillar and base of tongue cancer lines with and without corresponding mutations. Front Oncol (2021) 11. doi: 10.3389/fonc.2021.640490
72. Issa A, Gill JW, Heideman MR, Sahin O, Wiemann S, Dey JH, et al. Combinatorial targeting of FGF and ErbB receptors blocks growth and metastatic spread of breast cancer models. Breast Cancer Res: BCR (2013) 15:R8. doi: 10.1186/bcr3379
73. Moon H, Ro SW. Ras mitogen-activated protein kinase signaling and kinase suppressor of ras as therapeutic targets for hepatocellular carcinoma. J Liver Cancer (2021) 21:1–11. doi: 10.17998/jlc.21.1.1
74. Mohammadi M, Hedayati M. A brief review on the molecular basis of medullary thyroid carcinoma. Cell J (2017) 18:485–92. doi: 10.22074/cellj.2016.4715
75. Sankoda N, Tanabe W, Tanaka A, Shibata H, Woltjen K, Chiba T, et al. Epithelial expression of Gata4 and Sox2 regulates specification of the squamous-columnar junction via MAPK/ERK signaling in mice. Nat Commun (2021) 12:560. doi: 10.1038/s41467-021-20906-0
76. Uchiyama A, Nayak S, Graf R, Cross M, Hasneen K, Gutkind JS, et al. SOX2 epidermal overexpression promotes cutaneous wound healing via activation of EGFR/MEK/ERK signaling mediated by EGFR ligands. J Invest Dermatol (2019) 139:1809–20.e8. doi: 10.1016/j.jid.2019.02.004
77. Schaefer T, Lengerke C. SOX2 protein biochemistry in stemness, reprogramming, and cancer: the PI3K/AKT/SOX2 axis and beyond. Oncogene (2020) 39:278–92. doi: 10.1038/s41388-019-0997-x
78. Edwards A, Brennan K. Notch signalling in breast development and cancer. Front Cell Dev Biol (2021) 9. doi: 10.3389/fcell.2021.692173
79. Saito N, Hirai N, Aoki K, Suzuki R, Fujita S, Nakayama H, et al. The oncogene addiction switch from NOTCH to PI3K requires simultaneous targeting of NOTCH and PI3K pathway inhibition in glioblastoma. Cancers (2019) 11:121. doi: 10.3390/cancers11010121
80. Wang X, Astrof S. Neural crest cell-autonomous roles of fibronectin in cardiovascular development. Development (2016) 143:88–100. doi: 10.1242/dev.125286
81. Lou X, Han X, Jin C, Tian W, Yu W, Ding D, et al. SOX2 targets fibronectin 1 to promote cell migration and invasion in ovarian cancer: new molecular leads for therapeutic intervention. Omics: J Integr Biol (2013) 17:510–8. doi: 10.1089/omi.2013.0058
82. Georgescu MM, Islam MZ, Li Y, Traylor J, Nanda A. Novel targetable FGFR2 and FGFR3 alterations in glioblastoma associate with aggressive phenotype and distinct gene expression programs. Acta Neuropathol Commun (2021) 9:69. doi: 10.1186/s40478-021-01170-1
83. Hutcheson I, Knowlden J, Hiscox S, Barrow D, Gee J, Robertson J, et al. Heregulin β1 drives gefitinib-resistant growth and invasion in tamoxifen-resistant MCF-7 breast cancer cells. Breast Cancer Res: BCR (2007) 9:R50. doi: 10.1186/bcr1754
84. Ward A, Balwierz A, Zhang JD, Küblbeck M, Pawitan Y, Hielscher T, et al. Re-expression of microRNA-375 reverses both tamoxifen resistance and accompanying EMT-like properties in breast cancer. Oncogene (2013) 32:1173–82. doi: 10.1038/onc.2012.128
85. Turczyk L, Kitowska K, Mieszkowska M, Mieczkowski K, Czaplinska D, Piasecka D, et al. FGFR2-driven signaling counteracts tamoxifen effect on ERα-positive breast cancer cells. Neoplasia (New York N.Y.) (2017) 19:791–804. doi: 10.1016/j.neo.2017.07.006
86. Zamzam Y, Abdelmonem Zamzam Y, Aboalsoud M, Harras H. The utility of SOX2 and AGR2 biomarkers as early predictors of tamoxifen resistance in ER-positive breast cancer patients. Int J Surg Oncol (2021) 2021:9947540. doi: 10.1155/2021/9947540
Keywords: honokiol, tamoxifen resistance, breast cancer, bioinformatics, targeted therapy
Citation: Hermawan A, Putri H, Hanif N, Fatimah N and Prasetio HH (2022) Identification of potential target genes of honokiol in overcoming breast cancer resistance to tamoxifen. Front. Oncol. 12:1019025. doi: 10.3389/fonc.2022.1019025
Received: 06 September 2022; Accepted: 28 October 2022;
Published: 19 December 2022.
Edited by:
Bramanandam Manavathi, University of Hyderabad, IndiaReviewed by:
Guibo Li, Beijing Genomics Institute (BGI), ChinaSuresh Babu Pakala, University of Hyderabad, India
Copyright © 2022 Hermawan, Putri, Hanif, Fatimah and Prasetio. This is an open-access article distributed under the terms of the Creative Commons Attribution License (CC BY). The use, distribution or reproduction in other forums is permitted, provided the original author(s) and the copyright owner(s) are credited and that the original publication in this journal is cited, in accordance with accepted academic practice. No use, distribution or reproduction is permitted which does not comply with these terms.
*Correspondence: Adam Hermawan, YWRhbV9hcHRAdWdtLmFjLmlk