
94% of researchers rate our articles as excellent or good
Learn more about the work of our research integrity team to safeguard the quality of each article we publish.
Find out more
ORIGINAL RESEARCH article
Front. Oncol., 07 November 2022
Sec. Breast Cancer
Volume 12 - 2022 | https://doi.org/10.3389/fonc.2022.1004261
This article is part of the Research TopicThe Molecular Mechanisms of Metastasis and Therapeutic Resistance in Breast CancerView all 8 articles
 Muhamad Ansar1†Le Thi Anh Thu2,3†Chin-Sheng Hung4,5,6Chih-Ming Su5,6Man-Hsu Huang7Li-Min Liao6Yu-Mei Chung8
 Ruo-Kai Lin1,2,8,9*
Epigenetic alterations play a pivotal role in cancer treatment outcomes. Using the methylation array data and The Cancer Genome Atlas (TCGA) dataset, we observed the hypomethylation and upregulation of thiosulfate sulfurtransferase–like domain containing 1 (TSTD1) in patients with breast cancer. We examined paired tissues from Taiwanese patients and observed that 65.09% and 68.25% of patients exhibited TSTD1 hypomethylation and overexpression, respectively. A significant correlation was found between TSTD1 hypomethylation and overexpression in Taiwanese (74.2%, p = 0.040) and Western (88.0%, p < 0.001) cohorts. High expression of TSTD1 protein was observed in 68.8% of Taiwanese and Korean breast cancer patients. Overexpression of TSTD1 in tumors of breast cancer patients was significantly associated with poor 5-year overall survival (p = 0.021) and poor chemotherapy response (p = 0.008). T47D cells treated with TSTD1 siRNA exhibited lower proliferation than the control group, and transfection of TSTD1 in MDA-MB-231 induced the growth of MDA-MB-231 cells compared to the vector control. Additionally, overexpression of TSTD1 in MCF7 cells mediated a poor response to chemotherapy by epirubicin (p < 0.001) and docetaxel (p < 0.001) and hormone therapy by tamoxifen (p =0.025). Circulating cell-free hypomethylated TSTD1 was detected in plasma of Taiwanese breast cancer patients with disease progression and poor chemotherapy efficacy. Our results indicate that promoter hypomethylation and overexpression of TSTD1 in patients with breast cancer are potential biomarkers for poor 5-year overall survival and poor treatment response.
Breast cancer is the leading cause of cancer mortality and Breast cancer is the leading cause of cancer mortality and morbidity in women worldwide, followed by lung cancer (1). Despite the development of several treatment strategies, the mortality rate of patients with breast and lung carcinoma is considerably high: 30–35 per 100 people diagnosed with either cancer die (1, 2). Delaying the diagnosis leads to a significant decline in the survival rate of patients. The 10- year survival rate drops by half when patients proceeded to Stage III (3). Only 22% of stage IV breast cancer patients will survive for a subsequent 5 years (4). The likelihood of patients with Triple Negative Breast Cancer (TNBC) surviving after 5 years decreases to approximately 20% compared to patients without TNBC (5). Accordingly, researchers have been making substantial efforts to improve the diagnostic modalities and treatment outcomes for breast cancer (6–10). Biomarker discovery is a promising approach to reduce cancer mortality (11, 12). Identifying a tumor marker that differentiates between cancerous and noncancerous tissues is crucial.
Four intrinsic molecular subtypes of breast cancer (Luminal A, Luminal B, HER2-enriched [HER2-E] and Basal-like) have been identified (13, 14). Chemotherapy and hormonal therapy are widely used to treat patients diagnosed with Luminal A and Luminal B breast cancer and can prevent recurrence (15, 16). Chemotherapy was also reported to benefit patients with potentially malignant luminal A breast cancer (17). The most commonly used single-agent cytotoxic drug classes used in chemotherapy include taxanes (docetaxel, paclitaxel, nab-paclitaxel), anthracyclines (doxorubicin, epirubicin, pegylated liposomal doxorubicin) (18, 19). In more than 50% of patients, chemotherapy treatment fails due to sensitivity and resistance (20, 21). Tamoxifen is one of the most commonly used hormone therapies for breast cancer. However, hormonal therapy resistance was apparent in 30-40% cases (22, 23), and takes a long time to complete (24). TNBC has a poor prognosis, largely due to the lack of targeted treatments. The high response rates to chemotherapy are lack longevity due to the early development of resistance mechanisms (25).” Personalized medicine might provide more favorable outcomes of cancer treatment. Several irregularities in an individual’s gene expression are associated with chemotherapy outcomes (26). For instance, miRNA-631 expression increased paclitaxel response in breast cancer patients (27), miR-145-5p downregulation was found to be correlated with Paclitaxel resistance in MCF-7 and MDA-MB-231 cell lines (28), and overexpression of SH3BGRL conferred resistance to cisplatin (29). Researchers are attempting to identify a novel diagnostic biomarker that can serve as the fundamental building block for cancer treatment strategies.
In the current study, we first determined methylation patterns of tissue by analyzing data from The Cancer Genome Atlas (TCGA) dataset. We identified thiosulfate sulfurtransferate-like domain containing 1 (TSTD1) as a potential biomarker specific to breast cancer. TSTD1, located on chromosome 1q23.3 and expressed in the cytoplasm close to the nuclear membrane, has been proposed to play an essential role in sulfur-containing group transfer and cyanide detoxification (30–33). Unlike other sulfurtransferases—mitochondrial rhodanese and mercaptopyruvate sulfurtransferase—whose functions in sulfide biogenesis and oxidation pathways have been relatively well-described (34, 35), the physiologically relevant reaction catalyzed by TSTD1 remains unclear. Studies have reported that TSTD1 acts as a catalyst in the mitochondrial sulfide oxidation pathway, producing glutathione persulfide (GSS−) from glutathione (GS−) (31), and plays a crucial role in sulfide-based signaling (30). Regarding expression, TSTD1 protein levels were not detected in normal breast cell lines (MCF-10A and H184A1) but were high in breast cancer cell lines (30, 32). However, no comprehensive study has evaluated underlying alterations in TSTD1 in cancer and its applications in clinical practice. This study investigated changes in TSTD1 methylation and expression in patients with breast cancer compared to normal tissues to determine the potential of TSTD1 as a tumor biomarker in clinical practice in breast cancer.
The results for Western patients, including the methylation status, mRNA expression level, and clinical information, were analyses of data provided by TCGA Research Network (http://cancergenome.nih.gov/). TCGA contains information regarding critical cancer-related genome aberrations, covering all levels of DNA, RNA, miRNA, and proteins in cohorts of more than 83,000 cases with 33 cancer types, including 8897 breast cancer samples (36, 37).
To analyze whether the alterations of TSTD1 is specific to breast cancer patients, paired tumor and noncancer tissues from 106 patients with breast cancer, 33 patients with lung cancer, 15 patients with endometrial cancer, and 16 patients with esophageal cancer were collected from the Taipei Medical University Joint Biobank. This study was approved by the Joint Institutional Review Board of Taipei Medical University and the Institutional Review Board of Taipei Medical University-Shuang Ho Hospital, Ministry of Health and Welfare. All patients provided written informed consent. Clinical data regarding age, race, personal and family medical history, tumor location, tumor–node–metastasis (TNM) stage (38), tumor classification (39), and follow-up conditions were prospectively collected. Breast cancer patients were followed up for at least 15 months. According to the expression levels of Ki-67 protein and the status of estrogen receptor (ER), progesterone receptor and human epidermal growth factor receptor 2 (HER2), breast cancer can be categorized into four subtypes: luminal A, luminal B, HER2-overexpression, and triple negative breast cancer (TNBC) (40). A senior pathologist examined partial specimens of cancerous and adjacent normal tissues. Patient survival time was investigated following treatments, patients were monitored every 3 months for the first 2 years and semi-annually thereafter. The follow-up protocol included physical examination, breast ultrasound examination, carcinoembryonic antigen analysis (CEA), carbohydrate antigen 15-3 (CA15-3), abdominal sonogram, and computerized tomography.
The matched pairs of cancerous and corresponding noncancerous tissues from the same patient collected during surgery were immediately stored at −80°C and then in liquid nitrogen. Genomic DNA and mRNA were extracted from 106 and 63 tissue pairs respectively using the QIAamp DNA mini kit (Cat. No. 51306, Qiagen, Bonn, Germany) or the RNeasy plus mini kit (Cat. No. 74134, Qiagen), as appropriate. Subsequently, DNA and RNA were quantified, and their purity was determined by measuring the A260–A280 ratio (which ranged from 1.8 to 2.0) (41) using Thermo Scientific NanoDrop 2000c (Thermo Fisher Scientific, MA, USA). Genomic DNA and RNA were stored at −20°C and −80°C, respectively, for subsequent experiments.
Circulating cell-free DNA (cfDNA) from plasma samples was extracted using the MagMAX Cell-Free DNA Isolation Kit according to the manufacturer’s recommended protocol (Thermo Fisher Scientific, Austin, TX, USA). The cfDNA samples had clear fragment size peaks between 140 and 200 bp. The plasma was isolated within 2 hours from 10 mL of peripheral blood within 2 h. After DNA quantification, the purity was verified by measuring the A260/A280 ratio (range 1.8 to 2.0) using a NanoDrop ND-1000 spectrophotometer (NanoDrop Technologies, Inc., Wilmington, DE, USA).
Bisulfite conversion was conducted using the EpiTect Fast DNA Bisulfite Kit (Cat. No. 59826, Qiagen). A mixture of a maximum of 500 ng of purified DNA, stabilized by DNA protection buffer, and bisulfite solution was incubated in a Labcycler 480 thermal cycler (Sensoquest, Gottingen, Germany). Subsequently, a cleanup procedure was performed in accordance with the manufacturer’s recommended protocol. Bisulfite products were stored at −20°C for future experiments.
After bisulfite conversion, we determined DNA methylation patterns in paired tumor and normal tissues collected from five Taiwanese patients using Infinium Human Methylation 450K BeadChips (Illumina, San Diego, CA, USA) for one patient and EPIC Methylation Beadchips (Illumina) for four patients. In the DNA methylation assay, beta values were used to score the methylation level. Beta values are the ratio of the intensity of the methylated signal to the overall (sum of methylated and unmethylated) signal and thus ranged from 0 (no methylation) to 1 (full methylation). To design TSTD1 methylation–specific primers, we used MethPrimer (42) and Methyl Primer Express (v1.0, Thermo Fisher Scientific).
After bisulfite treatment, the DNA from 106 tissue pairs of patients with breast cancer was used for TaqMan quantitative methylation-specific (qMSP) to measure the DNA methylation level of TSTD1. qMSP was performed using the SensiFAST SYBR No-ROX kit (Cat. No. BIO-98020, Bioline, London, UK) or the SensiFAST PROBE No-ROX kit (Cat. No. BIO-86020, Bioline). The assay was measured in a LightCycler 480 (Roche Applied Science, Mannheim, Germany) or LightCycler 96 (Roche Applied Science). Target DNA methylation values were calibrated to the internal control and analyzed using LightCycler Relative Quantification software (version 2.0, Roche Applied Science). Experiments were conducted in triplicate.
The QMSP conditions were as follows: preincubation at 95°C for 10 min followed by 50 cycles of amplification at 95°C for 10 s and 60°C for 10 s. The beta-actin (ACTB) was used as the reference gene for qMSP. TSTD1 was considered hypomethylated when the methylation level of TSTD1 relative to ACTB in the breast tumor tissue was no greater than 0.5 times that of the corresponding normal tissue. Bisulfite sequencing was performed to confirm the specificity of TSTD1 methylation end products (Figure S1).
TSTD1 and ACTB methylated–specific primers and probes were designed using MethPrimer (42) and Methyl Primer Express (v1.0, Thermo Fisher Scientific). The primers and probe are described in Table S1.
Reverse transcription PCR (RT-PCR) was performed using FIREScript RT cDNA synthesis mix (Cat. No 06-20-00100, Solis Byodine, Tartu, Estonia). A total of 5 μg of purified mRNA was mixed with the required nucleotides and enzymes provided. The mixture was then placed in Labcycler 48 thermal cycler (Sensoquest, Gottingen, Germany) at the optimal temperature in accordance with the manufacturer’s recommended protocol. Complementary DNA was stored at −20°C for subsequent experiments.
Complementary DNA—the product of reverse transcriptase reaction—was used to determine the mRNA expression level through quantitative RT-PCR (RT-qPCR) in a LightCycler 480 (Roche Applied Science) or LightCycler 96 (Roche Applied Science) system. The PCR conditions were as follows: preincubation at 95°C for 10 min followed by 40 cycles of amplification at 95°C for 10 s and 60°C for 10 s. The glyceraldehyde 3-phosphate dehydrogenase gene (GAPDH) was used as an internal control. The LightCycler Probe Master kit (Roche Applied Science), gene-specific primers, and the corresponding probes from Universal ProbeLibrary (Roche Applied Science) at appropriate concentrations were added at appropriate concentrations to the template DNA. The gene specific primers were for TSTD1, GAPDH, ESR1, and ESR2. Gene expression values normalized to the internal control were calculated using LightCycler Relative Quantification software (ver. 2.0, Roche Applied Science). TSTD1 was considered to be upregulated when the expression level of TSTD1 relative to that of GAPDH was at least 1.5 times higher in tumor tissues compared to paired normal breast tissues. Initially, experiments were conducted in triplicate to examine the stabilization of results (n = 40). However, a lack of samples caused experiments to be performed once for each sample (n= 23). The sequences for the primers and probes are listed in Table S1.
TSTD1 expression was determined by immunohistochemistry in 59 and 104 tissue samples from South Korean and Taiwanese patients with breast cancer, respectively. The samples were preserved as three sets of tissue microarrays. Two of them were obtained from Taipei Medical University-Shuang Ho Hospital, Taiwan, and the other was purchased from SuperBioChips Laboratories (Cat. No.: CBA4, Seoul, South Korea). The pathological diagnoses of these cases were microscopically confirmed by a senior pathologist. An iView DAB detection kit (Ventana, Tucson, AZ, USA) was used for immunohistochemical staining on a BenchMark XT autostainer (VENTANA, Roche Diagnostics, Basel, Switzerland). The sections were incubated with a TSTD1 antibody (1:100, Cat No.: HPA006655, Sigma Aldrich, MO, USA) for 52 minutes at 37°C. This assay included both positive and negative controls. The clinical follow-up data were not provided to the pathologist who evaluated the immunohistochemistry staining. TSTD1 protein expression was classified semiquantitatively as low when it was weaker than or equal to the expression intensity of the normal breast epithelium or high when it was stronger than the expression intensity of the normal breast epithelium.
All cells were incubated at 37°C and 5% CO2. T47D, MDA-MB-231 and H1299 cell lines were cultured in Dulbecco’s Modified Eagle Medium/Nutrient Mixture F-12 (DMEM/F-12; Gibco, NY, USA) supplemented with 5% human placental lactogen (HPL) serum and 1% penicillin. MCF7 cells were cultured in DMEM/F12 supplemented with human platelet lysate (hPL, American Red Cross, USA), 7.5% HPL, 1% MEM Non-Essential Amino Acid and 1% penicillin.
T47D and H1299 cells were transfected with 10 nM TSTD1 siRNA (si-TSTD1; Cat No.: 4390771, Ambion, USA) or 10 nM Silencer Select Negative Control No. 1 siRNA (Cat No. 4390843, Ambion) using Lipofectamine RNAiMAX transfection reagent (Cat No.: LMRNA015, Invitrogen, MA, USA). MDA-MB-231 and MCF7 cells were transfected with vector and pCMV-TSTD1 using Lipofectamine 3000 (Invitrogen) according to the manufacturer’s protocol. Cells were incubated in original culture medium after transfection.
Different breast cancer cell lines were performed for different types of functional assays based on the expression level of TSTD1 in each cell. Knockdown was performed in overexpression of TSTD1 in T47D. Conversely, transfection was performed at the low level of TSTD1 in MDA-MB-231 and MCF7 cells.
The extraction, confirmation, and purification of the TSTD1 Plasmid DNA was performed using the Geneaid™ Midi Plasmid Kit (Geneaid Biotech Ltd., Cat. No. PI025) according to the manufacturer’s instructions. The extracted DNA was subjected to preliminary length analysis by sequence to confirm errorless production. The plasmid concentration was measured using a NanoDrop 2000C ultramicrowavelength spectrophotometer (Thermo Fisher Scientific, USA), and the plasmid was stored at -20°C until further use.
Twenty fours hours after treatment with either si-TSTD1 or control siRNA, T47D and H1299 cells were counted using a microscope and hemocytometer. Experiments were performed in triplicate.
Twenty-four hours after pCMV-TSTD1 plasmid transfection, MCF7 cells were treated with tamoxifen (10 and 20 μM; Cat No.: 13258, Cayman), epirubicin (100 and 2000 nM; Cat No.: 12091, Cayman), docetaxel (Cat No.: 11637, Cayman, MI, USA) or the vehicle control, dimethyl sulfoxide (DMSO; Cat No.: D2650, Sigma Aldrich), and incubated for another 24 h. Cell proliferation was determined by the MTT assay: 20 μL of MTT solution was added to each well; after 4 h, the MTT solution was removed and 100 μL DMSO was added. Optical density (OD) was measured by absorbance at 550nm by VarioskanFlash multimode reader (Thermo Fisher Scientific, Massachusetts, USA).
Twenty-four hours after siRNA transfection, T47D cells were microcentrifuged and lysed at 4°C using the ultrasonic processor UP200H (Hielscher, Teltow, Germany) for 10 s. Proteins were precipitated from the cell lysis solution using acetonitrile. After centrifugation, the supernatant was immediately used for liquid chromatography–mass spectrometry (LC–MS) analysis.
For LC–MS, we Acquity UPLC binary pump coupled with a Xevo TQ-XS triple quadrupole mass spectrometer (Waters, MA, USA). An Acquity UPLC HSS T3 column was used to perform chromatographic separation (1.8 µm, 2.1 mm × 100 mm) at 40°C and a constant flow rate of 400 µL/min. The injection volume was 2 µL. The mobile phase consisted of 0.1% formic acid in water (A) and formic acid in 0.1% acetonitrile (B). The gradient program was set as follows: 0–3 min of 0%–100% of phase B and 3–4 min of isocratic elution with 100% of phase B. The column was re-equilibrated for 5 min by using 100% of phase A before analyzing the next sample. Target compounds and their respective derivatives were detected in both positive and negative modes. The capillary voltages were 3000 and 2000 V, respectively. The source and desolvation temperatures were set at 150°C and 450°C, respectively. During the assay, the mass spectrometer performed full scan cycles (m/z 200–1000). The data were compared with the reference of glutathione (GSH, molecular weight [MW]: 307.3) and glutathione disulfide (GSSG, MW 656.6). Experiments were conducted in triplicate.
Subsequently, 24 h after siRNA transfection, T47D cells were treated with DCFH-DA and incubated for 30 min at 37°C. Pyocyanin was the positive control, whereas N-acetyl cysteine was the negative control. Fluorescence was measured at an excitation wavelength of 480 nm and an emission wavelength of 510 nm by the VarioskanFlash multimode reader (Thermo Fisher Scientific).
All statistical analyses were performed using SPSS (SPSS Inc., Chicago, IL, USA). The relation between all the clinical data of the patients with breast cancer—namely age, sex, tumor type, TNM stage, metastasis condition, differentiation grade and location, recurrence status, and drug response and TSTD1 molecular data (i.e. DNA methylation, mRNA expression and protein expression levels) was assessed using the Pearson’s chi-square test. The correlation between the DNA methylation and mRNA expression of TSTD1 was measured using Pearson’s correlation. Differences in TSTD1 mRNA expression between breast tumor tissues and adjacent normal tissues were confirmed by a paired student’s t-test. We also used the student’s t-test to compare cells transfected with or without TSTD1 plasmid or si-TSTD1 to controls and cells treated with drugs to controls.
The methylation arrays obtained from the Infinium HumanMethylation 450K and EPIC methylation array were used to determine the methylation status in five pairs of breast cancer tissues obtained from Taiwanese patients. In addition, the DNA methylation status of 87 tumor and normal tissue pairs of Western patients (Asian, Caucasian and Black/African Amercian) with breast cancer from TCGA datasets was collected. All the data were combined and analyzed using InteractiVenn by selecting the intersection list of aberrant hypomethylation CpG sites (Figure 1A). Three CpG sites of three genes were selected: cg24161057 located on the promoter of TSTD1, cg19533977 located in CLTC’s coding region, and cg18265162 located in on the promoter of SERTAD4. After excluding one gene whose CpG site is not located in the promoter, we examined the expression of the two other genes in 72 patients from TCGA. We determined that TSTD1, containing CpG site cg24161057 in the promoter, was overexpressed in mRNA sequencing data obtained from TCGA. Thus, TSTD1 was selected for further examination (Figure 1B).
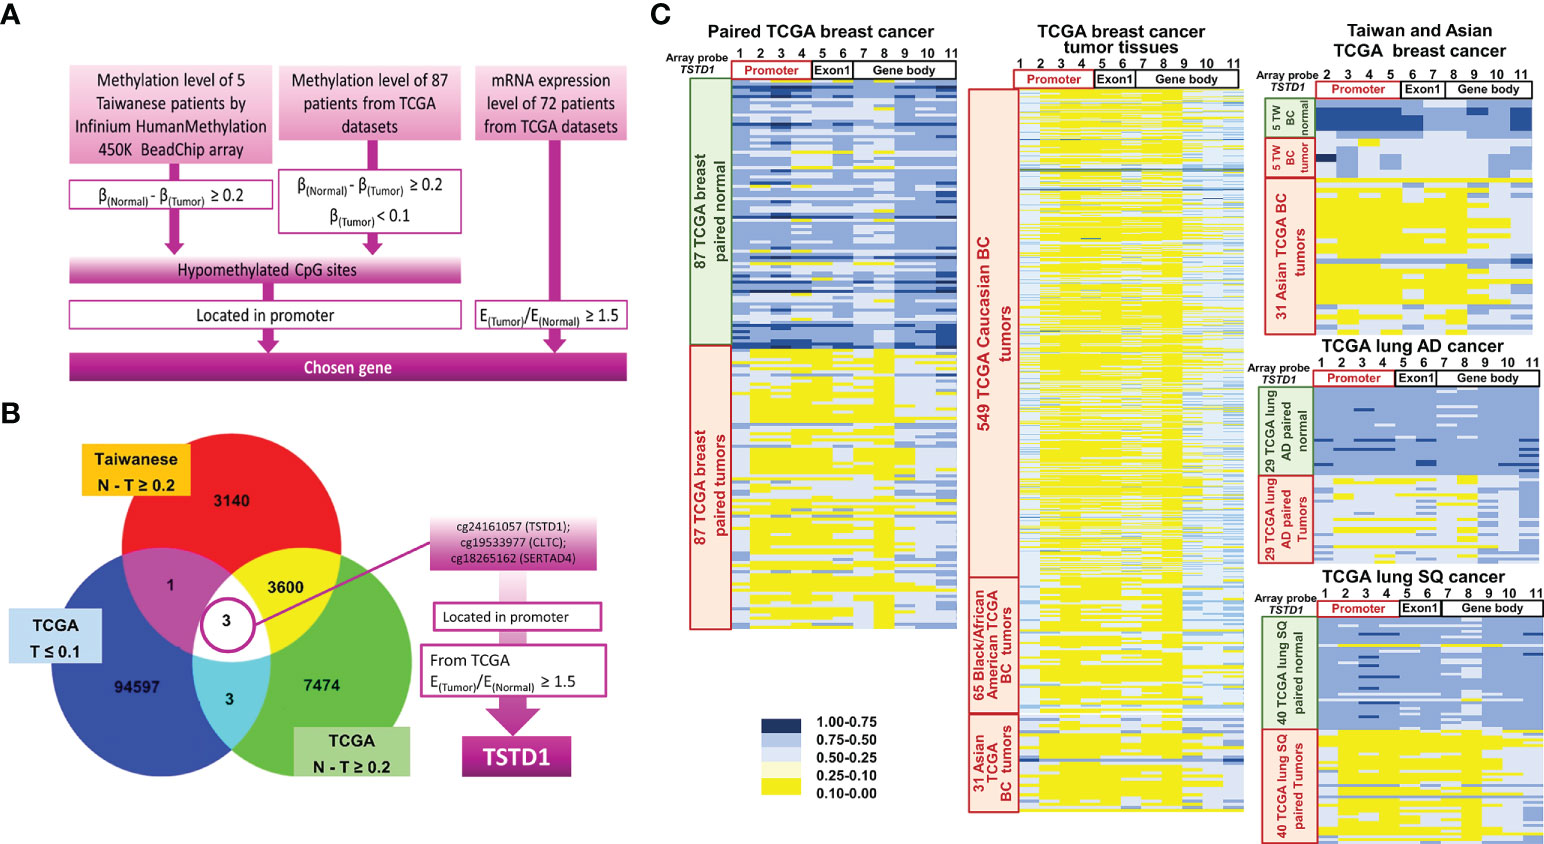
Figure 1 Flowchart of gene selection, analytical procedures and methylation heatmap for TSTD1. (A) The criteria and step-by-step flowchart for gene selection. (B) Screening of intersecting genes by InteractiVenn. (C) TSTD1 methylation pattern in 87 paired TCGA breast cancer, 549 Caucasian, 65 Black/African and 31 Asian TCGA breast tumor tissues, TSTD1 methylation level of 5 Taiwanese patients, TCGA paired lung adenocarcinoma and paired lung squamous-cell carcinoma by Methylation Beadchips array and EPIC Methylation Beadchips array.
The methylation profiles for Taiwanese breast cancer and TCGA cohort of Asian and Western breast cancer population (Caucasian and Black/African) were analyzed. The analysis of data from TCGA and Taiwanese revealed significantly decreased TSTD1 methylation levels in breast tumors compared with adjacent normal tissues. In addition, hypomethylation of TSTD1 promoter was observed obviously in breast tumor tissues from Asian, Caucasian and Black/African American TCGA cohort compare with breast tumor tissues from Taiwanese cohort (Figure 1C), Further analysis of the methylation patterns of other cancer types indicated that TSTD1 promoter hypomethylation was observed in lung adenocarcinoma and lung squamous cell carcinoma (Figure 1C) but not in liver, colon, esophageal, rectal, and pancreatic cancers (Figure S2).
We collected paired samples of cancerous and adjacent noncancerous tissue from Taiwanese patients with breast cancer for molecular studies to determine alterations in TSTD1 methylation and expression. Hypomethylation of TSTD1 was verified with qMSP in 106 samples (Figure S3). Of the 106 paired samples, methylation level in 69 tumor samples (65.09%) was less than 50% of that in the corresponding normal tissue (Figure 2B). TSTD1 mRNA expression was measured using RT-qPCR (Figure S4 and Table 1). Of the paired samples, 68.3% (43/63) exhibited higher TSTD1 mRNA expression in tumor tissues than in the paired normal tissues (Figure 2B). In Taiwanese patients, methylation of TSTD1 was significantly correlated with mRNA expression of TSTD1. TSTD1 was hypomethylated in 74.2% (23/31) patients with upregulated TSTD1 expression in breast tumors (p = 0.040), whereas TSTD1 was hypermethylated in 56.3% (9/16) of patients with TSTD1 downregulation (Table S2).
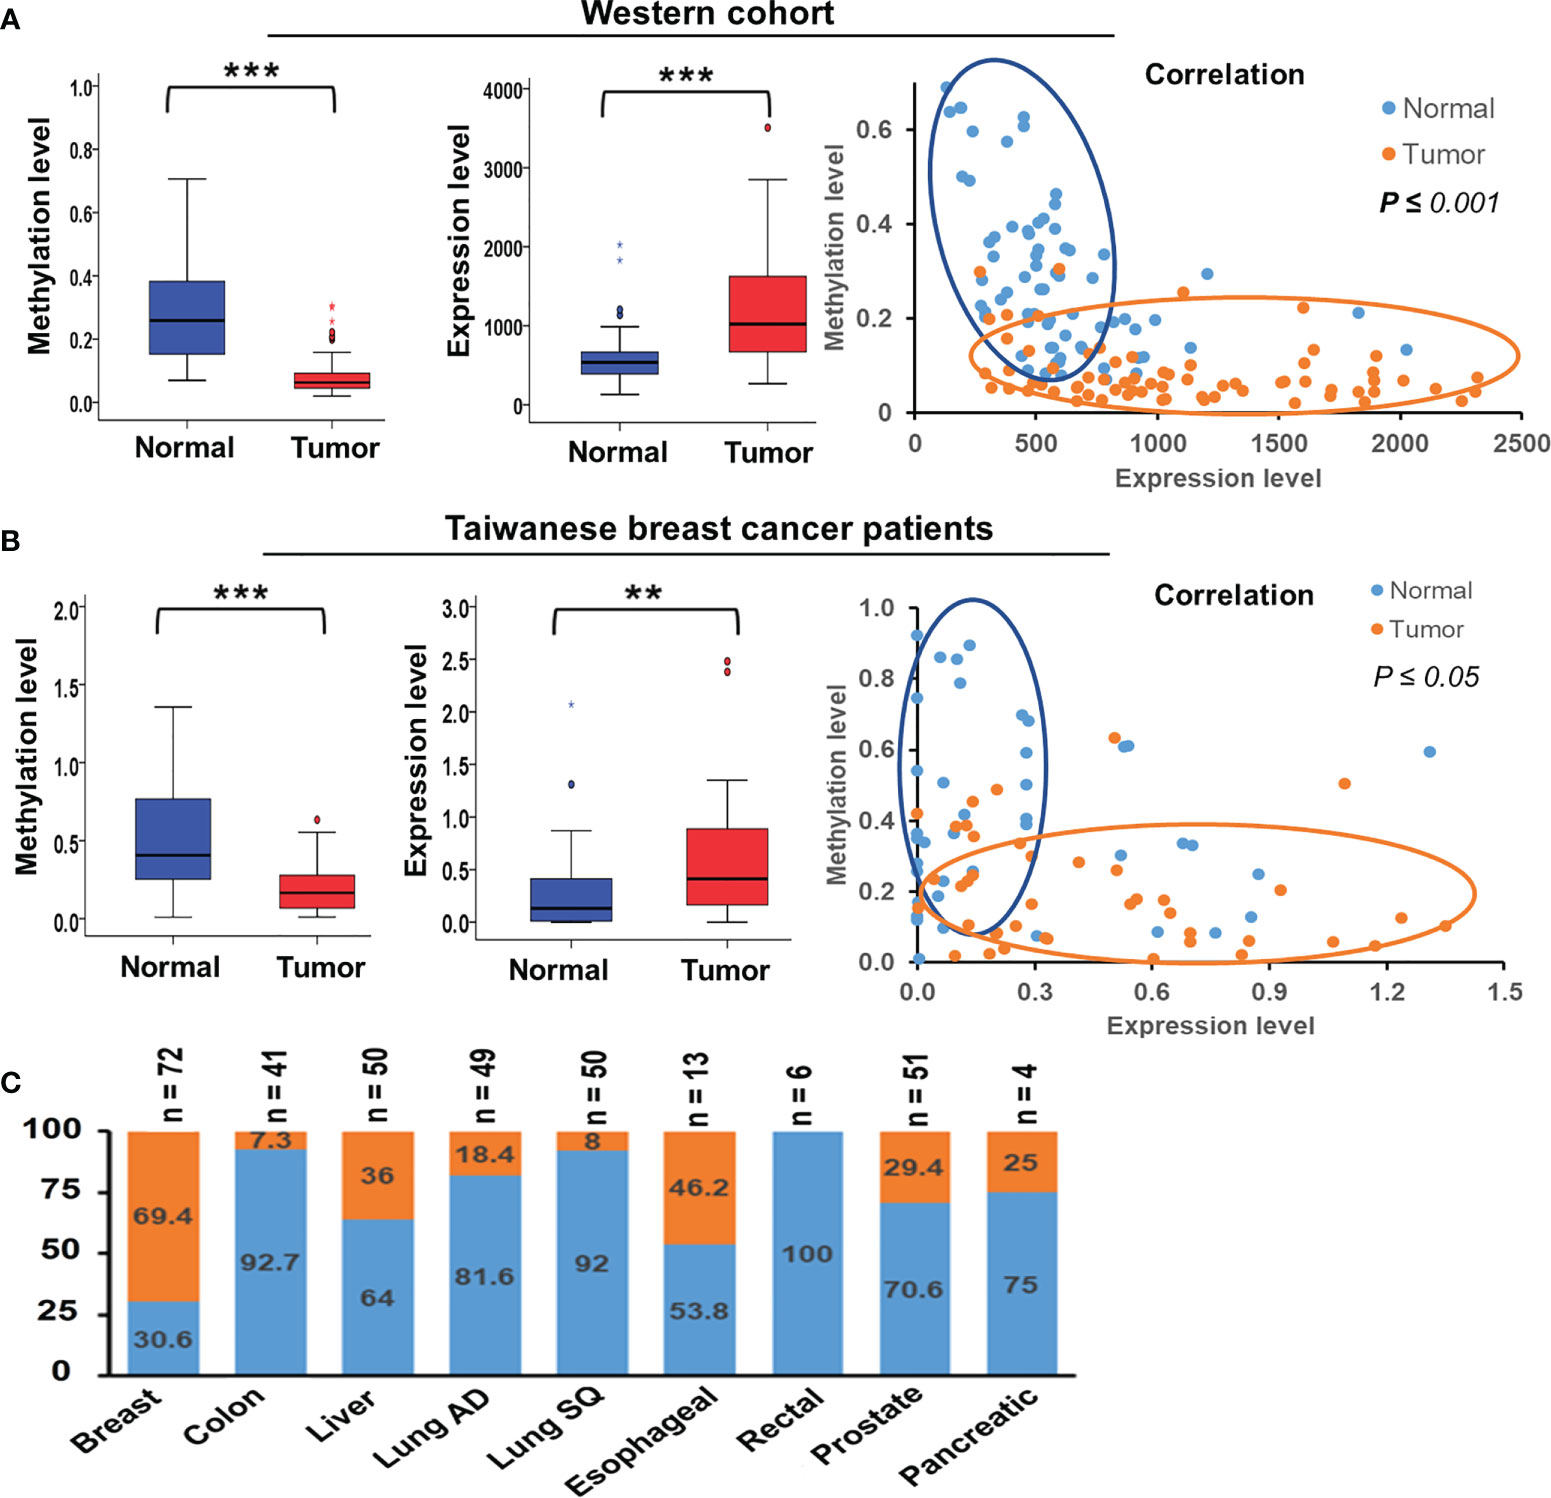
Figure 2 Methylation and expression of TSTD1 in breast cancer and in various cancer types. (A) DNA methylation level, mRNA expression level and the correlation between TSTD1 hypomethylation and overexpression in of tumor and adjacent normal tissues of the Western breast cancer cohort, analyzed from TCGA datasets. (B) DNA methylation level, mRNA expression level and the correlation between TSTD1 hypomethylation and overexpression in of tumor and adjacent normal tissues of Taiwanese breast cancer patients. (C) mRNA expression level of TSTD1 in various cancer types. The relationship was analyzed using Pearson X2 test. ACTB and GAPDH were the internal controls for DNA methylation and mRNA expression, respectively. Data were analyzed using student’s paired t-test. *p ≤ 0.05, **p ≤ 0.01, ***p ≤ 0.001.
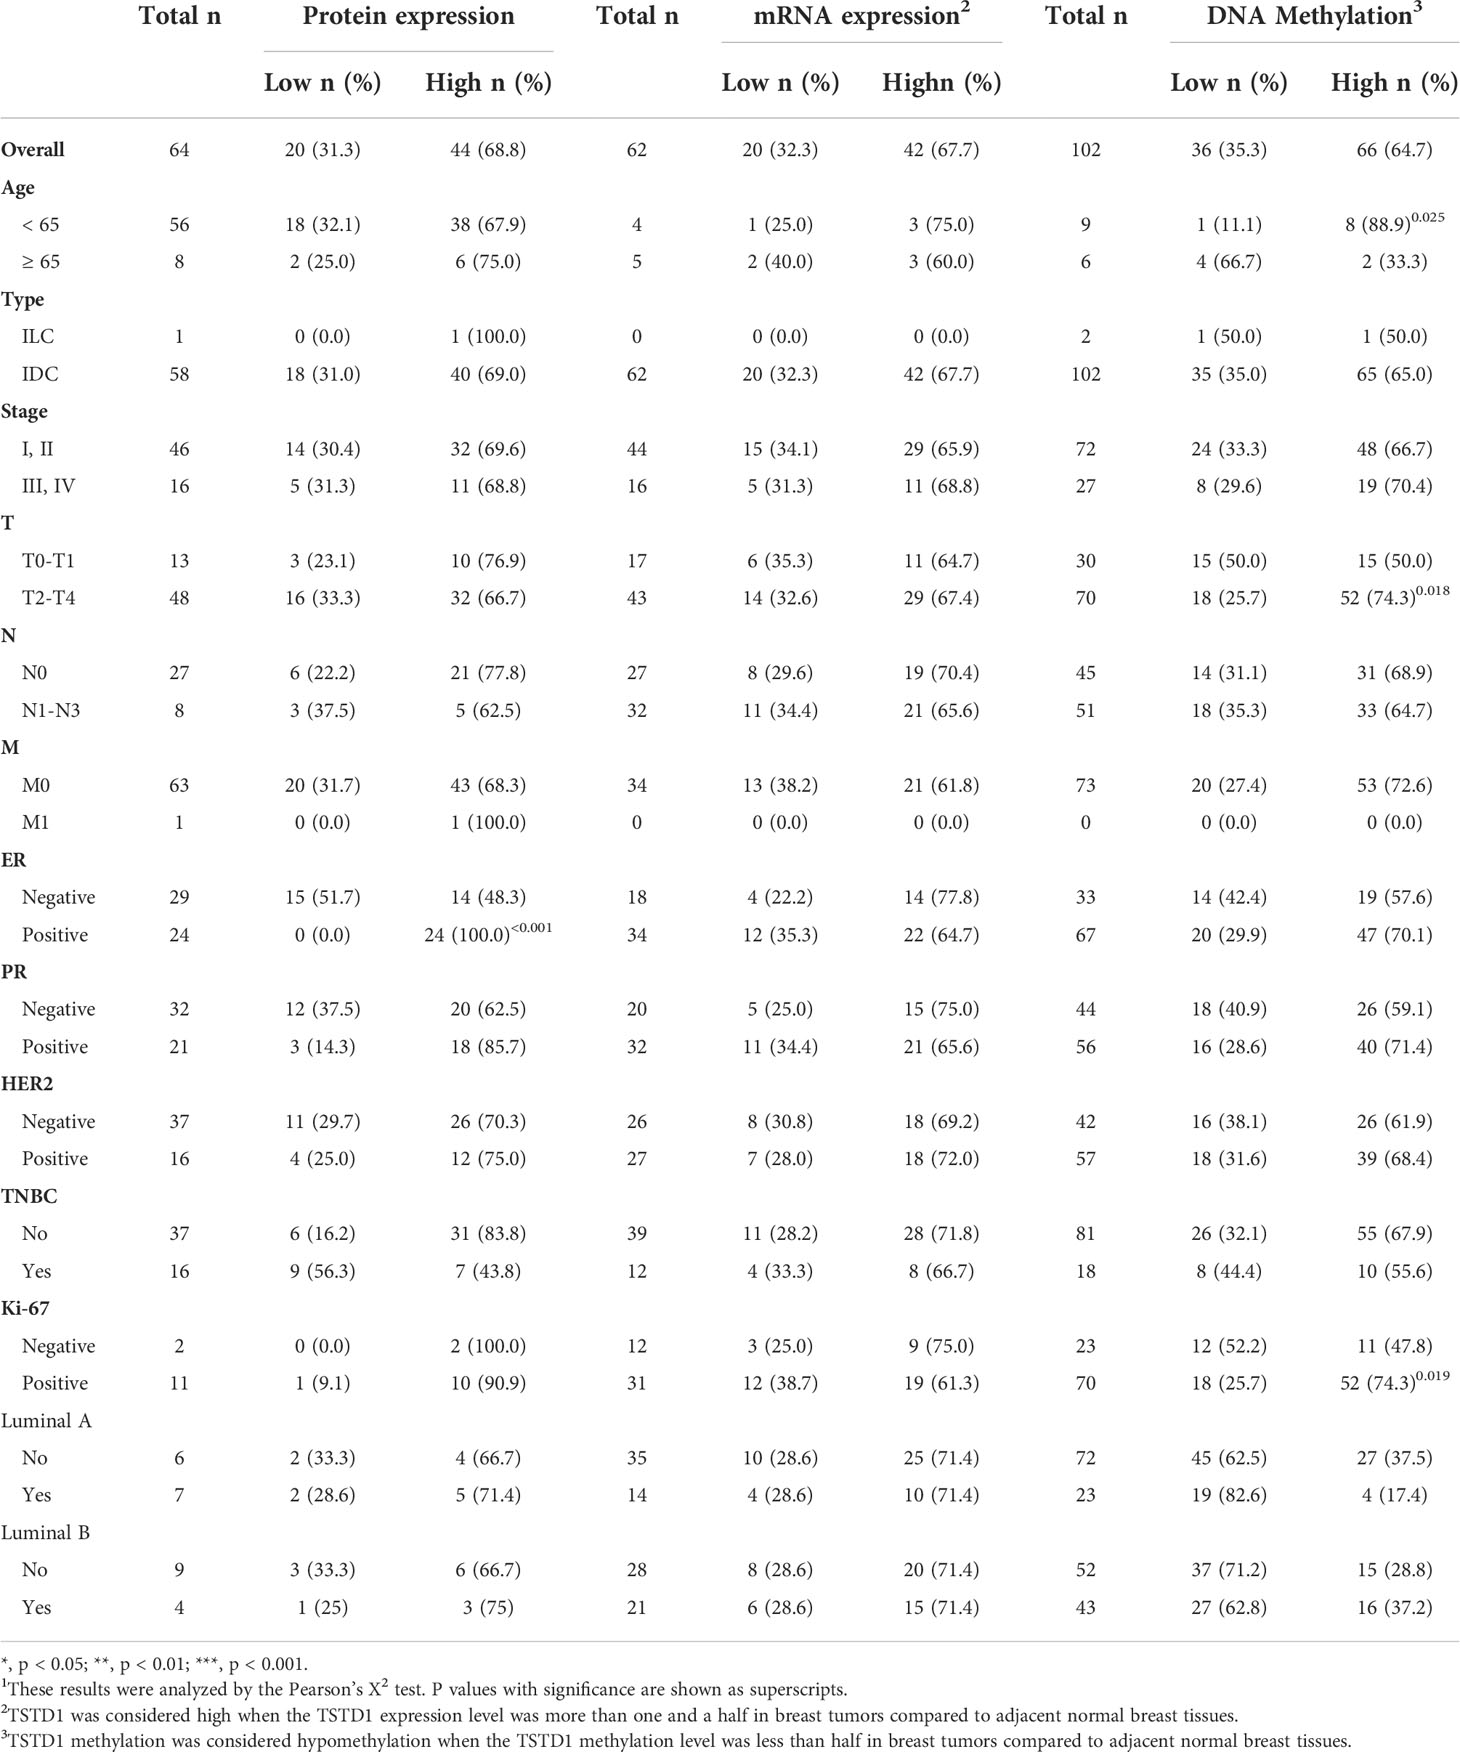
Table 1 TSTD1 protein expression, mRNA expression, and methylation levels in relation to the clinical parameters of Taiwanese patients with breast cancer1.
Breast tumor samples from Taiwanese and Korean breast cancer patients were stained with a TSTD1 antibody for immunohistochemical analysis. High intensity of TSTD1 protein staining was observed in 68.8% (44/64) of the patients (Table 1). Within cancerous tissues, TSTD1 staining was more robust in invasive areas than ductal carcinoma in situ. In addition, there was moderate staining of TSTD1 near lobules and duct (Figure 3). In general, the intensity of TSTD1 staining increased from normal to lobular to carcinoma in situ tissues, becoming the highest in invasive carcinoma tissues.
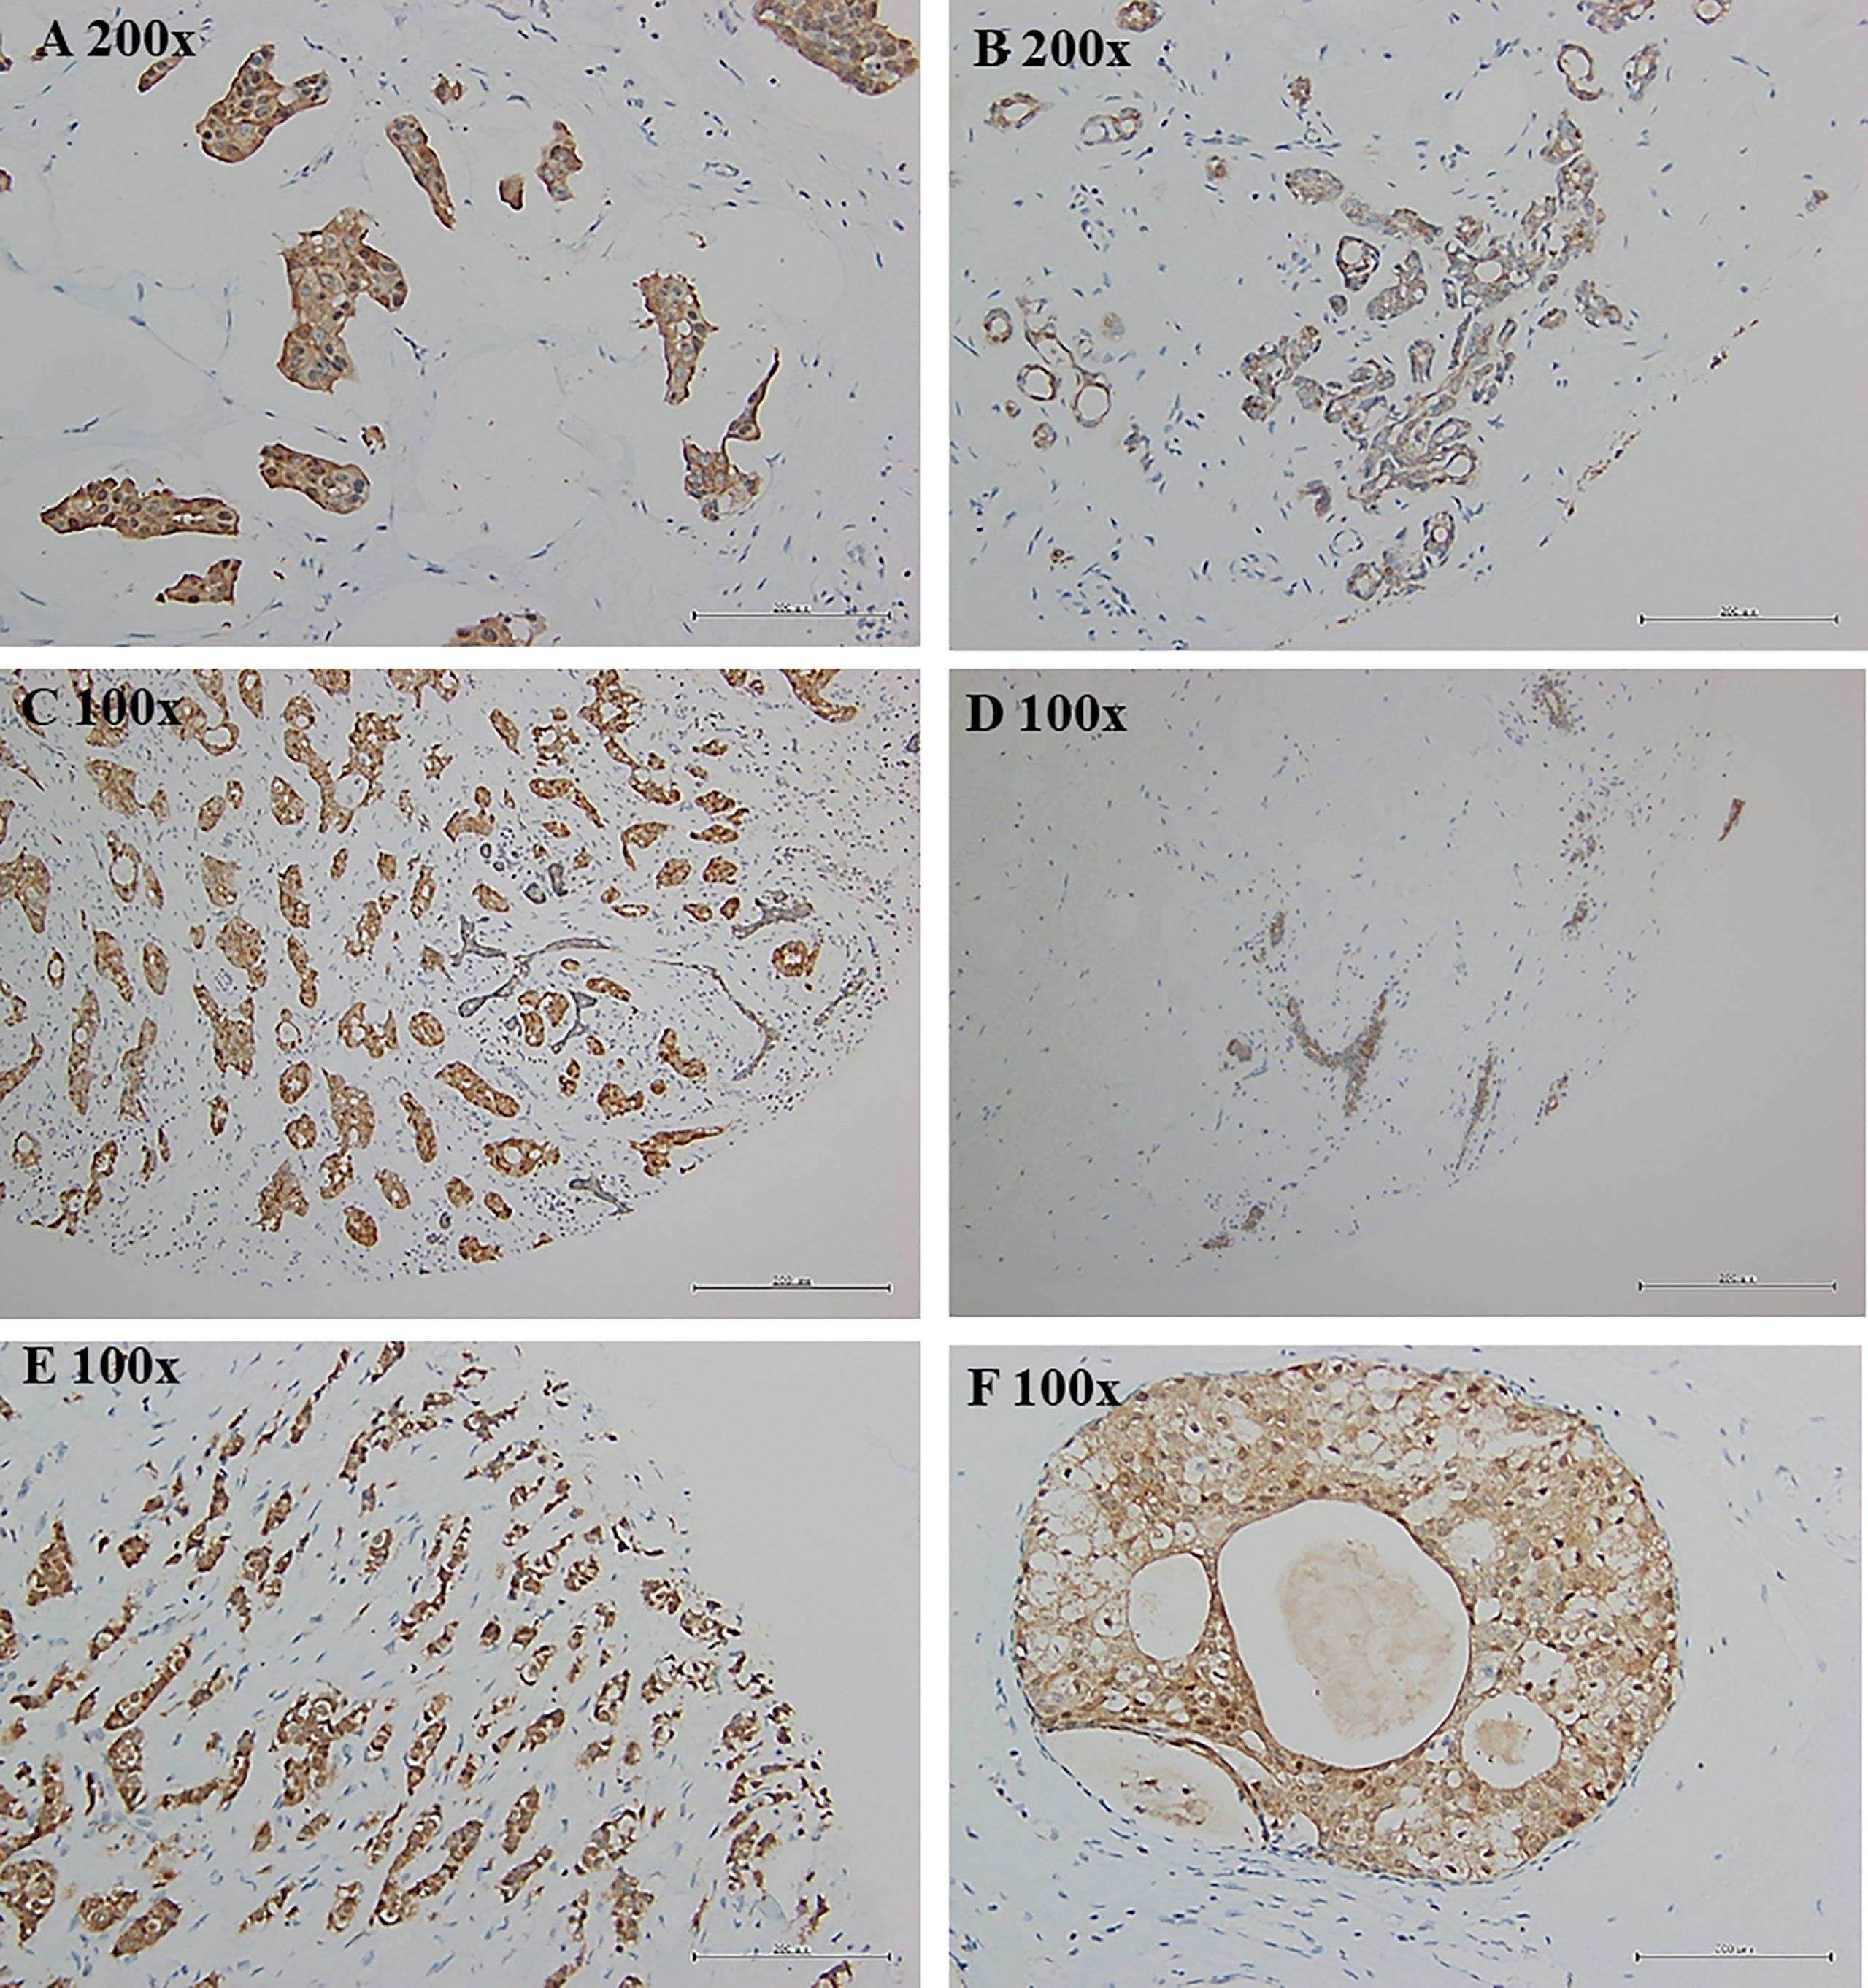
Figure 3 Protein expression of tstd1 in breast tissues. (A) tumor tissues; (B, D) normal/lobular tissues; (C, E) invasive tumor tissues; (F) carcinoma in situ tissues. Immunohistochemistry staining results were captured by microscope. Images in the same row were taken from same patient. (A, B) patient sh078; (C, D) patient sh085; (E, F) patient sh095. Original magnification is as shown in each image.
By combining protein expression levels with clinical information data, we determined that all patients with positive estrogen receptor (ER) exhibited high protein expression (24/24, p ≤ 0.001). A larger sample size is required to make a definite conclusion.
To determine alteration in TSTD1 hypomethylation and mRNA expression in Western patients with breast cancer, we analyzed the TCGA data of 87 breast tumors, 87 matched normal tissues, and 643 breast tumor tissues. First, we analyzed the Illumina Infinium HumanMethylation450 BeadChip array data (Figure S2). The CpG site cg24161057, which is on the promoter of TSTD1, was hypomethylated in 77.0% (67/87) of breast paired tissues and 81.0% (521/643) of non-paired breast tumor tissues. Analysis of RNA sequencing data obtained from TCGA revealed that 69.4% (50/72) of patients with breast cancer had significant TSTD1 mRNA upregulation in tumors compared with adjacent normal tissues.
Overexpression of TSTD1 mRNA was associated with the histological type and tumor stage of patients with breast cancer (p < 0.001 and 0.040, respectively, Table 2). Overexpression of TSTD1 mRNA was associated with negative ER and negative progesterone receptor (PR) expression in patients with breast cancer (p < 0.001, Table 2). A multivariate Cox proportional hazards survival analysis revealed that TSTD1 mRNA expression in patients with breast cancer was significantly associated with poor 5-year overall survival in TCGA data (p = 0.021, Table 3), especially in patients with negative ER/PR expression (p = 0.008, Table 3). TSTD1 methylation was significantly associated with mRNA expression of TSTD1 in Western patients. We found that 44 (88%, p < 0.001) of 50 patients with higher TSTD1 expression demonstrated hypomethylation (Figure 2A; Table S2).
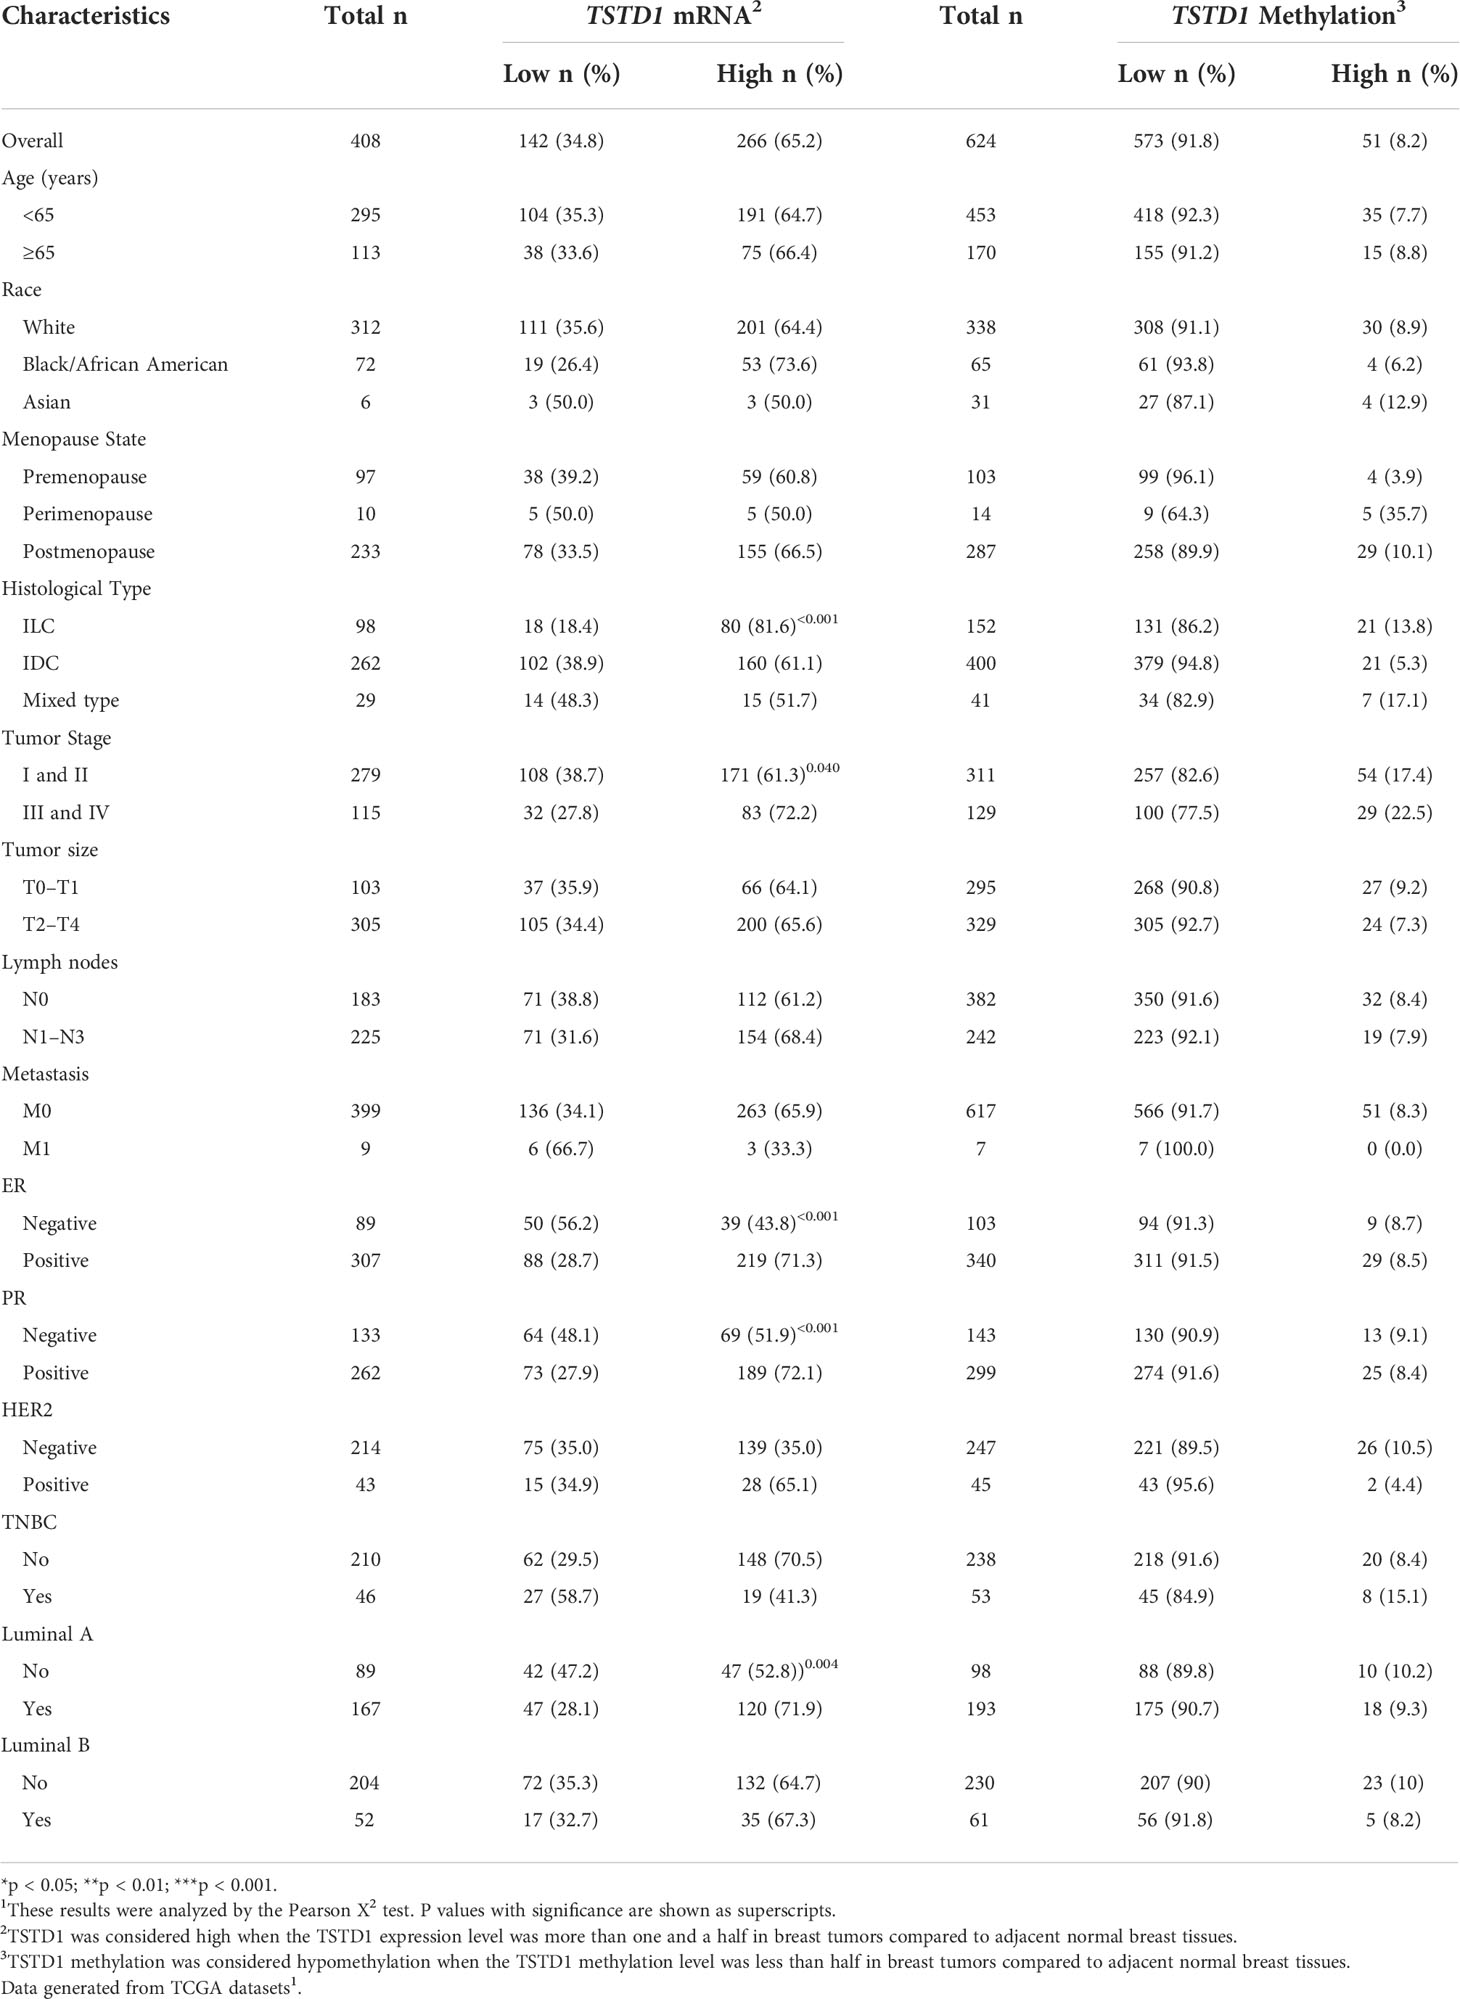
Table 2 TSTD1 mRNA expression and methylation levels in relation to the clinical parameters of Western with breast cancer.
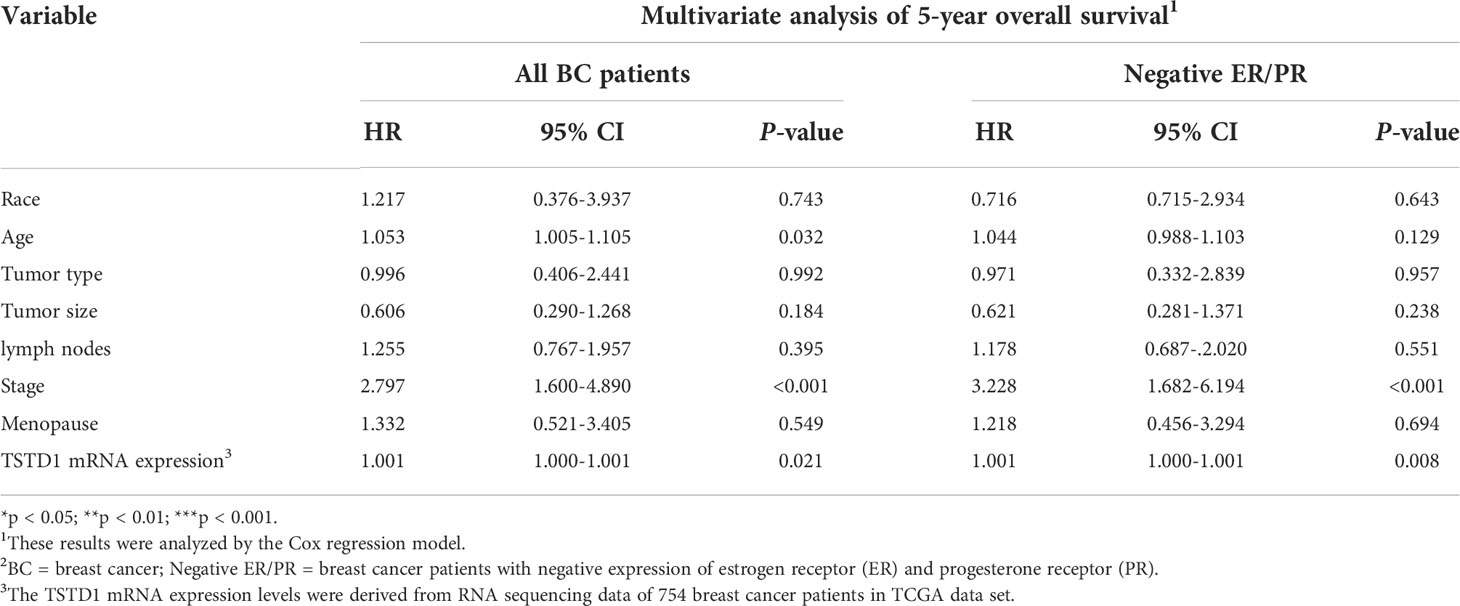
Table 3 Cox proportional hazard model of clinical parameters and TSTD1 mRNA expression level in TCGA breast cancer.
Hypomethylation of TSTD1 was observed in Western and Taiwanese breast and lung cancer patients. However, overexpression of TSTD1 mRNA expression only was found in breast cancer patients (Figure 2C), but not in lung cancer patients. To further analyze whether the TSTD1 expression level was involved in breast and lung cancer growth, TSTD1 gene manipulation was conducted in breast and lung cancer cell lines. RT-qPCR was conducted to evaluate the expression of TSTD1 in breast and lung cell lines. TSTD1 expression was significantly higher by 47-fold in T47D cells (p < 0.001, Figure 4A), and 3-fold in H1299 cells compared to normal breast and lung cells (p < 0.001, Figure S5). Therefore, T47D and H1299 cell lines were used for knockdown experiments. T47D cells treated with si-TSTD1 exhibited a 30% lower proliferation rate than the control group (p=0.04, Figure 4A) after 24 hours. By contrast, although H1299 cells appeared to grow rapidly, they demonstrated a 28% decrease in cell number after TSTD1 knockdown than the control group (p= 0.04, Figure S5).
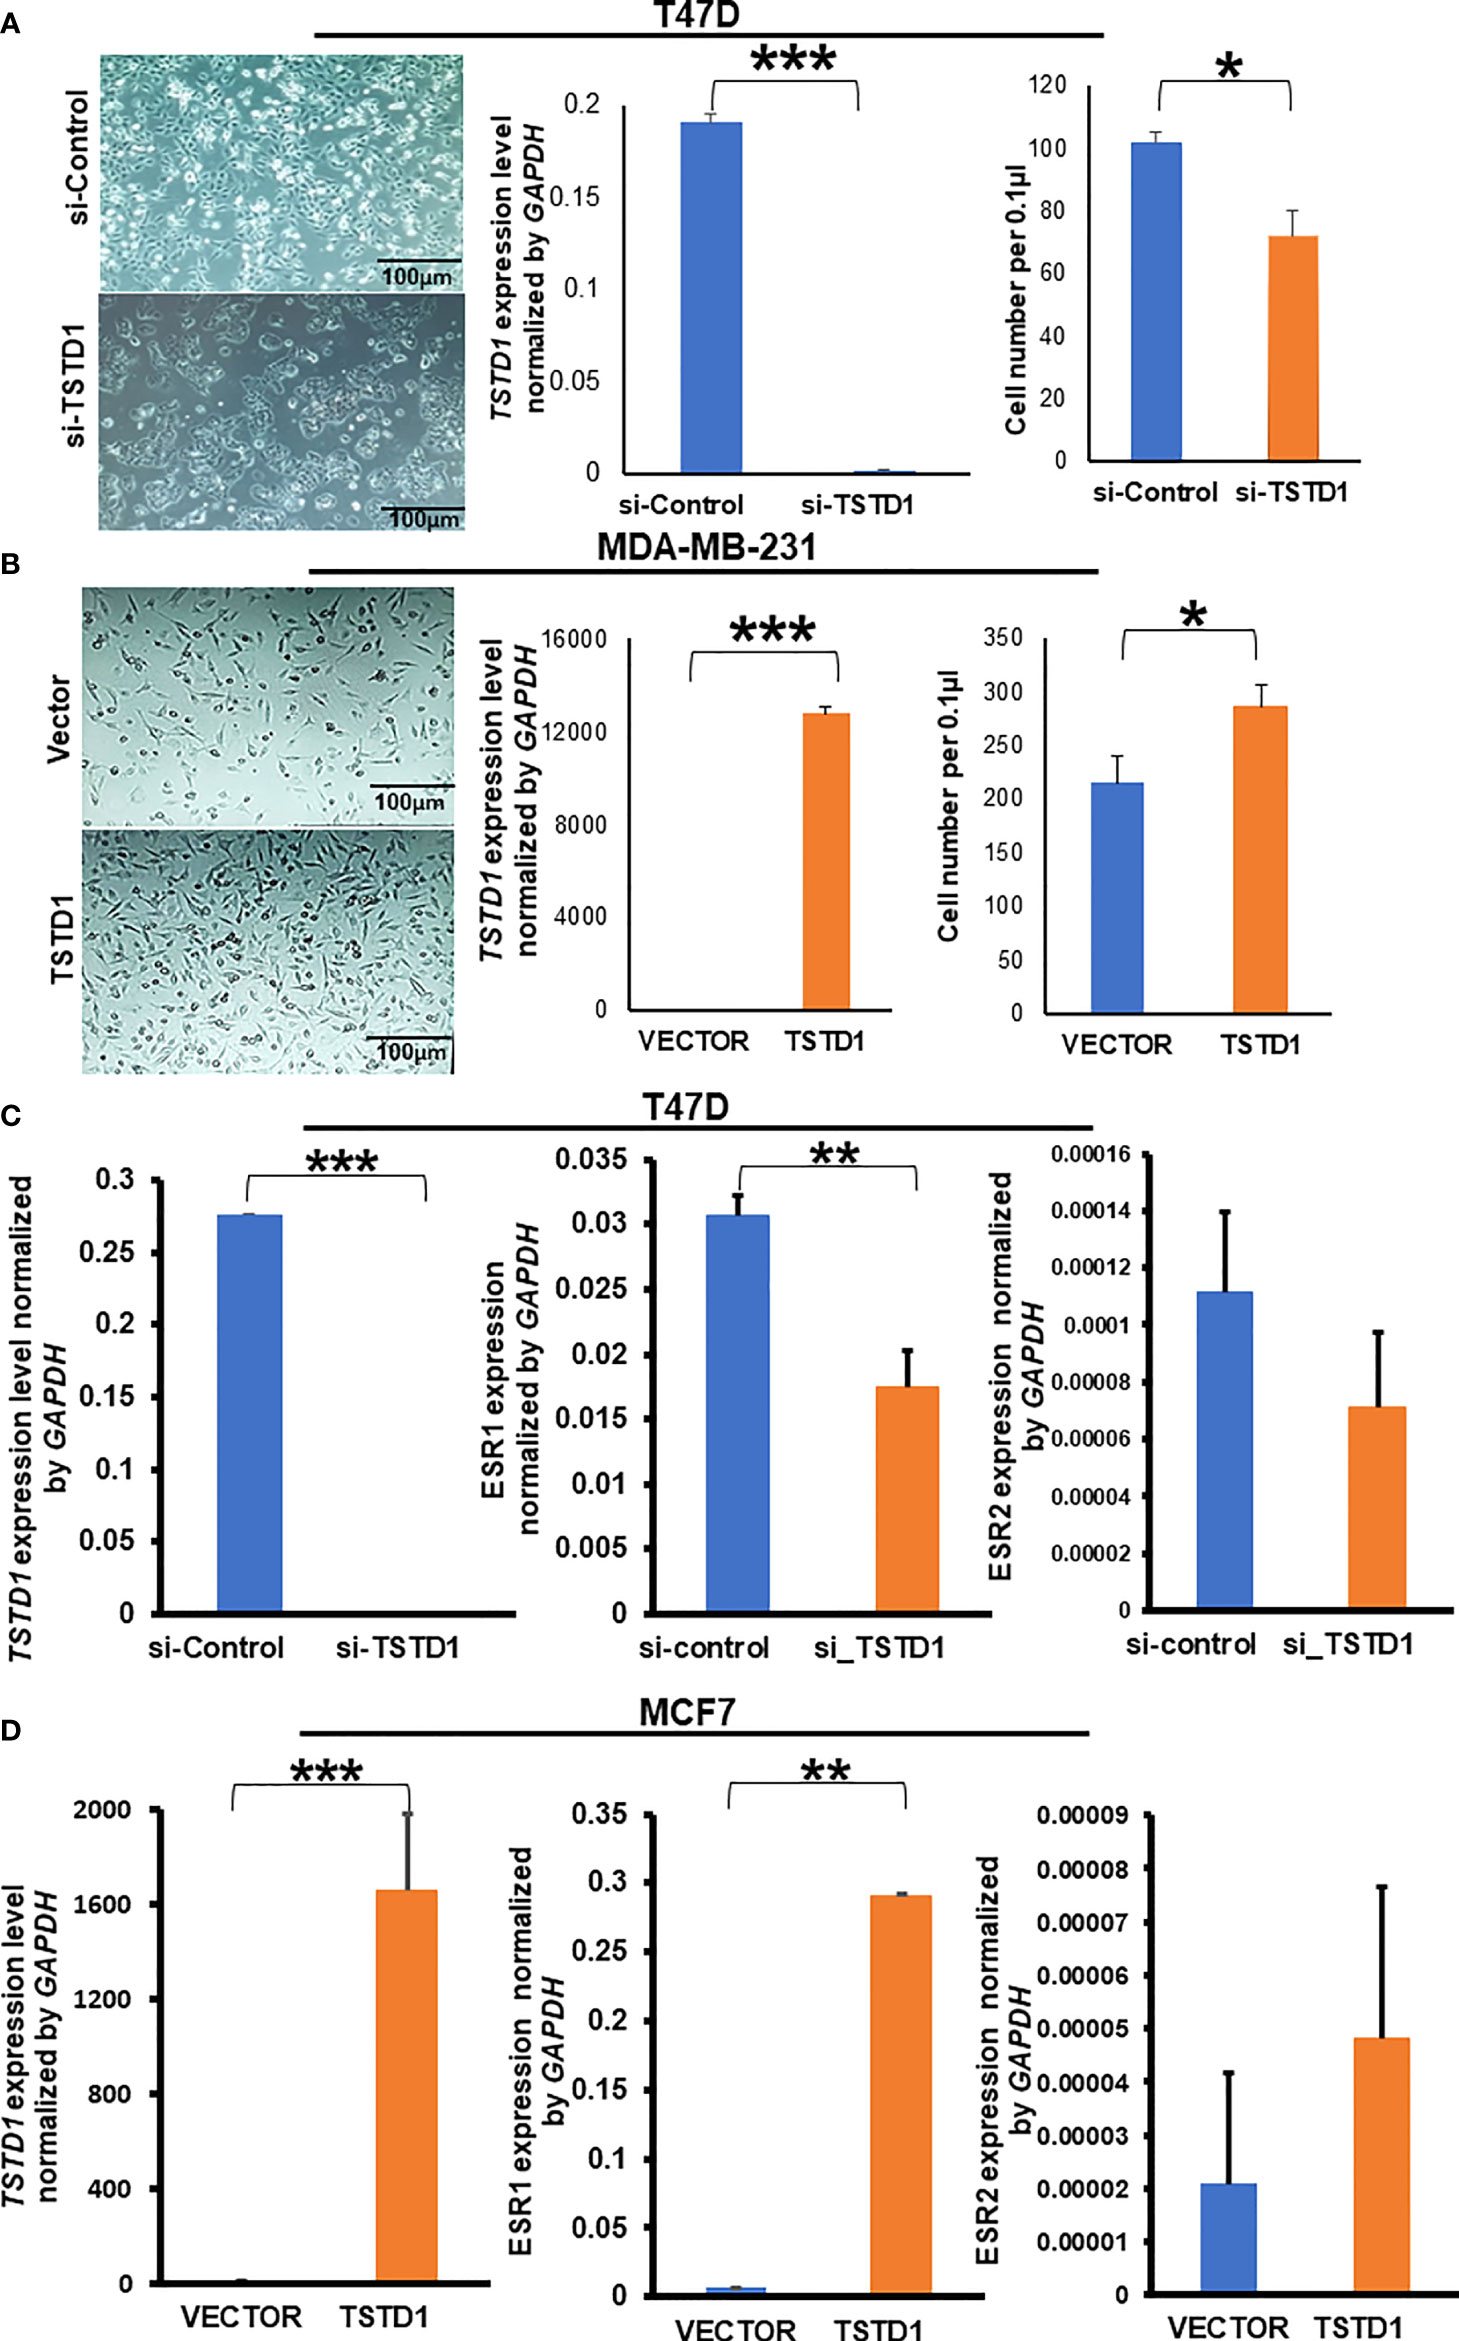
Figure 4 TSTD1 expression repressed and induced the proliferation of cancer cell lines and involved in the alteration of ESR1 and ESR2. GAPDH was used as internal control, (A) Images of T47D breast cancer cell lines after transfection with si-TSTD1 and the relative proliferation of T47D cells, (B) expression of TSTD1 and the relative proliferation of MDA-MB-231 cells after pCMV-TSTD1 plasmid transfection, (C) ESR1 and ESR2 expression after knockdown of TSTD1 in T47D cell line, (D) ESR1 and ESR2 expression after pCMV-TSTD1 plasmid transfection in MCF7 cell line. The data are presented as the mean ± SD, *p ≤ 0.05, **p ≤ 0.01, ***p ≤ 0.001.
After transfection of the pCMV-TSTD1 plasmid, MDA-MB-231 cells abundantly expressed TSTD1 mRNA (p< 0.001, Figure 4B). Cell counting and microscopic observation revealed that TSTD1 overexpression induced increase by 27% of the growth of MDA-MB-231 cells compared with a vector control (p=0.012, Figure 4B).
RT-qPCR revealed the expression levels of Estrogen Receptor 1 (ESR1) decreased by 0.5-fold in T47D cells after TSTD1 knockdown (p=0.002, Figure 4C). The expression levels of ESR1 increased by 43-fold in MCF7 cells after TSTD1 transfection (p=0.003, Figure 4D). The results are consistent with the clinical data, where TSTD1 overexpression in Western and high TSTD1 protein expression in Taiwanese are correlate with increased estrogen levels in patients with breast cancer (Tables 1, 2).
To determine whether TSTD1 expression is involved in responses to clinical treatment, we analyzed clinical data from TCGA datasets. High TSTD1 mRNA expression was correlated with the poor drugs treatment response in Western patients with breast cancer patients (p = 0.030, Table 4), especially for chemotherapy drug response (p = 0.005). Patients with complete responses were more likely to have tumors with TSTD1 downregulation before treatment (69 of 111 patients), whereas those who experienced progressive disease were more likely to have tumors with TSTD1 upregulation before treatment (9 of 11 patients).
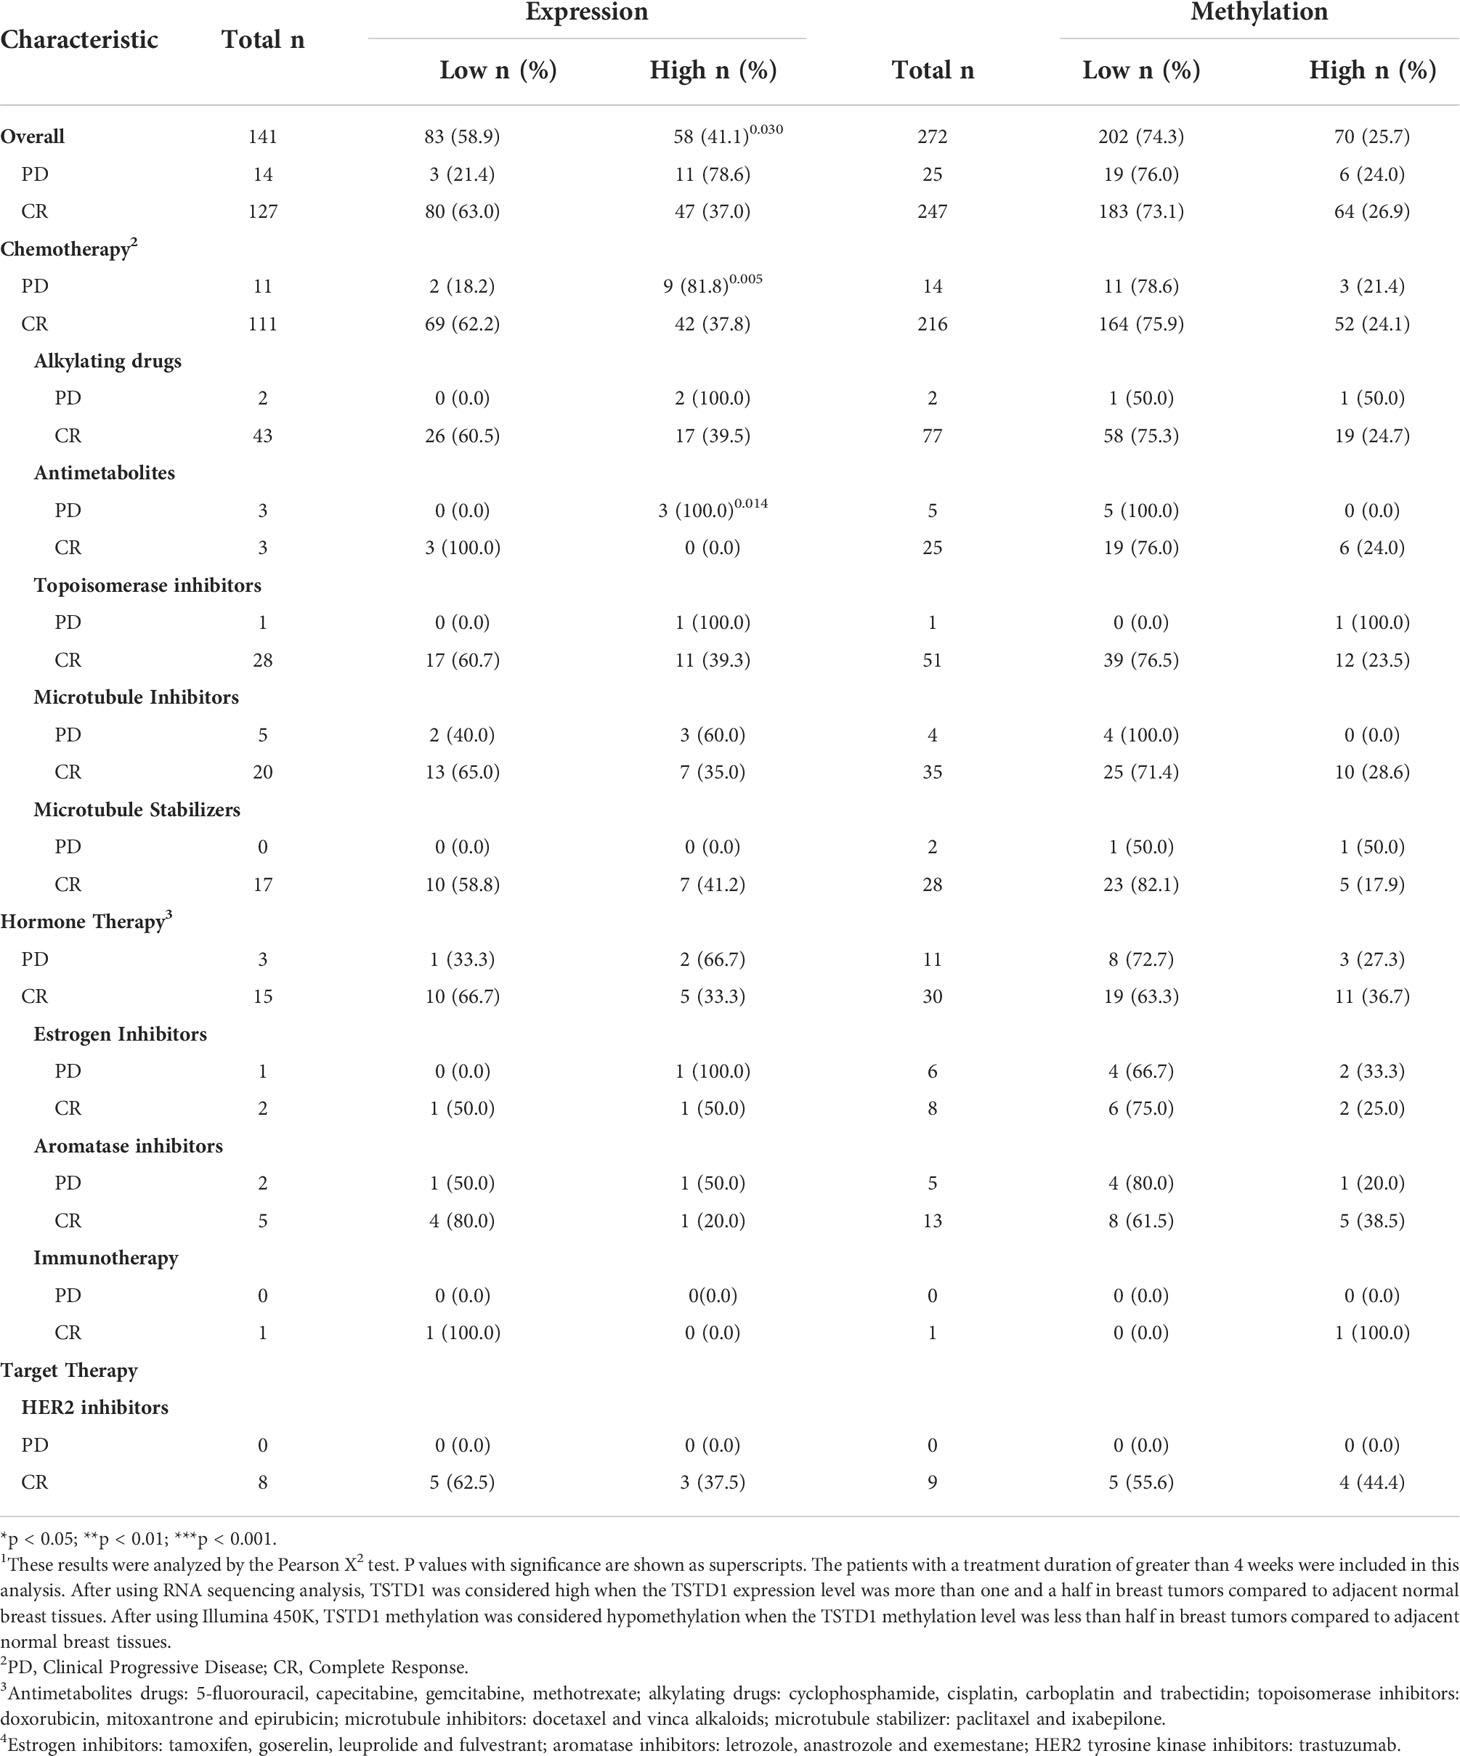
Table 4 TSTD1 mRNA expression and methylation level in relation to the drug response of Western breast cancer patients in TCGA datasets 1.
TSTD1 overexpression in MCF7 cells consistently and significantly mediated a poor response to chemotherapy and hormone therapy in a dose-dependent manner (Figure 5). Overexpression of TSTD1 in MCF7 decreased epirubicin-mediated toxicity. When treated with 200 nM of epirubicin, 42.5% of cells transfected with TSTD1 were decreased compared the 72.9% of cells in the vector control (p< 0.001). Overexpression of TSTD1 in MCF7 also decreased the toxicity of 100 nM of docetaxel: 48% of the cells were reduced compared to the 75.5% of cells in the vector control (p< 0.001). Furthermore, when treated with 20 mM of tamoxifen, 42.4% of cells were decreased in conditions of overexpressed TSTD1, compared the 58.1% of cells in the vector control (p= 0.025, Figure 5A). The results are consistent with the TCGA cohort data, where TSTD1 overexpression is correlated with poor drugs treatment response in breast cancer patients (Table 4).
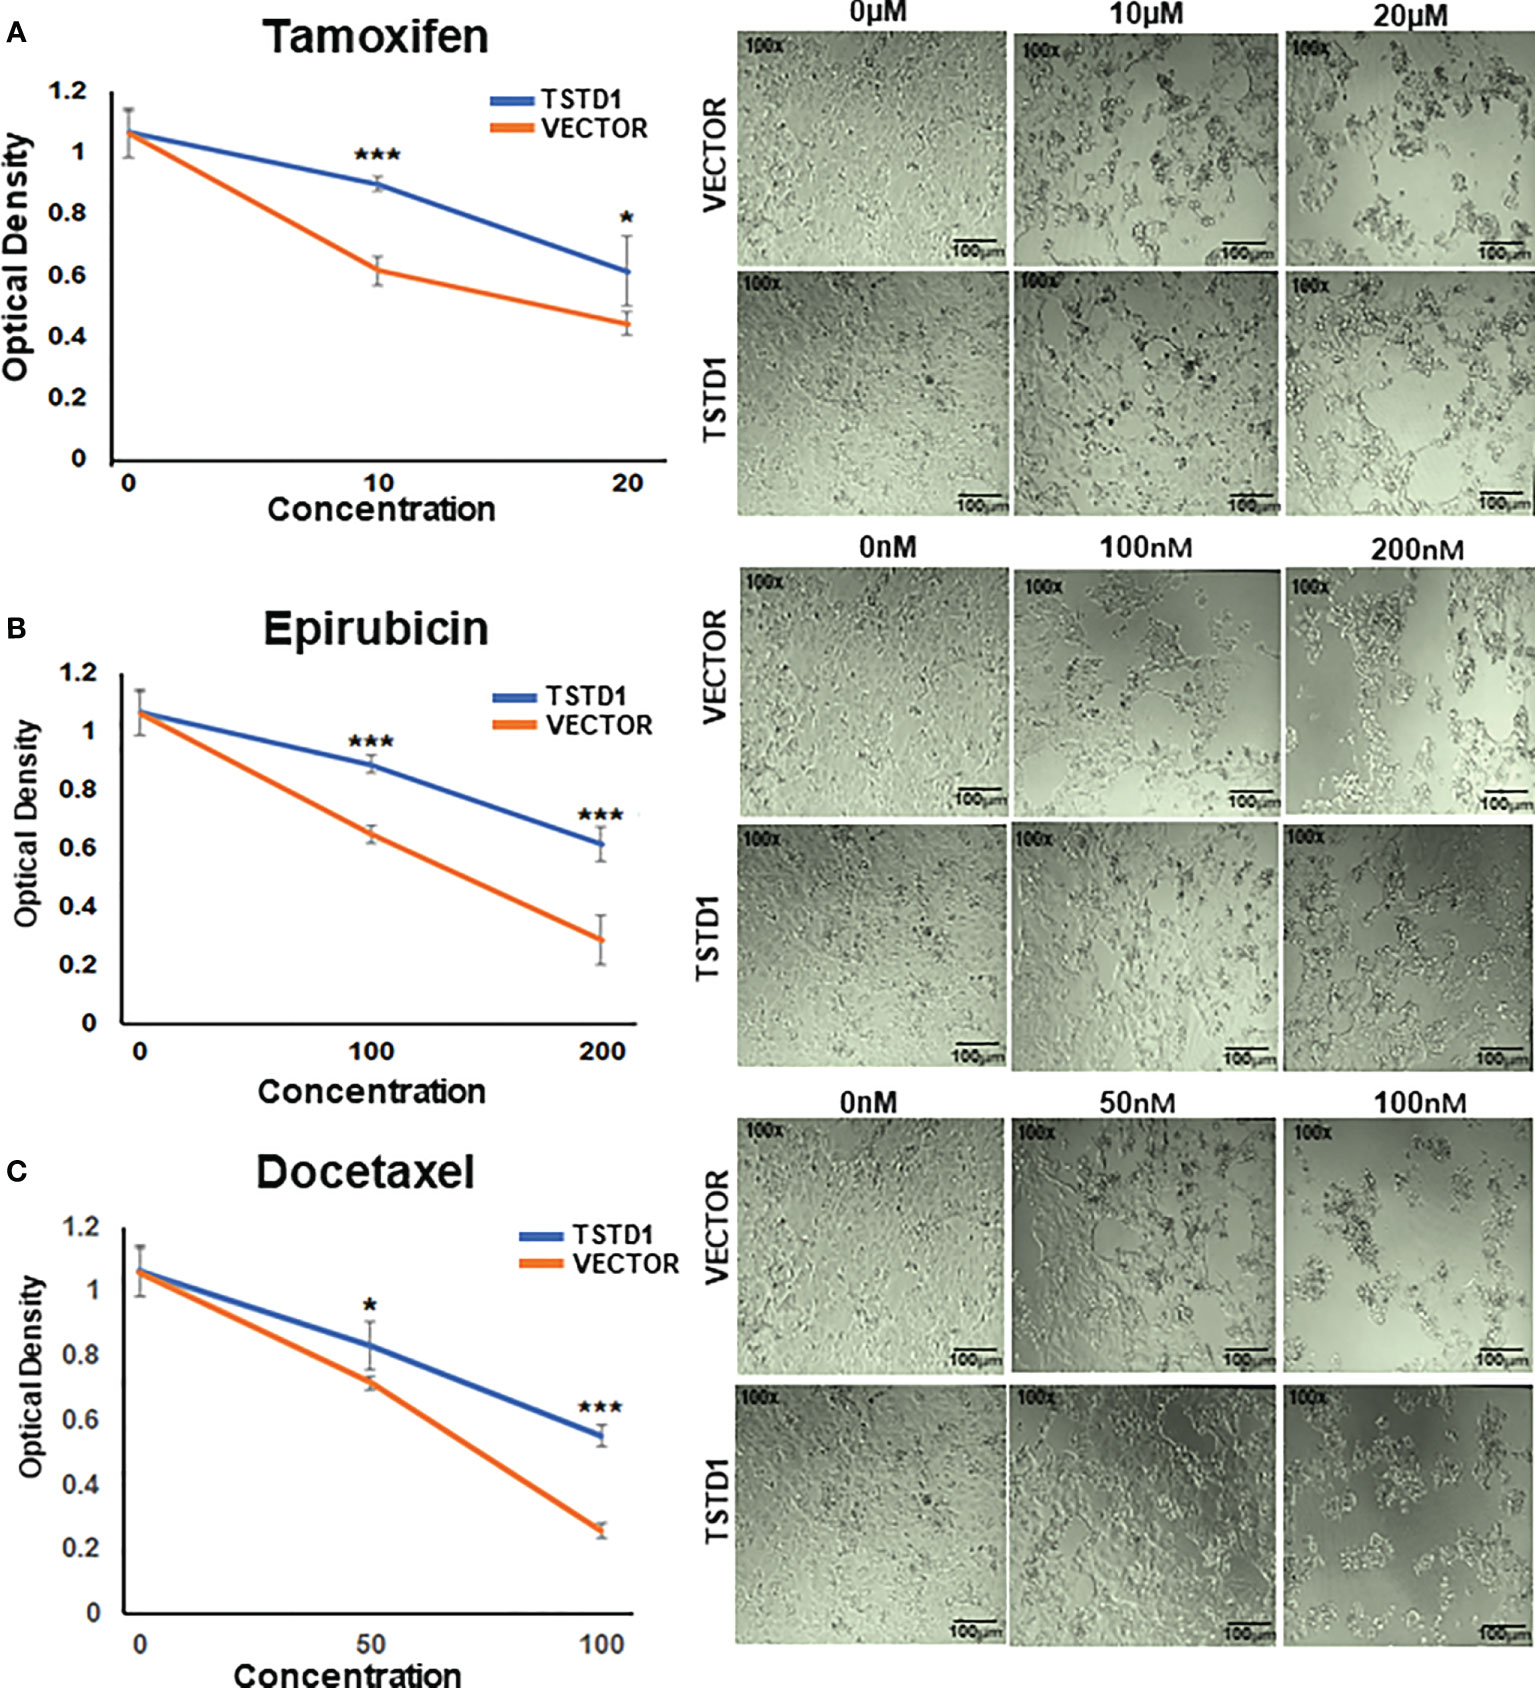
Figure 5 TSTD1 overexpression mediated poor treatment response. Cell proliferation assays were performed in MCF7 cells treated with (A) Tamoxifen, (B) Epirubicin, and (C) Docetaxel after TSTD1 plasmid transfection, in a dose-dependent manner. The result was analyzed using students paired t-test. The data are presented as the means ± SD. *p ≤ 0.05, **p ≤ 0.01, ***p ≤ 0.001.
A previous study reported that recombinant TSTD1 catalyzes the reaction between glutathione (GS−) and thiosulfate (S2O32−) that forms sulfide (SO32−) and glutathione persulfide (GSS−) in the sulfide oxidation pathway (14). Another study suggested TSTD1 has a role in sulfide signaling (13). In this study, liquid chromatography–mass spectrometry LC–MS was used to determine whether TSTD1 is involved in glutathione-dependent sulfide oxidation reaction in the T47D breast cancer cell line. The concentration of GSH and Glutathione disulfide (GSSG) in cell lysates was measured through LC–MS after treatment with si-TSTD1 or siRNA controls. There was a 2.95-fold increase in the GSH–GSSG ratio detected in cells with TSTD1 knockdowned through siRNA (p=0.003, Figure S6). Interestingly, knockdown of TSTD1 also reduced ROS levels by 0.8-fold (p=0.016, Figure S6B).
To analyze whether hypomethylation of TSDT1 can be detected in plasma and response to treatment, the hypomethylation (unmethylation) circulating cell-free TSTD1 was measured. After these patients received treatment, circulating DNA was extracted from their plasma at 3-6 month intervals and analyzed by QMSP. Circulating cell-free hypomethylated TSTD1 can be detected in all the breast cancer patients (n=12, Figure 6A). Circulating cell-free hypomethylated TSTD1 was found to be higher in breast tumors of patients who displayed distant metastasis after treatment (Figure 6B). However, it was revealed that the level of circulating hypomethylated TSTD1 was lower in patients with good prognosis after treatment (Figure 6C). The concentrations of CEA and CA15-3 in all of the patients serum remained normal and can therefore not be used to monitor disease progression and treatment response.
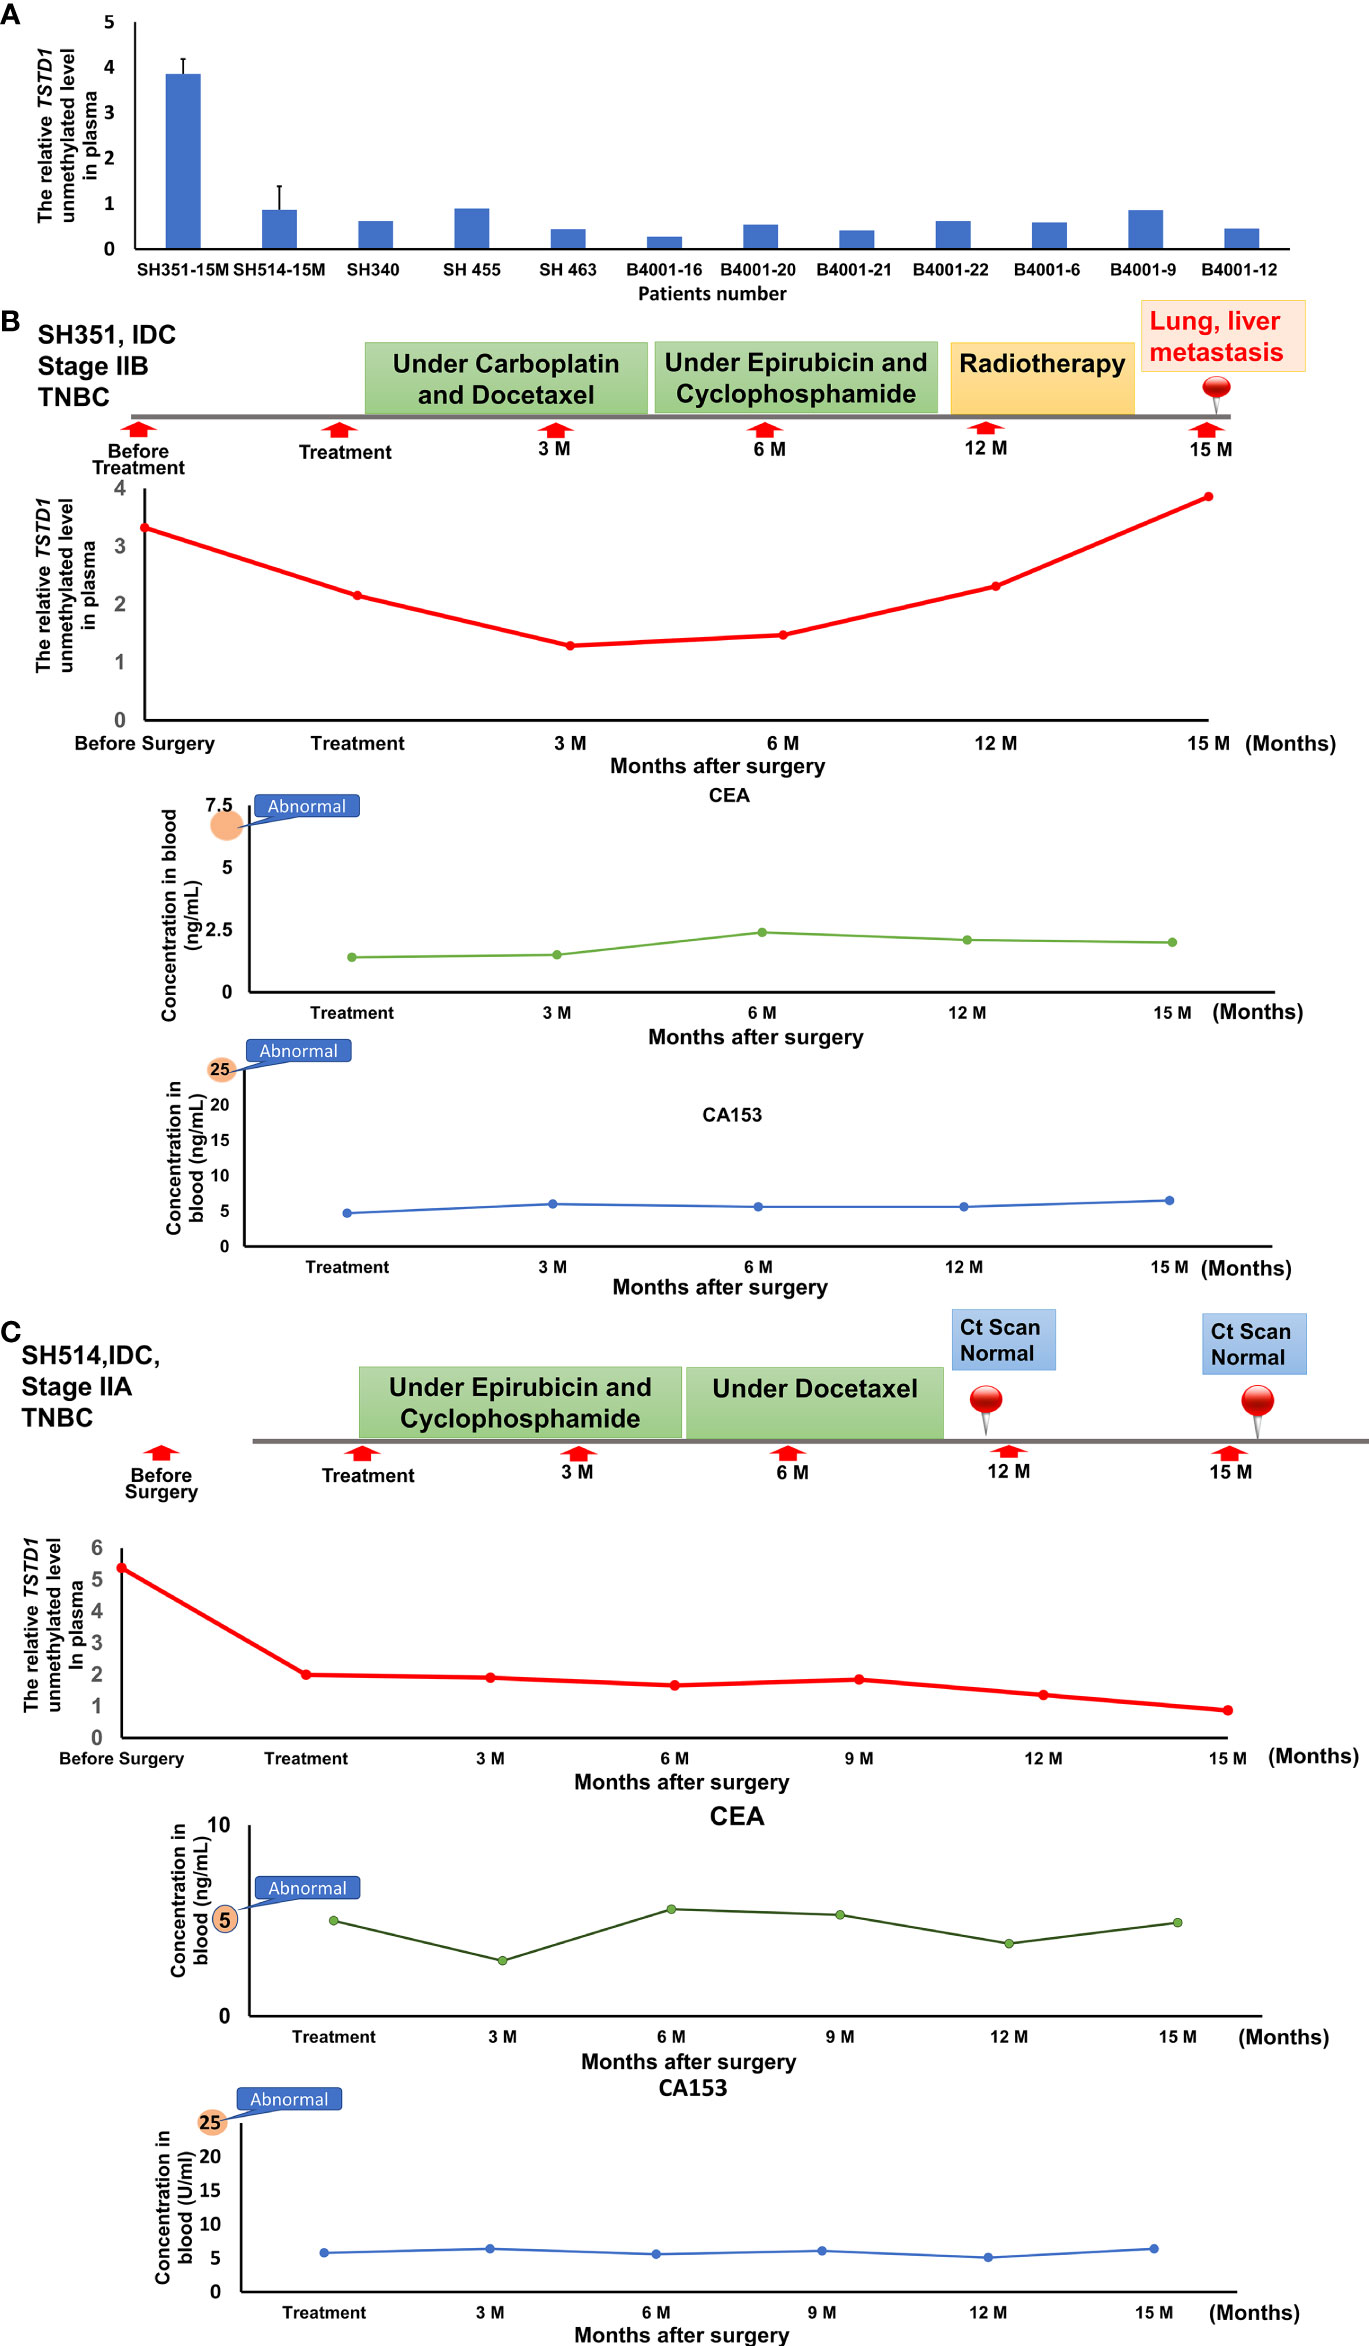
Figure 6 The circulating hypomethylated TSTD1 was monitored in breast cancer patients. (A) The circulating cell-free hypomethylated TSTD1 can be detected in plasma of Taiwanese breast cancer patients. (B) Distance metastasis was found in triple-negative breast cancer patients after circulating hypomethylated TSTD1 was gradually increased and revealed poor chemotherapy efficacy. The concentrations of CEA and CA15-3 in serum remained normal. (C) The lower level of circulating hypomethylated TSTD1 was found in triple-negative breast cancer patients with better proficient treatment response and good prognosis.
Previous studies have shown TSTD1 is highly expressed in breast cancer cell lines but not in normal breast cell lines (32). No clinical study has reported whether alterations of this gene correlate with the progression and treatment response of breast cancer patients. Here we found the protein expression level of TSTD1 is significantly higher in invasive breast tumors of Taiwanese and Korean breast cancer patients. This study examined the methylation and gene product expression of TSTD1 in Taiwanese and Western patients with breast cancer. We found overexpression of TSTD1 mRNA is correlated with DNA hypomethylation in Taiwanese and Western patients. Furthermore, through analyzing TCGA datasets, we found promoter hypomethylation and overexpression of TSTD1 in patients with breast cancer, even in Asian patients with breast cancer. Notably, hypomethylation of TSTD1 was stronger in TCGA Asian patients with breast cancer compared with Taiwanese patients with breast cancer, most likely due to technological differences or environmental interference in the different countries. These findings suggest the alterations of TSTD1 are potential tumor-specific biomarkers for breast cancer.
Upon examining the alterations of TSTD1 in different types of cancer, we found TSTD1 was hypomethylated in lung cancer samples from both the TCGA cohort and Taiwanese patients (Figures 1C, S7). However, no difference in TSTD1 expression was observed between lung cancer tumor tissues and normal tissues. Therefore, we concluded that the relationship between TSTD1 expression and methylation in patients with lung cancer depended on other conditional factors in the individual. Additionally, a study reported TSTD1 expression in lung cancer cell models (32). In our study, siRNA knockdown of TSTD1 in the H1299 lung cancer cell line suppressed cell growth (Figure S5). Additional clinical studies with a larger sample size are needed to provide a detailed analysis of the function of TSTD1 in lung cancer.
Immunohistochemical analysis revealed strong expression of TSTD1 protein in the tumor tissue of patients with breast cancer; however, weak to no staining was noted in normal tissues (Figure 3). Additionally, Taiwanese patients with ER-positive cancer were observed a high expression level of TSDT1 protein (Table 1). In Western cohorts, most of the patients with ER- and PR-positive cancer exhibited TSTD1 overexpression (Table 2). In addition, ESR1 expression significantly decreased after TSTD1 knockdown and significantly increased after transfection of TSTD1 in separate breast cancer cell lines. Interestingly, more than half of all breast cancers that overexpress ER-alpha are associated with cellular proliferation (43, 44). Breast cancer cells often dependent on estrogen to grow and proliferate (45). These results together suggest that TSTD1 involved in the proliferation of breast cancer cells is partly to be mediated by positive regulation of ESR1 expression. In addition, a previous study revealed that TSTD1 was the only hypomethylated gene related to HER2+ breast cancer patients (46). No further studies were undertaken. Furthermore, our clinical data in both Taiwanese and Western patients showed that there was no correlation between a TSTD1 methylation profile in HER2+ breast cancer patients.
Glutathione (GSH), which plays a vital role in cell biology, is involved in drug metabolite detoxification, apoptosis regulation, cancer progression, drug sensitivity, and chemoresistance (47, 48). GSH levels are higher in breast tumor tissues than in adjacent cancer-free tissues (49, 50). Inhibition of GSH led to the death of cancer cells in vitro and in vivo (51). Our LC–MS revealed an increase in the GSH–GSSG ratio after TSTD1 knockdown (Figure S6A). This result is supported by a study emphasizing the role of TSTD1 in the glutathione-dependent sulfide oxidation pathway (31). TSTD1 forms thiosulfate from glutathione persulfide (30). This is most likely why decreased ROS levels were observed after TSTD1 knockdown in breast cancer cells (Figure S6B). In the presence of estrogen and moderate ROS levels, estrogen can generate ROS, thus exerting pro-proliferative and anti-apoptotic effects on breast cancer cells (52). ROS induced by estrogens initiate carcinogenesis and promote cancer transformation (53). These previous studies support the idea that decreases in estrogen and ROS levels are the mechanism for decreased breast cancer cell proliferation after TSTD1 knockdown.
Tamoxifen and aromatase inhibitors are hormonal therapies used in the treatment of ER- or PR-positive breast cancers to cease tumor growth and recurrence. Adjuvant endocrine therapy can reduce the risk of recurrence or improve breast cancer outcomes (54, 55). According to laboratory and clinical investigations, some chemotherapeutic and hormone therapy agents are less effective in ER-positive tumors than ER-negative tumors since estrogen reverses the effects of chemotherapy and hormone therapy (56–58). This study has shown that TSTD1 expression decreases the cytotoxicity of epirubicin and docetaxel, which is consistent with clinical data from TCGA; patients with high expression TSTD1 displayed poorer 5-year survival than those with low expression of TSTD1. We also found the poor response to tamoxifen in cells overexpressing TSTD1. In addition, hypomethylation of TSTD1 in cell-free DNA can be detected in breast cancer patients with poor chemotherapy efficacy and disease progression. The mechanism of the poor drug response and resistance induced by TSTD1 is worthy of further investigation. In conclusion, TSTD1 is a potential biomarker for cancer outcomes: alterations of TSTD1 could indicate poor drug treatment response and 5-year survival.
Hypomethylation and overexpression of TSTD1 were found specifically in the breast cancer tissues of patients in Asain and Western countries. Upregulation of TSTD1 gene was mediated by DNA hypomethylation on the promoter of TSTD1. In addition, overexpression of TSTD1 was involved in breast cancer cell proliferation and poor chemotherapy and poor hormone therapy responses in breast cancer cells and breast cancer patients (Figures 7). Finally, the hypomethylation and overexpression of TSTD1 are potential biomarkers for tumor proliferation and chemotherapy and hormone therapy drug response.
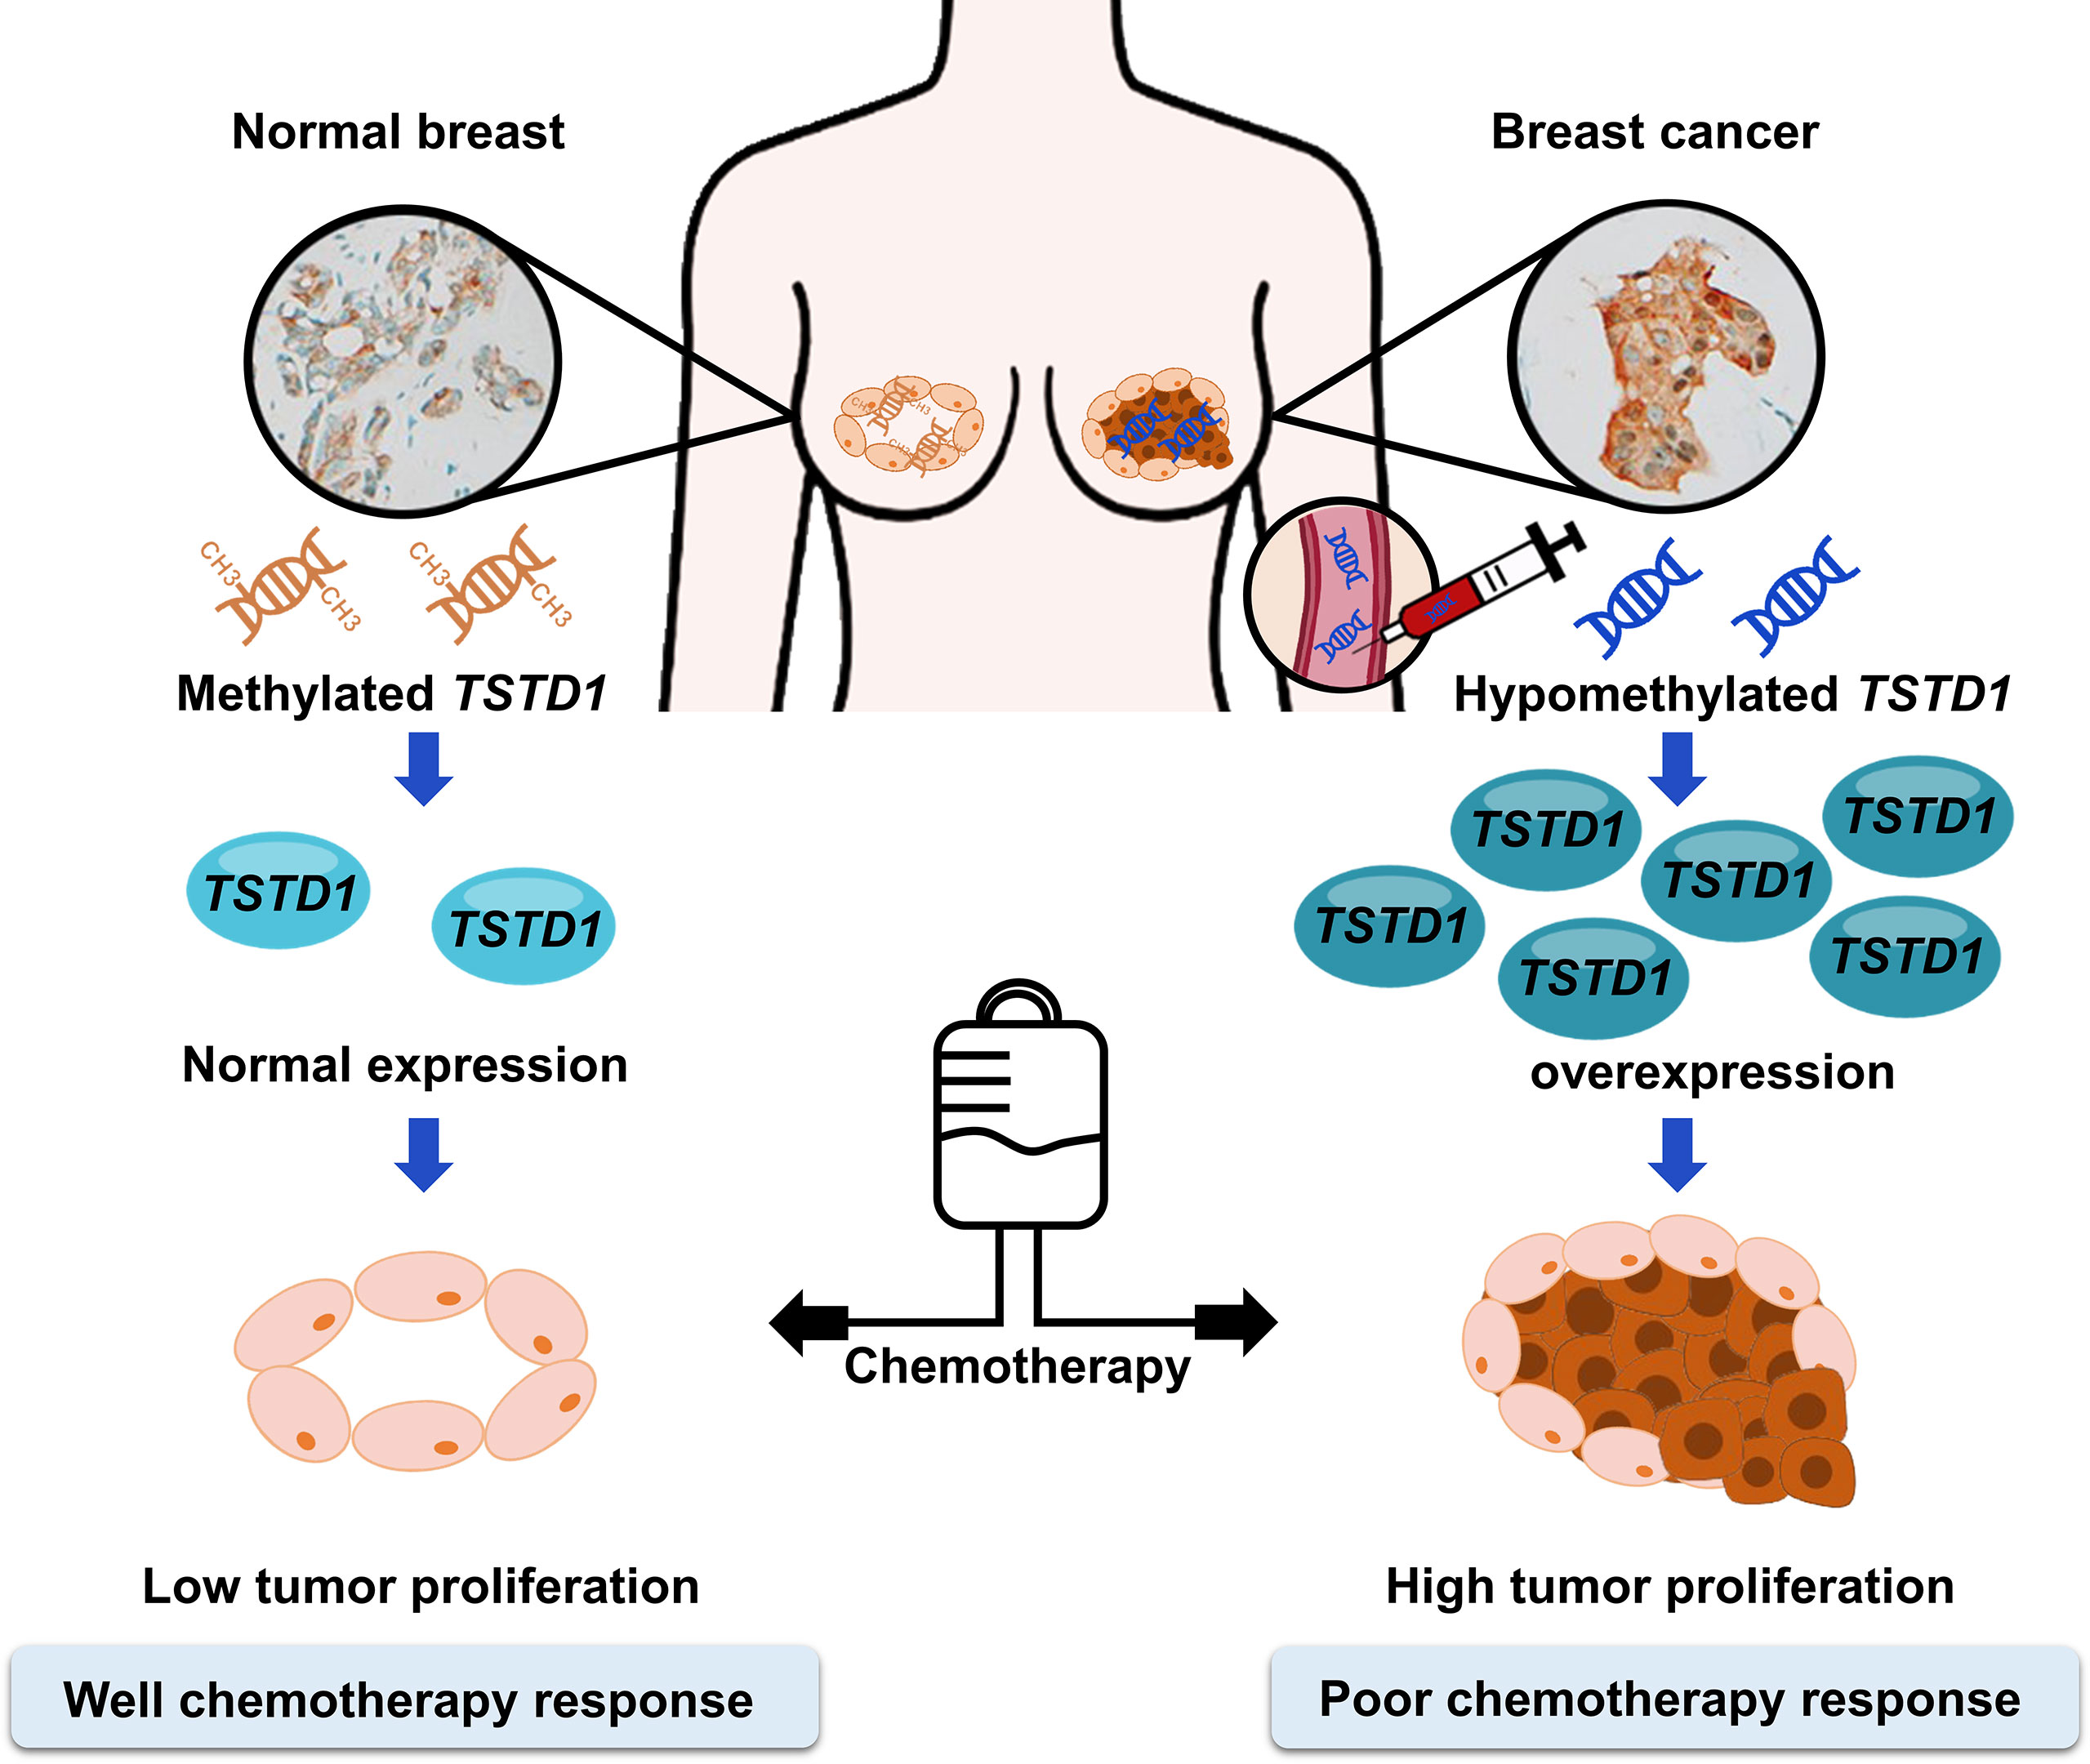
Figure 7 Promoter hypomethylation and overexpression of TSTD1 mediate poor treatment response in breast cancer.
The data generated in this study are available from the corresponding author upon reasonable request.
The studies involving human participants were reviewed and approved by Taipei Medical University - Joint Institutional Review Board and the Institutional Review Board. The patients/participants provided their written informed consent to participate in this study. Written informed consent was obtained from the individual(s) for the publication of any potentially identifiable images or data included in this article.
R-KL: Conceptualization. MA, LT, and Y-MC: Methodology. LT: Formal Analysis. LT, MA, and M-HH: Investigation. C-SH, C-MS, and L-ML: Resources. MA: Data Curation. LT, and MA: Writing – Original Draft Preparation. R-KL and LT. Writing – Review and Editing R-KL and C-SH: Supervision, R-KL, C-SH, and C-MS: Project Administration. R-KL: Funding Acquisition. All authors have read and agreed to the published version of the manuscript.
This work was supported in part by the Ministry of Science and Technology, Republic of China, grant number MOST110-2622-B-038-007 and MOST108-2320-B-038-020 and Ministry of Education, Republic of China, grant number 110-5804-001-400.
The authors are grateful for the support of the Core Facility Center of Taipei Medical University.
The authors declare that the research was conducted in the absence of any commercial or financial relationships that could be construed as a potential conflict of interest.
All claims expressed in this article are solely those of the authors and do not necessarily represent those of their affiliated organizations, or those of the publisher, the editors and the reviewers. Any product that may be evaluated in this article, or claim that may be made by its manufacturer, is not guaranteed or endorsed by the publisher.
The Supplementary Material for this article can be found online at: https://www.frontiersin.org/articles/10.3389/fonc.2022.1004261/full#supplementary-material
ACTB, Beta-actin; GAPDH, Glyceraldehyde 3phosphate dehydrogenase; QMSP, Quantitative methylation-specific polymerase chain reaction; RT-qPCR, Reversetranscription quantitative polymerase chain reaction; TSTD1, Thiosulfate sulfurtransferate-like domain containing 1; BC, Breast cancer; TCGA, The Cancer Genome Atlas; GSH, Glutathione; GSSG, Glutathione disulfide; ESR1, Estrogen receptor 1; and ESR2, Estrogen receptor 2; ROS, Reactive oxygen species; TMU, Taipei Medical University.
1. Bray F, Ferlay J, Soerjomataram I, Siegel RL, Torre LA, Jemal A. Global cancer statistics 2018: GLOBOCAN estimates of incidence and mortality worldwide for 36 cancers in 185 countries. CA Cancer J Clin (2018) 68(6):394–424. doi: 10.3322/caac.21492
2. Cancer Genome Atlas N. Comprehensive molecular portraits of human breast tumours. Nature (2012) 490(7418):61–70.
3. Dong G, Wang D, Liang X, Gao H, Wang L, Yu X, et al. Factors related to survival rates for breast cancer patients. Int J Clin Exp Med (2014) 7(10):3719–24.
4. Alkabban FM, Ferguson T. Breast cancer. In: Treasure Island (FL: StatPearls Publishing LLC. Breast Cancer (2022). StatPearls Publishing Copyright © 2022.
5. Gonçalves H Jr., Guerra MR, Duarte Cintra JR, Fayer VA, Brum IV, Bustamante Teixeira MT, et al. Survival study of triple-negative and non-Triple-Negative breast cancer in a Brazilian cohort. Clin Med Insights Oncol (2018) 12:1179554918790563.
6. Parashar S, Cheishvili D, Mahmood N, Arakelian A, Tanvir I, Khan HA, et al. DNA Methylation signatures of breast cancer in peripheral T-cells. BMC Cancer (2018) 18(1):574. doi: 10.1186/s12885-018-4482-7
7. Hung CS, Wang SC, Yen YT, Lee TH, Wen WC, Lin RK, et al. Hypermethylation of CCND2 in lung and breast cancer is a potential biomarker and drug target. Int J Mol Sci (2018) 19(10):3096. doi: 10.3390/ijms19103096
8. Sevinsky CJ, Khan F, Kokabee L, Darehshouri A, Maddipati KR, Conklin DS, et al. NDRG1 regulates neutral lipid metabolism in breast cancer cells. Breast Cancer Res (2018) 20(1):55. doi: 10.1186/s13058-018-0980-4
9. Lee S, Hallis SP, Jung KA, Ryu D, Kwak MK. Impairment of HIF-1alpha-mediated metabolic adaption by NRF2-silencing in breast cancer cells. Redox Biol (2019) 24:101210. doi: 10.1016/j.redox.2019.101210
10. Yuan B, Schafferer S, Tang Q, Scheffler M, Nees J, Heil J, et al. A plasma metabolite panel as biomarkers for early primary breast cancer detection. Int J Cancer (2019) 144(11):2833–42. doi: 10.1002/ijc.31996
11. Duffy MJ, Harbeck N, Nap M, Molina R, Nicolini A, Senkus E, et al. Clinical use of biomarkers in breast cancer: Updated guidelines from the European group on tumor markers (EGTM). Eur J Cancer (2017) 75:284–98. doi: 10.1016/j.ejca.2017.01.017
12. Costa-Pinheiro P, Montezuma D, Henrique R, Jerónimo C. Diagnostic and prognostic epigenetic biomarkers in cancer. Epigenomics (2015) 7(6):1003–15. doi: 10.2217/epi.15.56
13. Cejalvo JM, Pascual T, Fernández-Martínez A, Brasó-Maristany F, Gomis RR, Perou CM, et al. Clinical implications of the non-luminal intrinsic subtypes in hormone receptor-positive breast cancer. Cancer Treat Rev (2018) 67:63–70. doi: 10.1016/j.ctrv.2018.04.015
14. Dai XF, Li T, Bai Z, Yang Y, Liu X, Zhan J, et al. Breast cancer intrinsic subtype classification, clinical use and future trends. Am J Cancer Res (2015) 5(10):2929–43.
15. Waks AG, Winer EP. Breast cancer treatment: A review. JAMA (2019) 321(3):288–300. doi: 10.1001/jama.2018.19323
16. Rauh C, Schuetz F, Rack B, Stickeler E, Klar M, Orlowska-Volk M, et al. Hormone therapy and its effect on the prognosis in breast cancer patients. Geburtshilfe und Frauenheilkunde (2015) 75(06):588–96. doi: 10.1055/s-0035-1546149
17. Uchida N, Suda T, Ishiguro K. Effect of chemotherapy for luminal a breast cancer. Yonago Acta Med (2013) 56(2):51.
18. Hanna K, Mayden K. Chemotherapy treatment considerations in metastatic breast cancer. J Adv Pract Oncol (2021) 12(Suppl 2):6–12.
19. Abotaleb M, Kubatka P, Caprnda M, Varghese E, Zolakova B, Zubor P, et al. Chemotherapeutic agents for the treatment of metastatic breast cancer: An update. BioMed Pharmacother (2018) 101:458–77. doi: 10.1016/j.biopha.2018.02.108
20. Longley DB, Johnston PG. Molecular mechanisms of drug resistance. J Pathol (2005) 205(2):275–92. doi: 10.1002/path.1706
21. Germano S, O’driscoll L. Breast cancer: understanding sensitivity and resistance to chemotherapy and targeted therapies to aid in personalised medicine. Curr Cancer Drug Targets (2009) 9(3):398–418. doi: 10.2174/156800909788166529
22. Anurag M, Ellis MJ, Haricharan S. DNA Damage repair defects as a new class of endocrine treatment resistance driver. Oncotarget (2018) 9(91):36252–3. doi: 10.18632/oncotarget.26363
23. Smith IE, Dowsett M, Ebbs SR, Dixon JM, Skene A, Blohmer JU, et al. Neoadjuvant treatment of postmenopausal breast cancer with anastrozole, tamoxifen, or both in combination: the immediate preoperative anastrozole, tamoxifen, or combined with tamoxifen (IMPACT) multicenter double-blind randomized trial. J Clin Oncol (2005) 23(22):5108–16. doi: 10.1200/JCO.2005.04.005
24. Martí C, Yébenes L, Oliver JM, Moreno E, Frías L, Berjón A, et al. The clinical impact of neoadjuvant endocrine treatment on luminal-like breast cancers and its prognostic significance: Results from a single-institution prospective cohort study. Curr Oncol (2022) 29(4):2199–210. doi: 10.3390/curroncol29040179
25. Carey LA, Dees EC, Sawyer L, Gatti L, Moore DT, Collichio F, et al. The triple negative paradox: primary tumor chemosensitivity of breast cancer subtypes. Clin Cancer Res (2007) 13(8):2329–34. doi: 10.1158/1078-0432.CCR-06-1109
26. Buchholz TA, Stivers DN, Stec J, Ayers M, Clark E, Bolt A, et al. Global gene expression changes during neoadjuvant chemotherapy for human breast cancer. Cancer J (2002) 8(6):461–8. doi: 10.1097/00130404-200211000-00010
27. Yao Y, Zhou Y, Fu X. miR−671−3p is downregulated in non−small cell lung cancer and inhibits cancer progression by directly targeting CCND2. Mol Med Rep (2019) 19(3):2407–12.
28. Guan X, Guan Y. miR-145-5p attenuates paclitaxel resistance and suppresses the progression in drug-resistant breast cancer cell lines. Neoplasma (2020) 67(5):972–81. doi: 10.4149/neo_2020_190622N536
29. Li H, Zhang M, Wei Y, Haider F, Lin Y, Guan W, et al. SH3BGRL confers innate drug resistance in breast cancer by stabilizing HER2 activation on cell membrane. J Exp Clin Cancer Res (2020) 39(1):1–17. doi: 10.1186/s13046-020-01577-z
30. Libiad M, Motl N, Akey DL, Sakamoto N, Fearon ER, Smith JL, et al. Thiosulfate sulfurtransferase-like domain-containing 1 protein interacts with thioredoxin. J Biol Chem (2018) 293(8):2675–86. doi: 10.1074/jbc.RA117.000826
31. Melideo SL, Jackson MR, Jorns MS. Biosynthesis of a central intermediate in hydrogen sulfide metabolism by a novel human sulfurtransferase and its yeast ortholog. Biochemistry (2014) 53(28):4739–53. doi: 10.1021/bi500650h
32. Wenzel K, Felix SB, Flachmeier C, Heere P, Schulze W, Grunewald I, et al. Identification and characterization of KAT, a novel gene preferentially expressed in several human cancer cell lines. Biol Chem (2003) 384(5):763–75. doi: 10.1515/BC.2003.085
33. Mishanina TV, Libiad M, Banerjee R. Biogenesis of reactive sulfur species for signaling by hydrogen sulfide oxidation pathways. Nat Chem Biol (2015) 11(7):457–64. doi: 10.1038/nchembio.1834
34. Yadav PK, Yamada K, Chiku T, Koutmos M, Banerjee R. Structure and kinetic analysis of H2S production by human mercaptopyruvate sulfurtransferase. J Biol Chem (2013) 288(27):20002–13. doi: 10.1074/jbc.M113.466177
35. Libiad M, Yadav PK, Vitvitsky V, Martinov M, Banerjee R. Organization of the human mitochondrial hydrogen sulfide oxidation pathway. J Biol Chem (2014) 289(45):30901–10. doi: 10.1074/jbc.M114.602664
36. Wang X, Steensma JT, Bailey MH, Feng Q, Padda H, Johnson KJ, et al. Characteristics of the cancer genome atlas cases relative to U.S. general population cancer cases. Br J Cancer (2018) 119(7):885–92.
37. Ma CX, Ellis MJ. The cancer genome atlas: clinical applications for breast cancer. Oncol (Williston Park) (2013) 27(12):1263–91274–9.
38. Cserni G, Chmielik E, Cserni B, Tot T. The new TNM-based staging of breast cancer. Virchows Arch (2018) 472(5):697–703. doi: 10.1007/s00428-018-2301-9
39. Malhotra GK, Zhao X, Band H, Band V. Histological, molecular and functional subtypes of breast cancers. Cancer Biol Ther (2010) 10(10):955–60. doi: 10.4161/cbt.10.10.13879
40. He L, Lv Y, Song Y, Zhang B. The prognosis comparison of different molecular subtypes of breast tumors after radiotherapy and the intrinsic reasons for their distinct radiosensitivity. Cancer Manag Res (2019) 11:5765–75. doi: 10.2147/CMAR.S213663
41. Carlsson J, Davidsson S, Fridfeldt J, Giunchi F, Fiano V, Grasso C, et al. Quantity and quality of nucleic acids extracted from archival formalin fixed paraffin embedded prostate biopsies. BMC Med Res Methodol (2018) 18(1):161. doi: 10.1186/s12874-018-0628-1
42. Li LC, Dahiya R. MethPrimer: designing primers for methylation PCRs. Bioinformatics (2002) 18(11):1427–31. doi: 10.1093/bioinformatics/18.11.1427
43. Helguero LA, Faulds MH, Gustafsson JÅ, Haldosen LA. Estrogen receptors alfa (ERalpha) and beta (ERbeta) differentially regulate proliferation and apoptosis of the normal murine mammary epithelial cell line HC11. Oncogene (2005) 24(44):6605–16. doi: 10.1038/sj.onc.1208807
44. Liao XH, Lu DL, Wang N, Liu LY, Wang Y, Li YQ, et al. Estrogen receptor α mediates proliferation of breast cancer MCF-7 cells via a p21/PCNA/E2F1-dependent pathway. FEBS J (2014) 281(3):927–42. doi: 10.1111/febs.12658
45. Russo J, Russo IH. The role of estrogen in the initiation of breast cancer. J Steroid Biochem Mol Biol (2006) 102(1-5):89–96. doi: 10.1016/j.jsbmb.2006.09.004
46. Lindqvist BM, Wingren S, Motlagh PB, Nilsson TK. Whole genome DNA methylation signature of HER2-positive breast cancer. Epigenetics (2014) 9(8):1149–62. doi: 10.4161/epi.29632
47. Traverso N, Ricciarelli R, Nitti M, Marengo B, Furfaro AL, Pronzato MA, et al. Role of glutathione in cancer progression and chemoresistance. Oxid Med Cell Longev (2013) 2013:972913. doi: 10.1155/2013/972913
48. Bansal A, Simon MC. Glutathione metabolism in cancer progression and treatment resistance. J Cell Biol (2018) 217(7):2291–8. doi: 10.1083/jcb.201804161
49. Yeh CC, Hou MF, Wu SH, Tsai SM, Lin SK, Hou LA, et al. A study of glutathione status in the blood and tissues of patients with breast cancer. Cell Biochem Funct (2006) 24(6):555–9. doi: 10.1002/cbf.1275
50. Gamcsik MP, Kasibhatla MS, Teeter SD, Colvin OM. Glutathione levels in human tumors. Biomarkers (2012) 17(8):671–91. doi: 10.3109/1354750X.2012.715672
51. Harris IS, Treloar AE, Inoue S, Sasaki M, Gorrini C, Lee KC, et al. Glutathione and thioredoxin antioxidant pathways synergize to drive cancer initiation and progression. Cancer Cell (2015) 27(2):211–22. doi: 10.1016/j.ccell.2014.11.019
52. Johar R, Sharma R, Kaur A, Mukherjee KT. Role of reactive oxygen species in estrogen dependant breast cancer complication. Anticancer Agents Med Chem (2015) 16(2):190–9. doi: 10.2174/1871520615666150518092315
53. Tian H, Gao Z, Wang G, Li H, Zheng J. Estrogen potentiates reactive oxygen species (ROS) tolerance to initiate carcinogenesis and promote cancer malignant transformation. Tumour Biol (2016) 37(1):141–50. doi: 10.1007/s13277-015-4370-6
54. Burstein HJ, Lacchetti C, Anderson H, Buchholz TA, Davidson NE, Gelmon KA, et al. Adjuvant endocrine therapy for women with hormone receptor-positive breast cancer: ASCO clinical practice guideline focused update. J Clin Oncol (2019) 37(5):423–38. doi: 10.1200/JCO.18.01160
55. Gnant M, Fitzal F, Rinnerthaler G, Steger GG, Greil-Ressler S, Balic M, et al. Duration of adjuvant aromatase-inhibitor therapy in postmenopausal breast cancer. N Engl J Med (2021) 385(5):395–405. doi: 10.1056/NEJMoa2104162
56. Sui M, Zhang H, Fan W. The role of estrogen and estrogen receptors in chemoresistance. Curr Med Chem (2011) 18(30):4674–83. doi: 10.2174/092986711797379348
57. Ashour F, Awwad MH, Sharawy HE, Kamal M. Estrogen receptor positive breast tumors resist chemotherapy by the overexpression of P53 in cancer stem cells. J Egypt Natl Canc Inst (2018) 30(2):45–8. doi: 10.1016/j.jnci.2018.04.002
Keywords: TSTD1, breast cancer, DNA methylation, hypomethylation, chemotherapy, hormone therapy, drug response, circulating cell-free DNA (cfDNA)
Citation: Ansar M, Thu LTA, Hung C-S, Su C-M, Huang M-H, Liao L-M, Chung Y-M and Lin R-K (2022) Promoter hypomethylation and overexpression of TSTD1 mediate poor treatment response in breast cancer. Front. Oncol. 12:1004261. doi: 10.3389/fonc.2022.1004261
Received: 27 July 2022; Accepted: 19 October 2022;
Published: 07 November 2022.
Edited by:
Donghong Zhang, Emory University, United StatesReviewed by:
Abhijit Shukla, Memorial Sloan Kettering Cancer Center, United StatesCopyright © 2022 Ansar, Thu, Hung, Su, Huang, Liao, Chung and Lin. This is an open-access article distributed under the terms of the Creative Commons Attribution License (CC BY). The use, distribution or reproduction in other forums is permitted, provided the original author(s) and the copyright owner(s) are credited and that the original publication in this journal is cited, in accordance with accepted academic practice. No use, distribution or reproduction is permitted which does not comply with these terms.
*Correspondence: Ruo-Kai Lin, bGlucnVva2FpQHRtdS5lZHUudHc=
†These authors have contributed equally to this work and share first authorship
Disclaimer: All claims expressed in this article are solely those of the authors and do not necessarily represent those of their affiliated organizations, or those of the publisher, the editors and the reviewers. Any product that may be evaluated in this article or claim that may be made by its manufacturer is not guaranteed or endorsed by the publisher.
Research integrity at Frontiers
Learn more about the work of our research integrity team to safeguard the quality of each article we publish.