 Erika Naakka1,2
 Mateus Camargo Barros-Filho3
 Shady Adnan-Awad2,4
 Ahmed Al-Samadi1,2
 Fábio Albuquerque Marchi3
 Hellen Kuasne3
 Katja Korelin1,2
 Ilida Suleymanova1,2
 Amy Louise Brown5
 Cristovam Scapulatempo-Neto6
 Silvia Vanessa Lourenço7,8Rogério Moraes Castilho9
 Luiz Paulo Kowalski10,11
 Antti Mäkitie12,13,14Vera Cavalcanti Araújo5Ilmo Leivo15
 Silvia Regina Rogatto16,17
 Tuula Salo1,2,18,19,20
 Fabricio Passador-Santos5*
- 1Department of Oral and Maxillofacial Diseases, University of Helsinki, Helsinki, Finland
- 2Translational Immunology Research Program (TRIMM), University of Helsinki, Helsinki, Finland
- 3Centro Internacional de Pesquisa (CIPE) – A.C.Camargo Cancer Center, São Paulo, Brazil
- 4Hematology Research Unit, Department of Clinical Chemistry and Hematology, University of Helsinki, Helsinki University Hospital Comprehensive Cancer Center, Helsinki, Finland
- 5Department of Oral Pathology, Faculdade São Leopoldo Mandic, Campinas, Brazil
- 6Molecular Oncology Research Center, Barretos, and Diagnósticos da América (DASA), Barueri, Brazil
- 7Department of Pathology, A.C.Camargo Cancer Center, São Paulo, Brazil
- 8Department of General Pathology, Dental School, University of São Paulo, São Paulo, Brazil
- 9Department of Periodontics and Oral Medicine, University of Michigan School of Dentistry, Ann Arbor, MI, United States
- 10Department of Head and Neck Surgery and Otorhinolaryngology, A.C.Camargo Cancer Center, São Paulo, Brazil
- 11Department of Head and Neck Surgery, University of Sao Paulo Medical School, São Paulo, Brazil
- 12Department of Otorhinolaryngology – Head and Neck Surgery, University of Helsinki and Helsinki University Hospital, Helsinki, Finland
- 13Research Program in Systems Oncology, Faculty of Medicine, University of Helsinki, Helsinki, Finland
- 14Division of Ear, Nose and Throat Diseases, Department of Clinical Sciences, Intervention and Technology, Karolinska Institute and Karolinska Hospital, Stockholm, Sweden
- 15Institute of Biomedicine, Pathology, University of Turku and Turku University Hospital, Turku, Finland
- 16Department of Clinical Genetics, University Hospital of Southern Denmark, Vejle, Denmark
- 17Institute of Regional Health Research, University of Southern Denmark, Odense, Denmark
- 18Department of Pathology, Helsinki University Hospital, Helsinki, Finland
- 19Cancer and Translational Medicine Research Unit, University of Oulu, Oulu, Finland
- 20Medical Research Center, Oulu University Hospital, Oulu, Finland
Objectives: To integrate mRNA and miRNA expression profiles of mucoepidermoid carcinomas (MECs) and normal salivary gland (NSGs) tissue samples and identify potential drivers.
Material and Methods: Gene and miRNA expression arrays were performed in 35 MECs and six NSGs.
Results: We found 46 differentially expressed (DE) miRNAs and 3,162 DE mRNAs. Supervised hierarchical clustering analysis of the DE transcripts revealed two clusters in both miRNA and mRNA profiles, which distinguished MEC from NSG samples. The integrative miRNA-mRNA analysis revealed a network comprising 696 negatively correlated interactions (44 miRNAs and 444 mRNAs) involving cell signaling, cell cycle, and cancer-related pathways. Increased expression levels of miR-205-5p and miR-224-5p and decreased expression levels of miR-139-3p, miR-145-3p, miR-148a-3p, miR-186-5p, miR-338-3p, miR-363-3p, and miR-4324 were significantly related to worse overall survival in MEC patients. Two overexpressed miRNAs in MEC (miR-22 and miR-205) were selected for inhibition by the CRISPR-Cas9 method. Cell viability, migration, and invasion assays were performed using an intermediate grade MEC cell line. Knockout of miR-205 reduced cell viability and enhanced ZEB2 expression, while miR-22 knockout reduced cell migration and invasion and enhanced ESR1 expression. Our results indicate a distinct transcriptomic profile of MEC compared to NSG, and the integrative analysis highlighted miRNA-mRNA interactions involving cancer-related pathways, including PTEN and PI3K/AKT.
Conclusion: The in vitro functional studies revealed that miR-22 and miR-205 deficiencies reduced the viability, migration, and invasion of the MEC cells suggesting they are potential oncogenic drivers in MEC.
Introduction
Mucoepidermoid carcinoma (MEC) is the most common salivary gland malignancy in major and minor glands, and the most common salivary gland cancer affecting pediatric patients (1). The clinical behavior is variable, ranging from indolent locally infiltrative lesions to highly aggressive and metastatic lesions (2, 3). The widely used histological grade system stratifies MECs into low, intermediate, or high-grade (I, II, or III, respectively) according to histologic characteristics (1, 4–6). Histologic grade and TNM status are commonly used parameters for treatment planning. Treatment of low- and intermediate-grade tumors is based on complete surgical removal of the tumor, while there is no consensus regarding the guidelines for intermediate histologic grade (2, 7–10). In high-grade MEC, the treatment is generally surgery, followed by postoperative radiotherapy. The survival rates for low-grade MEC is over 90% at 10 years, while 70% of intermediate-grade and only 25% of high-grade MEC patients are alive after 10 years (1).
The recurrent chromosome translocation t(11;19) with the resulting CRTC1-MAML2 fusion oncogene has been described in 60-90% of MECs (10–17). The fusion transcript has been found specific for MECs when comparing with other types of salivary gland tumors (17). CRTC1-MAML2 has also been considered a prognostic marker (18–20), although its use in prognostication has been questioned (12, 21).
The gene expression profile of MECs has been reported in two studies in which the authors investigated a few MEC cases and compared the differentially expressed (DE) mRNA transcripts with other salivary gland tumors (22, 23).
miRNA expression studies were performed on a few MEC samples focusing on specific gene/miRNA pathways, such as angiogenesis, mast cell activation, and apoptosis (24, 25). In six MEC and three normal salivary gland samples, Binmadi et al. reported 68 DE miRNAs (26) [25]. Among them, miR-302a was the most upregulated and miR-885-5p the most downregulated miRNA (26).
Here, we investigated mRNA and miRNA expression profiles of 35 fresh-frozen MECs and six normal salivary gland tissue samples, followed by an integrative miRNA-mRNA analysis to select potential drivers. In an intermediate grade MEC cell line (UM-HMC-2), we used the CRISPR/Cas9 method to knock down two miRNAs (miR-22 and miR-205) overexpressed in MEC tissues, with the aim of analyzing their role as oncogenic drivers in MEC.
Material and Methods
Patients and Tissue Specimens
We selected 35 MEC samples from patients treated at the A.C.Camargo Cancer Center and Barretos Cancer Hospital, Barretos, São Paulo, Brazil. Two experienced pathologists (FPS and VCA) in salivary gland tumors reviewed the diagnosis of all tumor cases and graded according to Auclair et al., 1992 (4). Demographic, clinical, pathological, therapeutic, and follow-up data were obtained from the patients’ medical records (Table 1). A reference RNA (Human Universal Reference Total RNA, Clontech, Mountain View, California, USA) was used and hybridized with both tumor RNA and normal salivary gland RNA. Six surrounding normal salivary glands (NSG/control) tissues were removed during surgical procedures of six MEC patients, and they were hybridized with reference RNA to further compare their mRNA and miRNA expressions with MEC’s (tumor) mRNA and miRNA expressions. All samples were collected from treatment-naive patients. Written informed consent was obtained from all patients before the sample collection. The National Human Research Ethics Committee approved the study (Protocol #1.380.762/2015).
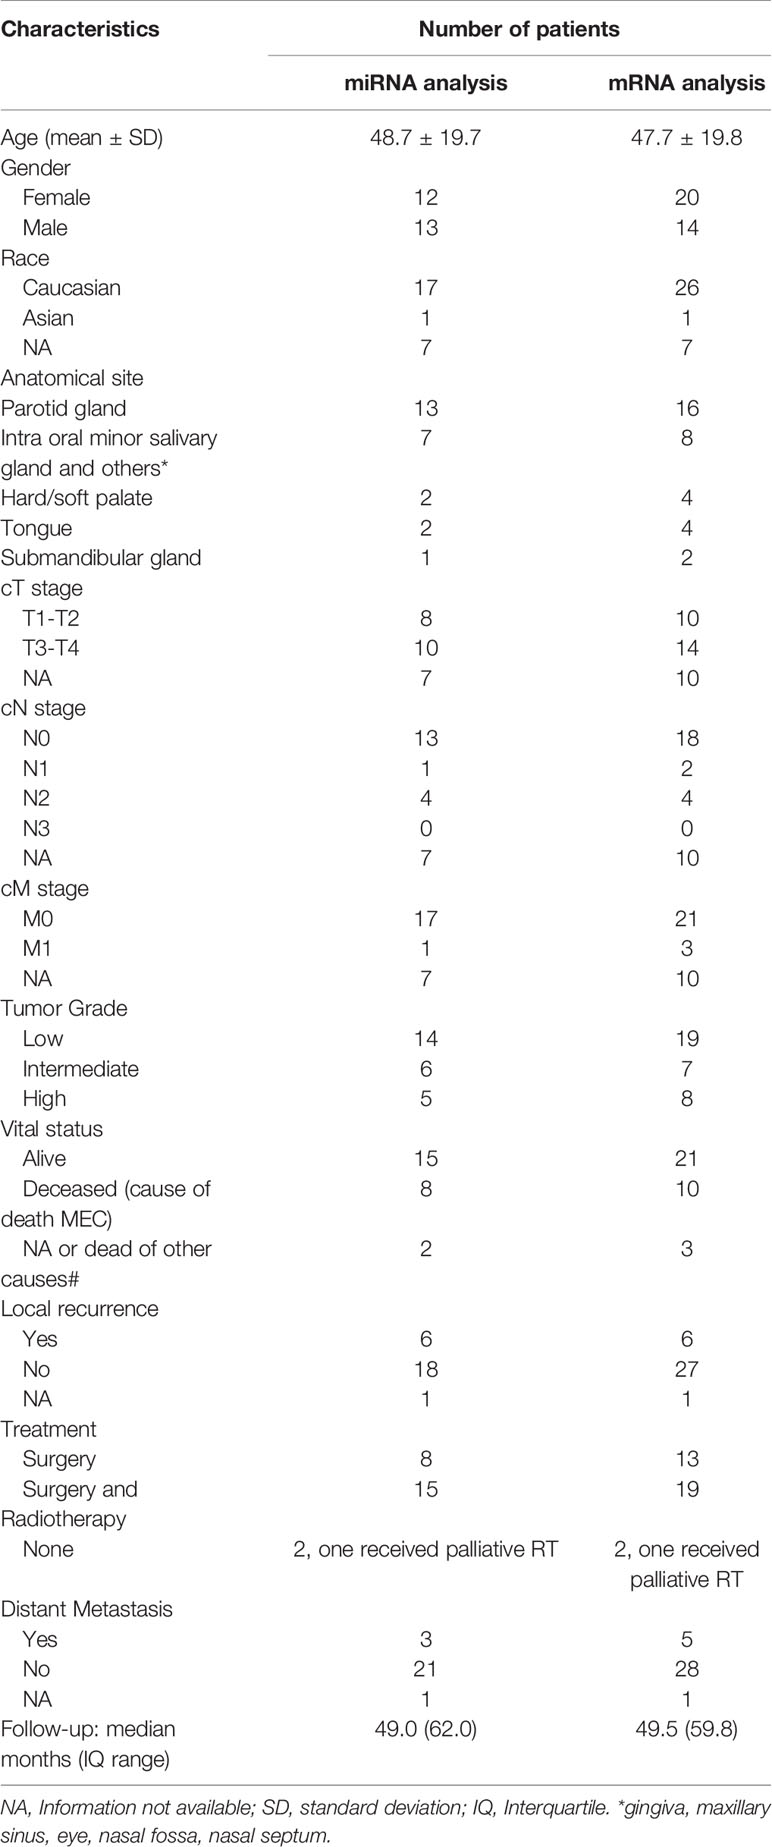
Table 1 Demographic, clinical histopathological, therapeutic and follow-up findings of 35 mucoepidermoid carcinomas patients evaluated by mRNA and miRNA expression analyses.
miRNA Expression Analysis
miRNA expression analyses were performed in 25 out of the 35 fresh-frozen MEC samples and six NSG; no tissue or total RNA was available for analyses in the remaining 10 samples (Table 1). Hybridizations were performed using a one-color SurePrint 8X60K Human miRNA platform (G4870A, Agilent Technologies, Santa Clara, CA, USA), as recommended by the supplier. Background correction, quantile normalization, log2 transformation, and statistical tests were conducted using BRB ArrayTools software v. 4.4.0 (Biometric Research Branch, National Cancer Institute, Bethesda, MD, USA - https://brb.nci.nih.gov/BRB-ArrayTools/index.html). Sequences with more than 10% of MEC and NSG samples presenting undetectable expression (below background signal) were removed. The mean of the probes representing the same miRNA was used in the subsequent steps. miRNAs DE between MEC and NSG groups were identified with a p-value <0.05 (random variance t-test), false discovery rate (FDR) <0.05, and fold change (FC) ≥ 2 and ≤ -2. Supervised hierarchical clustering analysis was performed using 1-minus correlation distance and complete linkage (BRB array tools). Robustness of hierarchical clustering analyses was confirmed using pvclust package (R program) (Supplementary Figure S1). Data were deposited in the Gene Expression Omnibus (GEO) database with the accession number GSE199692.
Gene Expression Analysis
Array-based gene expression analysis was performed in 34 out of the 35 fresh-frozen MEC samples and five NSG; one MEC and one NGS sample were excluded based on inferior RNA quality (Table 1). Hybridizations were performed using Two-color SurePrint G3 Human Gene Expression Microarray 8x60K (G4851B, Agilent) platform, as previously described (27). Data processing and analyses were carried out using similar parameters described for miRNA profiling (BRB array tools). Identification of DE mRNAs (p-value < 0.001, FDR < 0.05, FC ≥ 2 and ≤ -2) and supervised hierarchical clustering analysis were performed as described above. Pvclust package (R program) was used to confirm the robustness of hierarchical clustering analyses (Supplementary Figure S1). The data were deposited in the GEO database (accession number GSE169754).
miRNA-mRNA Integrative Analysis
Target transcripts from the disrupted miRNAs were predicted using the miRWalk 2.0 tool (http://www.umm.uni-heidelberg.de/apps/zmf/mirwalk/), considering only the interactions predicted by at least three of four different bioinformatic algorithms (miRWalk, miRanda, RNAhybrid, and Targetscan). miRNA and mRNA expression data from 24 MEC samples tested by both procedures were integrated based on a significant negative correlation (Pearson correlation, p-value < 0.05) between predicted miRNA-mRNA interactions. Experimentally validated interactions were additionally obtained from the miRTarBase database (28).
Pathway Enrichment Analysis
Pathway enrichment analysis was performed with KOBAS 3.0 (http://kobas.cbi.pku.edu.cn) and pathDIP (http://ophid.utoronto.ca/pathDIP) tools, comprising PANTHER, Reactome, and KEGG databases. Default parameters were adopted in KOBAS 3.0, and only experimentally detected protein-protein interactions were considered in PathDIP. The threshold used in both in silico tools was defined as p-value < 0.001 (hypergeometric test) and adjuscted p-value < 0.05 (Benjamini and Hochberg method).
Cell Line Culture
Human Mucoepidermoid Carcinoma (UM-HMC-2) cells were isolated from the intermediate grade (stage IVb) parotid gland MEC of a 59-year-old Caucasian female and cultured according to Warner et al. (29).
CRISPR/Cas9-Mediated Knockout of miRNA-22 and miR-205
miRNA-22 and miR-205 expression in UM-HMC-2 was confirmed using qRT-PCR (data not shown). Then, UM-HMC-2 cells were transfected with pSpCas9(BB)-2A-GF (PX458 expression vector, Addgene plasmid # 48138) expressing CRISPR-Cas9 and sgRNA targeting either miR-22 or miR-205 using Fugene HD transfection reagent (Promega, Madison, WI, USA). This resulted in transient expression of Cas9-sgRNA. Cells transfected with an empty plasmid were used as a control. After 72 hours, cells were sorted for GFP (Green fluorescent protein) positive population using a Sony SH800 cell sorter (Sony Biotechnology, San Jose, CA, USA), and were cloned as single cells per well in a flat bottom 96-well plate. Successfully expanded clones were then screened by capillary sequencing to detect nonhomologous end-joining CRISPR-Cas9 induced gene editing. Clones with predicted out of frame insertions and deletions (indels) were selected and expanded. The predicted effect of the CRISPR editing on miRNAs was assessed using the TIDE tool (30). Details of all sgRNAs and primers used in the experiments, as well as the CRISPR knockout efficiency, are summarized in the supplementary information (Supplementary Figure S2A and Supplementary Table S1).
qRT-PCR for miRNA
In addition to sequencing, CRISPR knockout of miR-22 and miR-205 was confirmed using qRT-PCR. The miRNA was extracted with miRNeasy Tissue/Cell Advanced Mini Kit (Qiagen, Hilden, Germany) and transcripted to cDNA using miScript II RT Kit (Qiagen) following manufacturer’s instructions. The miScript universal primer and miRNA-specific primers for Hsa-miR-22-3p (MS00003220) and hsa-miR-205-5p (MS00003780) were purchased from Qiagen. The relative quantitative expressions were normalized to the endogenous control human RNU-6 (MS00033740) purchased also from Qiagen. Quantitative real-time PCR was performed on Applied Biosystems QuantStudio 5 Real-Time PCR System. qRT-PCR results are summarized in the supplementary information (Supplementary Figure S2B).
qRT-PCR for mRNA
In order to study the effect of miR-knockouts, 11 genes were selected and evaluated by qRT-PCR: PTEN, LAMC1, CADM1, HER3, MYCBP, SNAI1, YAP1, CD147, SMAD4, ESR1 (ESR1) and ZEB2. One thousand ng of the total RNA was used for cDNA synthesis. Synthesis was done using iScript cDNA Synthesis Kit (Bio-Rad Laboratories, Hercules, CA, USA) according to the manufacturer’s instructions. Two nanograms of cDNA was used for performing qRT-PCR with the Fast SYBR Green Master Mix (Thermo Fisher Scientific) as per the manufacturer’s instructions. The relative quantitative expression was normalized to the endogenous control GAPDH. The primers were purchased from Metabion (Planegg, Germany) and the sequences are summarized in the supplementary information (Supplementary Table S1). Quantitative real-time PCR was performed on Applied Biosystems QuantStudio 5 Real-Time PCR System.
Cell Viability Assay
A CellTiter-Glo (CTG) 2.0 Luminescent Cell Viability Assay (Promega, Madison, WI, USA) was used to determine the effect of miR-22 and miR-205 on the cells’ viability. Briefly, 100 μL of cell suspension was dispensed in the Perkin Elmer ViewPlate-96 microplate with a clear flat bottom and black well walls (Perkin Elmer Inc., Waltham, MA, USA) for a final concentration of 1000 cells per well. After 72 hours, 100 μL of the CellTiter-Glo reagent was dispensed into the wells, and the luminescence reads were measured using a PHERAstar plate reader (BMG Labtech, Ortenberg, Germany).
Scratch Wound Cell Migration and Invasion Assays
IncuCyte 96-well ImageLock Microplate wells (Sartorius, Göttingen, Germany) were coated with 300 μg/mL Myogel for migration and invasion assays (31). The cells were seeded at a density of 25,000 cells per well in 100 μL of complete medium for both assays. After 24 hours at 37°C, a 96-pin IncuCyte WoundMaker Tool (Sartorius) was used to make uniform wounds on the confluent monolayer of the cell. The wells were washed two times with media, and 100 μL of complete medium was added. For the invasion plate, 50 μL of Myogel-collagen gel (2.4 mg/mL Myogel, 0.8 mg/mL type I rat tail collagen) (Corning Incorporated, Corning, NY, USA) was added on top of the cells. After the gel was solidified, 50 μL of media was added, and the plates were transferred to an incubator. The wound closing was monitored automatically every 2 hours for two days using IncuCyte S3 Live-Cell Imaging System (Sartorius). Analysis of wound closing (width of the wound) was performed using Matlab. Mathematical function decorrelation was used to make the cells’ intensity substantially higher than the background.
Spheroid Invasion Assay
The spheroid invasion assay was done according to Naakka et al. (32). The UM-HMC-2 cells were seeded at a concentration of 1000 cells per well in 50 µL of the complete medium using a U-shaped ultra-low attachment 96-well plate (Corning, New York, USA) and incubated for four days. Next, the spheroids were embedded in 50 μL Myogel-fibrin gel containing 0.5 mg/mL Myogel, 0.3 U/mL thrombin (Sigma-Aldrich), 33.3 mg/mL aprotinin (Sigma-Aldrich), and 0.5 mg/mL fibrinogen (Merck). After the Myogel-fibrin matrix (30 min) solidification, 100 μL of complete medium was added to the wells.
Images of the spheroids were captured daily using Nikon Eclipse TS100 Inverted Microscope (Nikon, Minato, Tokyo, Japan) at 4x magnification. Analysis of the spheroid invasion area and length of the longest branch was performed using ilastik (freeware) and Fiji ImageJ 1.51 software (33).
Statistical Analysis
All in vitro assays were repeated at least three times, each performed at least in triplicate. Statistical analyses were carried out with SPSS v.25.0 (IBM Corporation, Chicago, IL, USA) and the GraphPad Prism software (v. 6.0; GraphPad Software Inc., La Jolla, CA, USA). Student’s T-test or One-way ANOVA followed by Bonferroni correction was used in posthoc analysis. A p-value < 0.05 was considered as statistically significant. Figures were created with Origin 2018b graphing software (OriginLab Corporation, Northampton, MA, USA).
Overall survival analysis was performed using the Kaplan-Meier estimator with the log-rank test in IBM SPSS Statistics for Windows, Version 25.0 (IBM Corp. Armonk, NY, USA). The miRNA expression values were dichotomized below and above the median (p-value < 0.05). A random variance t-test using BRB ArrayTools software (v. 4.4.0) was applied to investigate differences in the miRNA expression in relation to the histological grade, lymph node, and distant metastasis (p-value < 0.05, FDR < 0.05).
Results
The mean age of whole patient group was 46.9 ± 20.2 years (range 12 to 82 years old). Female patients were more frequently affected by MEC than males (ratio 1.4:1). Parotid was the most common anatomical site, followed by minor salivary glands of the palate and other sites. Twenty cases presented with low histologic grade, seven with intermediate-grade, and nine with high-grade at diagnosis. T3-T4 tumors at diagnosis were found in 14 cases. Six patients presented lymph node involvement at diagnosis and three patients presented distant metastases at diagnosis. Twenty patients were treated with surgery and radiotherapy, while 14 received surgery only. Follow-up time ranged from 4 to 188 months (median 49,5 months). Demographic, clinical, histopathological, therapeutic and follow-up features are detailed in Table 1. The study design, methodologies, and the foremost results are presented in Figure 1.
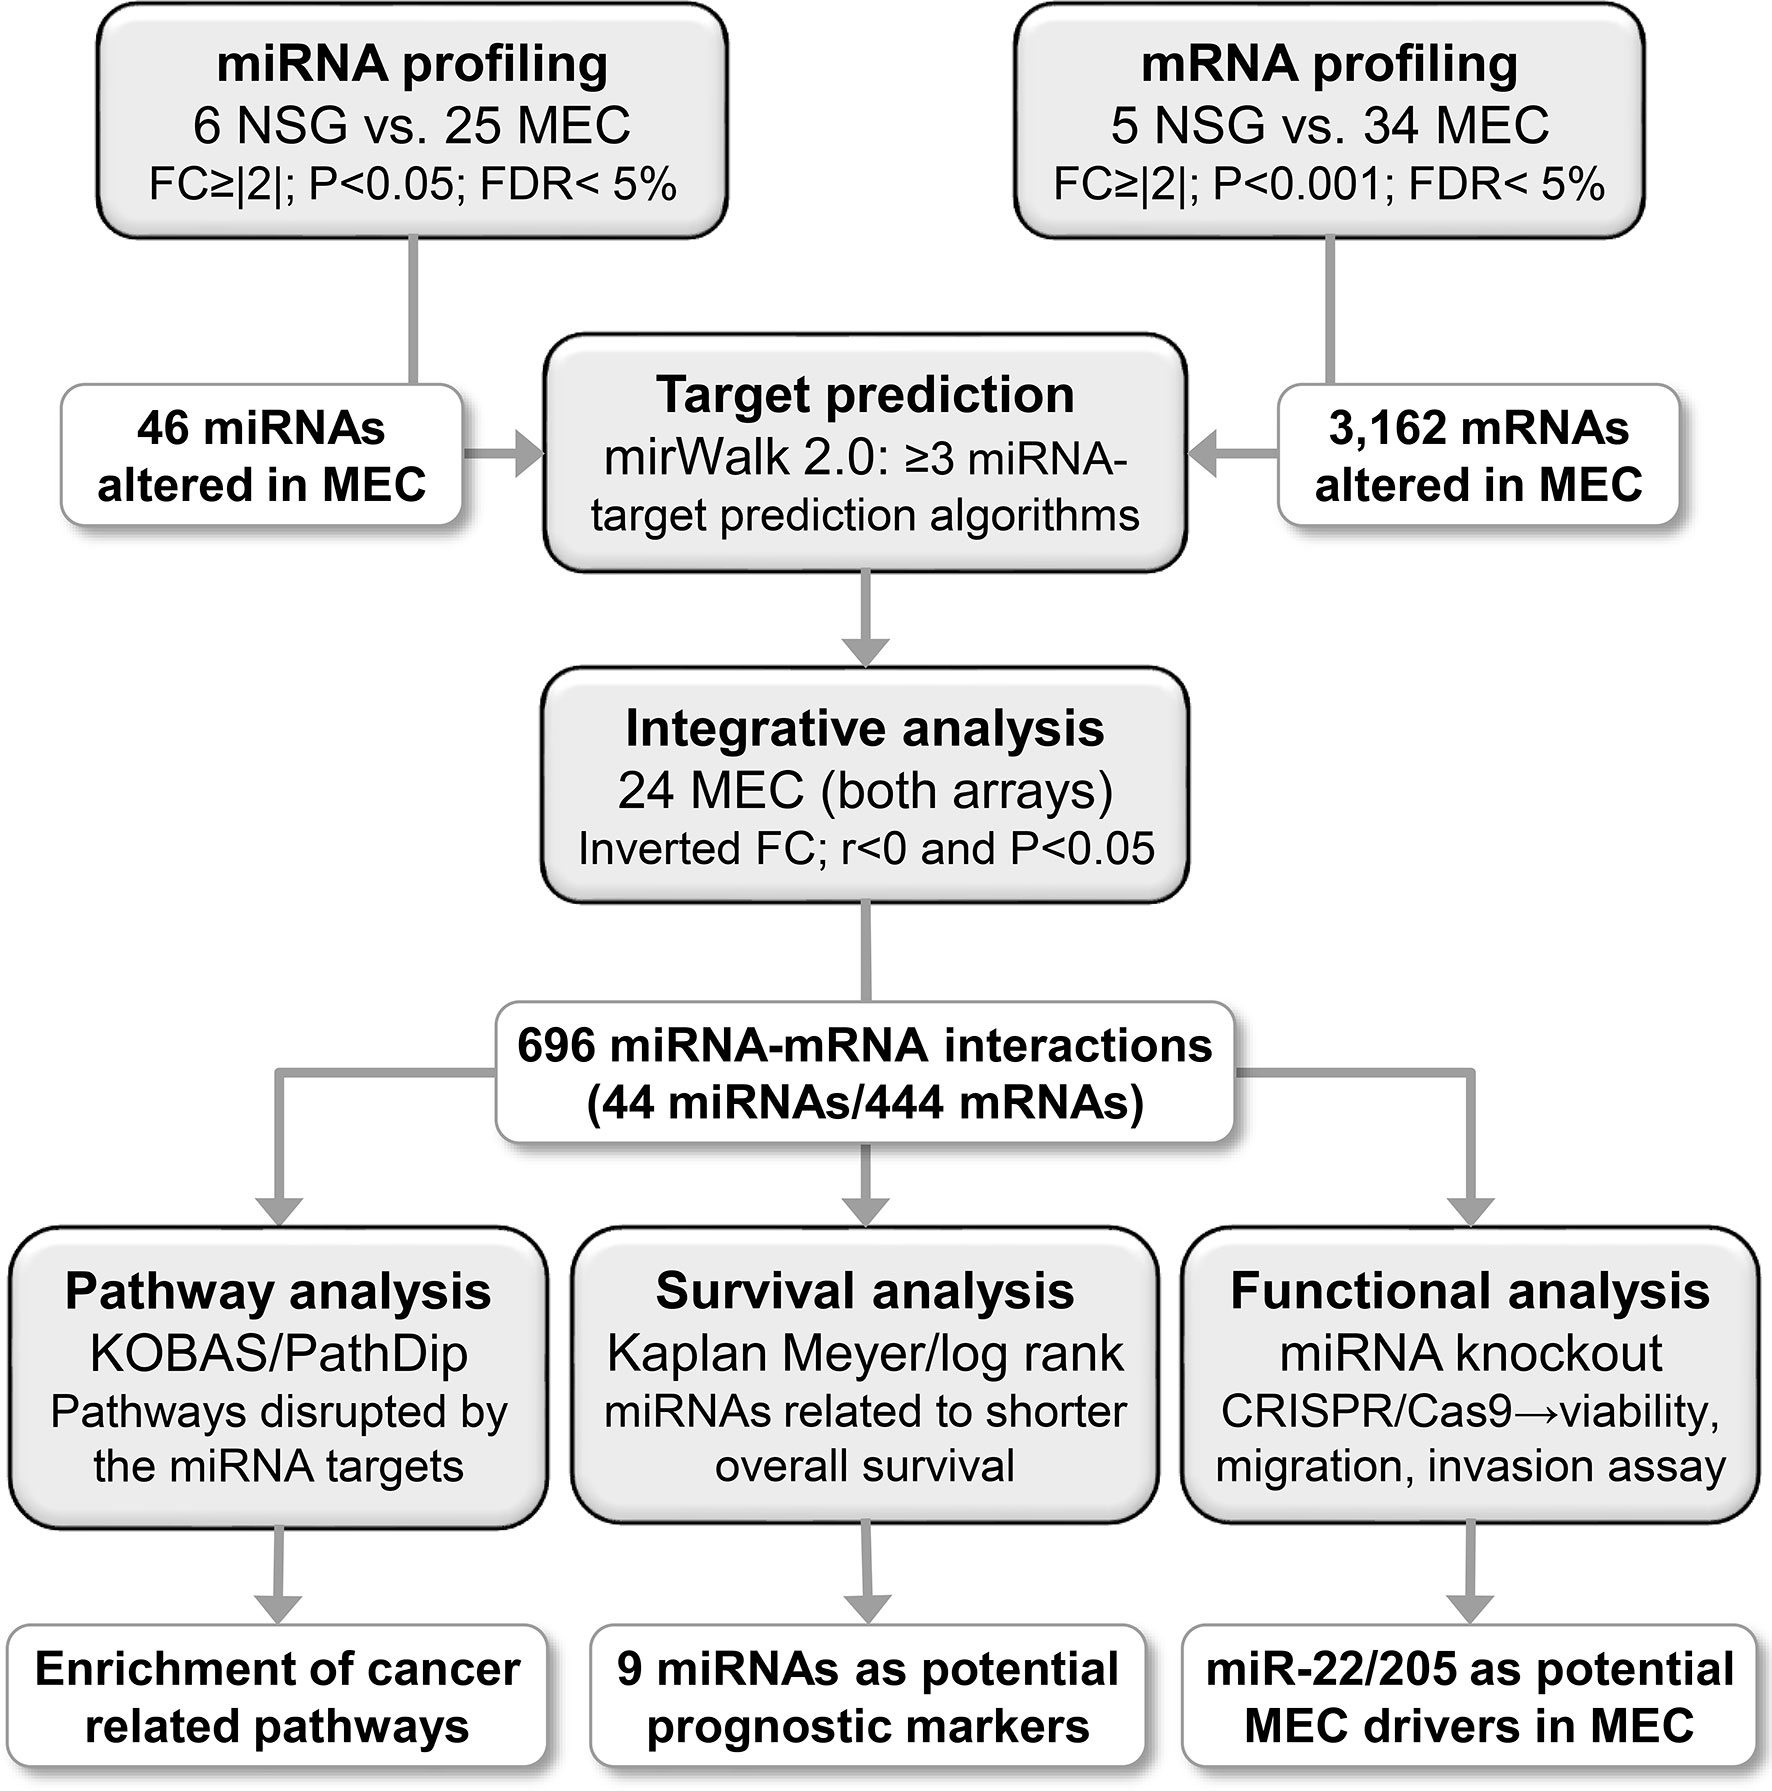
Figure 1 Study design and main results obtained from the miRNA and mRNA expression analyses. First, a miRNA and mRNA global expression analyses revealed 46 miRNAs and 3,162 mRNAs differentially expressed in MEC compared to SNG. An integrative analysis was carried out using predicted miRNA-mRNA interactions, generating a network containing 44 miRNAs and 444 mRNAs (696 interactions). The target genes were associated with cancer-related pathways, and nine miRNAs were associated with shorter overall survival. A knockout assay was performed for miR-22 and miR-205 (CRISPR/Cas9), resulting in viability, migration, and invasion reduction, which indicate their role as putative cancer drivers in MEC.
miRNA and mRNA Expression Profile of MEC
After excluding uniformly low expressed miRNAs in MEC and NSG samples, 530 miRNAs and 19,911 mRNAs were considered for further analysis. We found 46 DE miRNAs (18 overexpressed and 28 underexpressed) in MEC (Supplementary Table S2). The most significant (P adjusted ≤ 0.005) overexpressed miRNAs included miR-21-5p (FC=10.2), miR-22-3p (FC=2.0), miR-181a-5p (FC=2.9), miR-205-3p (FC=14.7), and miR-224-3p (FC=5.3). The miR-363-3p (FC =-16.3), miR-625-5p (FC =-18.5), miR-885-5p (FC =-10.7), miR-892b (FC =-2.7), and miR-1288-3p (FC =-2.7) were significantly underexpressed (Figure 2). A similar approach used for mRNAs unveiled 3,162 mRNAs differentially expressed in MEC (1,488 overexpressed and 1,674 underexpressed (Supplementary Table S3).
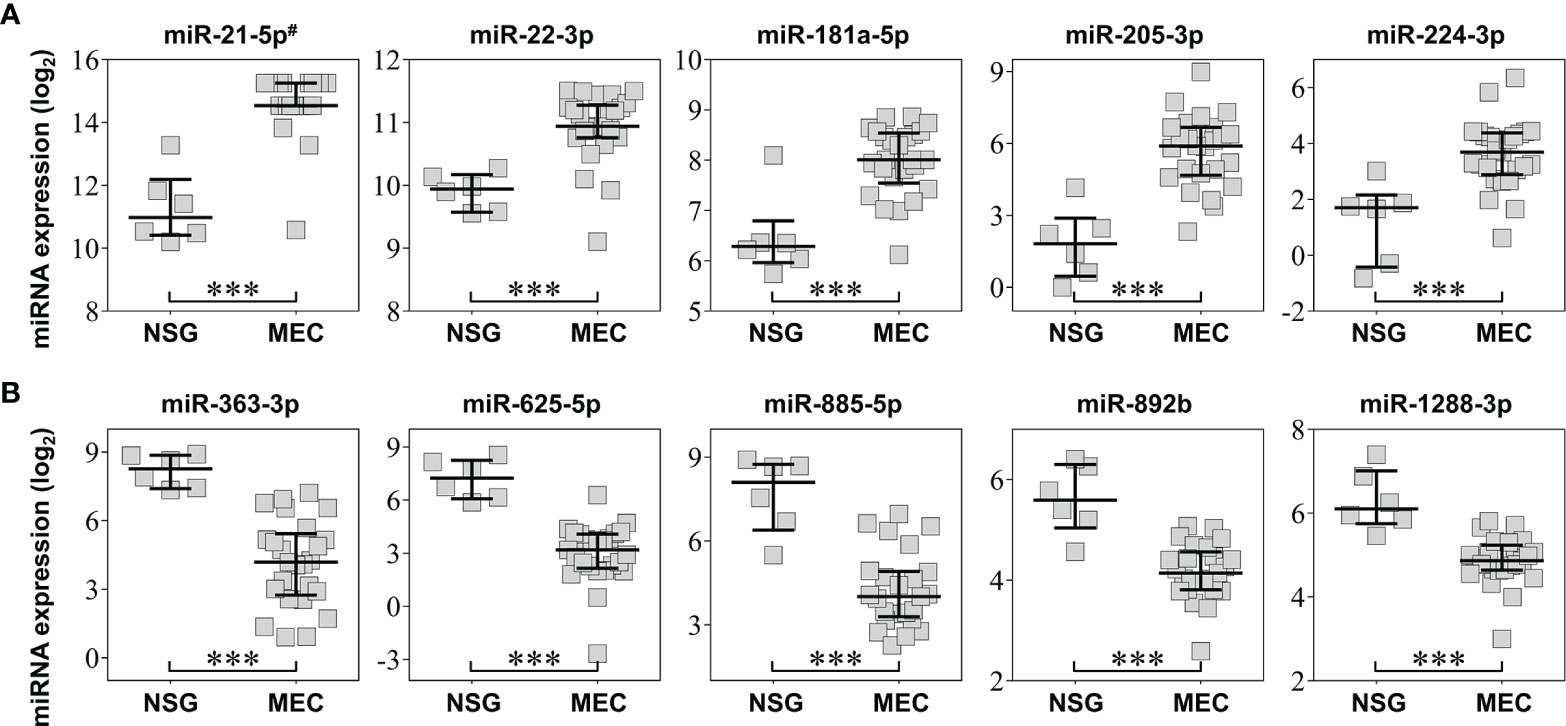
Figure 2 Top five most significant overexpressed (A) and underexpressed (B) miRNAs obtained in the microarray analysis. The error bars and middle line represent the interquartile range and median, respectively. NSG: surrounding normal salivary gland tissues; MEC: mucoepidermoid carcinoma tissues. #miR-21-3p was omitted (both mature sequence from miR-21 precursor were highly significant). ***P < 0.001 (t test).
Supervised hierarchical clustering analysis based on the DE transcripts revealed two clusters in both miRNA (Figure 3A) and mRNA (Figure 3B). Although these two main clusters completely separated MEC from NSG samples, no association was observed when comparing the clinical-pathological parameters (histological grade, lymph node involvement, and distant metastasis) with the clusters generated by both miRNA and mRNA analysis.

Figure 3 Supervised hierarchical clustering analysis considering the miRNA (A) and mRNA (B) expression profiles. The dendrograms show a complete separation between MEC and NSG samples according to the 47 miRNAs (A) and 3,162 mRNA differentially expressed (B). The samples are represented in columns and miRNAs/genes in rows.
The miRNA-target prediction analysis resulted in 20,816 miRNA-mRNA putative interactions. The integrative analysis revealed a miRNA-mRNA network comprising 696 negatively correlated interactions and inverted FCs (44 miRNAs and 444 mRNAs) (Supplementary Table S4). The main biological pathways uncovered by miRNA targets corroborated by the integrative analysis were cell signaling, cell cycle, and cancer-related pathways (Table 2).
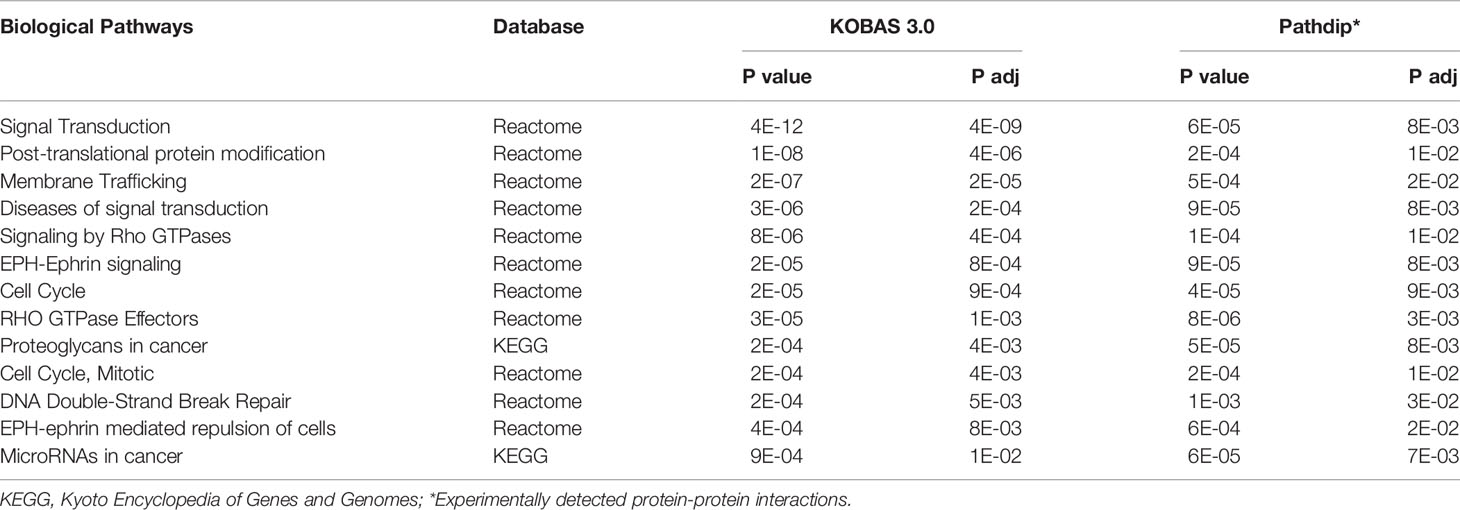
Table 2 Biological pathways enriched (P value < 0.001 and P adjusted < 0.05) by the genes detected in the miRNA-mRNA integrative analysis (KOBAS 3.0 and Pathdip in silico pathway tools).
Lower expression levels of miR-582-5p, miR-3125, and miR-4324 were found in high-grade MEC compared to low and intermediate grades (Supplementary Figure S3). Increased expression levels of miR-205-5p and miR-224-5p (both overexpressed in MEC) and decreased expression levels of miR-139-3p, miR-145-3p, miR-148a-3p, miR-186-5p, miR-338-3p, miR-363-3p and miR-4324 were significantly related to worse overall survival in MEC patients (Figure 4).
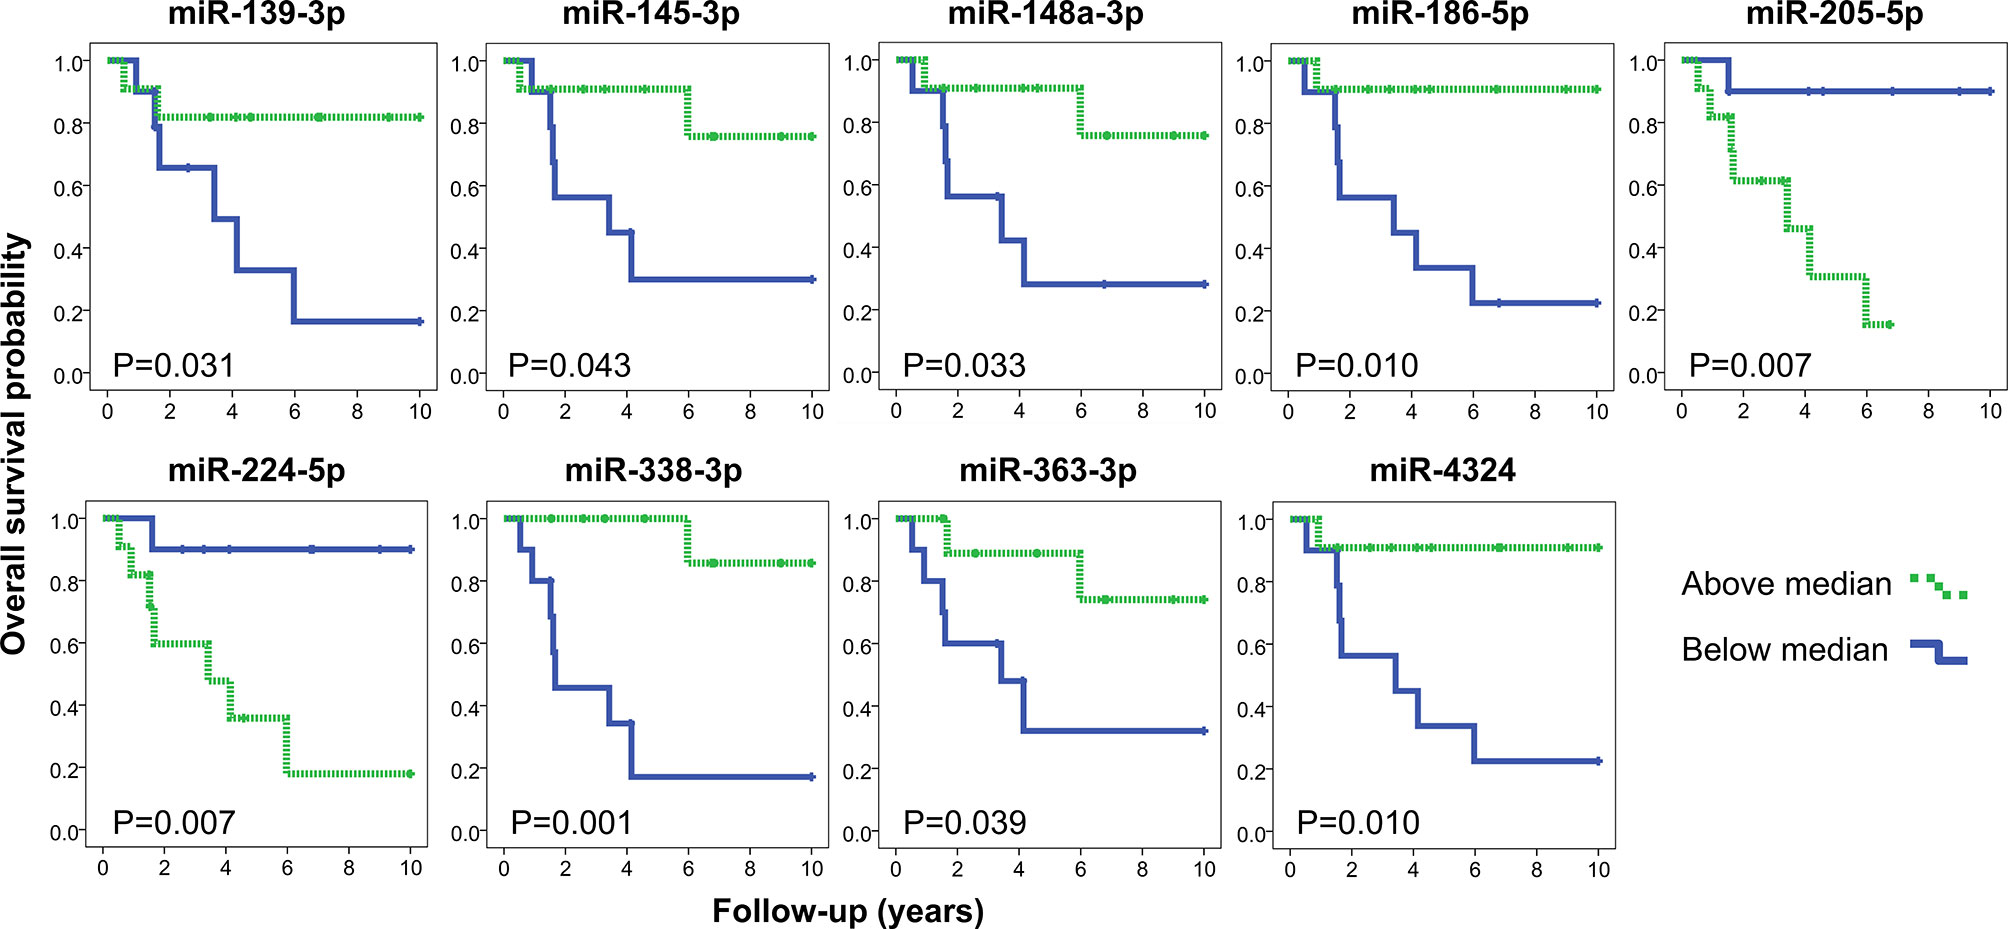
Figure 4 Kaplan-Meier representation of overall survival according to the expression levels of nine miRNAs (log rank test P<0.05). The quantifications obtained by the microarray analysis were stratified in below (blue) and above (green) the median values. Note: miR-224-3p was omitted (both mature sequences from mir-224 precursor were associated with overall survival).
Among the list of differentially expressed miRNAs, we selected miR-22 and miR-205 for functional assays for the following reasons: they were significantly overexpressed (adjuscted p-value <0.005) (Figure 2), presented high interactivity in the integrative analysis (>10 underexpressed mRNA predicted targets negatively correlated with the miRNA expression) (Supplementary Table S4), and showed clinical association with worse prognosis (increased miR-205 expression was associated with shorter overall survival) (Figure 4).
Knockout of miR-205 Decreases MEC Cell Viability While the Knockout of miR-22 Reduces MEC Cell Migration and Invasion
We explored the use of the CRISPR-Cas9-based method to knockout miR-22 and miR-205 in MEC. Cell viability, migration, and invasion assays were performed in the MEC cell line UM-HMC-2. The cell viability was the lowest in the miR-205 knockout, followed by miR-22-knockout cells, but with no statistical significance (Figure 5A).
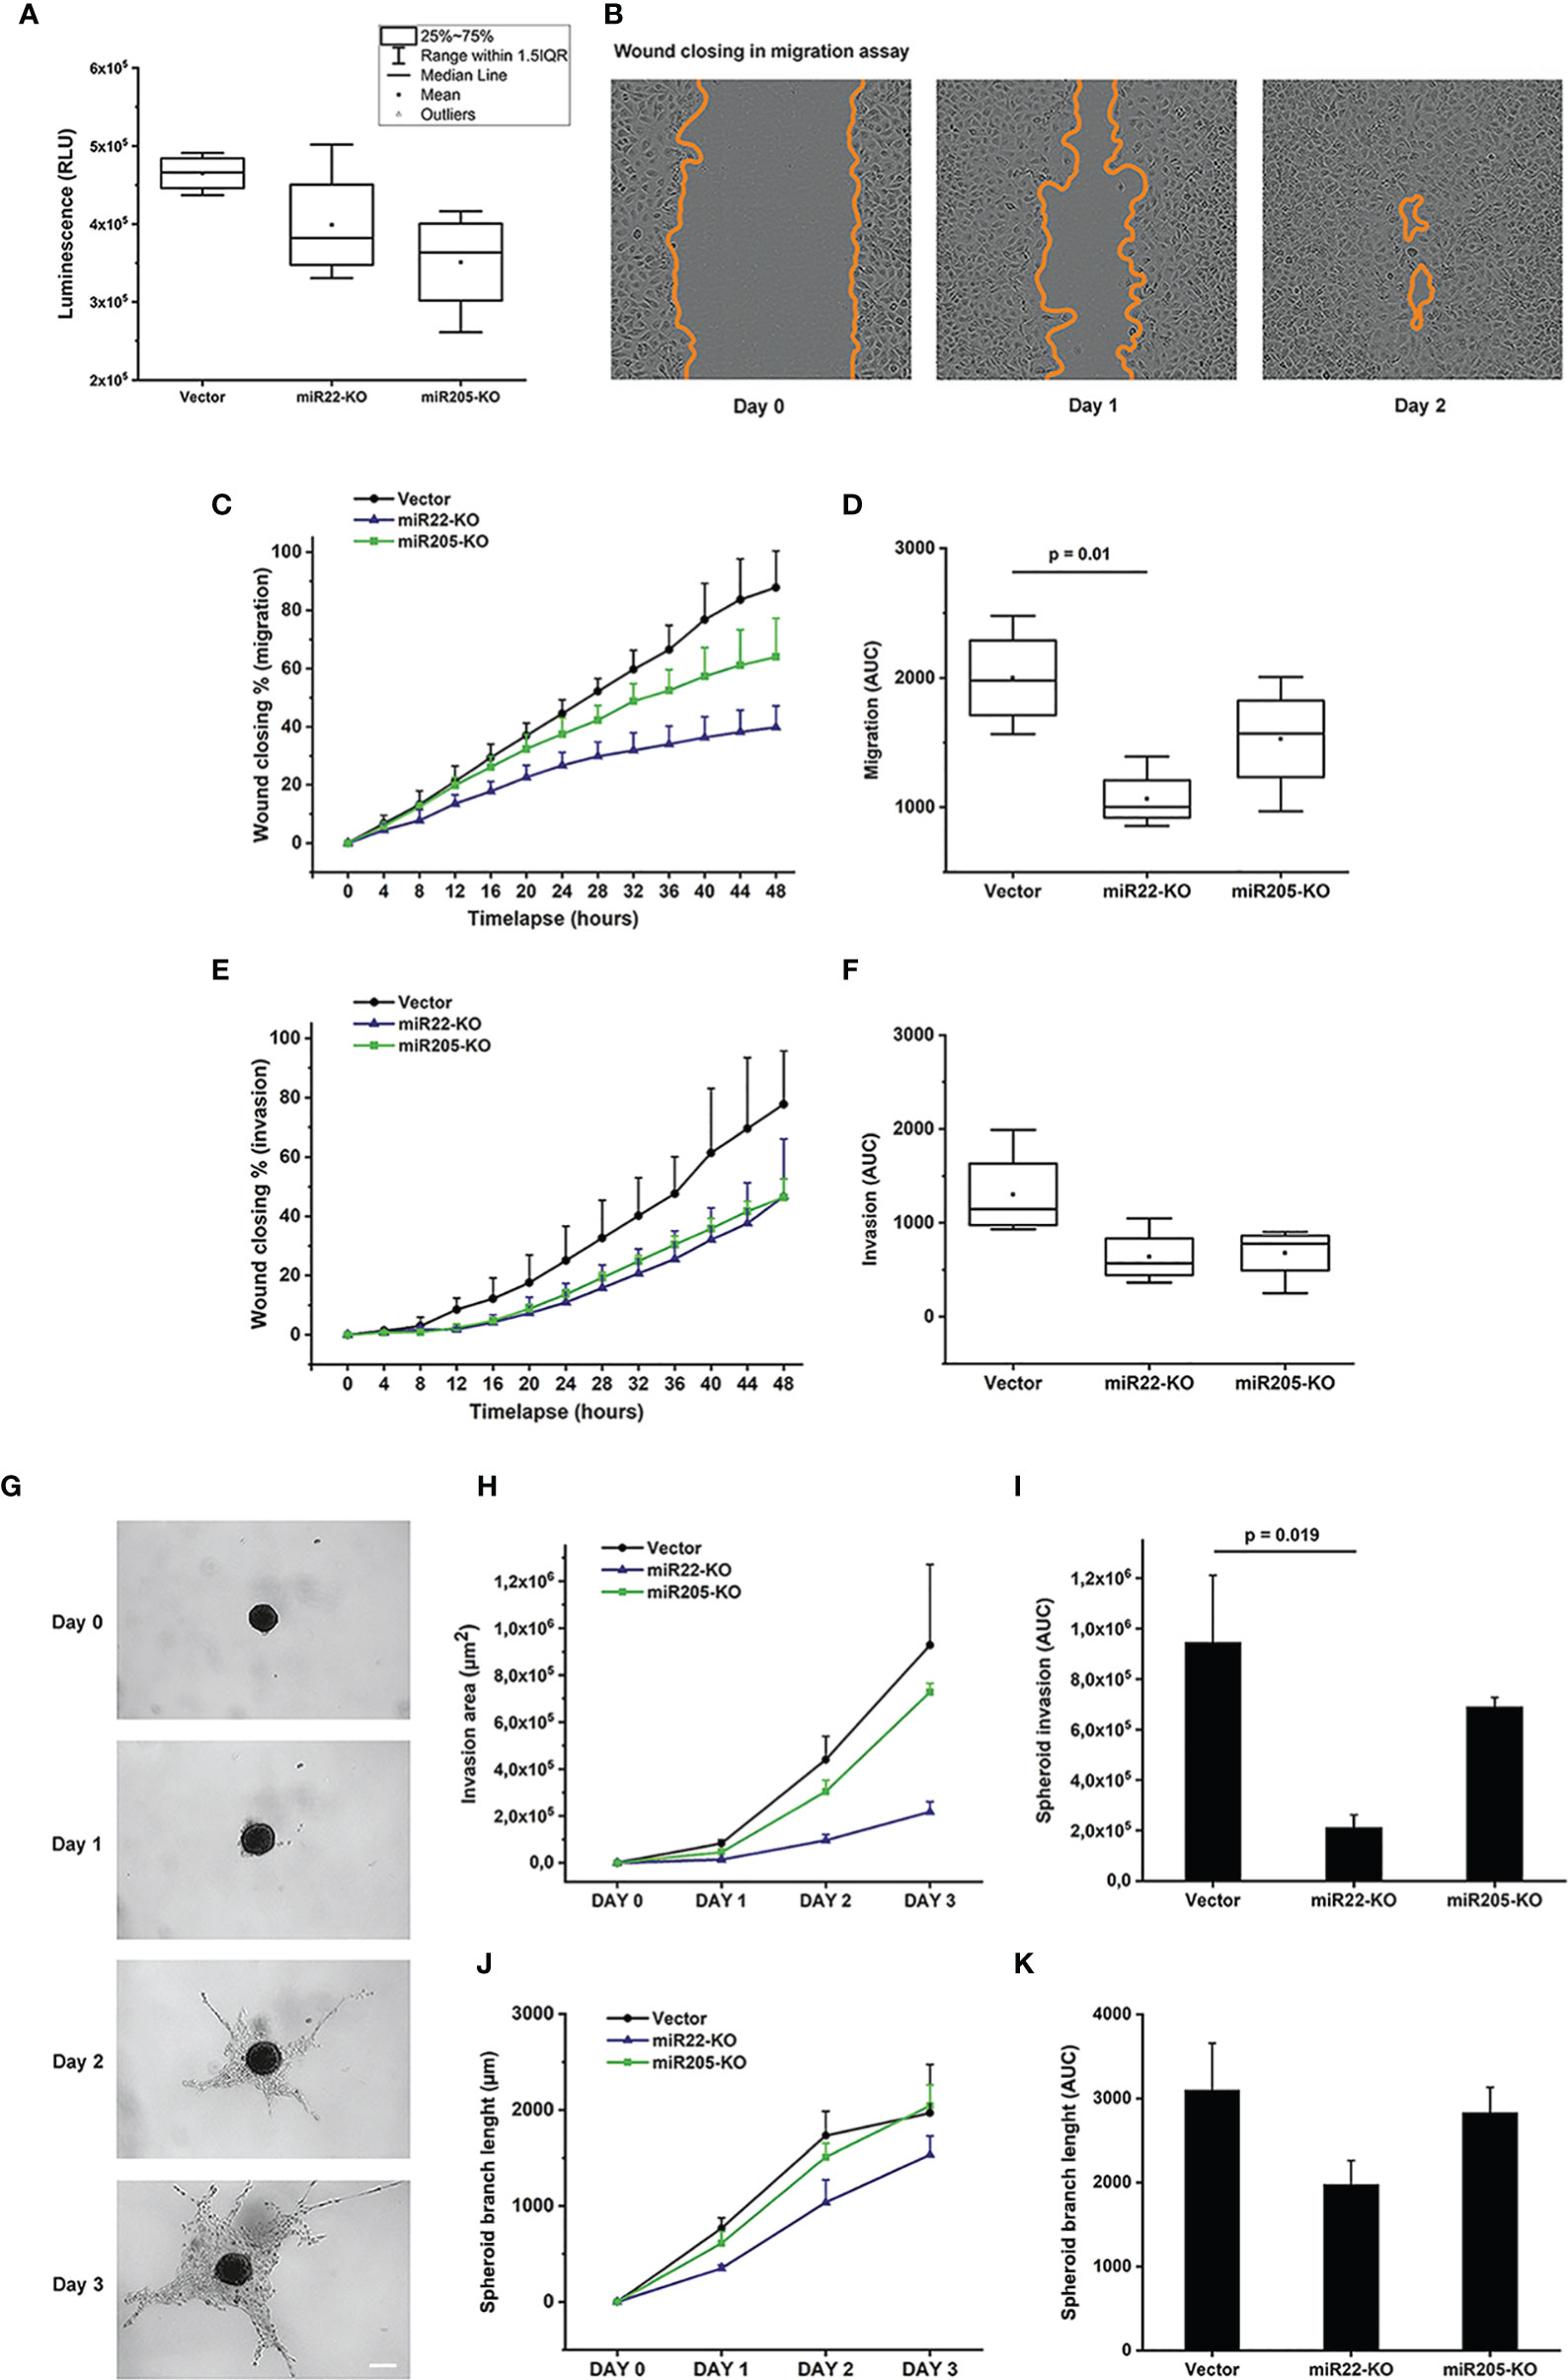
Figure 5 Cell viability, migration and invasion assays performed using the UM-HMC-2 cell line. (A) UM-HMC-2 cells were cultured for three days and the cell viability was measured using luminescent cell viability assay. Although not statistically significant, the cell viability was decreased in both miR22- and miR205-knockout cell lines compared to the cell line transfected with an empty plasmid vector. (B–D) UM-HMC-2 cells were cultured on Myogel matrix and cell migration was evaluated using scratch wound cell migration assay. (B) Representative image of migration distance at 0, 24, and 48 hours after wounding. (C, D) Quantification of cell migration in scratch wound assay. miR22- and miR205-knockout cell lines migrated slower than the vector cell line. Statistically significant difference was denoted between vector and miR22-KO cell lines. (E, F) UM-HMC-2 cell invasion through Myogel-collagen in scratch wound cell invasion assay. UM-HMC-2 cells were cultured in Myogel-collagen matrix, and cell invasion was evaluated using scratch wound cell invasion assay. miR22- and miR205-knockout cell lines invaded slower than vector cell line (p-value > 0.05). (G–K) UM-HMC-2 cell invasion through Myogel-fibrin in spheroid invasion assay. Cells were cultured in U-shaped ultra-low attachment 96-well plate wells and embedded in Myogel-fibrin matrix. Spheroids were observed under a light microscope and the invasion area and the spheroid branch length were analyzed using ilastik and ImageJ software. (G) Representative images of spheroid invasion at different time points. Scale bar = 200 μm (Original magnification X4). (H, I) Quantification of cell invasion in 3D spheroid invasion assay. Knockout of miR22 and miR205 reduced tumor cell invasion. Difference between vector and miR22-KO cell lines reached statistical significance. (J, K) Quantification of spheroid branch length revealed that miR22- and miR205-knockout cell line spheroids did not extend as far as vector cell line (p-value > 0.05). Data are presented as means ± SD of 3-4 independent experiments, each at least in triplicate. p < 0.05 is considered as significantly different compared to vector control.
The scratch wound migration assay showed that miR-22 and miR-205 knockouts reduced cell migration. The effect was the same in both knockout cell lines compared to the empty vector, but miR-22-knockout cells migrated significantly slower than the control cells (Figures 5B–D and Supplementary Figure S4A). The cell lines showed different invasion speeds, and the knockouts invaded slower in both scratch wound invasion (Figures 5E–F and Supplementary Figure S4A) and spheroid invasion assays (Figures 5G–K and Supplementary Figure S4B). Both miR-22 and miR-205 knockout cell lines invaded slower than the cell line with empty gRNA vectors. However, the effect was statistically significant only when miR-22-knockout cells were compared to the empty vector in the spheroid invasion assay.
Knockout of miR-22 Induces ESR1 and Knockout of miR-205 Induces ZEB2 Expression
In order to understand the mechanism behind the effect of miR-22 and miR-205 knockout on MEC cell behaviour, we studied the expression of specific molecules: PTEN, LAMC1, CADM1, HER3, MYCBP, SNAI1, YAP1, CD147, SMAD4, ESR1 and ZEB2 which, based on the literature, are known to be targets either for miR-22 or miR-205. We reported significant differences in two of the targets: estrogen receptor alpha (ESR1) for miR-22 and zinc finger E-box-binding homeobox 2 (ZEB2) and miR-205 (Figure 6). These molecules influence cell proliferation, migration and invasion (34–36). As expected, miR-22 knockout cells have significantly higher expression of ESR1, and miR-205 knockout cells have significantly higher expression of ZEB2 compared with the empty vector.
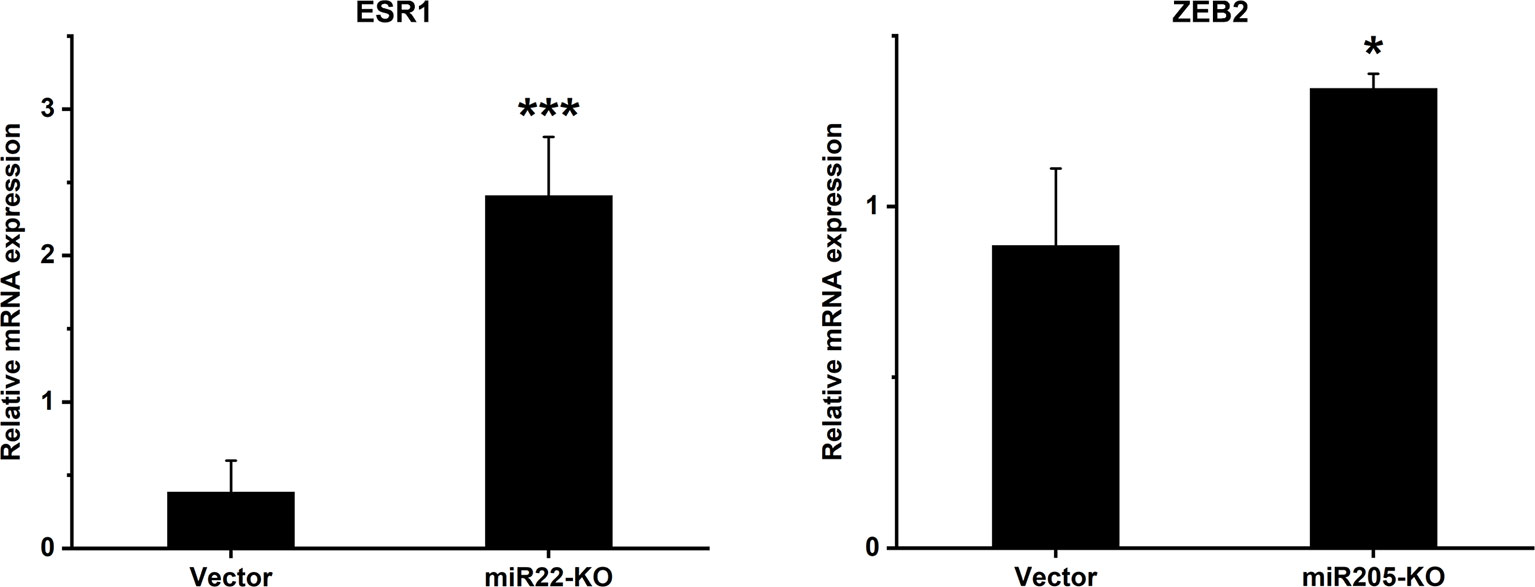
Figure 6 mRNA expression levels of selected genes after miR-knockout. Expression levels of ESR1 in miR22-KO and ZEB2 in miR205-KO cell lines were analysed using qRT-PCR. The relative mRNA levels are shown after normalization to GAPDH. ESR1, Estrogen receptor alpha; ZEB2, Zinc finger E-box binding homeobox 2. Data are presented as means ± SD. *p ≤ 0.05, *** ≤ 0.001.
Discussion
Varied clinical behavior and multiple histologic grading systems have challenged pathologists in prognostication of MEC and clinicians in making an appropriate treatment decision for the patients (37). Moreover, the differential diagnosis between a salivary gland MEC and other lesions, such as salivary duct cyst, cystadenoma, or glandular odontogenic cyst may be difficult in some situations. In particular, small incisional biopsies are often problematic in the diagnostic workup. The presence of the CRTC1-MAML2 fusion gene can be helpful for the diagnosis of MEC, but it is not found in all cases of MEC, and there is contradiction about some benign conditions (38–40). Mucoepidermoid carcinomas of the salivary gland are poorly explored at the molecular level. Therefore, genetic studies can unravel diagnostic, prognostic, and predictive markers, as reported in several tumor types.
In the present study using large-scale expression analyses, we found 46 miRNAs and 3,162 mRNAs differentially expressed compared to normal salivary glands. In agreement with our present miRNA findings, a previous MEC study reported that miRNA-205 and miRNA-22 were amongst the highest overexpressed miRNAs in MEC, while miRNA-885-5p and miRNA-375 were downregulated (26).
Two earlier studies have investigated global gene expression in MEC (22, 23), but none of the genes reported were found in our analysis. A possible explanation for this discordance may be the small number of MEC cases (2 and 6) investigated in the earlier studies and/or the different methodological strategies. For instance, Leivo et al. (22) focused on comparing different histological types of salivary gland malignancies, which might explain the disparities compared with our findings.
Although we could not investigate the CRTC1-MAML2 status in our sample set due to a lack of sample material, we observed a decreased CRTC1 expression level. In MEC, the CRTC1-MAML2 gene fusion activates CREB/Cyclic AMP related genes and possibly the Notch pathway (11, 41–45). Recently, Chen et al. (2021) (46) suggested that deregulated p16-CDK4/6-RB signaling is a cooperating event in the progression of MEC with the CRTC1-MAML2 fusion. The authors also suggested that EGFR and CDK4/6 inhibitors are potentially useful to treat MEC patients.
An integrative analysis was conducted to elucidate the role of miRNAs and their mRNA targets and the core genes and pathways involved in MEC. We found 669 miRNA-mRNA interactions (44 miRNAs and 444 mRNAs) involving cancer-related pathways such as miRNAs in cancer, cell cycle and signal transduction, ERK/MAPK signaling, EIF2 signaling, PI3K/AKT, among others. These findings provide supportive evidence for the detection of drivers involved in MEC pathogenesis. A set of these transcripts was associated with poor prognostic features, such as high histological grade. For instance, a decreased expression of miR-582-5p in MEC was related to high-grade tumors. Previously, miRNA-582-5p downregulation was described in salivary gland tumors (47, 48), and its induction inhibited invasion and migration in salivary adenoid cystic carcinoma (AdCC) (48). We found that the target of this miRNA, EZH2, was overexpressed and related to high-grade MEC (Supplementary Table S4 and Supplementary Figure S3). EZH2 is a member of the polycomb group of proteins involved with transcription regulation through chromatin remodeling (49). Increased EZH2 protein expression has been reported in MEC, myoepithelial carcinoma of salivary glands, and AdCC (50–52). In AdCC, increased EZH2 expression was associated with a worse prognosis.
Significantly decreased miR-4324 expression was detected in our high-grade MEC compared to low/intermediate-grade tumors, and it was also associated with shorter overall survival. miR-4324 has been shown to be underexpressed in a subset of PTEN deficient breast cancer patients with exceedingly poor prognoses (53). PIK3CA and PTEN inactivating mutations are frequent events in high-grade MEC (54). Interestingly, a highly predicted interaction between miR-205-3p and PLAC8 from the PI3K pathway was observed in our integrative analysis. A recent study demonstrated that PLAC8 contributes to cell proliferation and suppresses cell apoptosis in breast cancer by activating the PI3K/AKT/NF-κB pathway (55).
Based on established criteria, including increased expression levels, high interactivity in the integrative analysis, and association with clinical parameters, we selected two miRNAs, miR-205 and miR-22, for functional assays. These two miRNAs were among the highest overexpressed miRNAs in previously described MEC cases (26). miR-205 was one of the most significantly overexpressed miRNAs, and it was associated with shorter overall survival in our MEC cases. Overexpression of this miRNA has been reported in several cancers, including AdCC and head and neck squamous cell carcinomas (56–58). A previous study suggested that miR-205-5p targets PTEN to regulate the epithelial mesenchymal transition through the PI3K/AKT pathway (58).
Since miR-22 was one of the highest overexpressed miRNAs in MEC, it was selected for knockdown and functional experiments. Dysregulation of this miRNA has been reported in several tumor types (59) and implicated in the regulation of cell growth, cell cycle, apoptosis, and invasion (60, 61). MYC and PI3K/AKT can induce miR-22 gene expression, which in turn targets PTEN (62). Since PTEN is a repressor of AKT, miR-22 could act as a key element in a positive feedback of the PI3K/AKT pathway to cause downregulation of PTEN (59). As previously described in MEC (13), this miRNA also induces chromosomal instability (63). Knockdown of miR-22 showed a consistent reduction of viability, migration, and invasion of MEC cells. However, the effect on migration and invasion was stronger and seems not to be as a result of reduced viability which was only mild and not significant.
Previous studies have reported that miR-22 represses ESR1 expression in breast cancer and lead to a reduction in estrogen signaling (34). In line with that, we showed that the miRNA-22 knockout increased ESR1 expression levels. ZEB2 was reported to negatively correlate with miR-205 levels in esophageal squamous cell carcinoma cells (35) and silencing of ZEB2 lead to suppressed cell viability, migration, and invasion in laryngeal squamous cell carcinoma cells (36). Our data showed an upregulation of ZEB2 in miR-205-knockout cells which is in line with the reports above. Additionally, ZEB2 has been shown to directly bind to the E-cadherin promoter and repress its transcription (64). Loss of E-cadherin is one of the main initiation events of epithelial to mesenchymal transition (EMT) and thus plays an important role in cancer progression. The biological mechanism behind these actions remains to be elucidated in future studies.
Conclusion
Although we investigated a limited number of cases, we described a transcriptomic profile distinguishing MEC from normal salivary glands. The integrative analysis highlighted miRNA-mRNA interactions, and cancer-related pathways were described. Comparison with other studies using similar strategies was limited due to the absence of available miRNA-mRNAs expression data in public databases. However, our list of differentially expressed miRNAs-mRNAs revealed that PTEN and PI3K/AKT pathways were altered in MEC. Our in vitro functional assays indicate that miR-22 and miR-205 deficiencies reduce cell viability, migration, and invasion in a MEC cell line by enhancing the expression of ZEB2 and ESR1 mRNAs. Taken together, our findings suggest that these dysregulated miRNAs have a pathogenic role in MEC.
Data Availability Statement
The original contributions presented in the study are included in the article/Supplementary Material. Further inquiries can be directed to the corresponding author.
Ethics Statement
The studies involving human participants were reviewed and approved by The National Human Research Ethics Committee (Protocol #1.380.762/2015). Written informed consent to participate in this study was provided by the participants’ legal guardian/next of kin.
Author Contributions
Study concept and design: FP-S, TS, and SR. Data Acquisition: EN, MB-F, HK, KT, and AB. Quality control and data algorithms: MB-F, SA, FM, IS, and SL. Data analysis and interpretation: FP-S, EN, MB-F, and FM. Statistical analysis: MB-F, SA, FM, and IS. Manuscript preparation: FP-S and EN. Manuscript editing: EN, FP-S, TS, and SR. Manuscript review: CS-N, RC, LK, AM, VA, IL, TS, SR, and AA-S. All authors contributed to the article and approved the submitted version.
Funding
This work was supported by grants from Fundação de Amparo à Pesquisa do Estado de São Paulo - FAPESP (2012/10382-5) and (2013/04045-9), and Doctoral Programme in Clinical Research (KLTO), Faculty of Medicine, University of Helsinki, Finland; Sigrid Jusélius Foundation; the Cancer Society of Finland, Jane and Aatos Erkko Foundation, and Helsinki University Central Hospital research funds. SR acknowledges support from Research Council Lillebaelt Hospital, Denmark.
Conflict of Interest
The authors declare that the research was conducted in the absence of any commercial or financial relationships that could be construed as a potential conflict of interest.
Publisher’s Note
All claims expressed in this article are solely those of the authors and do not necessarily represent those of their affiliated organizations, or those of the publisher, the editors and the reviewers. Any product that may be evaluated in this article, or claim that may be made by its manufacturer, is not guaranteed or endorsed by the publisher.
Acknowledgments
The authors would like to acknowledge Barretos Cancer Hospital and A.C.Camargo Cancer Center, SP, Brazil, for providing human specimens. The authors acknowledge the FIMM Sequencing Unit, Institute for Molecular Medicine Finland and DDCB core facility (FIMM High Throughput Biomedicine Unit), University of Helsinki, for technical support and Biostatistics Unit, University of Helsinki, for their biostatistical assistance. We would like to thank Annamari Arpalahti and Tapio Flinck for their technical assistance, and Dr. Clovis Antonio Lopes Pinto and Dr. Claudia Malheiros Coutinho Camillo for their help with sample collection.
Supplementary Material
The Supplementary Material for this article can be found online at: https://www.frontiersin.org/articles/10.3389/fonc.2021.786150/full#supplementary-material
Supplementary Figure S1 | Bootstrap analysis to estimate the cluster stability. B = 1000 bootstraps conducted with pvclust package (R program).
Supplementary Figure S2 | (A) CRISPR knockout efficiency and indel spectrum. The predicted effect of the CRISPR-editing on miRNAs was assessed using TIDE online tool by The Netherlands Cancer Institute, Amsterdam, Netherlands (https://tide.nki.nl/). (B) qRT-PCR assay reveals down-regulation of miR-22-3p (p < 0.008) and miR-205-5p (p < 0.004) expression in knockout cells compared to vector control.
Supplementary Figure S3 | Differentially expressed miRNAs according to the histological grade. miR-582-5p (FC= -5.1; P=0.0001; FDR =0.0066), miR-4324 (FC= -3.7, P=0.0019, FDR=0.0305) and miR-3125 (FC=-2.1, P=0.0031, FDR=0.0305) were all underexpressed in high-grade mucoepidermoid salivary gland carcinoma compared to low/intermediate grade. ***P < 0.001, **P < 0.01 (t test).
Supplementary Figure S4 | UM-HMC-2 cell migration and invasion assays. (A) Representative images of UM-HMC-2 cell migration and invasion distance at 0, 24, and 48 hours in wound scratch wound assay. (B) Representative images of UM-HMC-2 cell invasion through Myogel-fibrin in spheroid invasion assay at different time points. Scale bar = 200 μm (original magnification X4).
Supplementary Table S1 | Primers used in this study. Oligonucleotide pairs for construction of gRNA expression plasmids, primer sequences used to amplify the target site before the Sanger sequencing and primers for target gene qRT-PCR (F, forward; R, reverse).
Supplementary Table S2 | Differentially expressed miRNA in salivary gland mucoepidermoid carcinoma (MEC) compared to normal salivary gland (NSG) tissues.
Supplementary Table S3 | Differentially expressed mRNAs in MEC compared to non-neoplastic salivary gland tissues (excel file).
Supplementary Table S4 | MicroRNA and target-mRNA interactions retrieved from the integrative analysis, comprising the transcripts differentially expressed in MEC (excel file).
References
1. Brandwein-Gensler M, Bell D, Inagaki H, Katabi N, Leivo I, Seethala R, et al. “Mucoepidemoid Carcinoma”. In: El-Naggar AK, Chan JKC, Grandis J, Takata T, Slootweg PJ, editors. WHO Classification of Head and Neck Tumors. (2017) Lyon: IARC Press. p. 163–4.
2. Aro K, Leivo I, Mäkitie AA. Management and Outcome of Patients With Mucoepidermoid Carcinoma of Major Salivary Gland Origin: A Single Institution’s 30-Year Experience. Laryngoscope (2008) 118:258–62. doi: 10.1097/MLG.0b013e31815a6b0b
3. Nance MA, Seethala RR, Wang Y, Chiosea SI, Myers EN, Johnson JT, et al. Treatment and Survival Outcomes Based on Histologic Grading in Patients With Head and Neck Mucoepidermoid Carcinoma. Cancer (2008) 113:2082–9. doi: 10.1002/cncr.23825
4. Auclair PL, Goode RK, Ellis GL. Mucoepidermoid Carcinoma of Intraoral Salivary Glands Evaluation and Application of Grading Criteria in 143 Cases. Cancer (1992) 69:2021–30. doi: 10.1002/1097-0142(19920415)69:8<2021::AID-CNCR2820690803>3.0.CO;2-7
5. Seethala RR. An Update on Grading of Salivary Gland Carcinomas. Head Neck Pathol (2009) 3:69–77. doi: 10.1007/s12105-009-0102-9
6. Brandwein MS, Ivanov K, Wallace DI, Hille JJ, Wang B, Fahmy A, et al. Mucoepidermoid Carcinoma: A Clinicopathologic Study of 80 Patients With Special Reference to Histological Grading. Am J Surg Pathol (2001) 25:835–45. doi: 10.1097/00000478-200107000-00001
7. Lau VH, Aoaud R, Farwell G, Donald PJ, Chen AM. Patterns of Nodal Involvement for Clinically N0 Saliavry Gland Carcinoma: Refining the Role of Elective Neck Irradiation. Head Neck (2014) 36:1435–9. doi: 10.1002/HED.23467
8. Moss WJ, Coffey CS, Brumund KT, Weisman RA. What is the Role of Elective Neck Dissection in Low-, Intermediate-, and High-Grade Mucoepidermoid Carcinoma? Laryngoscope (2016) 126:11–3. doi: 10.1002/lary.25588
9. Nobis CP, Rohleder NH, Wolff KD, Wagenpfeil S, Scherer EQ, Kesting MR. Head and Neck Salivary Gland Carcinomas - Elective Neck Dissection, Yes or No? J Oral Maxillofac Surg (2014) 72:205–10. doi: 10.1016/j.joms.2013.05.024
10. Shafique K, Zhang PJ, Montone KT, Song S, Livolsi VA, Baloch Z. Pathologic Grading of Mucoepidermoid Carcinomas of the Salivary Gland and Its Effect on Clinicopathologic Follow-Up: An Institutional Experience. Hum Pathol (2020) 98:89–97. doi: 10.1016/j.humpath.2020.02.001
11. Tonon G, Modi S, Wu L, Kubo A, Coxon AB, Komiya T, et al. T(11;19)(Q21;P13) Translocation in Mucoepidermoid Carcinoma Creates a Novel Fusion Product That Disrupts a Notch Signaling Pathway. Nat Genet (2003) 33:208–13. doi: 10.1038/ng1083
12. Tirado Y, Williams MD, Hanna EY, Kaye FJ, Batsakis JG, El-Naggar AK. CRTC1/MAML2 Fusion Transcript in High Grade Mucoepidermoid Carcinomas of Salivary and Thyroid Glands and Warthin’s Tumors: Implications for Histogenesis and Biologic Behavior. Genes Chromosomes Cancer (2007) 46:708–15. doi: 10.1002/gcc.20458
13. Jee KJ, Persson M, Heikinheimo K, Passador-Santos F, Aro K, Knuutila S, et al. Genomic Profiles and CRTC1-MAML2 Fusion Distinguish Different Subtypes of Mucoepidermoid Carcinoma. Mod Pathol (2013) 26:213–22. doi: 10.1038/modpathol.2012.154
14. Saade RE, Bell D, Garcia J, Roberts D, Weber R. Role of CRTC1/MAML2 Translocation in the Prognosis and Clinical Outcomes of Mucoepidermoid Carcinoma. JAMA Otolaryngol Head Neck Surg (2016) 142:234–40. doi: 10.1001/jamaoto.2015.3270
15. Luk PP, Wykes J, Selinger CI, Ekmejian R, Tay J, Gao K, et al. Diagnostic and Prognostic Utility of Mastermind-Like 2 (MAML2) Gene Rearrangement Detection by Fluorescent In Situ Hybridization (FISH) in Mucoepidermoid Carcinoma of the Salivary Glands. Oral Surg Oral Med Oral Pathol Oral Radiol (2016) 121:530–41. doi: 10.1016/j.oooo.2016.01.003
16. Verdorfer I, Fehr A, Bullerdiek J, Scholz N, Brunner A, Krugman J, et al. Chromosomal Imbalances, 11q21 Rearrangement and MECT1-MAML2 Fusion Transcript in Mucoepidermoid Carcinomas of the Salivary Gland. Oncol Rep (2009) 22:305–11. doi: 10.3892/or_00000438
17. Seethala RR, Dacic S, Cieply K, Kelly LM, Nikiforova MN. A Reappraisal of the MECT1/MAML2 Translocation in Salivary Mucoepidermoid Carcinomas. Am J Surg Pathol (2010) 34:1106–21. doi: 10.1097/PAS.0b013e3181de3021
18. Behboudi A, Enlund F, Winnes M, Andrén Y, Nordkvist A, Leivo I, et al. Molecular Classification of Mucoepidermoid Carcinomas-Prognostic Significance of the MECT1-MAML2 Fusion Oncogene. Genes Chromosomes Cancer (2006) 45:470–81. doi: 10.1002/gcc.20306
19. Okabe M, Miyabe S, Nagatsuka H, Terada A, Hanai N, Yokoi M, et al. MECT1-MAML2 Fusion Transcript Defines a Favorable Subset of Mucoepidermoid Carcinoma. Clin Cancer Res (2006) 12:3902–7. doi: 10.1158/1078-0432.CCR-05-2376
20. Okumura Y, Nakano S, Murase T, Ueda K, Kawakita D, Nagao T, et al. Prognostic Impact of CRTC1/3-MAML2 Fusions in Salivary Gland Mucoepidermoid Carcinoma: A Multiinstitutional Retrospective Study. Cancer Sci (2020) 111:4195–204. doi: 10.1111/cas.14632
21. Seethala RR, Chiosea SI. MAML2 Status in Mucoepidermoid Carcinoma Can No Longer Be Considered a Prognostic Marker. Am J Surg Pathol (2016) 40:1151–3. doi: 10.1097/PAS.0000000000000676
22. Leivo I, Jee KJ, Heikinheimo K, Laine M, Ollila J, Nagy B, et al. Characterization of Gene Expression in Major Types of Salivary Gland Carcinomas With Epithelial Differentiation. Cancer Genet Cytogenet (2005) 156:104–13. doi: 10.1016/j.cancergencyto.2004.04.016
23. Francioso F, Carinci F, Tosi L, Scapoli L, Pezzetti F, Passerella E, et al. Identification of Differentially Expressed Genes in Human Salivary Gland Tumors by DNA Microarrays. Mol Cancer Ther (2002) 1:533–8.
24. Flores B de CT de CP, Lourenço SV, Damascena AS, Kowaslki LP, Soares FA, Coutinho-Camillo CM. Altered Expression of Apoptosis-Regulating miRNAs in Salivary Gland Tumors Suggests Their Involvement in Salivary Gland Tumorigenesis. Virchows Arch (2017) 470:291–9. doi: 10.1007/s00428-016-2049-z
25. Santos PRB, Coutinho-Camillo CM, Soares FA, Freitas VS, Vilas-Bôas DS, Xavier FCA, et al. MicroRNAs Expression Pattern Related to Mast Cell Activation and Angiogenesis in Paraffin-Embedded Salivary Gland Tumors. Pathol Res Pract (2017) 213:1470–6. doi: 10.1016/j.prp.2017.10.012
26. Binmadi N, Basile J, Perez P, Gallo A, Tandon M, Elias W, et al. miRNA Expression Profile of Mucoepidermoid Carcinoma. Oral Dis (2018) 24:537–43. doi: 10.1111/odi.12800
27. Lapa RML, Barros-Filho MC, Marchi FA, Domingues MAC, de Carvalho GB, Drigo SA, et al. Integrated miRNA and mRNA Expression Analysis Uncovers Drug Targets in Laryngeal Squamous Cell Carcinoma Patients. Oral Oncol (2019) 93:76–84. doi: 10.1016/j.oraloncology.2019.04.018
28. Huang HY, Lin YCD, Li J, Huang KY, Shrestha S, Hong HC, et al. MiRTarBase 2020: Updates to the Experimentally Validated microRNA-Target Interaction Database. Nucleic Acids Res (2020) 48:D148–54. doi: 10.1093/nar/gkz896
29. Warner KA, Adams A, Bernardi L, Nor C, Finkel KA, Zhang Z, et al. Characterization of Tumorigenic Cell Lines From the Recurrence and Lymph Node Metastasis of a Human Salivary Mucoepidermoid Carcinoma. Oral Oncol (2013) 49:1059–66. doi: 10.1016/j.oraloncology.2013.08.004
30. Ran AF, Hsu PD, Wright J, Agarwala V, Scott DA, Zhang F. Genome Engineering Using CRISPR-Cas9 System. Nat Protoc (2013) 8:2281–308. doi: 10.1038/nprot.2013.143
31. Salo T, Sutinen M, Hoque Apu E, Sundquist E, Cervigne NK, de Oliveira CE, et al. A Novel Human Leiomyoma Tissue Derived Matrix for Cell Culture Studies. BMC Cancer (2015) 15:1. doi: 10.1186/s12885-015-1944-z
32. Naakka E, Tuomainen K, Wistrand H, Palkama M, Suleymanova I, Al-Samadi A, et al. Fully Human Tumor-Based Matrix in Three-Dimensional Spheroid Invasion Assay. J Vis Exp (2019) 2019:1–7. doi: 10.3791/59567
33. Schindelin J, Arganda-Carrera I, Frise E, Verena K, Mark L, Tobias P, et al. Fiji - An Open Platform for Biological Image Analysis. Nat Methods (2012) 9:676–82. doi: 10.1038/nmeth.2019.Fiji
34. Pandey DP, Picard D. miR-22 Inhibits Estrogen Signaling by Directly Targeting the Estrogen Receptor α mRNA. Mol Cell Biol (2009) 29:3783–90. doi: 10.1128/MCB.01875-08
35. Matsushima K, Isomoto H, Yamaguchi N, Inoue N, Machida H, Nakayama T, et al. MiRNA-205 Modulates Cellular Invasion and Migration via Regulating Zinc Finger E-Box Binding Homeobox 2 Expression in Esophageal Squamous Cell Carcinoma Cells. J Transl Med (2011) 9:30. doi: 10.1186/1479-5876-9-30
36. Li Q, Ma L, Wu Z, Wang G, Huang Q, Shen Z, et al. Zinc Finger E−box Binding Homeobox 2 Functions as an Oncogene in Human Laryngeal Squamous Cell Carcinoma. Mol Med Rep (2019) 6:4545–52. doi: 10.3892/mmr.2019.10126
37. Cipriani NA, Lusardi JJ, Mcelherne J, Pearson AT, Olivas AD, Fitzpatrick C, et al. Mucoepidermoid Carcinoma: A Comparison of Histologic Grading Systems and Relationship to MAML2 Rearrangement and Prognosis. Am J Surg Pathol (2019) 43:885–97. doi: 10.1097/PAS.0000000000001252
38. Reddy R, Islam MN, Bhattacharyya I, Cohen DM, Fitzpatrick SG, Ganatra S. The Reliability of MAML2 Gene Rearrangement in Discriminating Between Histologically Similar Glandular Odontogenic Cysts and Intraosseous Mucoepidermoid Carcinomas. Oral Surg Oral Med Oral Pathol Oral Radiol (2019) 127:e136–47. doi: 10.1016/j.oooo.2018.12.003
39. Bishop JA, Yonescu R, Batista D, Warnock GR, Westra WH. Glandular Odontogenic Cysts (GOCs) Lack MAML2 Rearrangements: A Finding to Discredit the Putative Nature of GOC as a Precursor to Central Mucoepidermoid Carcinoma. Head Neck Pathol (2014) 8:287–90. doi: 10.1007/s12105-014-0534-8
40. Argyris PP, Wehrs RN, García JJ, Koutlas IG. Fluorescence in-Situ Hybridization Identifies Mastermind-Like 2 (MAML2) Rearrangement in Odontogenic Cysts With Mucous Prosoplasia: A Pilot Study. Histopathology (2015) 66:791–7. doi: 10.1111/his.12526
41. Conkright MD, Canettieri G, Screaton R, Guzman E, Miraglia L, Hogenesch JB, et al. TORCs: Transducers of Regulated CREB Activity. Mol Cell (2003) 12:413–23. doi: 10.1016/j.molcel.2003.08.013
42. Coxon A, Rozenblum E, Park YS, Joshi N, Tsurutani J, Dennis PA, et al. Mect1-Maml2 Fusion Oncogene Linked to the Aberrant Activation of Cyclic AMP/CREB Regulated Genes. Cancer Res (2005) 65:7137–44. doi: 10.1158/0008-5472.CAN-05-1125
43. Enlund F, Behboudi A, Andrén Y, Öberg C, Lendahl U, Mark J, et al. Altered Notch Signaling Resulting From Expression of a WAMTP1-MAML2 Gene Fusion in Mucoepidermoid Carcinomas and Benign Warthin’s Tumors. Exp Cell Res (2004) 292:21–8. doi: 10.1016/j.yexcr.2003.09.007
44. Wu L, Liu J, Gao P, Nakamura M, Cao Y, Shen H, et al. Transforming Activity of MECT1-MAML2 Fusion Oncoprotein Is Mediated by Constitutive CREB Activation. EMBO J (2005) 24:2391–402. doi: 10.1038/sj.emboj.7600719
45. Chen J, Li JL, Chen Z, Griffin JD, Wu L. Gene Expression Profiling Analysis of CRTC1-MAML2 Fusion Oncogene-Induced Transcriptional Program in Human Mucoepidermoid Carcinoma Cells. BMC Cancer (2015) 15:1–13. doi: 10.1186/s12885-015-1827-3
46. Chen Z, Ni W, Li JL, Lin S, Zhou X, Sun Y, et al. The CRTC1-MAML2 Fusion Is the Major Oncogenic Driver in Mucoepidermoid Carcinoma. JCI Insight (2021) 6:1-18. doi: 10.1172/jci.insight.139497
47. Denaro M, Navari E, Ugolini C, Seccia V, Donati V, Casani AP, et al. A microRNA Signature for the Differential Diagnosis of Salivary Gland Tumors. PLoS One (2019) 14:1–16. doi: 10.1371/journal.pone.0210968
48. Wang WW, Chen B, Lei CB, Liu GX, Wang YG, Yi C, et al. miR-582-5p Inhibits Invasion and Migration of Salivary Adenoid Cystic Carcinoma Cells by Targeting FOXC1. Jpn J Clin Oncol (2017) 47:690–8. doi: 10.1093/jjco/hyx073
49. Kerppola TK. Polycomb Group Complexes - Many Combinations, Many Functions. Trends Cell Biol (2009) 19:692–704. doi: 10.1016/j.tcb.2009.10.001
50. Vékony H, Röser K, Löning T, Raaphorst FM, Leemans CR, van der Waal I, et al. Deregulated Expression of P16ink4a and P53 Pathway Members in Benign and Malignant Myoepithelial Tumours of the Salivary Glands. Histopathology (2008) 53:658–66. doi: 10.1111/j.1365-2559.2008.03184.x
51. Vékony H, Raaphorst FM, Otte AP, Van Lohuizen M, Leemans CR, van der Waal I, et al. High Expression of Polycomb Group Protein EZH2 Predicts Poor Survival in Salivary Gland Adenoid Cystic Carcinoma. J Clin Pathol (2008) 61:744–9. doi: 10.1136/jcp.2007.054262
52. Hajósi-Kalcakosz S, Vincze E, Dezso K, Paku S, Rókusz A, Sápi Z, et al. EZH2 Is a Sensitive Marker of Malignancy in Salivary Gland Tumors. Diagn Pathol (2015) 10:1–5. doi: 10.1186/s13000-015-0392-z
53. Wang DY, Gendoo DMA, Ben-David Y, Woodgett JR, Zacksenhaus E. A Subgroup of microRNAs Defines PTEN-Deficient, Triple-Negative Breast Cancer Patients With Poorest Prognosis and Alterations in RB1, MYC, and Wnt Signaling. Breast Cancer Res (2019) 21:1–13. doi: 10.1186/s13058-019-1098-z
54. Wang K, McDermott JD, Schrock AB, Elvin JA, Gay L, Karam SD, et al. Comprehensive Genomic Profiling of Salivary Mucoepidermoid Carcinomas Reveals Frequent BAP1, PIK3CA, and Other Actionable Genomic Alterations. Ann Oncol (2017) 28:748–53. doi: 10.1093/annonc/mdw689
55. Mao M, Chen Y, Jia Y, Yang J, Wei Q, Li Z, et al. PLCA8 Suppresses Breast Cancer Apoptosis by Activating the PI3k/AKT/NF-κb Pathway. J Cell Mol Med (2019) 23:6930–41. doi: 10.1111/jcmm.14578
56. Feng X, Matsuo K, Zhang T, Hu Y, Mays AC, Browne JD, et al. MicroRNA Profiling and Target Genes Related to Metastasis of Salivary Adenoid Cystic Carcinoma. Anticancer Res (2017) 37:3473–81. doi: 10.21873/anticanreS.11715
57. de Carvalho AC, Scapulatempo-Neto C, Maia DCC, Evangelista AF, Morini MA, Carvalho AL, et al. Accuracy of microRNAs as Markers for the Detection of Neck Lymph Node Metastases in Patients With Head and Neck Squamous Cell Carcinoma. BMC Med (2015) 13:1–14. doi: 10.1186/s12916-015-0350-3
58. Zhang P, Lu X, Shi Z, Li X, Zhang Y, Zhao S, et al. miR-205-5p Regulates Epithelial-Mesenchymal Transition by Targeting PTEN via PI3K/AKT Signaling Pathway in Cisplatin-Resistant Nasopharyngeal Carcinoma Cells. Gene (2019) 710:103–13. doi: 10.1016/j.gene.2019.05.058
59. Budd WT, Seashols-Williams SJ, Clark GC, Weaver D, Calvert V, Petricoin E, et al. Dual Action of miR-125b as a Tumor Suppressor and OncomiR-22 Promotes Prostate Cancer Tumorigenesis. PLoS One (2015) 10:1–21. doi: 10.1371/journal.pone.0142373
60. Tsuchiya N, Izumiya M, Ogata-Kawata H, Okamoto K, Fujiwara Y, Nakai M, et al. Tumor Suppressor miR-22 Determines P53-Dependent Cellular Fate Through Post-Transcriptional Regulation of P21. Cancer Res (2011) 71:4628–39. doi: 10.1158/0008-5472.CAN-10-2475
61. Xu D, Takeshita F, Hino Y, Fukunaga S, Kudo Y, Tamaki A, et al. miR-22 Represses Cancer Progression by Inducing Cellular Senescence. J Cell Biol (2011) 193:409–24. doi: 10.1083/jcb.201010100
63. Lee JH, Park SJ, Kim SW, Hariharasudhan G, Jung SM, Jun S, et al. C-Fos-Dependent miR-22 Targets MDC1 and Regulates DNA Repair in Terminally Differentiated Cells. Oncotarget (2017) 8:48204–21. doi: 10.18632/oncotarget.18389
Keywords: mucoepidermoid carcinoma, salivary gland tumor, head and neck cancer, oral cancer, transcriptomic analysis, miR22, miR205, microRNA
Citation: Naakka E, Barros-Filho MC, Adnan-Awad S, Al-Samadi A, Marchi FA, Kuasne H, Korelin K, Suleymanova I, Brown AL, Scapulatempo-Neto C, Lourenço SV, Castilho RM, Kowalski LP, Mäkitie A, Araújo VC, Leivo I, Rogatto SR, Salo T and Passador-Santos F (2022) miR-22 and miR-205 Drive Tumor Aggressiveness of Mucoepidermoid Carcinomas of Salivary Glands. Front. Oncol. 11:786150. doi: 10.3389/fonc.2021.786150
Received: 29 September 2021; Accepted: 31 December 2021;
Published: 09 February 2022.
Edited by:
Piero Nicolai, University of Padua, ItalyReviewed by:
Davide Lombardi, University of Brescia, ItalyFrancesca Lovat, The Ohio State University, United States
Copyright © 2022 Naakka, Barros-Filho, Adnan-Awad, Al-Samadi, Marchi, Kuasne, Korelin, Suleymanova, Brown, Scapulatempo-Neto, Lourenço, Castilho, Kowalski, Mäkitie, Araújo, Leivo, Rogatto, Salo and Passador-Santos. This is an open-access article distributed under the terms of the Creative Commons Attribution License (CC BY). The use, distribution or reproduction in other forums is permitted, provided the original author(s) and the copyright owner(s) are credited and that the original publication in this journal is cited, in accordance with accepted academic practice. No use, distribution or reproduction is permitted which does not comply with these terms.
*Correspondence: Fabricio Passador-Santos, ZmFicmljaW8ucGFzc2Fkb3JAc2xtYW5kaWMuZWR1LmJy