
95% of researchers rate our articles as excellent or good
Learn more about the work of our research integrity team to safeguard the quality of each article we publish.
Find out more
ORIGINAL RESEARCH article
Front. Oncol. , 24 November 2021
Sec. Genitourinary Oncology
Volume 11 - 2021 | https://doi.org/10.3389/fonc.2021.777684
This article is part of the Research Topic Advances in Prostate Cancer: Model Systems, Molecular and Cellular Mechanisms, Early Detection, and Therapies View all 21 articles
 Yibei Dai1†
 Yiyun Wang2†
 Ying Cao1
 Pan Yu1Lingyu Zhang1Zhenping Liu3Ying Ping1Danhua Wang1Gong Zhang1Yiwen Sang1Xuchu Wang1*
 Zhihua Tao1*
Introduction: Prostate cancer (PCa) is one of the most frequently diagnosed cancers and the leading cause of cancer death in males worldwide. Although prostate-specific antigen (PSA) screening has considerably improved the detection of PCa, it has also led to a dramatic increase in overdiagnosing indolent disease due to its low specificity. This study aimed to develop and validate a multivariate diagnostic model based on the urinary epithelial cell adhesion molecule (EpCAM)-CD9–positive extracellular vesicles (EVs) (uEVEpCAM-CD9) to improve the diagnosis of PCa.
Methods: We investigated the performance of uEVEpCAM-CD9 from urine samples of 193 participants (112 PCa patients, 55 benign prostatic hyperplasia patients, and 26 healthy donors) to diagnose PCa using our laboratory-developed chemiluminescent immunoassay. We applied machine learning to training sets and subsequently evaluated the multivariate diagnostic model based on uEVEpCAM-CD9 in validation sets.
Results: Results showed that uEVEpCAM-CD9 was able to distinguish PCa from controls, and a significant decrease of uEVEpCAM-CD9 was observed after prostatectomy. We further used a training set (N = 116) and constructed an exclusive multivariate diagnostic model based on uEVEpCAM-CD9, PSA, and other clinical parameters, which showed an enhanced diagnostic sensitivity and specificity and performed excellently to diagnose PCa [area under the curve (AUC) = 0.952, P < 0.0001]. When applied to a validation test (N = 77), the model achieved an AUC of 0.947 (P < 0.0001). Moreover, this diagnostic model also exhibited a superior diagnostic performance (AUC = 0.917, P < 0.0001) over PSA (AUC = 0.712, P = 0.0018) at the PSA gray zone.
Conclusions: The multivariate model based on uEVEpCAM-CD9 achieved a notable diagnostic performance to diagnose PCa. In the future, this model may potentially be used to better select patients for prostate transrectal ultrasound (TRUS) biopsy.
Prostate cancer (PCa) is one of the most frequently diagnosed cancers and the leading cause of cancer death in males worldwide (1). Despite the widespread use of prostate-specific antigen (PSA) as a noninvasive screening tool for PCa, the low specificity of PSA has led to an increase in either overdiagnosis or unnecessary biopsies, especially when its value is within the PSA gray zone (4–10 ng/ml) (2, 3). Thus, it is urgently needed to explore new biomarkers for more accurate PCa diagnosis.
Urine is an ideal source of PCa biomarkers because the samples can be collected noninvasively in large amounts, and several urinary markers have been reported such as prostate cancer antigen-3 (PCA3), transmembrane protease serine-2 (TMPRSS2), and glutathione S-transferase P (GSTP1) gene (4–7). Recently, urinary extracellular vesicles (uEVs) have sparked interest as potential biomarkers (8, 9). uEVs are low-density membrane vesicles containing lipids, proteins, DNA, mRNAs, and microRNAs (10). A reproducible method for uEV isolation has been described by Pisitkun et al. (11) in 2004 and has been widely adopted for uEV analysis. Previous proteomic analysis of uEVs has revealed varieties of cancer-specific proteins in their cargoes (12, 13). However, the question remained whether there is a specific protein in uEVs that could provide diagnostic information for PCa and also be easily detected.
Epithelial cell adhesion molecule (EpCAM) is a transmembrane glycoprotein that plays an important role in Ca2+-independent hemophilic cell-to-cell adhesion, cell signaling, migration, proliferation, and differentiation of cancer cells (14, 15). It has thus gained considerable attraction as an appealing candidate biomarker for cancer diagnosis due to its strong expression in various carcinomas and their metastases compared with normal epithelia (16, 17). Recently, EpCAM on tumor-derived EV membrane was also employed as a promising tumor surface marker, while the tetraspanin family of proteins, such as CD63, CD9, and CD81, was mainly used as EV universal markers (18, 19). The use of these biomarkers to identify EVs from bodily fluids has garnered much interest as a non-invasive liquid biopsy for cancer.
Accordingly, we herein aimed to develop and validate a multivariate diagnostic model based on the urinary EpCAM-CD9-positive EVs (uEVEpCAM-CD9) to improve the diagnosis of PCa. We first investigated the performance of uEVEpCAM-CD9 for the diagnosis of PCa using a newly laboratory-developed chemiluminescent immunoassay (CLIA) (Figure 1A). Briefly, uEVEpCAM-CD9 diffused in urine is bound with acridinium ester (ACE)-labeled anti-CD9 antibodies and captured by magnetic bead-labeled anti-EpCAM antibodies, followed by a thorough isolation under an external magnetic field. Consequently, the concentrations of EpCAM-CD9-positive EVs (EVEpCAM-CD9) can be quantitatively determined by measuring the chemiluminescent signals. Results indicated that EVEpCAM-CD9 from the culture supernatant of PCa cell lines were significantly elevated under the simulated tumor microenvironment. Moreover, preliminary results showed that uEVEpCAM-CD9 could distinguish patients with PCa from control sets, indicating that uEVEpCAM-CD9 may be a potential biomarker for PCa diagnosis. We then applied machine learning to training sets and subsequently evaluated the multivariate diagnostic model based on uEVEpCAM-CD9 in validation sets.
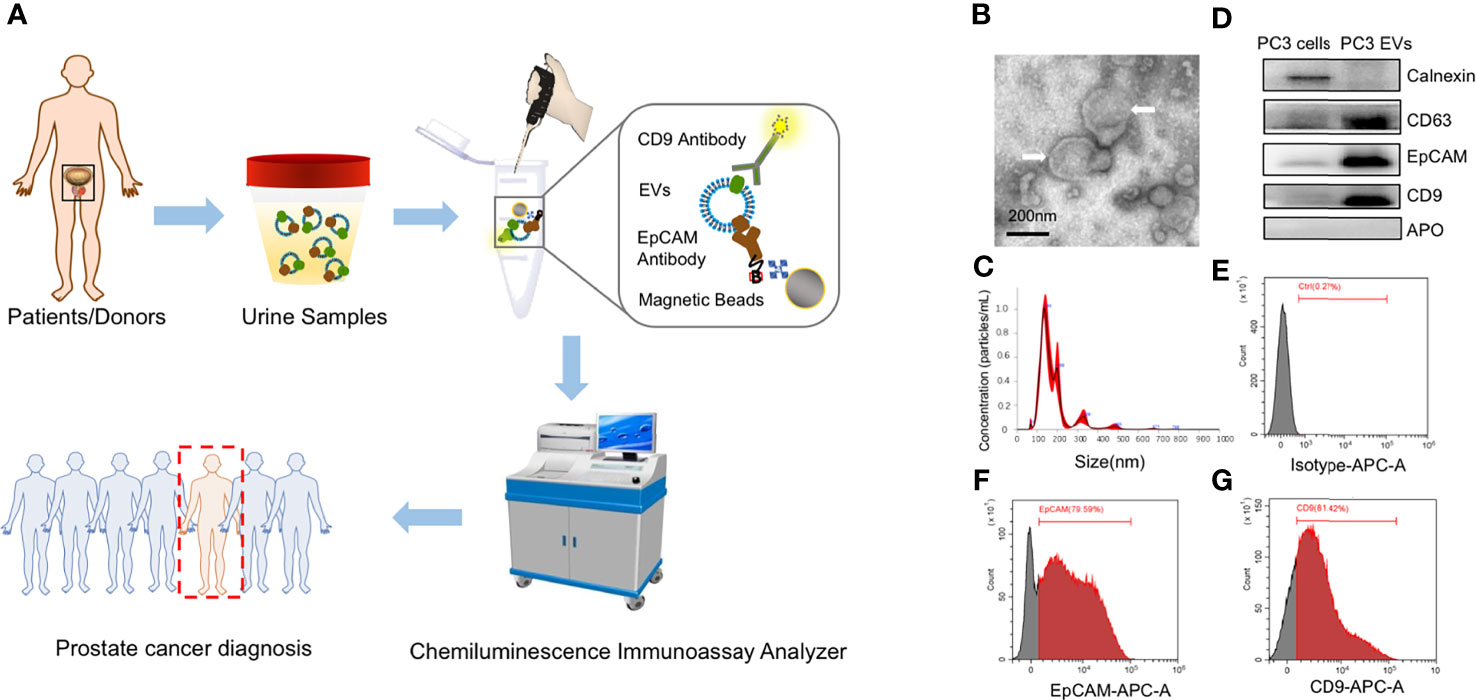
Figure 1 The scheme of workflow for urinary EpCAM-CD9-positive extracellular vesicle (uEVEpCAM-CD9) detection. (A) EpCAM-CD9-positive EVs diffused in urine are bound with acridinium ester (ACE)-labeled anti-CD9 antibodies and captured by magnetic microbeads labeled anti-EpCAM antibodies. After incubation for 60 min, uEVEpCAM-CD9 binding with magnetic microbeads can be easily isolated under an external magnetic field and quantitatively analyzed by a chemiluminescent immunoassay analyzer to diagnose prostate cancer. (B) TEM images of EVs isolated by ultracentrifugation (white arrow). (C) EVs are characterized by NTA. (D) The expression of CD63, CD9, EpCAM, calnexin, and APO in PC3 cell lysates and the EV fraction from PC3 by WB analysis. (E–G) Flow cytometry assay identified that approximately 80% of EVs released by PC3 carried EpCAM and CD9. EpCAM, epithelial cell adhesion molecule; uEVEpCAM-CD9, urinary EpCAM-CD9-positive extracellular vesicles; EVs, extracellular vesicles; ACE, acridinium ester; TEM, transmission electron microscope; NTA, nanoparticle tracking analysis; WB, western blot.
Two human PCa cell lines (PC3 and LNCaP) and an immortalized prostate epithelial cell line (RWPE-1) were obtained from the American Type Culture Collection (Manassas, VA, USA). All cell lines were cultured in RPMI 1640 medium (Gibco Invitrogen, Carlsbad, CA, USA) supplemented with 10% fetal bovine serum (FBS; Thermo Fisher Scientific, MA, USA), 100 U/ml penicillin, and 100 µg/ml streptomycin in an incubator with 5% CO2 at 37°C.
Urine samples from 193 participants [112 PCa patients, 55 benign prostatic hyperplasia (BPH) patients, and 26 healthy donors (HDs)] were collected in the Second Affiliated Hospital of Zhejiang University School of Medicine. Approval was obtained from the Second Affiliated Hospital of Zhejiang University School of Medicine Ethical Committee before initiating the study. Detailed information on the patients is summarized in Supplementary Table S1. All methods were performed in accordance with the relevant guidelines and regulations. All the patients met the following inclusion criteria: (1) undergoing prostate biopsy for the first time, (2) three-dimensional size of the prostate available via transabdominal ultrasonography before biopsy, (3) blood tests performed within 1 week before biopsy, (4) complete clinical and pathological data available, (5) absence of acute prostatitis or systemic inflammatory disease, (6) absence of urinary tract infection, (7) no history of prostate surgery, (8) no history of 5-alpha reductase inhibitor use, and (9) no anti-inflammatory drug use within 2 weeks before blood tests. Initial voided urine (5–10 ml) was prospectively collected from patients at the time of day most convenient to the person before prostate biopsy. Matched urine samples were collected from PCa patients prior to (n = 10) and a week after local treatment by radical prostatectomy (n = 10).
EVs were isolated from cell culture medium by ultracentrifugation as previously described (20). Briefly, when 70%–80% confluency was reached, cells were washed twice with phosphate-buffered saline (PBS; pH7.0) and then incubated for 48 h in FBS-free medium. Cell culture medium was collected and subjected to consecutive centrifugation steps (300 × g for 10 min and 2,000 × g for 20 min) to remove dead cells and cellular debris. The supernatant was vacuum filtered using a 10-kDa centrifugal filter (Merck Millipore, Darmstadt, Germany), and EV concentrates were ultracentrifuged at 100,000 × g for 70 min at 4°C (Type 70 Ti Fixed-angle Titanium Rotor, k factor = 157.4) (Optima™ XP ultracentrifuge; Beckman Coulter, Indianapolis, IN, USA). Pellets were washed with PBS followed by ultracentrifugation at the same speed and time. The supernatant was discarded, and the resulting EV pellets were suspended in PBS and stored at -80°C.
In order to obtain uEVs, urine samples from patients with PCa, BPH and HDs were centrifuged at 3,000 × g for 20 min at 4°C to remove debris and then ultracentrifuged at 200,000 × g for 2 h at 4°C. The supernatant was removed, and the uEV pellets were resuspended in PBS and stored at -80°C.
Transmission electron microscope (TEM) was used to investigate the morphology of the EVs isolated by ultracentrifugation. Briefly, EVs at an optimal concentration were first placed on 400 mesh carbon/formvar-coated grids and allowed to be absorbed on formvar for a minimum of 10 min. Next, the grids (membrane side down) were transferred to a 50-μl drop of 2.5% glutaraldehyde for 5 min, after which they were transferred to a 100-μl drop of distilled water and were left to stand for 2 min. This process was repeated nine times for a total of 10 water washes. Then, the sample was loaded on the grid and stained by 4% uranyl acetate for 10 min and 1% methylcellulose for 5 min. The remaining water was removed using filter paper. Finally, the samples were viewed using a Tecnai Bio Twin TEM (FEI, Hillsboro, OR, USA), and images were obtained using an AMT CCD camera (Advanced Microscopy Techniques, Woburn, MA, USA).
The concentration and the size distribution of EVs were analyzed by nanoparticle tracking analysis (NTA) using a ZetaView instrument (Particle Metrix, Inning am Ammersee, Germany) and the NanoSight LM10 microscope (NanoSight Ltd., Amesbury, UK) configured with a 405-nm laser. Videos were collected and analyzed using the NTA software (version 2.3) with the default setting of the minimal expected particle size, minimum track length, and blur. Each EV sample was vortexed and diluted with particle-free PBS to obtain the recommended 25–100 particles/frame of the NTA system. Five videos of typically 60-s duration were recorded to generate replicate histograms that were averaged.
Cells and EVs were lysed in radioimmunoprecipitation assay (RIPA) Lysis Buffer (Beyotime Biotechnology, Shanghai, China) for 30 min on ice, and the protein concentration was measured by the Enhanced BCA Protein Assay Kit (Beyotime Biotechnology, Shanghai, China). And then, the lysates were mixed with loading buffer and heated to 100°C for 10 min. Subsequently, the samples were electrophoretically separated on an 8% sodium dodecyl sulfate–polyacrylamide gel electrophoresis(SDS-PAGE) and electro-transferred onto polyvinylidene difluoride (PVDF) membranes (Millipore, Carlsbad, CA). After blocking for 2 h at 25°C in Tris-buffered saline with 0.05% Tween-20 (TBST) and 5% non-fat dry milk, the membranes were incubated overnight at 4°C with the primary antibodies in TBST containing 5% BSA. The following antibodies were used for Western blot (WB) analysis, including anti-Alix antibody (1:1,000; ab88388; Abcam, Cambridge, MA, USA), anti-Calnexin antibody (1:200; ab238078; Abcam, Cambridge, MA, USA), anti-CD63 antibody (1:300; ab8219; Abcam, Cambridge, MA, USA), anti-EpCAM antibody (1:200; ab218448; Abcam, Cambridge, MA, USA), anti-CD9 antibody (1:300; sc-13118; Santa-Cruz Biotechnology, Santa Cruz, CA, USA), anti-beta Actin antibody (1:5,000; ab6276; Abcam, Cambridge, MA, USA), and anti-Apo antibody (1:500; ab66379; Abcam, Cambridge, MA, USA). Thereafter, the membrane was washed and immersed into horseradish peroxidase (HRP)-conjugated secondary antibodies (Jackson ImmunoResearch, Suffolk, UK) for 2 h at 25°C. Chemiluminescent detection of bands was performed using Clarity Western ECL Substrate Kit (Bio-Rad Laboratories, Inc., Hercules, CA, USA), and the signals were visualized using the Quantity One Imaging Software from Bio-Rad according to the manufacturer’s instructions. In order to quantify the levels of EpCAM-CD9-positive EVs from WB analysis and investigate the association with the chemiluminescent signals by our immunoassay, we rationally defined the EpCAM-CD9 protein density (DensityEpCAM-CD9): DensityEpCAM-CD9 = DensityEpCAM × DensityCD9, where the value of DensityEpCAM and DensityCD9 can be quantitatively obtained from WB images using Quantity One Imaging Software. This definition was based on the hypothesis that all the EVs expressing EpCAM and CD9 were sufficiently captured and detected by the antibody sets of our immunoassay, and the chemiluminescent signals of each EV captured by EpCAM antibody can be multiplied by CD9 antibody. Our results showed that DensityEpCAM-CD9 was correlated highly with chemiluminescent signals (r = 0.8395, 95% CI: 0.6317–0.9348, P < 0.0001) (Supplementary Figure S2A).
The expression of CD9 and EpCAM on EVs were analyzed by flow cytometry as previously described (21). Briefly, EVs attached to 4 μm aldehyde/sulfate latex beads (Invitrogen, Carlsbad, CA, USA) were incubated with anti-CD9 antibodies (SAB4700092; Sigma-Aldrich, St. Louis, MO), anti-CD63 antibodies (ab1318; Abcam, Cambridge, MA, USA), anti-CD81 antibodies (ab79559; Abcam, Cambridge, MA, USA), or anti-EpCAM antibodies (ab187372; Abcam, Cambridge, MA, USA) for 30 min with rotation at 4°C followed by Alexa-488-tagged secondary antibodies (Life Technologies, Carlsbad, CA, USA) for 30 min with rotation at 4°C. Samples were detected using CytoFLEX Flow Cytometer (Beckman Coulter, Brea, CA, USA) and data were analyzed using CytExpert (Beckman Coulter, Brea, CA, USA).
According to the manufacturer’s instructions, the concentration and the protein amount of EVs were measured by bicinchoninic acid (BCA) assay using Enhanced BCA Protein Assay Kit (Beyotime Biotechnology, Shanghai, China) and a spectrophotometer (Bio-Rad Laboratories, Inc., Hercules, CA, USA) set to 562 nm.
The urinary creatinine was measured with Roche-developed assays for creatinine (CRE2U, ACN 8152) using a Roche Cobas 8000 Modular Analyzer (Roche, Woerden, Netherlands) according to the manufacturer’s instructions. The automated chemiluminescent microparticle immunoassay analyzer ARCHITECT i2000 (Abbott Laboratories, Abbott Park, IL, USA) was used following the manufacturer’s protocols to determine the concentrations of PSA protein in serum samples.
Cells were seeded and cultured in RPMI 1640 medium, which contains glucose and amino acids for 24 h. The medium was discarded, and then cells were washed once with PBS to remove trace serum. The cells were further cultured in serum-free RPMI 1640 medium under normoxia (21% O2) to suffer serum starvation or cultured in RPMI 1640 medium supplemented with 10% FBS under hypoxic conditions (1% O2) to suffer hypoxia for the indicated time periods.
EVs were detected by a newly developed paramagnetic particle-based sandwich CLIA (Figure 1A).
For EVs from the cell line supernatant, 100 μl EVs were mixed with 50 μl ACE-labeled anti-CD9 antibodies (1.320 μg/ml) and biotin-labeled anti-EpCAM antibodies (4.000 μg/ml). After incubation for 1 h at 25°C, the mixtures are incubated with 50 μl turbid liquid containing 4 mg/ml avidin-coated magnetic beads for another 30 min, followed by thorough washing of the magnetic beads under an external magnetic field. Finally, magnetic beads with ACE-labeled anti-CD9 antibodies are mixed with trigger solution for chemiluminescent signal excitation. All the measurements are performed in triplicate. EVEpCAM-CD9 secretion index was calculated to describe the average amount of EVEpCAM-CD9 secreted per PC3 cell. EVEpCAM-CD9 secretion index = Vs × Con EV/N cell, where Vs (μl) is the volume of the PC3 cell line supernatant, Con EV (particles/μl) is the concentration of EVEpCAM-CD9 derived by PC3 cells in the supernatant, and Ncell corresponds to the number of the PC3 cells.
For EVs from the urine samples, each step was the same as the EVs from the cell line supernatant, except the concentration of the ACE-labeled anti-CD9 antibodies (0.132 μg/ml). To avoid urine sampling variance, uEVEpCAM-CD9 concentrations were normalized by urinary creatinine. We herein rationally defined “n.u.”: n.u. = Con EV/Cr, where Con EV (g/L) corresponds to the concentration of EVEpCAM-CD9 in the urine samples and Cr (g/L) corresponds to the urinary creatinine of the urine samples, to compare uEVEpCAM-CD9 concentrations between patients with PCa and without PCa better.
Continuous variables were presented as mean ± standard deviation (SD) or median [interquartile range (IQR)] and compared with each other by Student’s t-test or Mann–Whitney U test. Categorical variables are presented as rate and compared using the chi-square test or the Fisher’s exact test. Receiver operating characteristic (ROC) curve was used to evaluate the diagnostic performance of EpCAM-CD9-positive EVs, PSA, and models. Decision curve analysis (DCA) was used to compare the diagnostic benefits of different biomarkers and models for PCa. P-values lower than 0.05 were considered statistically significant. All analyses were undertaken with GraphPad Prism version 8.0, SPSS Statistics 20, and R version 2.10.1 (R Foundation for Statistical Computing; http://www.R-project.org).
In this study, we used PC3-derived EVs to construct and optimize the CLIA. Standard characterization of EVs was performed using TEM, NTA, and WB analysis (Figures 1B–D). EVs showed characteristic cup-shaped morphology under TEM and showed a mean size of 175.9 ± 6.3 nm (standard error; SD: 78.6 ± 11.1 nm) by NTA. The EV fraction from PC3 was enriched in CD63, CD9, and ALIX, the common biomarkers of EVs, but did not contain calnexin and APO, the negative control of EVs, compared to the PC3 cell lysates (20). In addition, PC3-derived EVs were positive for EpCAM, an epithelial cell marker. Moreover, flow cytometry assay identified that approximately 80% of EVs released by PC3 carried EpCAM and CD9 (Figures 1E–G). These results indicated that EpCAM and CD9 were enriched on the membrane of EVs from the prostate cell line PC3 and EVs can be effectively captured by anti-EpCAM antibody-conjugated magnetic beads and successfully detected by ACE-labeled anti-CD9 antibodies.
We performed an ultrasensitive CLIA to quantify EVEpCAM-CD9 (Figure 1A). Noteworthy, although several conventional surface markers (e.g., CD9, CD63, and CD81) are used for EV analysis, we selected CD9 as our detection antibody for EVs. The expression of CD9, CD63, CD81, and EpCAM on PC3-derived EVs were analyzed by flow cytometry in our study, showing that EVs carrying CD9, CD63, CD81, and EpCAM accounted for 81.42%, 82.08%, 67.19%, and 79.59% of total PC3-derived EVs, respectively. Practically, the CLIA employing ACE-labeled anti-CD9 antibody exhibited a superior performance over ACE-labeled CD63 antibody or ACE-labeled CD81 antibody (data not shown). This assay exhibited remarkable chemiluminescent signals for PC3-derived EVs, while the four control groups (non-EVs, non-streptavidin-labeled magnetic beads, non-biotin-labeled anti-EpCAM antibodies, and non-ACE-labeled anti-CD9 antibodies) presented negligible chemiluminescent signals (Figure 2A). By contrast, a significant reduction in the relative chemiluminescent unit (RCU) was observed after the addition of Triton X-100, a detergent to lyse EVs (Figure 2B) (22). These results strongly demonstrated the feasibility of the assay for selectively detecting EVs.
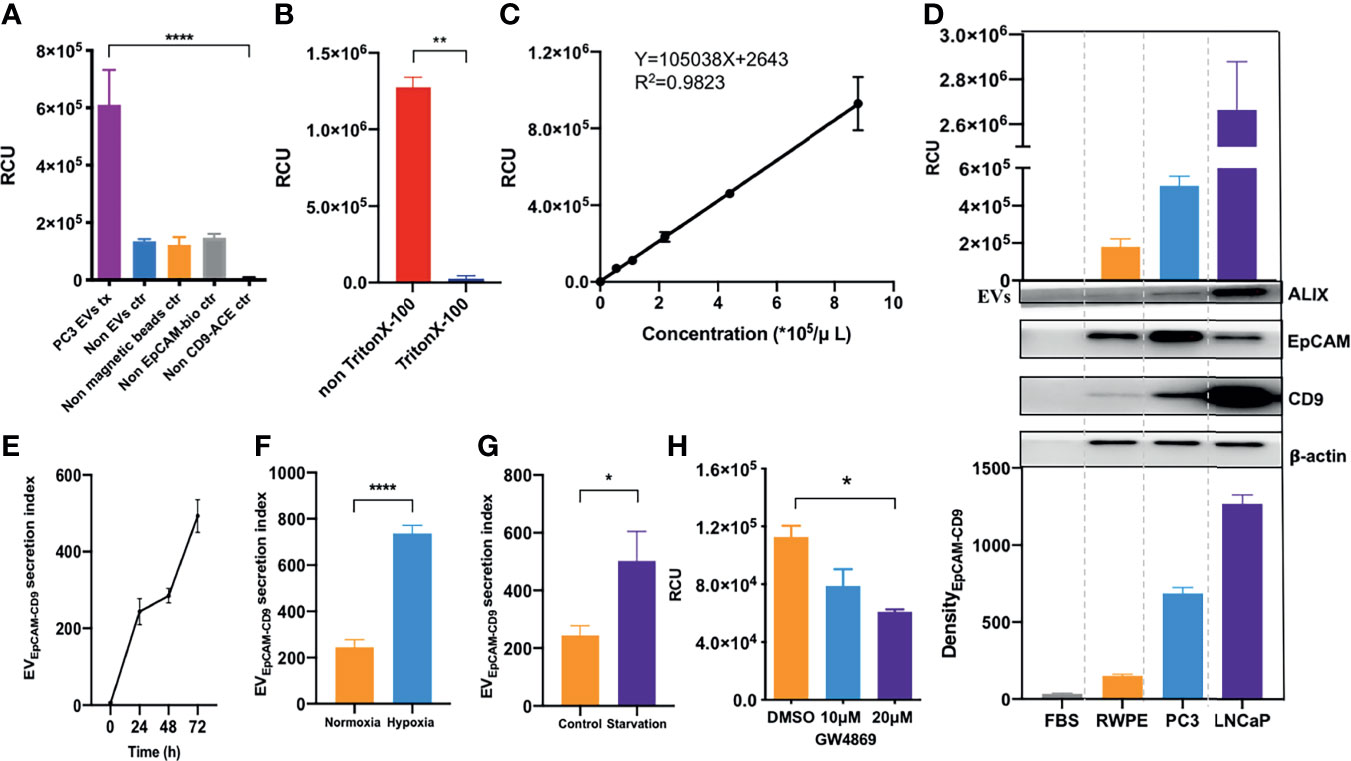
Figure 2 EVEpCAM-CD9 is ultrasensitively detected by chemiluminescent immunoassay and oversecreted under simulated tumor microenvironment. (A) Groups of PC3 EVs, non-EVs, non-streptavidin-labeled magnetic beads, non-biotin-labeled anti-EpCAM antibodies, and non-ACE-labeled anti-CD9 antibodies were detected by our assay. (B) EVs were penetrated by Triton X-100. (C) A standard curve was for EVs from cell line supernatant quantification using our EV assay. (D) EVs derived from FBS, BPH cell line RWPE-1, and human prostate cancer cell lines PC3 and LNCaP were detected by our EV assay and WB. (E) The changes of EVEpCAM-CD9 secretion index during the growth of PC3 cells. (F) The changes of EVEpCAM-CD9 secretion index when the PC3 cells were cultured under hypoxia. (G) The changes of EVEpCAM-CD9 secretion index when the PC3 cells were cultured under serum starvation. (H) The changes of EVEpCAM-CD9 secreted by PC3 cells with the treatment of 10 and 20 μM GW4869. RCU, relative chemiluminescent unit; EVs, extracellular vesicles; FBS, fetal bovine serum; EVEpCAM-CD9, EpCAM-CD9-positive extracellular vesicles. *P < 0.05,**P < 0.01,****P < 0.0001.
Next, we systematically optimized the reaction conditions of the EV assay, including the concentration of streptavidin-labeled magnetic beads, biotin-labeled anti-EpCAM antibodies, ACE-labeled anti-CD9 antibodies, and reaction time (Supplementary Figures S1A–D). To further investigate the quantitative performance of the EV assay, isolated PC3-derived EVs by ultracentrifugation were quantified using the EV assay based on the concentrations obtained by NTA. As shown in Figure 2C, the RCU value was found to greatly depend on the concentration of EVs, with a good linearity range ranging from 5.50 × 10⁴ to 8.80 × 10⁵ particles/μl (R2 = 0.9823). The limit of detection (LOD) calculated as three times of SD above the background (negative control) was 2.86 × 10⁴ particles/μl. Moreover, PC3-derived EVs were quantified by a standard procedure of a recovery test to evaluate the accuracy of the EV assay. The recovery rates of low, medium, and high concentrations of EVs were 85.45%, 95.45%, and 101.65%, respectively (Supplementary Table S2, left panels). In addition, three different concentrations of EVs were tested to evaluate the repeatability of the EV assay. The intra-assay coefficient of variation (intra-CV) and the inter-assay coefficient of variation (inter-CV) were less than 10% and 20%, respectively (Supplementary Table S2, left panels). The above results suggested an excellent analytical performance of our EV assay.
Then, we asked whether the EVEpCAM-CD9 could be used to infer the prostatic cell types, e.g., PCa cell lines (PC3 and LNCaP) and benign prostate epithelial cell line (RWPE-1). Hence, we obtained the EVs from the culture supernatant by ultracentrifugation and quantified the concentrations by our assay. As shown in Figure 2D, the concentrations of EVs derived from human PCa cell lines such as PC3 and LNCaP were significantly higher than that of the BPH cell line RWPE-1, which were consistent with the EV DensityEpCAM-CD9 from corresponding cell lines. Moreover, FBS-derived EVs exhibited negligible chemiluminescent signals in the assay. These results revealed that the concentration of EVEpCAM-CD9 can be a potential indicator for distinguishing cancerous cells from normal ones.
In the course of tumor expansion, cancer cells within the tumor microenvironment often have restricted access to nutrients and oxygen and thus were subjected to starvation and hypoxia (23). Previous reports have demonstrated that the levels of EVs carrying tumor-related proteins can be significantly elevated under such microenvironment, contributing to the regulation of tumor microenvironment, thus promoting tumor initiation, progression, and metastasis (24). However, EVEpCAM-CD9 derived from PCa cells under tumor microenvironment, which may be diagnostically beneficial in reflecting the pathological stage during PCa development, remained unknown.
Herein, we defined EVEpCAM-CD9 secretion index to describe the average amount of EVEpCAM-CD9 secreted per PC3 cell. As shown in Figure 2E, the EVEpCAM-CD9 secretion index was gradually elevated at the early stage of cell growth due to the initial activation of the cells in the latent phase. At 24–48 h, the PC3 cells entered the logarithmic growth phase, and the equative rate of increase between the amount of EVEpCAM-CD9 and PC3 cells resulted in a constant EVEpCAM-CD9 secretion index. Interestingly, however, when the cell reached the stationary phase after 48 h, the EVEpCAM-CD9 secretion index started increasing again. This may be a result of the inadequate living conditions in the microenvironment. Accordingly, we investigated the impact of some conditions (e.g., hypoxia and serum starvation) involved in such microenvironment on the EVEpCAM-CD9 secretion index. We observed higher EVEpCAM-CD9 secretion indexes when the PC3 cells were cultured under hypoxia and serum starvation compared with the controls (Figures 2F, G). Additionally, this trend can be reversed upon the treatment of the EV biogenesis inhibitor, such as GW4869 (Figure 2H). These results strongly support our hypothesis that EVEpCAM-CD9 can be a potential indicator in revealing the pathological status of PCa.
Urine can harbor PCa cell-derived EVs, as mentioned above. We thus investigated whether the urinary EpCAM-CD9-positive EVs (uEVEpCAM-CD9) can be detected using our EV assay. As shown in Supplementary Figure S2B, the protein profile from urine revealed the presence of EpCAM and CD9-positive EVs in PCa. Using a well-adopted EV protein assay, WB, uEVEpCAM-CD9 from less than 2 ml of urine volume was almost undetectable (Figure 3A). However, the uEVEpCAM-CD9 from even down to 125 μl of urine volume could be successfully detected by our CLIA, and the levels of uEVEpCAM-CD9 in the same urine volume were statistically distinguishable between the pooled samples from PCa and healthy controls (Figures 3B, C). In view of the significant differences between the cell supernatant and urine in the concentration and proportion of EVEpCAM-CD9, we optimized the methodology again. Additionally, in the clinical laboratory, it is not suitable to quantify EVs by NTA due to the requirement of the specialized equipment. And NTA may be biased toward certain particle size ranges (especially 50–150 nm), and large EVs (>400 nm) and very small EVs (<50 nm) are not well quantified by NTA. We thus used a simple and low-cost protein assay, BCA, as an alternative for EV quantification (25). As described in the Materials and Methods, we optimized the concentration of CD9 antibody and restructured the standard curve and corresponding performance evaluation. As shown in Figure 3D, the RCU value was found to greatly depend on the concentration of EVs, with a good linearity range ranging from 1.25 × 10⁻³ to 20.00 × 10⁻³ g/L (R2 = 0.9745) and a low detection limit, 0.60 × 10⁻³ g/L. The recovery test and repeatability test both performed excellently especially at the low level of uEVEpCAM-CD9 (Supplementary Table S2, right panels). Furthermore, uEVEpCAM-CD9 from nine randomly selected donors including five PCa and four HDs was assayed by the CLIA and WB, which suggested a significant elevation of uEVEpCAM-CD9 in PCa compared with HD (Figure 3E and Supplementary Figures S2C, D).
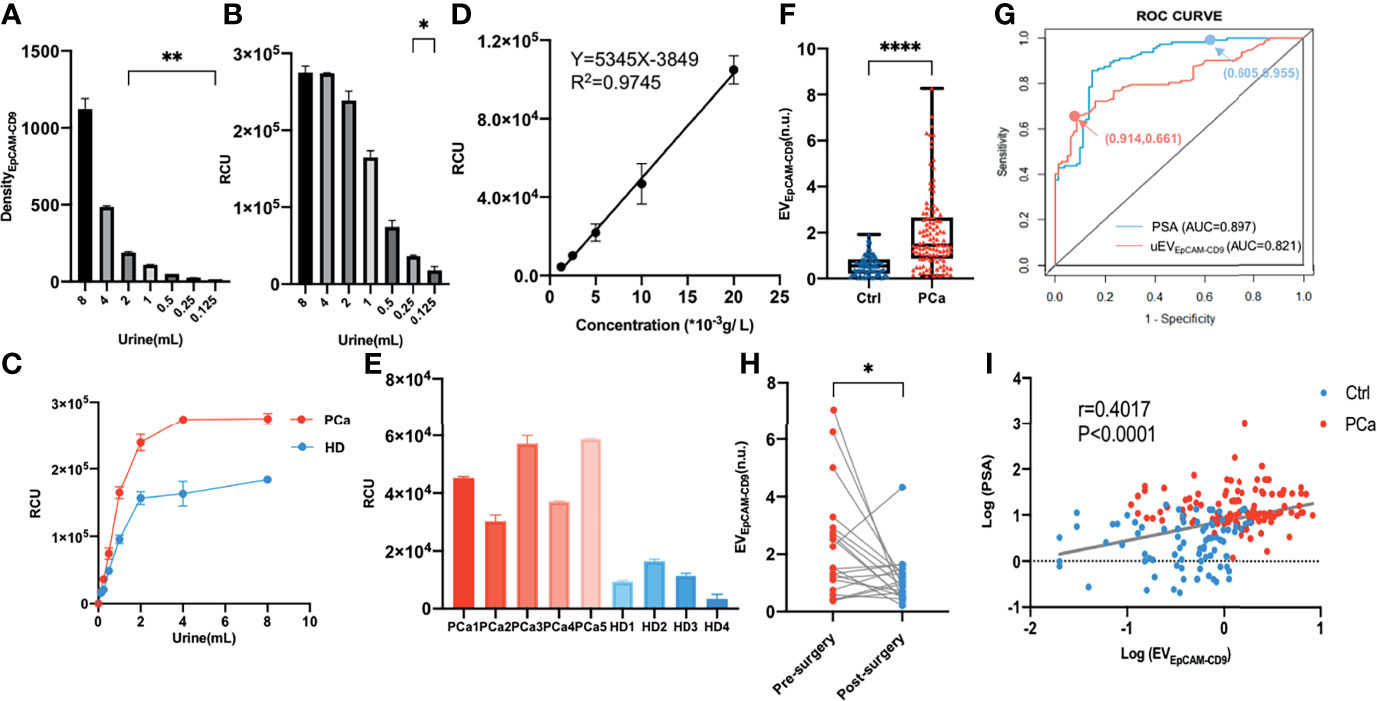
Figure 3 Urinary EpCAM-CD9-positive EV is a potential biomarker for PCa diagnosis. (A) The uEVEpCAM-CD9 in different urine volumes was detected by WB. (B) The uEVEpCAM-CD9 from different urine volumes was detected by our chemiluminescent immunoassay. (C) The uEVEpCAM-CD9 of the pooled samples from PCa and healthy controls were detected by EV assay. (D) A standard curve was for urinary EV quantification using our EV assay. (E) The uEVEpCAM-CD9 from nine randomly selected donors including five PCa and four HDs was assayed by the chemiluminescent immunoassay. (F) The levels of uEVEpCAM-CD9 was observed from men with PCa (n = 112) and without PCa (n = 81). (G) The ROC curve of uEVEpCAM-CD9 and PSA. (H) The uEVEpCAM-CD9 was detected before and after prostatectomy in 20 PCa patients. (I) The correlation between the uEVEpCAM-CD9 and PSA. DensityEpCAM-CD9, EpCAM-CD9 protein density; RCU, relative chemiluminescent unit; EVEpCAM-CD9, EpCAM-CD9-positive extracellular vesicles; Ctrl, control; PCa, prostate cancer; ROC, receiver operating characteristic; uEVEpCAM-CD9, urinary EpCAM-CD9-positive extracellular vesicles; PSA, prostate-specific antigen; AUC, area under the curve; HD, healthy donor. *P < 0.05,**P < 0.01,****P < 0.0001.
In the validation experiment, urine samples from a total of 193 participants were further enrolled, including 112 PCa patients, 55 BPH patients, and 26 HDs. Complete datasets were available in 193 men who underwent the first transrectal ultrasound (TRUS)-guided prostate biopsy, and the histologic subtypes of all the 112 PCa patients were identified as prostate adenocarcinoma and without any metastatic sites confirmed by computed tomography examinations. The clinical characteristics of all the participants were listed in Supplementary Table S1. A remarkably higher level of uEVEpCAM-CD9 was observed from men with PCa (1.46, IQR 0.86-2.66) than men without PCa (0.55, IQR 0.22-0.84) (Figure 3F). ROC curve showed that the diagnostic sensitivity and specificity of uEVEpCAM-CD9 was 66.07% and 91.36%, respectively (cutoff value: 1.130), and the area under the curve (AUC) was 0.821 (P < 0.0001), while the diagnostic sensitivity and specificity of PSA was 95.54% and 60.49%, respectively (cutoff value: 4.015), and the AUC was 0.897 (P < 0.0001) (Figure 3G). Moreover, there was a statistically significant correlation between uEVEpCAM-CD9 and Gleason grades in PCa patients (r = 0.215, 95% CI: 0.025–0.389, P = 0.023). Significant decreases of uEVEpCAM-CD9 were observed after prostatectomy in 20 PCa patients (Figure 3H). It also showed that uEVEpCAM-CD9 levels were positively associated with PSA (r = 0.402, 95% CI: 0.272–0.517, P < 0.0001), which was an important indicator for the diagnosis of PCa (Figure 3I).
Due to the results that uEVEpCAM-CD9 has high specificity and low sensitivity, while PSA is just the opposite (Figure 3G), we consider building a model combining uEVEpCAM-CD9 and PSA to better diagnose PCa. The training dataset (n = 116) and validation dataset (n = 77) had an even distribution in patient characteristics (Table 1). The predictive value of the uEVEpCAM-CD9 was analyzed using a logistic regression model. The odds ratio (OR) for each clinical factor and/or covariate in training sets was assessed by univariate logistic regression modeling. Age, uEVEpCAM-CD9, PSA, fPSA, f/T PSA, prostate volume (PV), and prostate-specific antigen density (PSAD) were statistically significant predictors of PCa (P < 0.001) on univariate logistic regression analysis (Table 2, left panels). Then, we compared varieties of multivariate diagnostic models employing different combinations of the variables assessed by their AUC in ROC curve analysis variables (Supplementary Table S3). The optimal multivariate model for diagnosing PCa should be selected on the basis of the complexity (numbers of variables) and prediction efficiency (AUC); we rationally selected the multivariate model containing the variable age, smoking, drinking, family history, BMI, uEVEpCAM-CD9, PSA, and PV as the final diagnostic model. The OR of each variable from the multivariate logistic regression analysis was presented in Table 2 (right panels).
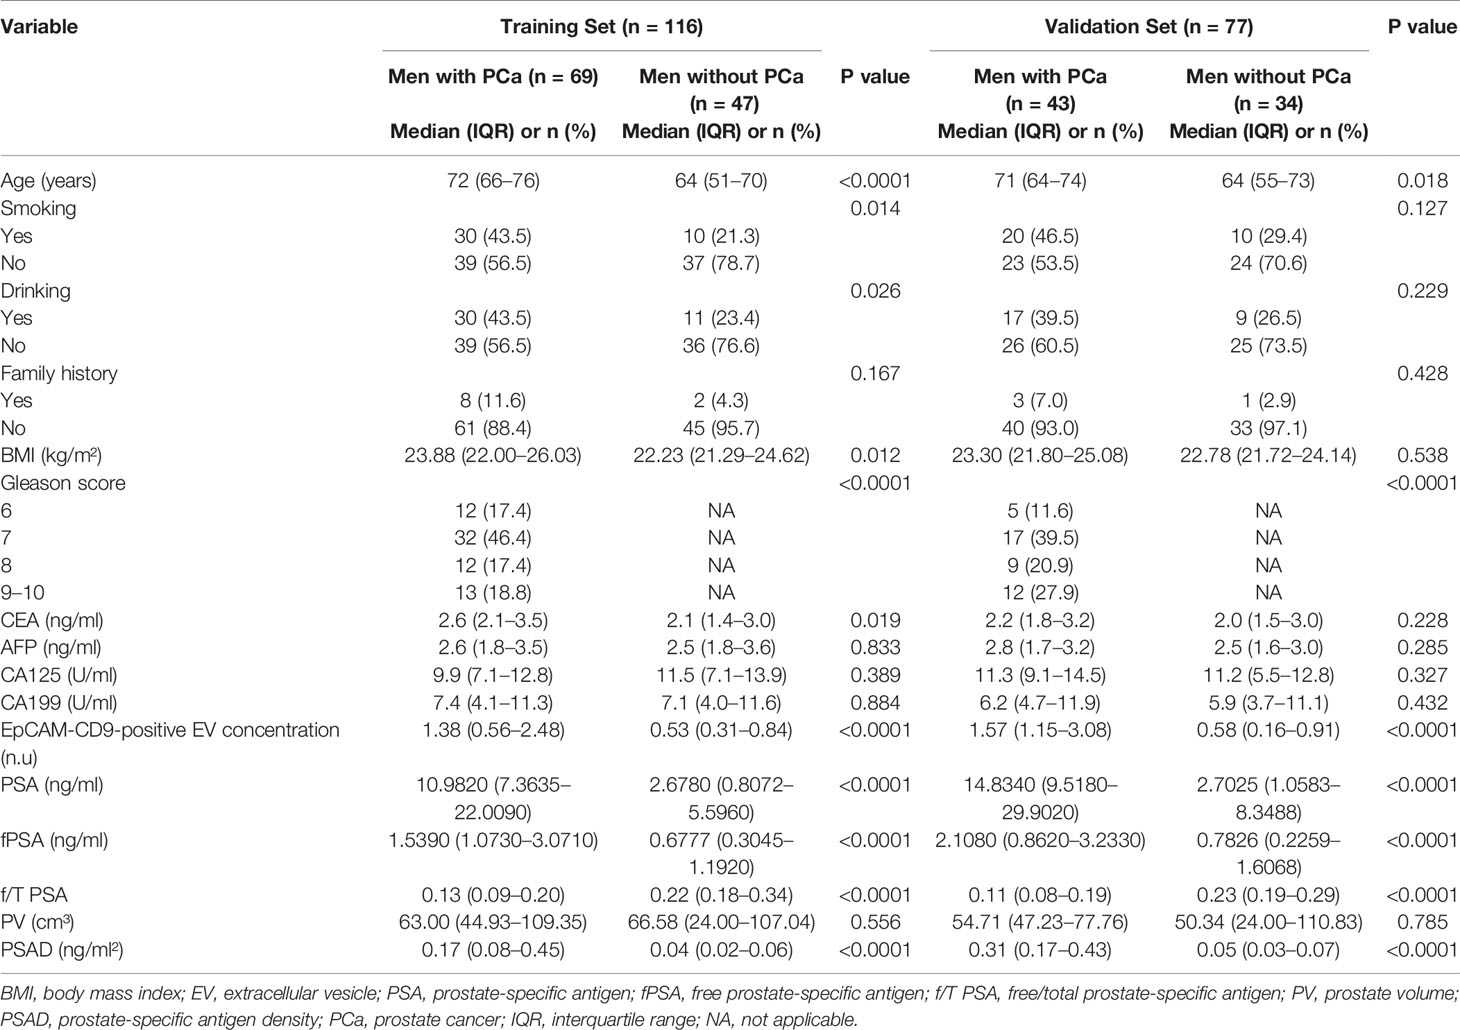
Table 1 Baseline characteristics of the training and validation cohorts.
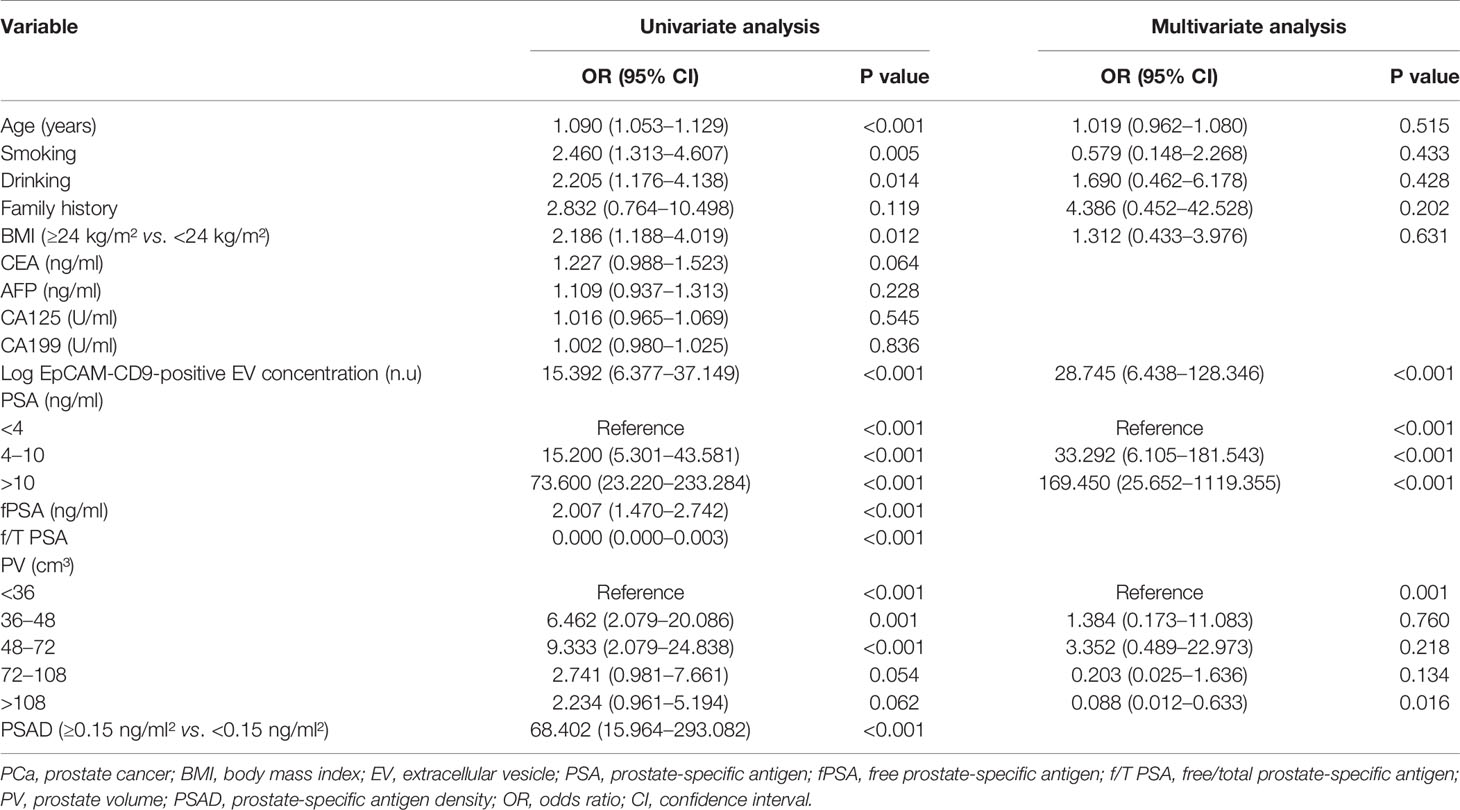
Table 2 Univariate analysis and multivariate analysis of potential predictors of PCa.
The nomogram was constructed according to the results of multivariate logistic regression (Figure 4A). In the ROC curve analysis, the AUC of the combined PCa diagnostic model was increased to 0.952 in the training set (Figure 4B). Moreover, the multivariate diagnostic model was perfectly in the internal validations, as the calibration curve showed good agreement between prediction and observation (Figure 4C). On DCA, by combining uEVEpCAM-CD9 with other clinical parameters, the combination model to predict PCa added more clinical overall benefit than that of uEVEpCAM-CD9 only (Figure 4D). When applied to the validation test, the model achieved an AUC of 0.947 (P < 0.0001) (Figure 4B). The AUC value revealed the high performance of PCa diagnosis using the combined nomogram. Additionally, in patients with PSA gray zone (4–10 ng/ml) including 23 PCa and 31 BPH, the model based on uEVEpCAM-CD9 showed a better diagnostic performance (AUC = 0.917, P < 0.0001) than the uEVEpCAM-CD9 only (AUC = 0.887, P < 0.0001) and the traditional biomarkers PSA (AUC = 0.712, P = 0.0018) (Figure 4E).
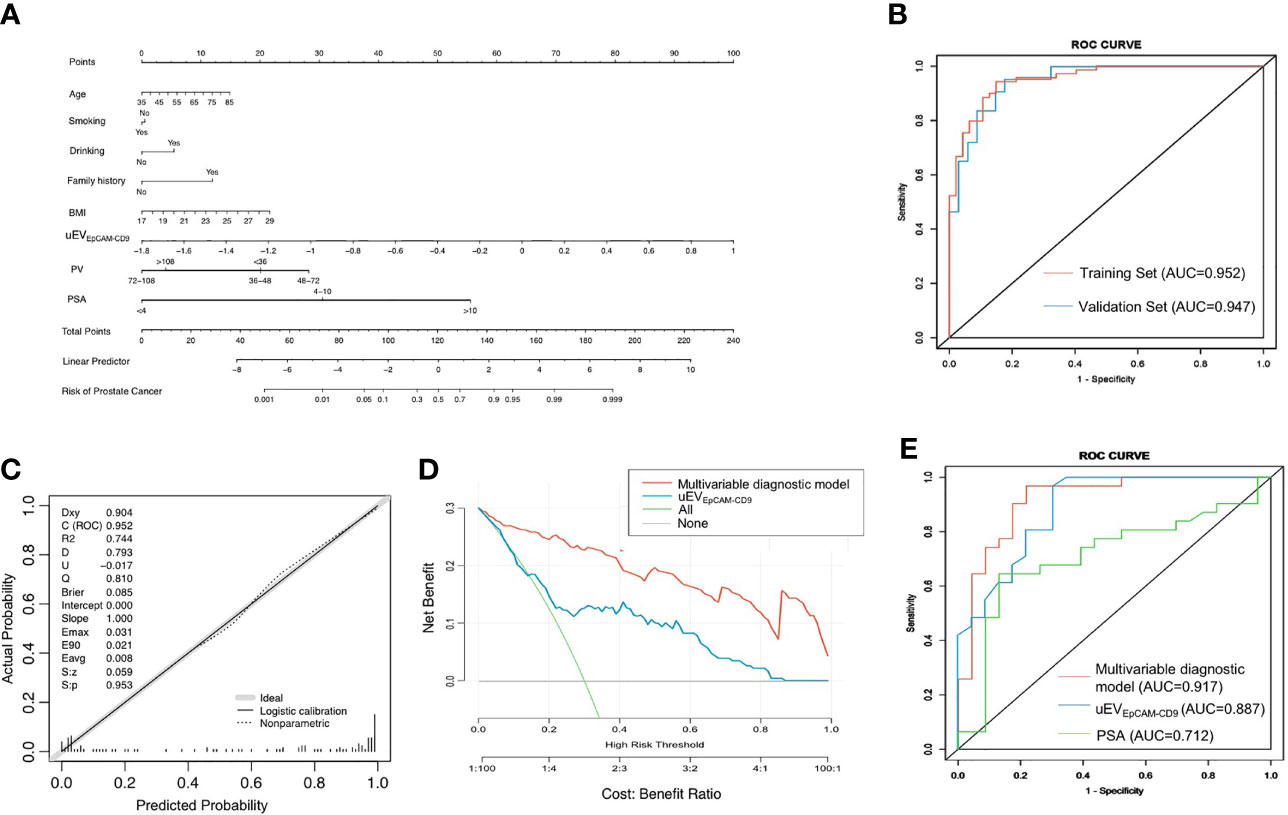
Figure 4 A multivariate diagnostic model based on uEVEpCAM-CD9 for PCa. (A) The nomogram was constructed according to the results of multivariate logistic regression. (B) The ROC curve analysis of the multivariable diagnostic model in the training set and validation set. (C) The multivariable diagnostic model was calibrated in the internal validations. (D) The decision curve analysis of the multivariable diagnostic model and uEVEpCAM-CD9. (E) The diagnostic performance of the model, uEVEpCAM-CD9, and PSA in patients with PSA gray zone (4–10 ng/ml) including 23 PCa and 31 BPH. BMI, body mass index; uEVEpCAM-CD9, Log urinary EpCAM-CD9-positive extracellular vesicles concentration (n.u); PV, prostate volume; PSA, prostate-specific antigen; ROC, receiver operating characteristic; AUC, area under the curve.
EVs represent a rich source of information in many liquid biopsy samples, including plasma, serum, and urine, since they are abundantly released by most tumors and are relatively stable in the biological fluids, whereas cell-free nucleic acids suffer rapid degradation and are always presented at low concentration (26). PCa cell-derived EVs in urine have been extensively studied recently and regarded as novel biomarkers for cancer diagnosis. However, the major concern about the use of EVs as biomarkers in the clinical laboratory is the difficulties in the characterization of EVs. Consequently, there will be essential interest in developing standardized sampling and analytical techniques for reliable and reproducible measurements. CLIA is a non-isotopic immunological technique that is increasingly used in ultramicroanalysis of biological substances owing to extreme sensitivity, high specificity, good reproducibility, and simplicity (27, 28). In this study, we proposed a chemiluminescent quantitative immunoassay of uEVEpCAM-CD9, requiring only a small volume of urine (125 μl) to perform an EV analysis, which is superior to WB and flow cytometry (29). The extremely low LOD of EpCAM revealed that it was possible to detect other non-abundant proteins on EVs by employing multiple antibody sets. Furthermore, the use of CLIA embodies the superiority that could be fully automated to reduce operator errors and bias and enhance its potential for clinical translation.
EpCAM (also known as CD326) is deemed as a cancer-associated marker, as it is always overexpressed in many human adenocarcinomas and squamous cell carcinomas (30). Besides, this expression often closely correlates with the epithelial–mesenchymal transition (EMT)-regulating tumor invasion and metastasis (31, 32): the tumor cells have been observed to undergo loss of EpCAM expression during EMT and release a large number of EpCAM-enriched EVs simultaneously (32, 33). The source and the underlying functions of these EVs in PCa, however, remain unknown. It has been suggested that the cancerous cells will proliferate more rapidly due to the dysregulated cell cycle resulting in a state of oxygen and nutrient deprivation, and adaptation to such microenvironments is pivotal to tumor growth (34). There is good evidence that many signaling pathways are involved to help the cells escape from stresses such as hypoxia and nutrient deprivation and determine cell growth, promotion, metastasis, hormone-refractory progression, and treatment outcome (35, 36). Additionally, previous studies have reported that higher numbers of EVs were secreted by cancer cells to offer a survival advantage to cells and promote cancer progression under hypoxia and serum starvation (37, 38). These EVs usually promoted the PCa aggressiveness by adhesion junction proteins that could enhance invasiveness and induce microenvironment changes (39). Thus, such mechanisms may account for the elevated levels of PCa cell-derived EVEpCAM-CD9 under simulated tumor microenvironment (such as hypoxia and serum starvation), as well as in PCa patients.
However, uEVEpCAM-CD9 was not prostate-specific; that is, it may be over-released by other urogenital tumors such as bladder and kidney and other non-urological cancers. Recalling that the levels are commonly very low in HDs and patients with BPH, our multivariate model employing uEVEpCAM-CD9, prostate tissue-specific protein (PSA), and other clinical parameters showed an enhanced diagnostic performance both in sensitivity and specificity. We also envision that by combining other cancer biomarkers, such as metabolites, RNAs or genetic signatures and medical imaging data could further provide more precise information regarding PCa diagnosis and localization.
Another limitation is the number of samples studied (n = 193). We only evaluated the diagnostic value of uEVEpCAM-CD9 in PCa, and it has not been evaluated in depth in other aspects, e.g., as a predictor in the development of castration-resistant prostate cancer (CRPC), an indicator for successful radiotherapy and chemotherapy. Besides, while EVEpCAM-CD9 can be released from different types of epithelial cancers and the diagnostic performance of uEVEpCAM-CD9 in these cancers remains poorly investigated, further large-scale studies will be warranted to fully evaluate the potential applications of uEVEpCAM-CD9 with regard to the diagnosis of varieties of cancers.
Urinary EpCAM-CD9-positive EVs were successfully quantified by our laboratory-developed CLIA, requiring only a small volume of urine (125 μl) to perform an EV analysis. Using this assay, we achieve a notable diagnostic performance by constructing a multivariate diagnostic model based on uEVEpCAM-CD9 and a tissue-specific biomarker PSA. Further validation studies are warranted and should also investigate before its clinical value can be confidently affirmed. In the future, this model may potentially be used to better select patients for prostate TRUS biopsy.
The raw data supporting the conclusions of this article will be made available by the authors without undue reservation.
The studies involving human participants were reviewed and approved by the Second Affiliated Hospital of Zhejiang University School of Medicine Ethical Committee. The patients/participants provided their written informed consent to participate in this study.
YD, YW, XW, and ZT planned the project, performed the research, analyzed the data, and wrote the article. YC, YS, and DW collected clinical samples. PY and LZ performed statistical analysis. ZL, YP, and GZ collected patient information and analyzed the data. All authors contributed to the article and approved the submitted version.
This study was supported by grants from the National Natural Science Foundation of China Youth Science Foundation Project (Grant no. 81902156) and Zhejiang Provincial Natural Science Foundation of China (Grant no. LQ21H160016).
The authors declare that the research was conducted in the absence of any commercial or financial relationships that could be construed as a potential conflict of interest.
All claims expressed in this article are solely those of the authors and do not necessarily represent those of their affiliated organizations, or those of the publisher, the editors and the reviewers. Any product that may be evaluated in this article, or claim that may be made by its manufacturer, is not guaranteed or endorsed by the publisher.
The Supplementary Material for this article can be found online at: https://www.frontiersin.org/articles/10.3389/fonc.2021.777684/full#supplementary-material
EpCAM, epithelial cell adhesion molecule; PCa, prostate cancer; PSA, prostate-specific antigen; EVs, extracellular vesicles; uEVEpCAM-CD9, urinary EpCAM-CD9-positive extracellular vesicles; AUC, area under the curve; TRUS, transrectal ultrasound; PCA3, prostate cancer antigen-3; TMPRSS2, transmembrane protease serine-2; GSTP1, glutathione S-transferase; uEVs, urinary extracellular vesicles; CLIA, chemiluminescent immunoassay; ACE, acridinium ester; EVEpCAM-CD9, EpCAM-CD9-positive extracellular vesicles; FBS, fetal bovine serum; BPH, benign prostatic hyperplasia; HD, healthy donor; PBS, phosphate-buffered saline; TEM, transmission electron microscope; NTA, nanoparticle tracking analysis; RIPA, radioimmunoprecipitation assay; SDS-PAGE, sodium dodecyl sulfate-polyacrylamide gel electrophoresis; PVDF, polyvinylidene difluoride; TBST, Tris-buffered saline with Tween-20; WB, western blot; HRP, horseradish peroxidase; DensityEpCAM-CD9, EpCAM-CD9 protein density; BCA, bicinchoninic acid; SD, standard deviation; IQR, interquartile range; ROC, receiver operating characteristic; DCA, decision curve analysis; RCU, relative chemiluminescent unit; LOD, limit of detection; intra-CV, intra-assay coefficient of variation; inter-CV, inter-assay coefficient of variation; CI, confidence interval; OR, odds ratio; fPSA, free prostate-specific antigen; f/T PSA, free/total prostate-specific antigen; PV, prostate volume; PSAD, prostate-specific antigen density; BMI, body mass index; EMT, epithelial–mesenchymal transition; CRPC, castration-resistant prostate cancer.
1. Sung H, Ferlay J, Siegel RL, Laversanne M, Soerjomataram I, Jemal A, et al. Global Cancer Statistics 2020: GLOBOCAN Estimates of Incidence and Mortality Worldwide for 36 Cancers in 185 Countries. CA Cancer J Clin (2021) 71:209–49. doi: 10.3322/caac.21660
2. Martin R, Donovan J, Turner E, Metcalfe C, Young G, Walsh E, et al. Effect of a Low-Intensity PSA-Based Screening Intervention on Prostate Cancer Mortality: The CAP Randomized Clinical Trial. JAMA (2018) 319:883–95. doi: 10.1001/jama.2018.0154
3. Brassell SA, Kao TC, Sun L, Moul JW. Prostate-Specific Antigen Versus Prostate-Specific Antigen Density as Predictor of Tumor Volume, Margin Status, Pathologic Stage, and Biochemical Recurrence of Prostate Cancer. Urology (2005) 66:1229–33. doi: 10.1016/j.urology.2005.06.106
4. Sanda M, Feng Z, Howard D, Tomlins S, Sokoll L, Chan D, et al. Association Between Combined TMPRSS2:ERG and PCA3 RNA Urinary Testing and Detection of Aggressive Prostate Cancer. JAMA Oncol (2017) 3:1085–93. doi: 10.1001/jamaoncol.2017.0177
5. Crawford E, Rove K, Trabulsi E, Qian J, Drewnowska K, Kaminetsky J, et al. Diagnostic Performance of PCA3 to Detect Prostate Cancer in Men With Increased Prostate Specific Antigen: A Prospective Study of 1,962 Cases. J Urol (2012) 188:1726–31. doi: 10.1016/j.juro.2012.07.023
6. Laxman B, Tomlins S, Mehra R, Morris D, Wang L, Helgeson B, et al. Noninvasive Detection of TMPRSS2:ERG Fusion Transcripts in the Urine of Men With Prostate Cancer. Neoplasia (New York NY) (2006) 8:885–8. doi: 10.1593/neo.06625
7. Van Neste L, Partin A, Stewart G, Epstein J, Harrison D, Van Criekinge W. Risk Score Predicts High-Grade Prostate Cancer in DNA-Methylation Positive, Histopathologically Negative Biopsies. Prostate (2016) 76:1078–87. doi: 10.1002/pros.23191
8. Davey M, Benzina S, Savoie M, Breault G, Ghosh A, Ouellette R. Affinity Captured Urinary Extracellular Vesicles Provide mRNA and miRNA Biomarkers for Improved Accuracy of Prostate Cancer Detection: A Pilot Study. Int J Mol Sci (2020) 21:8330. doi: 10.3390/ijms21218330
9. Kohaar I, Chen Y, Banerjee S, Borbiev T, Kuo H, Ali A, et al. A Urine Exosome Gene Expression Panel Distinguishes Between Indolent and Aggressive Prostate Cancers at Biopsy. J Urol (2021) 205:420–5. doi: 10.1097/ju.0000000000001374
10. Merchant M, Rood I, Deegens J, Klein J. Isolation and Characterization of Urinary Extracellular Vesicles: Implications for Biomarker Discovery. Nat Rev Nephrol (2017) 13:731–49. doi: 10.1038/nrneph.2017.148
11. Pisitkun T, Shen R, Knepper M. Identification and Proteomic Profiling of Exosomes in Human Urine. Proc Natl Acad Sci USA (2004) 101:13368–73. doi: 10.1073/pnas.0403453101
12. Gonzales P, Pisitkun T, Hoffert J, Tchapyjnikov D, Star R, Kleta R, et al. Large-Scale Proteomics and Phosphoproteomics of Urinary Exosomes. J Am Soc Nephrol: JASN (2009) 20:363–79. doi: 10.1681/asn.2008040406
13. Moon P, You S, Lee J, Hwang D, Baek M. Urinary Exosomes and Proteomics. Mass Spectromet Rev (2011) 30:1185–202. doi: 10.1002/mas.20319
14. Gires O, Pan M, Schinke H, Canis M, Baeuerle P. Expression and Function of Epithelial Cell Adhesion Molecule EpCAM: Where Are We After 40 Years? Cancer Metastasis Rev (2020) 39:969–87. doi: 10.1007/s10555-020-09898-3
15. Fagotto F, Aslemarz A. EpCAM Cellular Functions in Adhesion and Migration, and Potential Impact on Invasion: A Critical Review. Biochim Biophys Acta Rev Cancer (2020) 1874:188436. doi: 10.1016/j.bbcan.2020.188436
16. Miller M, Doyle G, Terstappen L. Significance of Circulating Tumor Cells Detected by the CellSearch System in Patients With Metastatic Breast Colorectal and Prostate Cancer. J Oncol (2010) 2010:617421. doi: 10.1155/2010/617421
17. Pu K, Li C, Zhang N, Wang H, Shen W, Zhu Y. Epithelial Cell Adhesion Molecule Independent Capture of Non-Small Lung Carcinoma Cells With Peptide Modified Microfluidic Chip. Biosensors Bioelectron (2017) 89:927–31. doi: 10.1016/j.bios.2016.09.092
18. Wei P, Wu F, Kang B, Sun X, Heskia F, Pachot A, et al. Plasma Extracellular Vesicles Detected by Single Molecule Array Technology as a Liquid Biopsy for Colorectal Cancer. J Extracell Vesicles (2020) 9:1809765. doi: 10.1080/20013078.2020.1809765
19. Sunkara V, Kim C, Park J, Woo H, Kim D, Ha H, et al. Fully Automated, Label-Free Isolation of Extracellular Vesicles From Whole Blood for Cancer Diagnosis and Monitoring. Theranostics (2019) 9:1851–63. doi: 10.7150/thno.32438
20. Théry C, Witwer K, Aikawa E, Alcaraz M, Anderson J, Andriantsitohaina R, et al. Minimal Information for Studies of Extracellular Vesicles 2018 (MISEV2018): A Position Statement of the International Society for Extracellular Vesicles and Update of the MISEV2014 Guidelines. J Extracell Vesicles (2018) 7:1535750. doi: 10.1080/20013078.2018.1535750
21. Wang Y, Liu Z, Wang X, Dai Y, Li X, Gao S, et al. Rapid and Quantitative Analysis of Exosomes by a Chemiluminescence Immunoassay Using Superparamagnetic Iron Oxide Particles. J BioMed Nanotechnol (2019) 15:1792–800. doi: 10.1166/jbn.2019.2809
22. Osteikoetxea X, Sódar B, Németh A, Szabó-Taylor K, Pálóczi K, Vukman K, et al. Differential Detergent Sensitivity of Extracellular Vesicle Subpopulations. Organic Biomol Chem (2015) 13:9775–82. doi: 10.1039/c5ob01451d
23. Han L, Lam E, Sun Y. Extracellular Vesicles in the Tumor Microenvironment: Old Stories, But New Tales. Mol Cancer (2019) 18:59. doi: 10.1186/s12943-019-0980-8
24. Maacha S, Bhat A, Jimenez L, Raza A, Haris M, Uddin S, et al. Extracellular Vesicles-Mediated Intercellular Communication: Roles in the Tumor Microenvironment and Anti-Cancer Drug Resistance. Mol Cancer (2019) 18:55. doi: 10.1186/s12943-019-0965-7
25. Lötvall J, Hill A, Hochberg F, Buzás E, Di Vizio D, Gardiner C, et al. Minimal Experimental Requirements for Definition of Extracellular Vesicles and Their Functions: A Position Statement From the International Society for Extracellular Vesicles. J Extracell Vesicles (2014) 3:26913. doi: 10.3402/jev.v3.26913
26. Neumann M, Bender S, Krahn T, Schlange T. ctDNA and CTCs in Liquid Biopsy - Current Status and Where We Need to Progress. Comput Struct Biotechnol J (2018) 16:190–5. doi: 10.1016/j.csbj.2018.05.002
27. Zhao L, Sun L, Chu X. Chemiluminescence Immunoassay. TrAC Trends Anal Chem (2009) 28:404–15. doi: 10.1016/j.trac.2008.12.006
28. Akhavan-Tafti H, Binger DG, Blackwood JJ, Chen Y, Creager RS, de Silva R, et al. A Homogeneous Chemiluminescent Immunoassay Method. J Am Chem Soc (2013) 135:4191–4. doi: 10.1021/ja312039k
29. Campos-Silva C, Suárez H, Jara-Acevedo R, Linares-Espinós E, Martinez-Piñeiro L, Yáñez-Mó M, et al. High Sensitivity Detection of Extracellular Vesicles Immune-Captured From Urine by Conventional Flow Cytometry. Sci Rep (2019) 9:2042. doi: 10.1038/s41598-019-38516-8
30. Went P, Lugli A, Meier S, Bundi M, Mirlacher M, Sauter G, et al. Frequent EpCam Protein Expression in Human Carcinomas. Hum Pathol (2004) 35:122–8. doi: 10.1016/j.humpath.2003.08.026
31. Sankpal NV, Fleming TP, Sharma PK, Wiedner HJ, Gillanders WE. A Double-Negative Feedback Loop Between EpCAM and ERK Contributes to the Regulation of Epithelial-Mesenchymal Transition in Cancer. Oncogene (2017) 36:3706–17. doi: 10.1038/onc.2016.504
32. Gao J, Yan Q, Wang J, Liu S, Yang X. Epithelial-To-Mesenchymal Transition Induced by TGF-Beta1 Is Mediated by AP1-Dependent EpCAM Expression in MCF-7 Cells. J Cell Physiol (2015) 230:775–82. doi: 10.1002/jcp.24802
33. Ye X, Tam W, Shibue T, Kaygusuz Y, Reinhardt F, Ng Eaton E, et al. Distinct EMT Programs Control Normal Mammary Stem Cells and Tumour-Initiating Cells. Nature (2015) 525:256–60. doi: 10.1038/nature14897
34. Kalaany N, Sabatini D. Tumours With PI3K Activation Are Resistant to Dietary Restriction. Nature (2009) 458:725–31. doi: 10.1038/nature07782
35. Fraga A, Ribeiro R, Príncipe P, Lopes C, Medeiros R. Hypoxia and Prostate Cancer Aggressiveness: A Tale With Many Endings. Clin Genitourin Cancer (2015) 13:295–301. doi: 10.1016/j.clgc.2015.03.006
36. Li X, Lao Y, Zhang H, Wang X, Tan H, Lin Z, et al. The Natural Compound Guttiferone F Sensitizes Prostate Cancer to Starvation Induced Apoptosis via Calcium and JNK Elevation. BMC Cancer (2015) 15:254. doi: 10.1186/s12885-015-1292-z
37. Panigrahi GK, Praharaj PP, Peak TC, Long J, Singh R, Rhim JS, et al. Hypoxia-Induced Exosome Secretion Promotes Survival of African-American and Caucasian Prostate Cancer Cells. Sci Rep (2018) 8:3853. doi: 10.1038/s41598-018-22068-4
38. Umezu T, Tadokoro H, Azuma K, Yoshizawa S, Ohyashiki K, Ohyashiki J. Exosomal miR-135b Shed From Hypoxic Multiple Myeloma Cells Enhances Angiogenesis by Targeting Factor-Inhibiting HIF-1. Blood (2014) 124:3748–57. doi: 10.1182/blood-2014-05-576116
Keywords: extracellular vesicle, EpCAM, chemiluminescent immunoassay, prostate cancer, multivariate diagnostic model
Citation: Dai Y, Wang Y, Cao Y, Yu P, Zhang L, Liu Z, Ping Y, Wang D, Zhang G, Sang Y, Wang X and Tao Z (2021) A Multivariate Diagnostic Model Based on Urinary EpCAM-CD9-Positive Extracellular Vesicles for Prostate Cancer Diagnosis. Front. Oncol. 11:777684. doi: 10.3389/fonc.2021.777684
Received: 15 September 2021; Accepted: 29 October 2021;
Published: 24 November 2021.
Edited by:
Antonina Mitrofanova, Rutgers, The State University of New Jersey, United StatesReviewed by:
Bilal A. Siddiqui, University of Texas MD Anderson Cancer Center, United StatesCopyright © 2021 Dai, Wang, Cao, Yu, Zhang, Liu, Ping, Wang, Zhang, Sang, Wang and Tao. This is an open-access article distributed under the terms of the Creative Commons Attribution License (CC BY). The use, distribution or reproduction in other forums is permitted, provided the original author(s) and the copyright owner(s) are credited and that the original publication in this journal is cited, in accordance with accepted academic practice. No use, distribution or reproduction is permitted which does not comply with these terms.
*Correspondence: Zhihua Tao, enJ0emhAemp1LmVkdS5jbg==; Xuchu Wang, d2FuZ3hjQHpqdS5lZHUuY24=
†These authors have contributed equally to this work
Disclaimer: All claims expressed in this article are solely those of the authors and do not necessarily represent those of their affiliated organizations, or those of the publisher, the editors and the reviewers. Any product that may be evaluated in this article or claim that may be made by its manufacturer is not guaranteed or endorsed by the publisher.
Research integrity at Frontiers
Learn more about the work of our research integrity team to safeguard the quality of each article we publish.