 Huimin Li1,2
 Jianbin Li
 Yingjie Zhang
 Liang Xu
- 1Weifang Medical University, Weifang, China
- 2Department of Respiratory and Neurology, The Affiliated Tumor Hospital of Xinjiang Medical University, Urumqi, China
- 3Department of Radiation Oncology, Shandong Cancer Hospital and Institute, Shandong First Medical University and Shandong Academy of Medical Sciences, Jinan, China
- 4Department of Positron Emission Tomography-Computed Tomograph (PET-CT), Shandong Cancer Hospital and Institute, Shandong First Medical University and Shandong Academy of Medical Sciences, Jinan, China
- 5Department of Medical Imaging, Shandong Cancer Hospital and Institute, Shandong First Medical University and Shandong Academy of Medical Sciences, Jinan, China
Background and Purpose: This study aimed to evaluate the geometrical differences in and metabolic parameters of 18F-fluorodeoxyglucose positron emission tomography–computed tomography (18F-FDG PET-CT) and diffusion-weighted magnetic resonance imaging (DW-MRI) performed before and during radiotherapy (RT) for patients with esophageal cancer based on the three-dimensional CT (3DCT) medium and explore whether the high signal area derived from DW-MRI can be used as a tool for an individualized definition of the volume in need of dose escalation for esophageal squamous cancer.
Materials and Methods: Thirty-two patients with esophageal squamous cancer sequentially underwent repeated 3DCT, 18F-FDG PET-CT, and enhanced MRI before the initiation of RT and after the 15th fraction. All images were fused with 3DCT images through deformable registration. The gross tumor volume (GTV) was delineated based on PET Edge on the first and second PET-CT images and defined as GTVPETpre and GTVPETdur, respectively. GTVDWIpre and GTVDWIdur were delineated on the first and second DWI and corresponding T2-weighted MRI (T2W-MRI)-fused images. The maximum, mean, and peak standardized uptake values (SUVs; SUVmax, SUVmean, and SUVpeak, respectively); metabolic tumor volume (MTV); and total lesion glycolysis(TLG) and its relative changes were calculated automatically on PET. Similarly, the minimum and mean apparent diffusion coefficient (ADC; ADCmin and ADCmean) and its relative changes were measured manually using ADC maps.
Results: The volume of GTVCT exhibited a significant positive correlation with that of GTVPET and GTVDWI (both p < 0.001). Significant differences were observed in both ADCs and 18F-FDG PET metabolic parameters before and during RT (both p < 0.001). No significant correlation was observed between SUVs and ADCs before and during RT (p = 0.072–0.944) and between ∆ADCs and ∆SUVs (p = 0.238–0.854). The conformity index and degree of inclusion of GTVPETpre to GTVDWIpre were significantly higher than those of GTVPETdur to GTVDWIdur (both p < 0.001). The maximum diameter shrinkage rate (∆LDDWI) (24%) and the tumor volume shrinkage rate (VRRDWI) (60%) based on DW-MRI during RT were significantly greater than the corresponding PET-based ∆LDPET (14%) and VRRPET (41%) rates (p = 0.017 and 0.000, respectively).
Conclusion: Based on the medium of CT images, there are significant differences in spatial position, biometabolic characteristics, and the tumor shrinkage rate for GTVs derived from 18F-FDG PET-CT and DW-MRI before and during RT for esophageal squamous cancer. Further studies are needed to determine if DW-MRI will be used as tool for an individualized definition of the volume in need of dose escalation.
Introduction
Radiotherapy—one of the main effective and relatively safe treatment modalities—is now fully integrated in the multidisciplinary treatment of esophageal cancer (EC). Currently, with substantial evidence, radiotherapy can be applied as a sole treatment or as part of a comprehensive treatment in combination with systemic treatments such as surgery, chemotherapy, targeted therapy, and, more recently, immunotherapy (1). Regional recurrence accounts for most radiation treatment failures in EC cases, with a local relapse rate of 40% (2). In particular, 90% of locoregional failures after definitive chemoradiotherapy (dCRT) occurred within the gross tumor volume (GTV) (3). Hence, there is an urgent need to escalate the radiation dose to the area at highest risk of recurrence to improve locoregional control. Currently, there is a growing interest in the delivery of intensity-modulated radiotherapy (IMRT)-based late course boost or simultaneously integrated boost techniques (4, 5), which could selectively deliver high radiation doses to radioresistant regions and a relatively low dose to subclinical tissues.
Currently, metabolic and functional imaging modalities such as 18F-fluorodeoxyglucose positron emission tomography–computed tomography (18F-FDG PET-CT) and diffusion-weighted magnetic resonance imaging (DW-MRI) are gaining increasing clinical significance in the management of patients undergoing radiotherapy since these allow visualization and quantification of treatment-induced changes on a molecular level before volumetric changes become apparent (6–8). It is well known that PET-based parameters such as standardized uptake value (SUV), metabolic tumor volume (MTV), and total lesion glycolysis (TLG) have been established and validated as prognostic biomarkers in EC (8, 9). Escalating the radiation dose to 64.8 Gy, which had been previously established, failed to improve survival or locoregional control (10). It is warranted to explore potential tools for an individualized definition of the volume in need of dose escalation. The current analysis demonstrates that high FDG uptake on initial PET-CT can identify tumor areas at high risk of relapse in EC (9, 11). Another study by Yu et al. (5) showed that the FDG hotspot within the residual area was completely within the GTV and remained stable during RT. They also reported that adaptive RT based on target volume reduction assessed on PET-CT could facilitate dose escalation up to 70 Gy, with a 1-year overall survival and local control of 69.2% and 77.4%, respectively. Therefore, it is feasible and safe to select boosting of high 18F-FDG uptake zones within the tumor based on FDG PET-CT for the definition of the volume in need of dose escalation.
However, repeated PET imaging has not been widely adopted regardless of its clinical benefit owing to radiation exposure and uncertain segmentation algorithms obtained during PET (12, 13). In contrast, considering patient acceptability, repeated MRI is generally well tolerated for response assessment (14). High-resolution MRI for target volume delineation and response assessment in EC is currently of immense clinical interest (15, 16). The apparent diffusion coefficient (ADC) map from DW-MRI is a quantitative measure for the motion of water molecules and inversely correlates with tissue density. Relevant studies have shown that lower ADC values were associated with a higher histological grade and aggressiveness (17). Furthermore, it has been recently recognized that relative ADC changes from baseline to interim DW-MRI scans can help identify pathologic response in EC patients (7). Hence, we could theoretically observe the feasibility of selective boosting of the high signal areas of EC based on DW-MRI for definition of the volume in need of dose escalation.
Currently, selective boosting of high 18F-FDG uptake zones based on FDG PET-CT within the tumor has been suggested for radioresistance (5, 9, 11). To date, CT imaging of the tumor extension remains the gold standard for target volume contouring and plan evaluation. Therefore, based on the medium of CT images, we evaluated the spatial position and functional parameters of 18F-FDG PET-CT and DW-MRI performed before and during radiotherapy in patients with esophageal squamous carcinoma. The aim of this study was to explore whether the high signal area derived from DW-MRI can be used as tool for an individualized definition of the volume in need of dose escalation for esophageal squamous cancer.
Materials and Methods
Patient Selection and Characteristics
After receiving approval from the local research ethics committee, a total of 35 patients with newly diagnosed, biopsy-proven, nonmetastatic esophageal squamous cancer suitable for concurrent chemoradiotherapy were recruited for this prospective study between November 2016 and May 2020. All patients scheduled to receive neoadjuvant or definitive chemoradiation for EC underwent 3DCT, 18F-FDG PET-CT, and MRI simulation scanning prior to the initiation of RT and after 15 fractions of RT. Written informed consent was obtained from every patient included in this study. Patients were excluded if either pre-RT 18F-FDG PET-CT or DW-MRI data were not available (n = 1), the volume of the tumor on baseline metabolic imaging was extremely small (≤1 cm3) (n = 1), or they did not complete RT (n = 1). Consequently, image data of 32 patients were available for analysis. Patient and treatment characteristics are presented in Table 1.
Table 1 Patient and treatment characteristics.
Image Simulation and Acquisition
Each patient underwent contrast-enhanced CT using a 16-slice CT scanner (Philips Brilliance Bores CT, Cleveland, OH, USA), with a 3-mm slice thickness during free breathing. All patients were scanned in the supine position, followed by laser alignment. The 18F-FDG PET–CT examinations were performed within 2 weeks before the initiation of RT (PETpre) and after 15 fractions (median 27 Gy, 1.8 Gy per fraction) of RT (PETdur). Following CT, PETpre was performed from the proximal thigh to the base of the skull in 3D acquisition mode with 2–5 min per bed position, while PETdur was acquired from the skull base to the diaphragm. PET images were reconstructed using iterative 3D reconstruction.
Patients underwent MRI scanning with anatomical (T2-weighted) and functional (diffusion-weighted) MRI sequences at the same two time points as that for 18F-FDG PET-CT. MRI examinations were performed on a 3.0-T scanner equipped with a 32-tunnel body phased-array coil (Discovery MR 750, GE Medical Systems, Milwaukee, WI, USA). Patients were scanned in the supine position, with arms parallel to the body for both pre- and mid-RT scanning. Transverse DW images were obtained under free breathing conditions with the following scan parameters: repetition time (TR) 13,333 ms, echo time (TE) 64 ms, acquisition matrix 128 × 128 mm, field of view (FOV) 500 × 500 mm, slice thickness = 3.6 mm, and NEX 5. A diffusion-sensitive gradient b-value of 600 s/mm2 was applied for DWI. T2W-MRI adopts fast spin echo to scan cross and axial sections, with the following specific parameters: TR 12,000 ms, TE 84 ms, thickness and spacing 3 mm, FOV 500 × 500 mm, acquisition matrix 384 × 384, and NEX 1.8. Additionally, conventional T2W-MR images were obtained using pulse and respiratory gating techniques to trigger scanning exclusively during the end of expiration (18).
Image Registration and Target Delineation
The 18F-FDG PET-CT and MR images were registered to the planning CT using deformable image registration (DIR) in the software MIM Vista® (MIM Software Inc., version 6.8.3, Cleveland, OH, USA). The main role of DIR is to define spatial correspondence between two considered image sets. To ensure the accuracy and repeatability of the delineation of target volumes, all structures were delineated by the same experienced radiation oncologist according to the consensus guidelines. GTVs were manually contoured on the first and second planning CT images, referred to as GTVCTpre and GTVCTdur, with a mediastinal window (window width = 400 HU, window level = 40 HU) setting and by the following standards: the GTVs were defined as any enlargement of the esophagus over its standard dimensions, 5 mm for wall thickness and 10 mm for wall diameter. On the basis of the reconstructed 18F-FDG PET-CT image, given that no single absolute and relative methods of PET-based target volume delineation were validated, a gradient-based segmentation algorithm (PETEdge) was applied, which identified tumors on the basis of changes in intensity/activity concentration at the tumor borders (19). The GTVs based on the first and second PET-CT images were determined using thresholds of PETEdge and defined as GTVPETpre and GTVPETdur, respectively. All noncancerous regions within the GTVPET, including areas overlaid by the heart, bone, and great vessels, were corrected to be excluded manually with the help of the CT component of PET-CT. Similarly, GTVDWIpre and GTVDWIdur were delineated on the first and second DWI and corresponding T2-weighted MRI-fused images.
Functional Parameter Extraction
Images were analyzed and measured by two observers (a senior radiologist and an imaging physician in diagnostic PET/MRI) who were blinded to the histopathological results. Regions of interest (ROIs) were automatically drawn on the first and second PET based on PETEdge and were modified to exclude any overlap with the heart, bone, and great vessels on CT images of PET-CT. The maximum, mean, and peak standardized uptake values (SUVmax, SUVmean, and SUVpeak, respectively), MTV, and TLG were calculated automatically using the MIM software. TLG is defined as MTV from PET multiplied by SUVmean within that volume (20).
For ADC measurements, an ADC map in grayscale was automatically generated in DW-MRI using ADW 4.7 Workstation (GE Healthcare, Waukesha, WI, USA). The manifested largest and clearest sections of esophageal lesions were selected as the ROIs. Subsequently, ROIs on the DWI and corresponding T2-weighted MRI fused images were edited manually by two physicians in consensus to ensure that areas of hemorrhage, necrosis, edema, cystic change, and normal vessels were excluded. Finally, through the MIM software, the positions of ROIs on the ADC map were set to the same layers and locations prior to RT and after the 15th treatment cycle. The mean and minimum ADCs (ADCmean and ADCmin, respectively) of the lesion were automatically calculated. The relative changes in percent (∆%) of these 18F-FDG PET-CT and DW-MRI parameters (i.e., ∆ADCs, ∆SUVs, ∆MTV, and ∆TLG) between baseline scans and scans during RT were calculated.
Overlap Analysis
To quantify the overlap between PET-CT- and DW-MRI-based delineations before and during RT, the conformity index (CI) and degree of inclusion (DI) were calculated for GTVPETpre and GTVDWIpre and GTVPETdur and GTVDWIdur, respectively. The CI of volume A and B (CI[A, B]) was computed according to that described in a study by Struikmans et al. (21). A CI of 1 indicates 100% agreement between GTVs, and a CI of 0 indicates no overlap in delineation. The formula was as follows:
The definition of DI of volume A included in volume B (DI[A in B]) was the intersection between volume A and volume B divided by volume A (22). The DI was defined as follows:
Tumor Shrinkage Analysis
Based on the Response Evaluation Criteria in Solid Tumors version 1.1, measurements of tumor volume and tumor maximal diameters were performed on PET-CT or MR images prior to and during RT. Four diameters measured on the first and second PET and DWI images were defined as LDPETpre and LDPETdur and LDDWIpre and LDDWIdur, respectively. The percentage maximum diameter shrinkage rate (∆LD) was calculated using the following equation:
By the same method, the volume reduction rate (VRR) was calculated as follows:
Statistical Analysis
Statistical analysis was performed using SPSS 21.0 software (IBM Corp, Armonk, NY, USA). Data with skewed distribution are presented as medians with ranges. The Wilcoxon signed-rank test was used to compare the target volumes and relevant parameters. Spearman’s rank correlation analysis was performed to analyze the relativity between SUVs and ADCs. A p-value <0.05 indicated statistical significance.
Results
Correlation Analysis of GTVs and GTVCT
The volume of GTVCTpre was 26.34 (4.50–118.71) cm3, leading to a significantly positive correlation with both GTVPETpre (Figure 1A) and GTVDWIpre (Figure 1D) (r = 0.763 and r = 0.809, both p < 0.001). The volume of GTVCTdur was 16.74 (2.92–57.13) cm3 and exhibited a significant positive correlation with both GTVPETdur (Figure 1B) and GTVDWIdur (Figure 1E) (r = 0.826 and r = 0.703, both p< 0.001). Similarly, the relative changes in the volume of PET-CT and DW-MRI (∆GTVPET, ∆GTVDWI) before and during RT demonstrated a significantly positive correlation with that of CT (∆GTVCT) before and during RT (r = 0.616 and r = 0.716, both p < 0.001) (Figure 1).
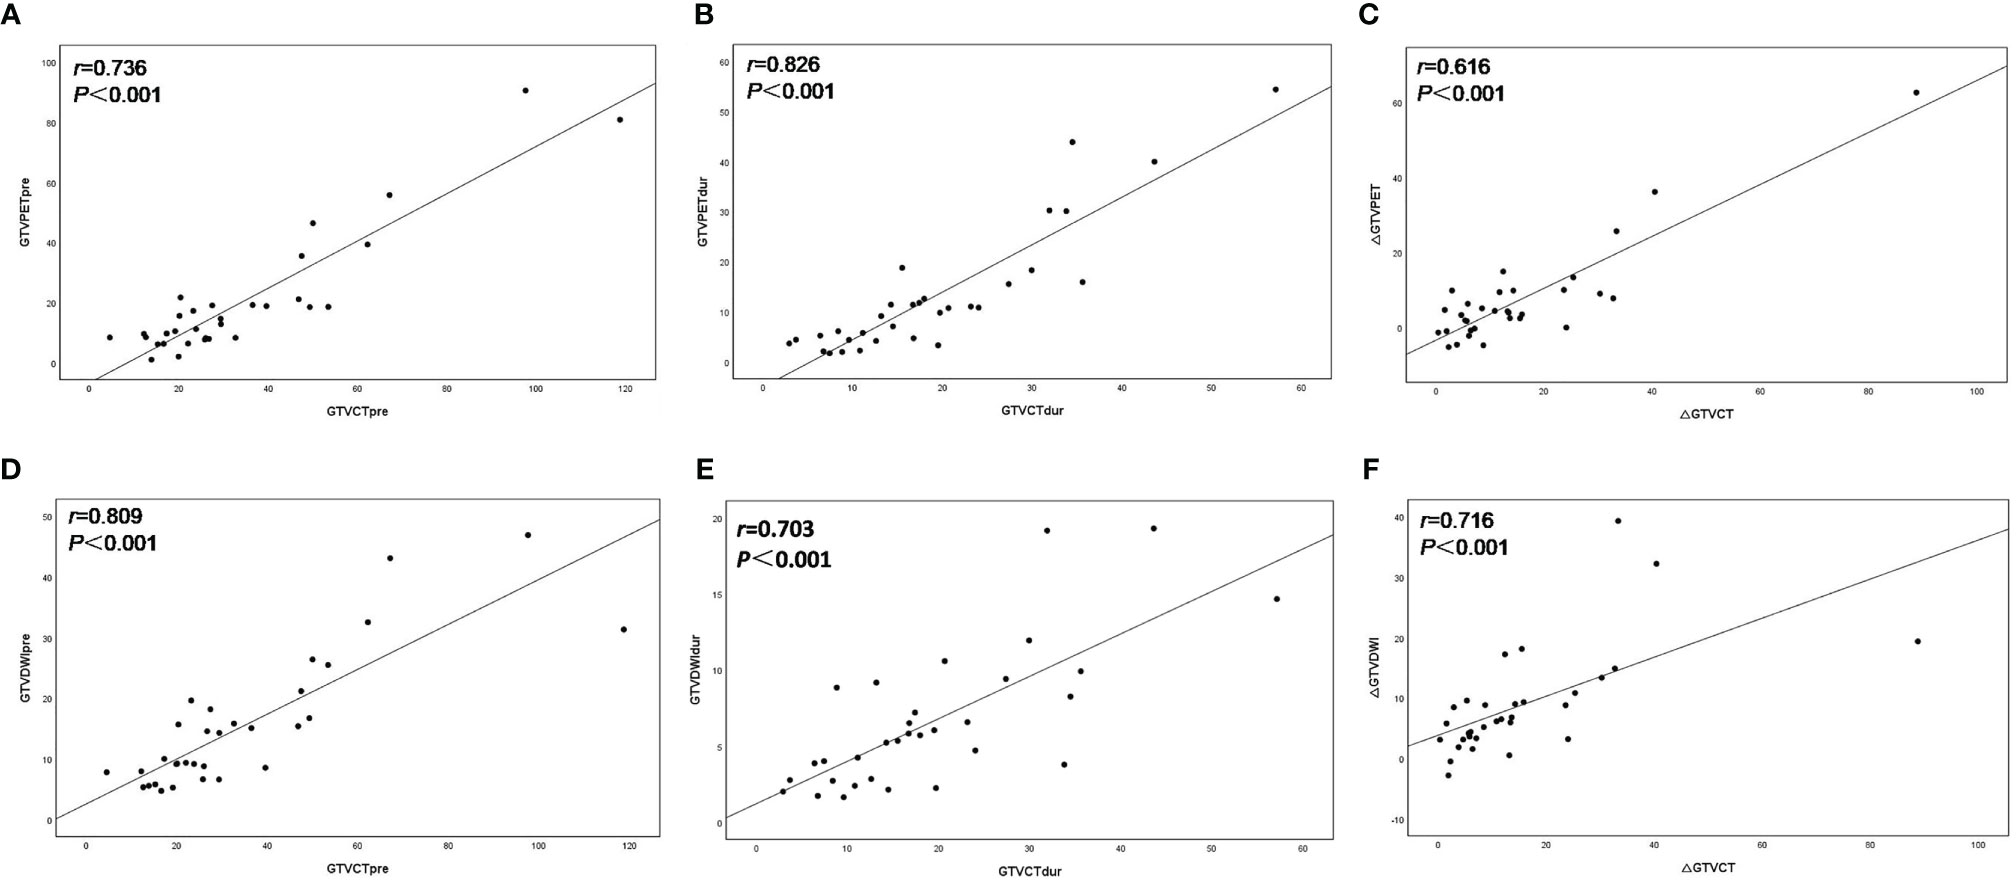
Figure 1 Scatter plots of correlation between the target volume delineated on18F-FDG PET–CT (GTVPET) and DW-MRI (GTVDWI) and on the corresponding CT (GTVCT) before and during radiotherapy. The best-fit line is shown as the solid line for each scatterplot. (A) GTVPETpre versus GTVCTpre; (B) GTVPETdur versus GTVCTdur; (C) ΔGTVPET versus ΔGTVCT; (D) GTVDWIpre versus GTVCTpre; (E) GTVDWIdur versus GTVCTdur; (F) ΔGTVDWI versus ΔGTVCT.
SUV and ADC Values
Table 2 summarizes the results of SUVs (SUVmax, SUVmean, and SUVpeak) and ADCs (ADCmean and ADCmin) performed before and during RT. The differences in SUVs (SUVmax, SUVmean, and SUVpeak), MTV, TLG, and ADCs (ADCmean and ADCmin) values as determined on 18F-FDG PET-CT and DW-MRI before and during RT were significant (both p < 0.001). A trend toward lower SUV and higher ADC was observed during the treatment process.
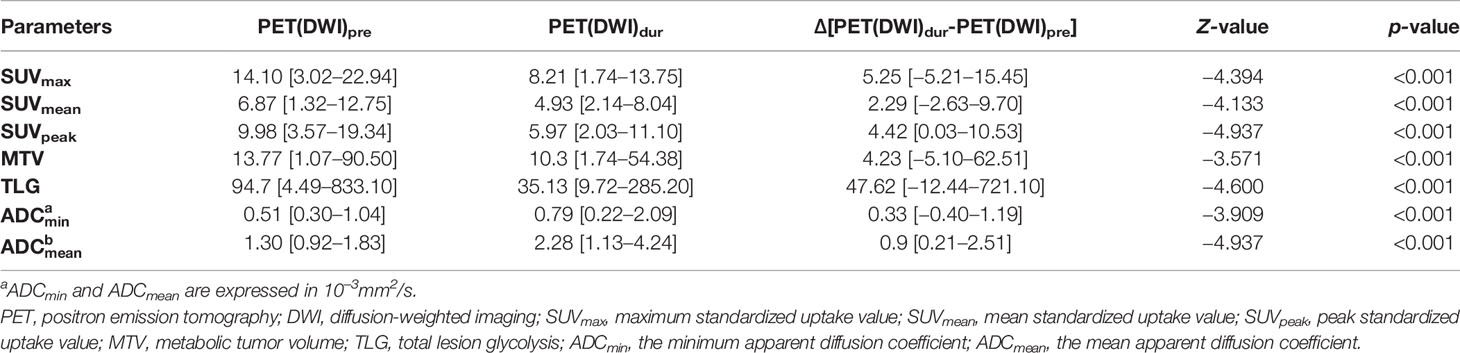
Table 2 Comparison of tumor ADC and SUV values before and during radiotherapy.
Correlation of ADC and SUV Values
The tumor ADC and SUV values before and during RT showed negligible correlations (pre-RT: SUVmax vs. ADCmin r = −0.322, p = 0.072; SUVmax vs. ADCmean r = −0.217, p = 0.232; SUVmean vs. ADCmin r = −0.258, p = 0.153; SUVmean vs. ADCmean r = −0.256, p = 0.158; dur-RT: SUVmax vs. ADCmin r = −0.133, p = 0.496; SUVmax vs. ADCmean r = −0.133, p = 0.496; SUVmean vs. ADCmin r = −0.013, p = 0.944; SUVmean vs. ADCmean r = −0.121, p = 0.510). There was no correlation between ∆SUV values (∆SUVmax, ∆SUVmean, and ∆SUVpeak) and ∆ADC values (∆ADCmin and ∆ADCmean) (p = 0.238−0.854) (Table 3).
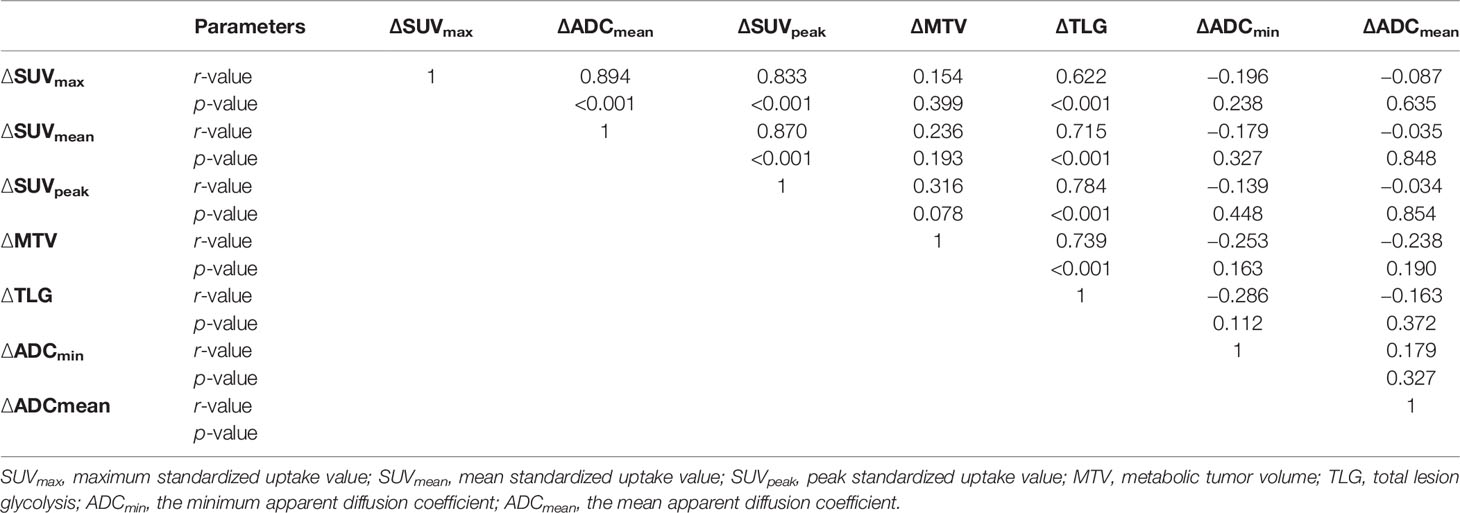
Table 3 Correlation analysis of relative changes in SUV and ADC values before and during radiotherapy.
Associations of SUVs and ADCs With Clinical Prognostic Factors
Table 4 shows associations of SUVs and ADCs with clinical T-stage and longitudinal length of GTVs. The SUVs (SUVmax, SUVmean, and SUVpeak), MTV, and TLG pre-RT and its relative changes between pre-RT and after 15 fractions of RT were significantly higher in stages T3–4 than in stage T2 and in the group with a longitudinal length of GTVs ≥4 cm than <4 cm (p = 0.000−0.041). The ADCmin dur-RT and its relative changes between pre-RT and after 15 fractions of RT were significantly lower in the group with a longitudinal length of GTVs ≥4 cm than <4 cm, but these were not significantly associated with clinical T-stage (Table 4).
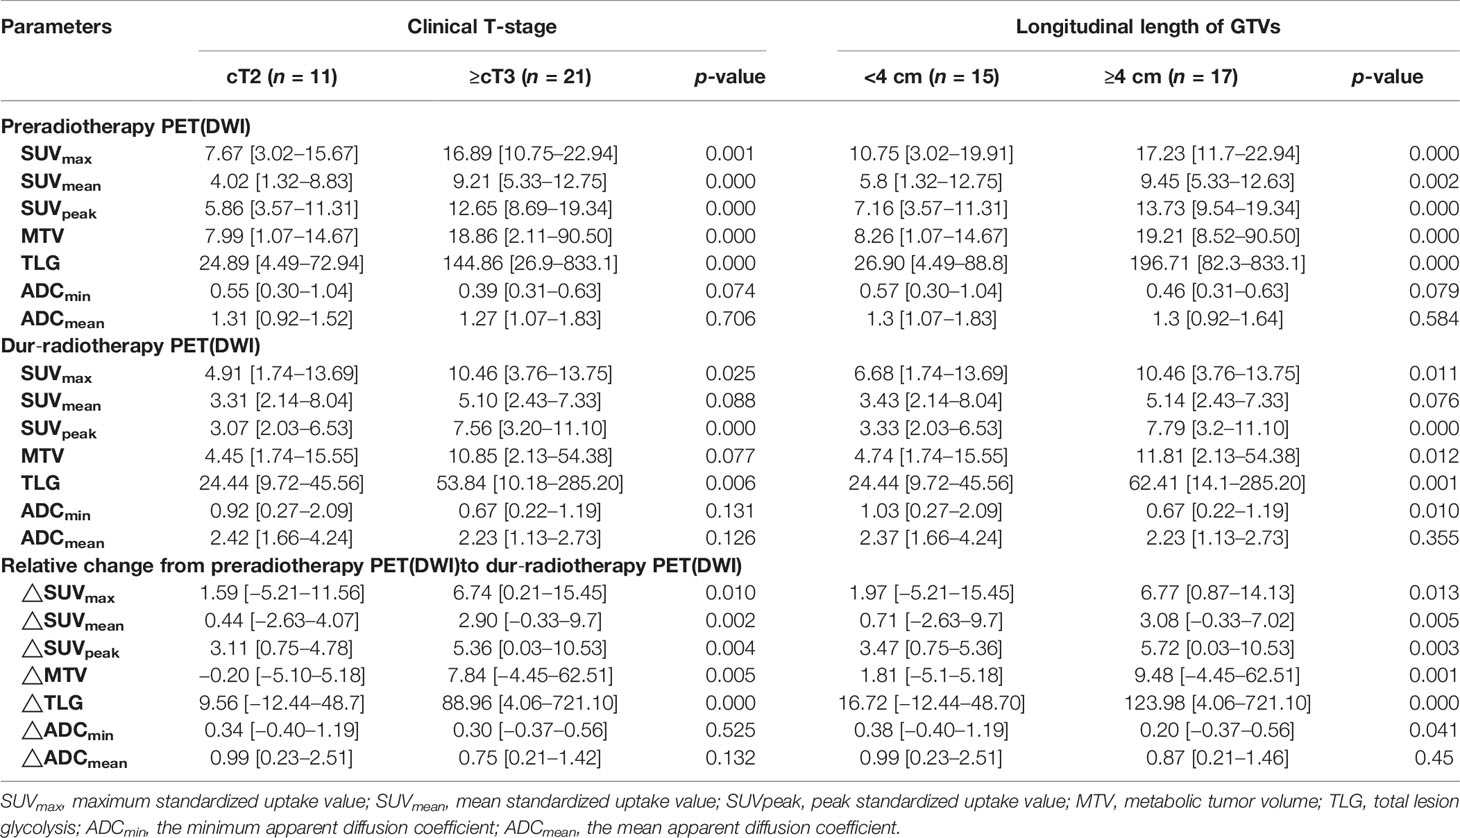
Table 4 Associations of SUVs and ADCs with clinical T-stage and longitudinal length of GTVs.
Differences in Volumes, CI, and DI
The target volumes defined using PET-CT and DW-MRI before and during RT are listed in Table 5. The median volume variabilities between GTVPETpre and GTVDWIpre and between GTVPETdur and GTVDWIdur were significant (p =0.026 and 0.000, respectively). Significant differences were observed between the CI of GTVPETpre to GTVDWIpre (0.47 [0.20−0.77]) and GTVPETdur to GTVDWIdur (0.29 [0.11−0.48]) (Z = −4.750, p < 0.001). Meanwhile, the DI of GTVPETpre in GTVDWIpre (0.63 [0.24−2.60]) was significantly larger than that of GTVPETdur in GTVDWIdur (0.38 [0.11−0.92]) (Z = −4.675, p < 0.001).
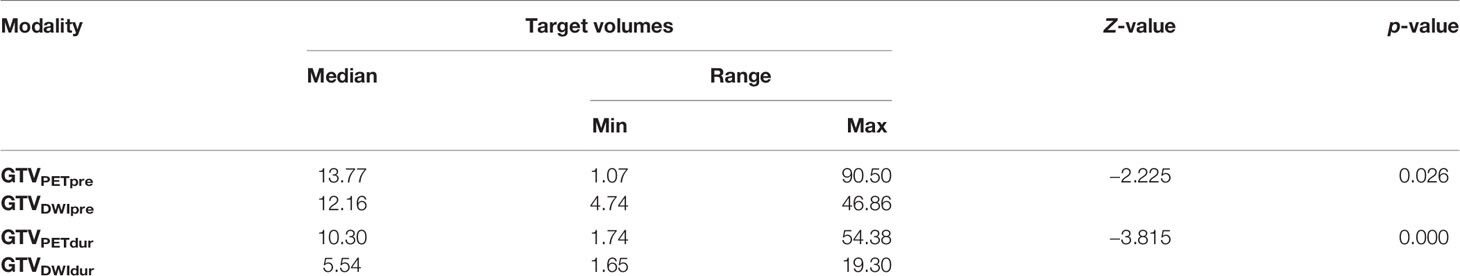
Table 5 Summary of the volume of GTVs contoured using PET-CT and DW-MRI before and during radiotherapy.
Tumor Maximum Diameter/Volume Shrinkage Rate
There was no significant difference between LDPETpre and LDDWIpre and between LDPETdur and LDDWIdur (median 2.85 cm [1.48−6.31] vs. 2.92 cm [1.89−5.33], median 2.36 cm [1.47−4.79] vs. 2.22 cm [1.35−3.47], Z = −1.169 and −1.187, p = 0.243 and 0.235, respectively). There was a significant positive correlation between LDPETpre and LDDWIpre and between VRRPET and VRRDWI (r = 0.631 and 0.547, p = 0.000 and 0.001, respectively). △LDDWI (24%) and VRRDWI (60%) based on DWI during RT were significantly greater than the corresponding PET-based △LDPET (14%) and VRRPET (41%) (Z = −2.393 and −3.758, p = 0.017 and 0.000, respectively) (Figure 2).
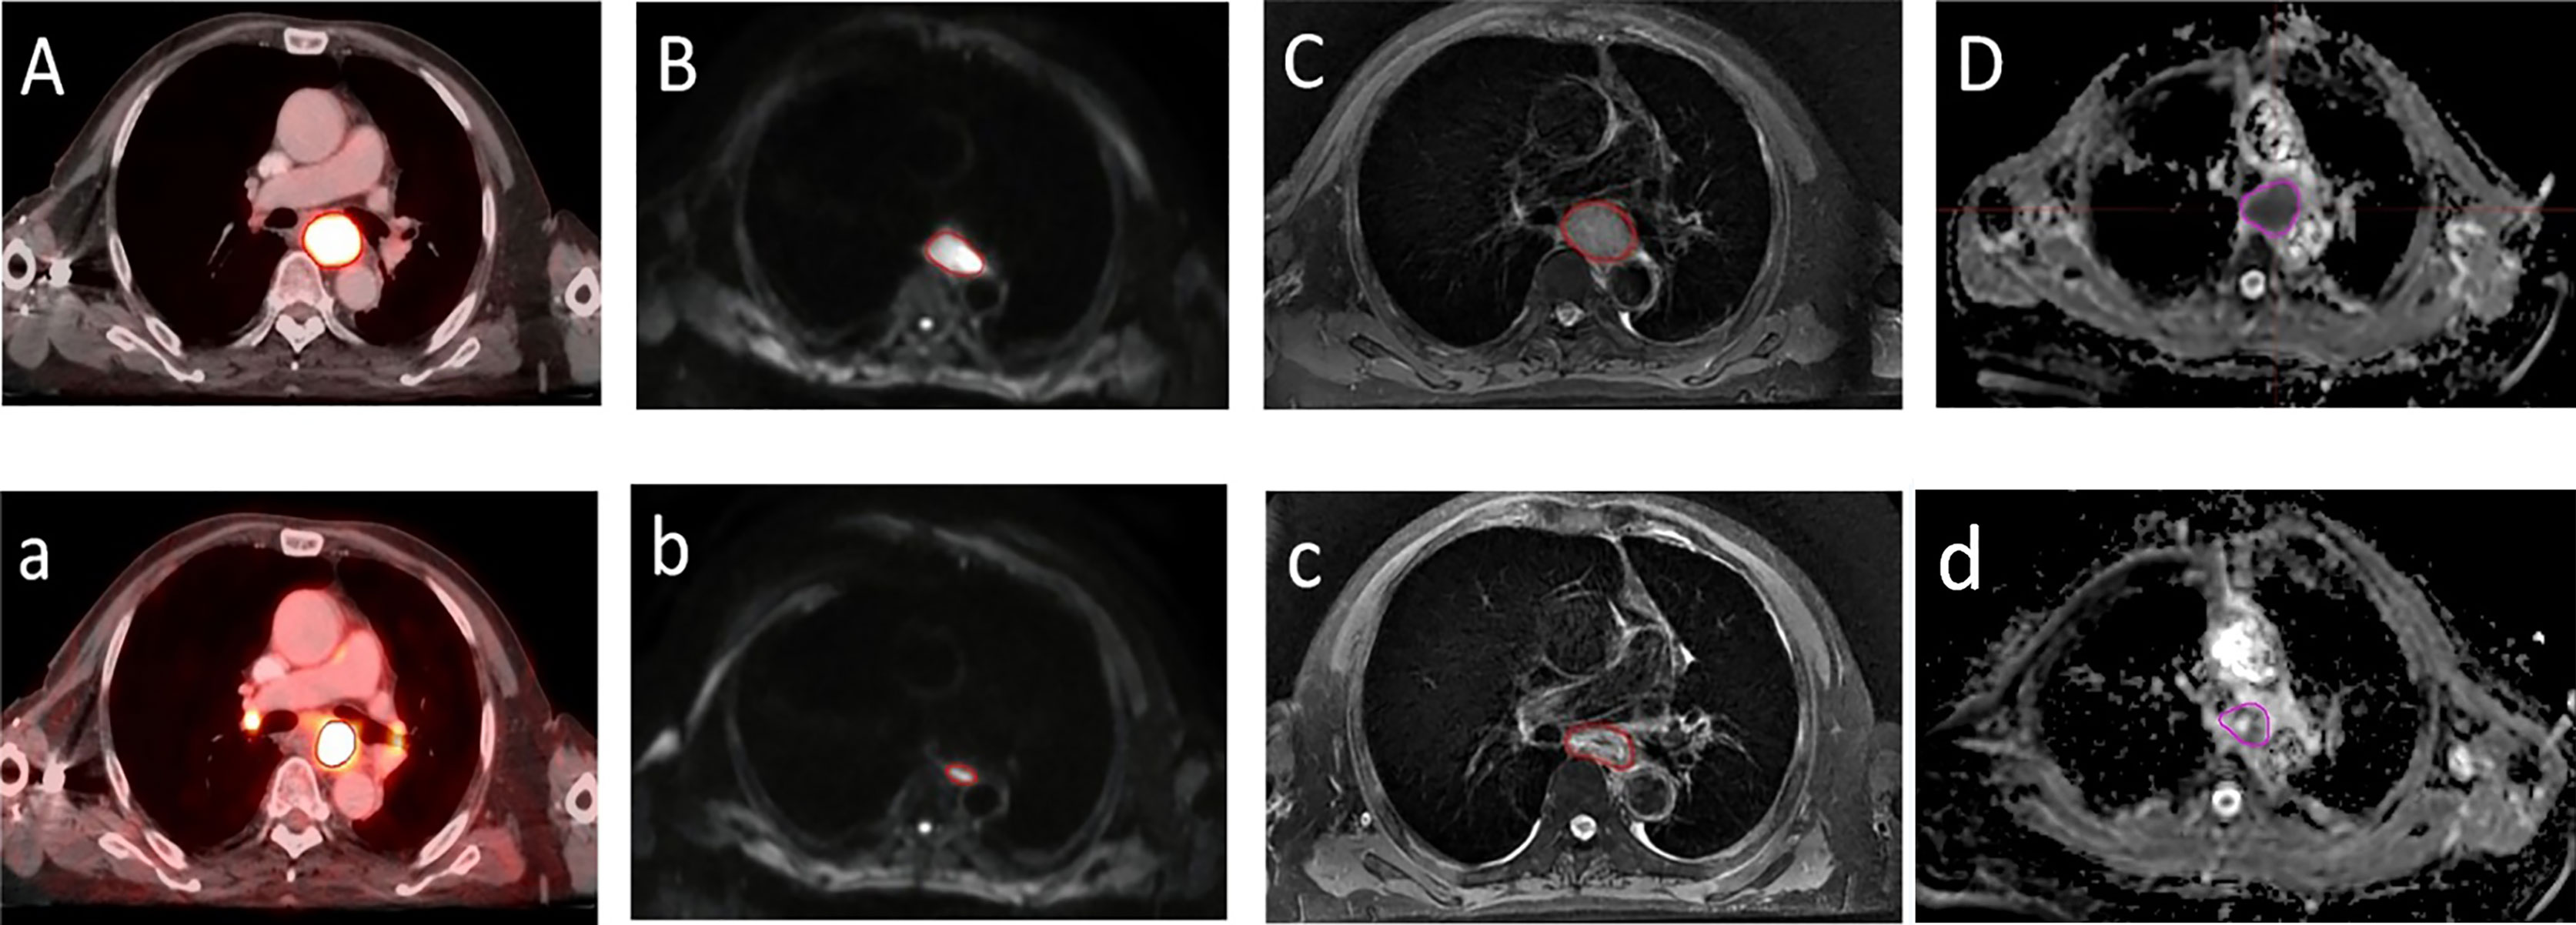
Figure 2 A transversal diagram of gross target volumes on esophageal cancer with high uptake on 18F fluorodeoxyglucose positron emission tomography/computed tomography fused images. (A,a) Corresponding tumor on T2-weighted imaging (C,c) with a high signal on diffusion weighted magnetic resonance imaging (b=600 s/mm2) (B,b) and corresponding apparent diffusion coefficient map (D,d) with restricted diffusion at the location of the tumor before radiotherapy (A–D) and during radiotherapy (a–d).
Discussion
In this single-center prospective study, comparisons of the spatial overlap and functional markers derived from 18F-FDG PET-CT and DW-MRI before and during RT based on the medium of CT imaging were evaluated. The results of the current study show that it is feasible to select boosting of high 18F-FDG uptake zones within the GTV based on FDG PET-CT for definition of the volume in need of dose escalation (4, 5, 23). However, owing to exorbitant costs and physical burden to patients undergoing repeated PET procedures, MRI-guided Linear Accelerator (MRI-LINAC) with online MR-guided adaptive radiotherapy (MRgRT) in EC has been widely applied (24). Furthermore, ADC measurements on DW-MRI have potential for prediction of response to treatment in esophageal cancer patients, especially the relative ADC increase during and after treatment showed a trend towards a larger increase of ADC in good responders compared with poor responders (16). Hence, we aimed to explore whether the high signal area derived from DW-MRI can be used as tool for an individualized definition of the volume in need of dose escalation for EC. To our knowledge, this is the first prospective trial assessing the geometrical differences and metabolic parameters between two imaging modalities in the reirradiation treatment planning for esophageal squamous cancer.
Currently, the method of gradient-based algorithm (PETEdge) has been found to correspond better to pathological specimens than manual or relative threshold-based methods (19). However, no single PET-based segmentation algorithm has yet performed better than manual CT delineation alone (16), implying that PET-guided adaptive radiotherapy was insufficient for clinical decision-making. Till date, CT imaging remains the gold standard for GTV delineation and treatment planning evaluation. On this basis, our data suggest that the volume of GTVCT exhibited a significant positive correlation with that of GTVPET and GTVDWI.
Based on our analysis, the results showed that the differences in SUV and ADC values before and during RT were significant, consistent with the findings of more recent studies (25, 26). There is also clear evidence that higher SUV and lower ADC values are associated with a higher histological grade and aggressiveness (17, 27). With high cellular density and enhanced glucose metabolism, malignant tumors generally exhibit low ADCs and high SUVs. Several studies indicate that the change in tumor 18F-FDG uptake for EC seemed highly predictive for assessing response during and after treatment (7, 28). Another recent study by Aerts et al. (29) has demonstrated that the recurrent areas within the tumor after therapy largely corresponded with the high FDG uptake area of the pretreatment PET scan. As a result, selective boosting of high 18F-FDG uptake zones within the tumor for radioresistance has been suggested. However, part of the limitations of PET can be attributed to the fact that no consensus for the accurate segmentation algorithm is recommended. Meanwhile, DW-MRI is emerging as an advanced imaging technique with noninvasive, well-tolerated, and excellent soft-tissue contrast features for diagnosing EC. ADC value is the most common DWI-derived imaging biomarker with broad clinical applications. More importantly, recent exploratory studies have shown that changes in ADC appears to provide valuable information on the prediction and assessment of treatment response early after RT (7, 16, 17). Consequently, regions of restricted diffusion may serve as a surrogate for active tumor tissue. DW-MRI may be a technically and clinically available alternative to PET-CT for an individualized definition of the volume in need of dose escalation for EC.
Concerning the possible correlation between ADCs and SUVs for the prediction of survival or evaluation of response to treatment in EC, our current data suggest that the tumor ADCs and SUVs before and during RT showed negligible correlations. Similar to our findings, previous studies also found no significant correlations between pretreatment SUVs and ADCs (30–32). Our results also revealed that pretreatment SUVs, MTV, and TLG were significantly higher in tumor stage ≥ T3 than in tumor stage < T2, while ADCmin values has not yet been found to correlate with the clinical T-stage, indicating the effect of tumor load on 18F-FDG metabolism, consistent with the literature (8, 33). These results suggest that enhanced glucose metabolism as measured on FDG PET and restricted water diffusion as measured using ADC represent independent biological properties and refer to different aspects of tumor pathophysiology. This is likely owing to the variety of pathogenic mechanisms because of which elevated 18F-FDG uptake was detected in the sites of glucose metabolism and active inflammation, while no significant changes in cell density were detected in the activity of inflammatory cells (28, 33, 34). Additionally, necrosis and liquefaciens induced by radiation can impede movement of water molecules, leading to increased ADC values. Finally, it is likely that the timing and distribution of decreased glucose metabolism and cellular density are asynchronous and inconsistent.
In addition, we evaluated the difference in matching and inclusion relation between the GTVs derived from PET-CT and DW-MRI simulation before and during RT. Our results indicate that the CI of GTVPETpre to GTVDWIpre was significantly larger than that of GTVPETdur to GTVDWIdur. Meanwhile, a significant difference was observed between the DI of GTVPETpre in GTVDWIpre and GTVPETdur in GTVDWIdur. Our study results are also consistent with the findings of Popp et al. (34) and Houweling et al. (35), who showed that the GTV of restricted diffusion on ADC overlapped only partially with that of increased glucose uptake for reirradiation treatment planning, suggesting that there were great mismatches between the regions of residual high FDG uptake based on PET-CT and the areas of residual high signal based on DW-MRI. Moreover, given the data from our study, the rate of tumor maximum diameter/volume regression based on DW-MRI during RT is significantly faster than that based on PET-CT. This suggests that the regions of high cellularity may not cover the entire biologically active tumor, agreeing with earlier studies comparing DWI and PET in reirradiation of recurrent primary brain tumors (34, 35).
Some limitations of the current study must be considered. A potential disadvantage of EPI-DWI is that the technique is prone to artifact contamination caused by variations in magnetic susceptibility (36). To minimize this, the study excluded some cases with a small volume and severe image distortions. Additionally, The magnitude of the geometric distortion scales with magnetic field strength (37). Considering that the use of 3.0 T MRI was applied, the limitation of the geometric distortion caused by high field strength must be considered. Owing to the partial-volume and pseudo-diffusion effect caused by tumor vascular permeability and microcirculation perfusion, tumor shrinkage upon initiation of treatment may lead to underestimation of the FDG uptake observed on midtreatment imaging modalities and a consequent overestimation of the change in parameters such as the SUV. Further dosimetric investigations are necessary to evaluate whether it is safe to select boosting of the high signal areas within the tumor based on DW-MRI for definition of the volume in need of dose escalation.
Conclusions
The location of high residual FDG uptake based on 18F-FDG PET-CT yielded poorer spatial matching than that of high residual signal based on DW-MRI during RT. Furthermore, tumor ADC and SUV values may play complementary roles as imaging markers for the prediction of patterns of failure and for definition of the volume in need of dose escalation. In addition, the rate of tumor maximum diameter/volume regression based on DW-MRI during RT is significantly faster than that based on PET-CT. Based on the medium of CT images, the volume of GTVCT exhibited a significant positive correlation with that of GTVPET and GTVDWI. Under this premise, there are significant differences in spatial position, biometabolic characteristics, and the tumor shrinkage rate for GTVs derived from 18F-FDG PET-CT and DW-MRI before and during RT for esophageal squamous cancer. Further studies are needed to determine if DW-MRI will be used as tool for an individualized definition of the volume in need of dose escalation.
Data Availability Statement
The original contributions presented in the study are included in the article/supplementary material. Further inquiries can be directed to the corresponding authors.
Ethics Statement
The studies involving human participants were reviewed and approved by the Shandong Tumor Hospital Ethics Committee. The patients/participants provided their written informed consent to participate in this study. Written informed consent was obtained from the individual(s) for the publication of any potentially identifiable images or data included in this article.
Author Contributions
HL contributed to the study design, the patient enrollment, the data statistics, and analysis and writing of the manuscript. JL and FL participated in the study design and revised the content. YZ and YL contributed to reviewing the delineation. YG and LX made important contributions in collecting the data and revising the content. All authors read and approved the final version of the manuscript.
Funding
This work was supported by the National Natural Science Foundation of China (grant number 81773287) and Taishan Scholars Program of Shandong Province (grant number ts20190982).
Conflict of Interest
The authors declare that the research was conducted in the absence of any commercial or financial relationships that could be construed as a potential conflict of interest.
Publisher’s Note
All claims expressed in this article are solely those of the authors and do not necessarily represent those of their affiliated organizations, or those of the publisher, the editors and the reviewers. Any product that may be evaluated in this article, or claim that may be made by its manufacturer, is not guaranteed or endorsed by the publisher.
Acknowledgments
This manuscript underwent American-language editing by Elsevier Limited.
References
1. Kakeji Y, Oshikiri T, Takiguchi G, Kanaji S, Matsuda T, Nakamura T, et al. Multimodality Approaches to Control Esophageal Cancer: Development of Chemoradiotherapy, Chemotherapy, and Immunotherapy. Esophagus (2021) 18(1):25–32. doi: 10.1007/s10388-020-00782-1
2. Button MR, Morgan CA, Croydon ES, Roberts SA, Crosby TD. Study to Determine Adequate Margins in Radiotherapy Planning for Esophageal Carcinoma by Detailing Patterns of Recurrence After Definitive Chemoradiotherapy. Int J Radiat Oncol Biol Phys (2009) 73(3):818–23. doi: 10.1016/j.ijrobp.2008.04.062
3. Welsh J, Settle SH, Amini A, Xiao L, Suzuki A, Hayashi Y, et al. Failure Patterns in Patients With Esophageal Cancer Treated With Definitive Chemoradiation. Cancer (2012) 118(10):2632–40. doi: 10.1002/cncr.26586
4. Grover A, Soni TP, Patni N, Singh DK, Jakhotia N, Gupta AK, et al. A Randomized Prospective Study Comparing Acute Toxicity, Compliance and Objective Response Rate Between Simultaneous Integrated Boost and Sequential Intensity-Modulated Radiotherapy for Locally Advanced Head and Neck Cancer. Radiat Oncol J (2021) 39(1):15–23. doi: 10.3857/roj.2020.01018
5. Yu W, Cai XW, Liu Q, Zhu ZF, Feng W, Zhang Q, et al. Safety of Dose Escalation by Simultaneous Integrated Boosting Radiation Dose Within the Primary Tumor Guided by (18)FDG-PET/CT for Esophageal Cancer. Radiother Oncol (2015) 114(2):195–200. doi: 10.1016/j.radonc.2014.12.007
6. Kim N, Cho H, Yun M, Park KR, Lee CG. Prognostic Values of Mid-Radiotherapy 18F-FDG PET/CT in Patients With Esophageal Cancer. Rad Oncol (2019) 14(1):27. doi: 10.1186/s13014-019-1232-1
7. Borggreve AS, Goense L, van Rossum PSN, Heethuis SE, van Hillegersberg R, Lagendijk JJW, et al. Preoperative Prediction of Pathologic Response to Neoadjuvant Chemoradiotherapy in Patients With Esophageal Cancer Using 18F-FDG PET/CT and DW-MRI: A Prospective Multicenter Study. Int J Radiat Oncol Biol Phys (2020) 106(5):998–1009. doi: 10.1016/j.ijrobp.2019.12.038
8. Yu CW, Chen XJ, Lin YH, Tseng YH, Lu CC, Chen BB, et al. Prognostic Value of 18F-FDG PET/MR Imaging Biomarkers in Oesophageal Squamous Cell Carcinoma. Eur J Radiol (2019) 120:108671. doi: 10.1016/j.ejrad.2019.108671
9. Chang S, Kim SJ. Prediction of Recurrence and Mortality of Locally Advanced Esophageal Cancer Patients Using Pretreatment F-18 FDG PET/CT Parameters: Intratumoral Heterogeneity, SUV, and Volumetric Parameters. Cancer Biother Radiopharm (2016) 31(1):1–6. doi: 10.1089/cbr.2015.1932
10. Minsky BD, Pajak TF, Ginsberg RJ, Pisansky TM, Martenson J, Komaki R, et al. Int 0123 (Radiation Therapy Oncology Group 94-05) Phase III Trial of Combined-Modality Therapy for Esophageal Cancer: High-Dose Versus Standard-Dose Radiation Therapy. J Clin Oncol Radiat Ther Oncol Group (2002) 20(5):1167–74. doi: 10.1200/JCO.2002.20.5.1167
11. Calais J, Dubray B, Nkhali L, Thureau S, Lemarignier C, Modzelewski R, et al. High FDG Uptake Areas on Pre-Radiotherapy PET/CT Identify Preferential Sites of Local Relapse After Chemoradiotherapy for Locally Advanced Oesophageal Cancer. Eur J Nucl Med Mol Imaging (2015) 42(6):858–67. doi: 10.1007/s00259-015-3004-y
12. Huang B, Law MW, Khong PL. Whole-Body PET/CT Scanning: Estimation of Radiation Dose and Cancer Risk. Radiology (2009) 251(1):166–74. doi: 10.1148/radiol.2511081300
13. Cremonesi M, Garibaldi C, Timmerman R, Ferrari M, Ronchi S, Grana CM, et al. Interim 18f-FDG-PET/CT During Chemo-Radiotherapy in the Management of Oesophageal Cancer Patients. A Syst Rev Radiother Oncol (2017) 125(2):200–12. doi: 10.1016/j.radonc.2017.09.022
14. Goense L, Borggreve AS, Heethuis SE, van Lier AL, van Hillegersberg R, Mook S, et al. Patient Perspectives on Repeated MRI and PET/CT Examinations During Neoadjuvant Treatment of Esophageal Cancer. Br J Radiol (2018) 91(1086):20170710. doi: 10.1259/bjr.20170710
15. Li H, Li F, Li J, Zhu Y, Zhang Y, Guo Y, et al. Comparison of Gross Target Volumes Based on Four-Dimensional CT, Positron Emission Tomography-Computed Tomography, and Magnetic Resonance Imaging in Thoracic Esophageal Cancer. Cancer Med (2020) 9(15):5353–61. doi: 10.1002/cam4.3072
16. Vollenbrock SE, Voncken FEM, Bartels LW, Beets-Tan RGH, Bartels-Rutten A. Diffusion-Weighted MRI With ADC Mapping for Response Prediction and Assessment of Oesophageal Cancer: A Systematic Review. Radiother Oncol (2020) 142:17–26. doi: 10.1016/j.radonc.2019.07.006
17. Giganti F, Salerno A, Ambrosi A, Chiari D, Orsenigo E, Esposito A, et al. Prognostic Utility of Diffusion-Weighted MRI in Oesophageal Cancer: Is Apparent Diffusion Coefficient a Potential Marker of Tumour Aggressiveness? Radiol Med (2016) 121(3):173–80. doi: 10.1007/s11547-015-0585-2
18. Lever FM, Lips IM, Crijns SP, Reerink O, van Lier AL, Moerland MA, et al. Quantification of Esophageal Tumor Motion on Cine-Magnetic Resonance Imaging. Int J Radiat Oncol Biol Phys (2014) 88(2):419–24. doi: 10.1016/j.ijrobp.2013.10.036
19. Werner-Wasik M, Nelson AD, Choi W, Arai Y, Faulhaber PF, Kang P, et al. What is the Best Way to Contour Lung Tumors on PET Scans? Multiobserver Validation of a Gradient-Based Method Using a NSCLC Digital PET Phantom. Int J Radiat Oncol Biol Phys (2012) 82(3):1164–71. doi: 10.1016/j.ijrobp.2010.12.055
20. Larson SM, Erdi Y, Akhurst T, Mazumdar M, Macapinlac HA, Finn RD, et al. Tumor Treatment Response Based on Visual and Quantitative Changes in Global Tumor Glycolysis Using PET-FDG Imaging. The Visual Response Score and the Change in Total Lesion Glycolysis. Clin Positron Imaging (1999) 2(3):159–71. doi: 10.1016/s1095-0397(99)00016-3
21. Struikmans H, Wárlám-Rodenhuis C, Stam T, Stapper G, Tersteeg RJ, Bol GH, et al. Interobserver Variability of Clinical Target Volume Delineation of Glandular Breast Tissue and of Boost Volume in Tangential Breast Irradiation. Radiother Oncol (2005) 76(3):293–9. doi: 10.1016/j.radonc.2005.03.029
22. Hof H, Rhein B, Haering P, Kopp-Schneider A, Debus J, Herfarth K. 4d-CT-Based Target Volume Definition in Stereotactic Radiotherapy of Lung Tumours: Comparison With a Conventional Technique Using Individual Margins. Radiother Oncol (2009) 93(3):419–23. doi: 10.1016/j.radonc.2009.08.040
23. Nkhali L, Thureau S, Edet-Sanson A, Doyeux K, Benyoucef A, Gardin I, et al. FDG-PET/CT During Concomitant Chemo Radiotherapy for Esophageal Cancer: Reducing Target Volumes to Deliver Higher Radiotherapy Doses. Acta Oncol (2015) 54(6):909–15. doi: 10.3109/0284186X.2014.973062
24. Boekhoff MR, Defize IL, Borggreve AS, Takahashi N, van Lier ALHMW, Ruurda JP, et al. 3-Dimensional Target Coverage Assessment for MRI Guided Esophageal Cancer Radiotherapy. Radiother Oncol (2020) 147:1–7. doi: 10.1016/j.radonc.2020.03.007
25. Heijmen L, ter Voert EE, Oyen WJ, Punt CJ, van Spronsen DJ, Heerschap A, et al. Multimodality Imaging to Predict Response to Systemic Treatment in Patients With Advanced Colorectal Cancer. PloS One (2015) 10(4):e0120823. doi: 10.1371/journal.pone.0120823
26. Weber MA, Bender K, von Gall CC, Stange A, Grünberg K, Ott K, et al. Assessment of Diffusion-Weighted MRI and 18F-Fluoro-Deoxyglucose PET/CT in Monitoring Early Response to Neoadjuvant Chemotherapy in Adenocarcinoma of the Esophagogastric Junction. J Gastrointestin Liver Dis (2013) 22(1):45–52.
27. Shimizu D, Yuasa N, Miyake H, Takeuchi E, Miyata K, Itoh S. Clinical Significance of SUVmax on Preoperative 18F-fluorodeoxyglucose Positron Emission Tomography in Patients Who Underwent R0-Esophagectomy for Esophageal Cancer. Nagoya J Med Sci (2018) 80(3):401–9. doi: 10.18999/nagjms.80.3.401
28. Unterrainer M, Eze C, Ilhan H, Marschner S, Roengvoraphoj O, Schmidt-Hegemann NS, et al. Recent Advances of PET Imaging in Clinical Radiation Oncology. Rad Oncol (2020) 15(1):88. doi: 10.1186/s13014-020-01519-1
29. Aerts HJ, van Baardwijk AA, Petit SF, Offermann C, Loon Jv, Houben R, et al. Identification of Residual Metabolic-Active Areas Within Individual NSCLC Tumours Using a Pre-Radiotherapy (18)Fluorodeoxyglucose-PET-CT Scan. Radiother Oncol (2009) 91(3):386–92. doi: 10.1016/j.radonc.2009.03.006
30. Varoquaux A, Rager O, Lovblad KO, Masterson K, Dulguerov P, Ratib O, et al. Functional Imaging of Head and Neck Squamous Cell Carcinoma With Diffusion-Weighted MRI and FDG PET/CT: Quantitative Analysis of ADC and SUV. Eur J Nucl Med Mol Imaging (2013) 40(6):842–52. doi: 10.1007/s00259-013-2351-9
31. Goense L, Heethuis SE, van Rossum PSN, Voncken FEM, Lagendijk JJW, Lam MGEH, et al. Correlation Between Functional Imaging Markers Derived From Diffusion-Weighted MRI and 18F-FDG PET/CT in Esophageal Cancer. Nucl Med Commun (2018) 39(1):60–7. doi: 10.1097/MNM.0000000000000771
32. de Jong A, Kwee TC, de Klerk JM, Adam JA, de Keizer B, Fijnheer R, et al. Relationship Between Pretreatment FDG-PET and Diffusion-Weighted MRI Biomarkers in Diffuse Large B-Cell Lymphoma. Am J Nucl Med Mol Imaging (2014) 4(3):231–8.
33. Qu YH, Long N, Ran C, Sun J. The Correlation of 18F-FDG PET/CT Metabolic Parameters, Clinicopathological Factors, and Prognosis in Breast Cancer. Clin Transl Oncol (2021) 23(3):620–7. doi: 10.1007/s12094-020-02457-w
34. Popp I, Bott S, Mix M, Oehlke O, Schimek-Jasch T, Nieder C, et al. Diffusion-Weighted MRI and ADC Versus FET-PET and GdT1w-MRI for Gross Tumor Volume (GTV) Delineation in Re-Irradiation of Recurrent Glioblastoma. Radiother Oncol (2019) 130:121–31. doi: 10.1016/j.radonc.2018.08.019
35. Houweling AC, Wolf AL, Vogel WV, Hamming-Vrieze O, van Vliet-Vroegindeweij C, van de Kamer JB, et al. FDG-PET and Diffusion-Weighted MRI in Head-and-Neck Cancer Patients: Implications for Dose Painting. Radiother Oncol (2013) 106(2):250–4. doi: 10.1016/j.radonc.2013.01.003
36. Min LA, Vacher YJL, Dewit L, Donker M, Sofia C, van Triest B, et al. Gross Tumour Volume Delineation in Anal Cancer on T2-Weighted and Diffusion-Weighted MRI - Reproducibility Between Radiologists and Radiation Oncologists and Impact of Reader Experience Level and DWI Image Quality. Radiother Oncol (2020) 150:81–8. doi: 10.1016/j.radonc.2020.06.01
Keywords: esophageal squamous carcinoma, diffusion magnetic resonance imaging, positron emission tomography, gross target volume, standard uptake value (SUV), apparent diffusion coefficient (ADC)
Citation: Li H, Li J, Li F, Zhang Y, Li Y, Guo Y and Xu L (2021) Geometrical Comparison and Quantitative Evaluation of 18F-FDG PET/CT- and DW-MRI-Based Target Delineation Before and During Radiotherapy for Esophageal Squamous Carcinoma. Front. Oncol. 11:772428. doi: 10.3389/fonc.2021.772428
Received: 08 September 2021; Accepted: 30 November 2021;
Published: 22 December 2021.
Edited by:
Enis Ozyar, Acıbadem University, TurkeyReviewed by:
Christiane Matuschek, University Hospital of Düsseldorf, GermanyJoseph Weygand, Moffitt Cancer Center, United States
Copyright © 2021 Li, Li, Li, Zhang, Li, Guo and Xu. This is an open-access article distributed under the terms of the Creative Commons Attribution License (CC BY). The use, distribution or reproduction in other forums is permitted, provided the original author(s) and the copyright owner(s) are credited and that the original publication in this journal is cited, in accordance with accepted academic practice. No use, distribution or reproduction is permitted which does not comply with these terms.
*Correspondence: Jianbin Li, bGlqaWFuYmluQG1zbi5jb20=; Fengxiang Li, bGlmZW5neGlhbmdsaUBhbGl5dW4uY29t