
95% of researchers rate our articles as excellent or good
Learn more about the work of our research integrity team to safeguard the quality of each article we publish.
Find out more
ORIGINAL RESEARCH article
Front. Oncol. , 19 November 2021
Sec. Genitourinary Oncology
Volume 11 - 2021 | https://doi.org/10.3389/fonc.2021.772182
This article is part of the Research Topic Biomarkers in Genitourinary Cancers, Volume I View all 21 articles
 Shih-Ting Chiu1
 Yung-Ting Cheng2Yeong-Shiau Pu1Yu-Chuan Lu1
 Jian-Hua Hong1Shiu-Dong Chung3,4Chih-Hung Chiang1,5,6*
 Chao-Yuan Huang1*
Background: Prostate-specific antigen (PSA) is considered neither sensitive nor specific for prostate cancer (PCa). We aimed to compare total PSA (tPSA), percentage of free PSA (%fPSA), the PSA density (PSAD), Prostate Health Index (PHI), and the PHI density (PHID) to see which one could best predict clinically significant prostate cancer (csPCa): a potentially lethal disease.
Methods: A total of 412 men with PSA of 2–20 ng/mL were prospectively included. Serum biomarkers for PCa was collected before transrectal ultrasound guided prostate biopsy. PHI was calculated by the formula: (p2PSA/fPSA) x √tPSA. PHID was calculated as PHI divided by prostate volume measured by transrectal ultrasound.
Results: Of the 412 men, 134 (32.5%) and 94(22.8%) were diagnosed with PCa and csPCa, respectively. We used the area under the receiver operating characteristic curve (AUC) and decision curve analyses (DCA) to compare the performance of PSA related parameters, PHI and PHID in diagnosing csPCa. AUC for tPSA, %fPSA, %p2PSA, PSAD, PHI and PHID were 0.56、0.63、0.76、0.74、0.77 and 0.82 respectively for csPCa detection. In the univariate analysis, the prostate volume, tPSA, %fPSA, %p2PSA, PHI, PSAD, and PHID were all significantly associated with csPCa, and PHID was the most important predictor (OR 1.41, 95% CI 1.15–1.72). Besides, The AUC of PHID was significantly larger than PHI in csPCa diagnosis (p=0.004). At 90% sensitivity, PHID had the highest specificity (54.1%) for csPCa and could reduce the most unnecessary biopsies (43.7%) and miss the fewest csPCa (8.5%) when PHID ≥ 0.67. In addition to AUC, DCA re-confirmed the clinical benefit of PHID over all PSA-related parameters and PHI in csPCa diagnosis. The PHID cut-off value was positively correlated with the csPCa ratio in the PHID risk table, which is useful for evaluating csPCa risk in a clinical setting.
Conclusion: The PHID is an excellent predictor of csPCa. The PHID risk table may be used in standard clinical practice to pre-select men at the highest risk of harboring csPCa.
Prostate cancer (PCa) is one of the most common malignancies in both Western and Asian countries. The introduction of the prostate-specific antigen (PSA) test in 1987 is one of the reasons for the growing incidence of PCa. Produced by prostate epithelial cells, PSA is regarded as an organ-specific rather than a disease-specific marker. The correlation between PSA and benign prostate hyperplasia, prostate inflammation, and PCa makes it a marker with broad clinical utility; however, it is a complex tool in terms of confirming the cancer diagnosis, with a 60%–70% false positive rate (1–3).
About 2% of patients have post-biopsy complications, such as infection, bleeding, or voiding difficulty (3). Moreover, overdiagnosis of low-risk tumors possibly leads to overtreatment and the possibility of subsequent harm (4). Thus, when to perform a prostate biopsy should be individualized and well discussed.
Prostate Health Index (PHI), a novel PCa screening alternative, is calculated with total PSA (tPSA), free PSA (fPSA), and [-2]pro-PSA (p2PSA) using the following formula: (p2PSA/fPSA) x √tPSA. PHI is proved to be better at predicting the presence of PCa and its aggressiveness than tPSA, fPSA, and PSA density (PSAD) in multiple studies in both Western and Asian countries (5–9). Current guidelines suggest considering PHI testing before prostate biopsy to increase specificity and to avoid unnecessary biopsy (10).
In recent years, PHI density (PHID) has been a focus of research for its clinical utility. One prospective study of 118 men in Western society receiving prostate biopsy showed PHID is associated with clinically significant prostate cancer (csPCa) and outperformed PHI in the area under the receiver operating characteristic curve (AUC) analysis (11). PHID is found to predict cancer aggressiveness in post-radical prostatectomy pathologies, such as high-grade cancer or extracapsular prostatic invasion (12). CsPCa [defined as a Gleason score (GS) of 6 with ≥3 positive cores and/or a maximum core participation of ≥50%, or GS ≥7 as the Epstein criteria (13)] is a potentially lethal disease that requires early diagnosis and active treatment. However, very few studies discuss the role of PHID in detecting csPCa, or how many unnecessary prostate biopsies could be avoided with PHID. Thus, this study aims to evaluate the performance PHID in csPCa detection.
This single-center prospective study was conducted in line with National Taiwan University Hospital guidelines. The study was approved by the institutional review board at the National Taiwan University Hospital (approval code: 201612091RIPD), and informed consent was obtained from all individual participants included in the study. Initially, 542 consecutive men undergoing prostate biopsy for suspected PCa were enrolled in the study. Inclusion criteria were as follows, adult patients with a total PSA between 2 and 20 ng/ml or abnormal digital rectal examination (DRE), who received transrectal ultrasound guided prostate (TRUS-P) biopsy for at least systemic 12 cores at one single tertiary center between February 2017 and January 2020. Patients underwent TRUS-P biopsy with a standardized protocol for at least 12 biopsy cores (range: 12-22). Additional finger-guided biopsy was decided by the physicians if palpable prostate nodules.
Exclusion criteria were as follows: 1) patients with untreated urinary tract infection or bacterial acute prostatitis; 2) patients who had transurethral resection of the prostate previously; 3) patients with prior history of prostate cancer; 4) patients who were treated with 5-alpha reductase inhibitors, such as finasteride or dutasteride. A total number of 412 patients with written informed consent were included in the final analysis.
After obtaining informed consent, blood samples were collected in ethylenediaminetetraacetic acid tubes before prostate biopsy and stored at -80°C after centrifugation. Serum samples were centrifuged at 1500 g for 15 min within 3 h of blood collection and stored at -20°C until analysis. The tPSA, fPSA, and p2PSA levels were analyzed with a Beckman Coulter Access 2 immunoassay analyzer (Beckman Coulter, Taiwan Inc.) with Beckman Coulter Access Hybritech reagent. The technology of chemiluminescent immunoenzymatic with Hybrithech PSA standardization was used. PHI was calculated according to the formula: PHI = (p2PSA/fPSA) x √tPSA. %fPSA was defined as (fPSA/tPSA) x 100; and %p2PSA was defined as [(p2PSA pg/mL)/(fPSA ng/mL x 1000)] x 100. Prostate volume was estimated with transrectal ultrasound with the standard ellipsoid formula: width x height x length x 0.52. PSA density (PSAD) was calculated with (tPSA/prostate volume), and PHI density (PHID) was calculated with (PHI/prostate volume).
Biopsy specimens were graded according to the updated Gleason grading system of the International Society of Urological Pathology (14). The specimens were examined by experienced genitourinary pathologists, who were blinded to the serum test results. csPCa Epstein criteria was defined as a Gleason score ≥7, or a Gleason score of 6 but with ≥3 positive cores and/or a maximum core involvement of ≥50% (13).
The primary end point was to evaluate the sensitivity, specificity, diagnostic accuracy, and clinical benefit of %fPSA, PSAD, %p2PSA, PHI and PHID (index tests) in determining the presence of PCa and csPCa at prostate biopsy in comparison to tPSA (standard tests).
The primary outcome was csPCa found on biopsy. Continuous variables were reported as median and interquartile range (IQR). Statistical differences were assessed with Mann–Whitney U test for continuous variables and Chi-square test for categorical variables. Univariable logistic regression was used to determine the association between measured covariates and prostate cancer and clinically significant prostate cancer. The area under the receiver operating characteristic curve (AUC) was used to examine the diagnostic ability of each PSA derivative. Difference between AUCs were evaluated with DeLong test. Decision curve analysis (DCA) was applied to compare different diagnostic strategies with regards to maximizing clinical net benefit at different threshold probability (15). Statistical analyses were performed with SPSS version 22.0 (IBM Corp, Inc) and R software. A two-sided p value of <0.05 was considered significant.
Of the 412 men included, 134 (32.5%) were diagnosed with PCa and 57 (42.5%) had a GS of 6 PCa. 94 of 412 men (22.8%) were diagnosed with csPCa, of which 77 (81.9%) were GS ≥7 and the rest 17 men (18.1%) had a GS of 6 fulfilling the Epstein criteria. (Table 1). In the baseline characteristics, men with csPCa were significantly older, had a higher proportion of abnormal DRE, and a smaller prostate volume than the non-csPCa group. As regards biomarkers, the tPSA level was similar between the two groups, while men with csPCa had a significantly lower %fPSA, and higher %p2PSA, PHI, PSAD, and PHID.
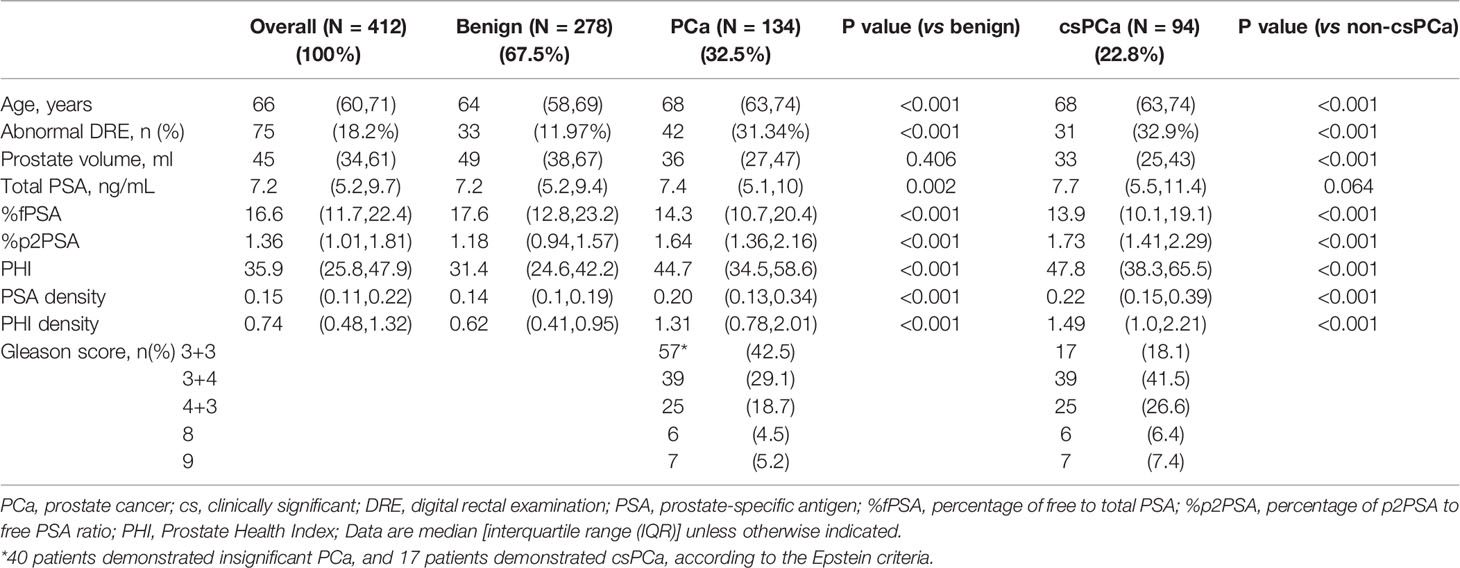
Table 1 Characteristics of the study cohort.
The univariable logistic regression (Table 2) showed that age, abnormal DRE, and prostate volume were significant predictors for both PCa and csPCa. However, tPSA failed to demonstrate significance in predicting PCa (OR 1.04, P=0.129) but was a predictor for csPCa (OR 1.09, P=0.005). Contrarily, biomarkers such as %fPSA, %p2PSA, PHI, PSAD, and PHID were all significantly associated with both PCa and csPCa. The prostate volume factor plus PSA-related serum markers demonstrated that PSAD and PHID were the most important predictors of PCa (OR 1.42, 95% CI 1.21–1.67, and OR 2.27, 95% CI 1.73–2.97, respectively) and csPCa (OR 1.24, 95% CI 1.07–1.44, and OR 1.41, 95% CI 1.15–1.72, respectively).
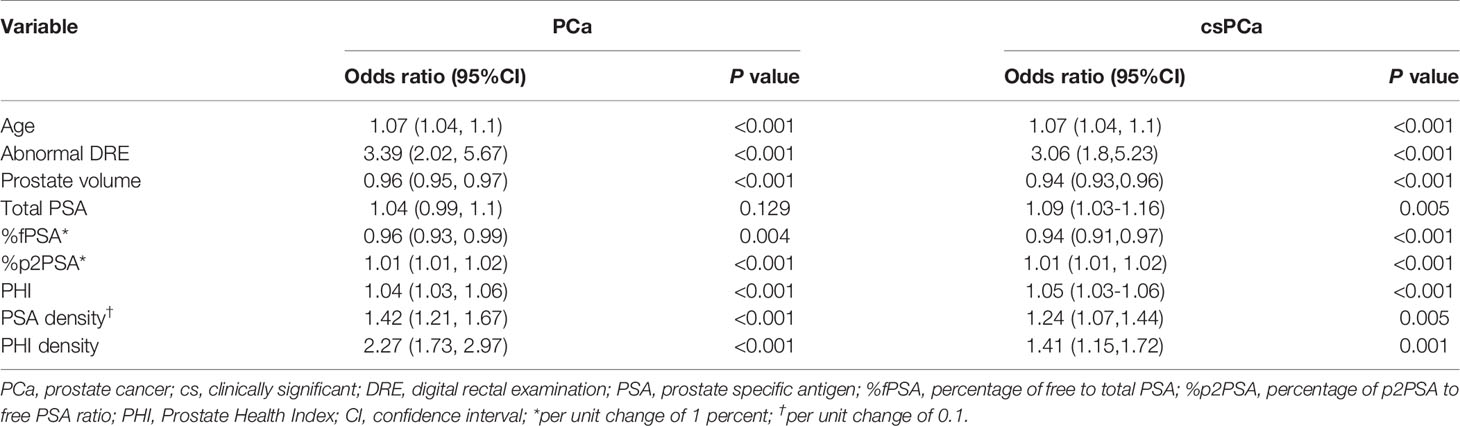
Table 2 Univariable logistic regression models for the prediction of PCa and csPCa.
AUC was used to examine the ability of each diagnostic marker to indicate PCa (Figure 1A) and csPCa (Figure 1B). The predictors of PCa and csPCa in order from the worst to the best are as follows: tPSA (AUC= 0.53 and 0.56), %fPSA (AUC= 0.59 and 0.63), PSAD (AUC= 0.68 and 0.74), %p2PSA (AUC= 0.72 and 0.76), PHI (AUC= 0.72 and 0.77), and PHID (AUC= 0.77 and 0.82). The AUC of PHID was still significantly better than PHI in PCa or csPCa diagnosis (p=0.007 and 0.004, respectively). Among the tested biomarkers, PHID showed the highest discriminative ability for PCa and csPCa.
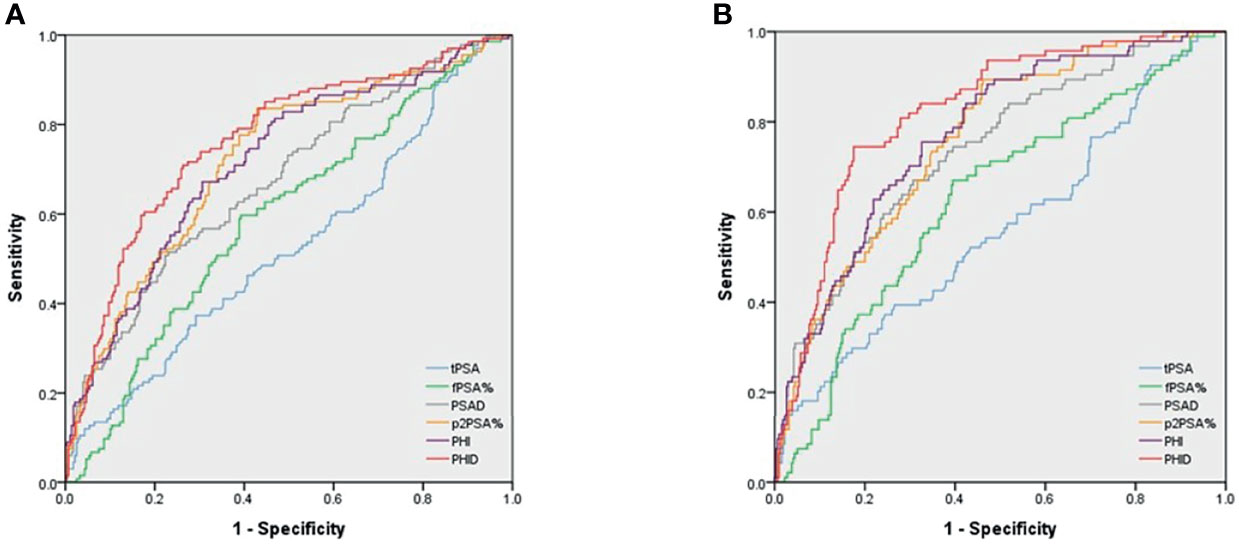
Figure 1 Area under the receiver operating characteristic (AUC) curves for predicting (A) PCa and (B) csPCa. (A) AUC for PCa detection were as follows: PSA 0.53, %fPSA 0.59, PSAD0.68, %p2PSA 0.72, PHI 0.72 and PHID 0.77, respectively. (B) AUC for csPCa detection were as follows: PSA 0.56, %fPSA 0.63, PSAD 0.74, %p2PSA 0.76, PHI 0.77 and PHID 0.82, respectively. The AUC diagnostic effect of PHID is still significantly better than PHI in PCa or csPCa (p = 0.007 and 0.004, respectively).
With a 90% sensitivity for detecting csPCa, PHID had the highest specificity at 54.1%, while tPSA only demonstrated a specificity of 17.9% (Table 3). At the cut-off value of ≥0.67 for PHID, it could reduce the most unnecessary biopsies (43.7%) and missed the least cases of csPCa (8.5%). On the other hand, at the given cut-off values with tPSA of ≥4.43 ng/mL, %fPSA ≤0.26, %p2PSA ≥1.12, PHI ≥31.0, and PSAD ≥0.11 ng/mL/cc, the avoidable biopsy percentages were 15.5%, 14.8%, 32.8%, 37.4% and 26.9% respectively. In summary, PHID is the best marker for csPCa in all PSA-related parameters.

Table 3 Specificity, reduction of unnecessary biopsy, and missing positive cases at 90% sensitivity at predicting csPCa.
DCA is an analytic method for comparing different diagnostic strategies with regards to maximizing clinical net benefit against different given threshold probability. DCA curves for different biopsy scenarios indicated by various PSA-related parameters, PHI and PHID were plotted in Figure 2. The models of each biomarker for csPCa diagnosis were listed in the order from the most net benefit to the least as follows: PHID, PHI, %p2PSA, PSAD, %fPSA and tPSA at probability threshold range 20% to 30% (Figure 2B). As for the diagnosis of PCa (Figure 2A), there was an order almost similar to that of csPCa. Consistently with the AUC results, PHID had the most improvement in clinical net benefit at initiating biopsy for both PCa and csPCa.
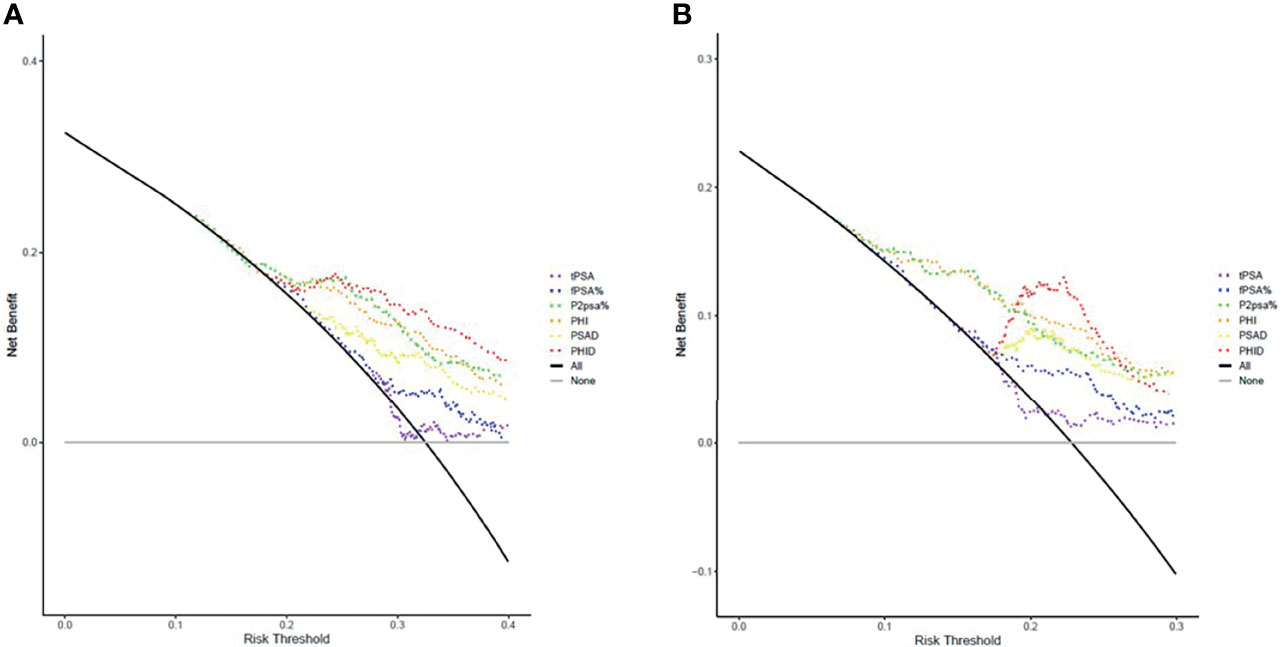
Figure 2 Decision curve analysis (DCA) of various models on (A) PCa detection and (B) csPCa detection in comparison to biopsy-all (black curve line) and biopsy-none strategies (grey horizontal line). The markers of the best clinical benefit in the diagnosis of PCa and csPCa are list in order as follows: PHID, PHI, %p2PSA, PSAD, %fPSA and tPSA. Model of PHID (red dotted line) resulted in greater net benefit in overall PCa and csPCa detection at probability threshold range 20% to 30%.
In addition, a risk table was made to evaluate the positive chances of PCa, csPCa and high-grade PCa (GS ≥7) under different PHID values (Table 4). We found the PHID cut-off value was positively correlated with the PCa, csPCa, and HGPCa ratio. For the PHID cut-off value of 0.5–0.75, the risks of PCa, csPCa, and HGPCa were 17.2%, 10.1%, and 7.1%, respectively. If an individual had a PHID value of 1–1.5, it was assumed that they had about a one-third chance of having csPCa; if the PHID value was over 1.5, they had a nearly 50% chance of having csPCa. In summary, the PHID risk table may be used in standard clinical practice to pre-select men at the highest risk of harboring csPCa.
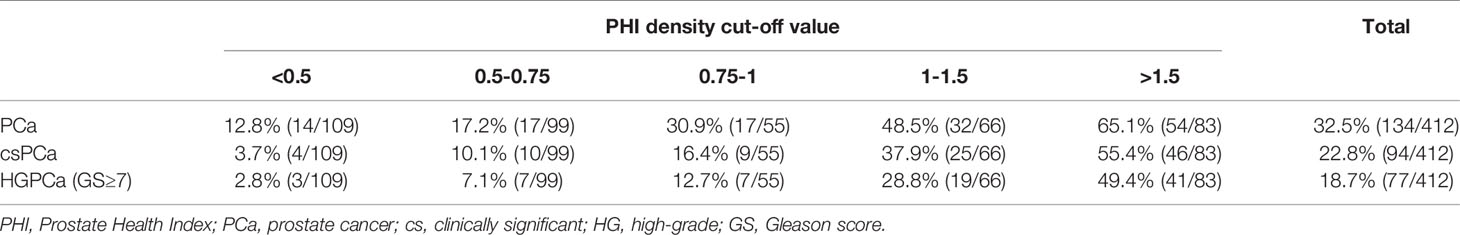
Table 4 Percentage of PCa, csPCa, and high-grade PCa (HGPCa) diagnosed at different PHI density values.
In our prospective cohort, we compared the performance of tPSA, %fPSA, %p2PSA, PSAD, PHI, and PHID in terms of predicting csPCa without missing the diagnosis. We found PHID was the best predictor of csPCa and could greatly reduce the number of unnecessary biopsies. We also found that the PHID cut-off value was positively correlated with the ratio of csPCa. We could further evaluate the patient’s csPCa risks based on this PHID risk table to decide whether to arrange a prostate biopsy. In our understanding, this is the first time a PHID risk table to evaluate the csPCa risk has been established.
PSA is neither sensitive nor specific in csPCa prediction, leading to many unnecessary biopsies and indolent cancer detected (1–3). There are several proteomic and genomic tools being studied to better diagnose csPCa, including PHI, 4K score and Stockholm3 as blood tests, and Mi-prostate score, Exo DX Prostate, and Select MD-X as urinary biomarker-based tests (16). Besides, liquid biopsy using circulating tumor cells (CTC) play an emerging and promising role in genitourinary oncology (17, 18). CTC may act as tools for pre-diagnosis screening, post-diagnosis risk stratification, and treatment response evaluation in PCa (19, 20).
There is no denying that multiparametric magnetic resonance imaging (mpMRI) is the best tool for predicting csPCa (21–23), but mpMRI may not be the case in terms of cost-effectiveness. We try to make a trade-off between diagnostic accuracy and cost-effectiveness among these tests and examinations. In previous study, mpMRI could indeed provide higher diagnostic accuracy in identifying csPCa than PHI (23). However, there are high rates of interobserver disagreements in reading prostate MRIs between different radiologists (24). mpMRI is also a resource-intensive and time-consuming examination. The costs of a prostate MRI are estimated to be €300–€500 in Europe and $700–$3000 in regions outside of Europe (25). In terms of cost-effectiveness, Kim et al. suggest that PHI as a triaging test may be an effective way to reduce mpMRI and biopsies without compromising the detection of csPCa (26). The cost-effectiveness of PHI testing is explored in both Western and Eastern world. The PHI-based strategy is more cost-effective than the PSA-based strategy for PCa regardless of what willingness-to-pay threshold by reducing biopsy costs and biopsy-related adverse events (27–30). The results may be applied not only in developed regions but also in developing countries (31).
To make up for the shortcomings of the low specificity and low sensitivity of PSA, PHI was developed. The first prospective PCa screening study in 2010 found PHI and %p2PSA (AUC= 0.77 and 0.76) could distinguish PCa from benign diseases more accurately than tPSA (AUC= 0.50) (32). Afterwards, many studies (5–8, 33–36) and our previous study (9) found that using PHI would detect PCa more accurately than tPSA, avoiding a considerable degree of unnecessary prostate biopsies. More importantly, PHI has shown promise in being able to differentiate csPCa more accurately from clinically insignificant PCa than tPSA, improving PCa cancer death rates and reducing unnecessary overdiagnoses and overtreatment of insignificant PCa (37). Furthermore, Fossati et al. (38) and our previous study (39) found that PHI can significantly improve the prediction of unfavorable PCa characteristics, larger tumor volume, and csPCa at final radical prostatectomy pathology (40).
PHI shows an excellent ability to accurately diagnose csPCa in different races. Our previous study (7) shows that for PSA 2–10 ng/ml, when we set the PHI threshold to 35, the PCa positive rate of Europeans and Asians can be increased from 52.1% and 13.1% to 66.6% and 29.4%, respectively. More importantly, in both Europeans and Asians, we can diagnose GS≥7 PCa more accurately, which increased from 28.8% and 8.1% to 40.2% and 21.5%, respectively. PHI (cut-off 35) can help avoid 32.6% and 71.1% of unnecessary biopsies in Europeans and Asians. In summary, although the PHI threshold of different races should be adjusted, the excellent diagnostic ability of PHI is the same.
Larger prostate volume is associated with increased PSA levels (41). Benson et al. first demonstrated that PSAD helped differentiate between benign prostate hypertrophy and PCa in PSA levels 4–20 ng/mL (42). Numerous following studies had similar results of the PSAD superiority over PSA in detecting PCa and adverse pathology (43–46). Similar to the conclusions of other articles, we found that PSAD was one of the top predictors of csPCa. PSAD also improved the diagnostic accuracy in patients with Prostate Imaging Reporting & Data System (PI-RADS) score ≤3 lesions in MRI, and the combination of PSAD and MRI was advocated to individualize prostate biopsy strategy (47–49).
Prostate volume is an important factor for csPCa and should be added to PSA-related factors to improve PCa detection. Filella et al. found PHI to be associated with prostate volume. The AUCs of PHI in patients with small, medium, and large prostate volumes were 0.818, 0.716, and 0.654, respectively, suggesting that a larger prostate size would decrease PHI diagnostic ability (50). Recently, studies have found that PHID is more significantly related to csPCa than other PSA-related parameters. In a prospective study by Tosoian et al., which consisted of 118 men with PSA>2 ng/mL and negative DRE, the median PHID value was 0.70 in the negative biopsy group, 0.53 in the clinically insignificant PCa group, and 1.21 in the csPCa group (p< 0.001). A higher PHID value is also significantly associated with more csPCa (3.6%, 36.7%, and 80.0% csPCa in PHID <0.43, 0.43–1.21, and >1.21, respectively, p<0.001). PHID was found to have the highest discriminative ability to detect csPCa (AUC 0.84) as compared to PSA, PSAD, %fPSA, and PHI. Moreover, PHID could be used to avoid 38% of unnecessary biopsies, while failing to detect only 2% of csPCa cases (11). Likewise, Barisiene et al. demonstrated that PHID best detected csPCa (AUC 0.80) and could help avoid 30% of prostate biopsies (51). Schulze et al. showed that PHID had a better performance in predicting PCa than PHI, PSAD, %fPSA, and tPSA. Only one csPCa case would have been missed in 50 csPCa cases (sensitivity 98%), and 20% of prostate biopsies could have been avoided with a combined use of PHID >0.9 and PHI >40 (52). Garrido et al. found PHID had the highest AUC in predicting overall PCa and csPCa (AUC 0.82 and 0.85, respectively) but there were no significant differences between the AUCs of PHID and PHI or between PHID and PSAD (53). A large retrospective cohort study demonstrated that PHID had similar AUC as PHI and had a small advantage on decision curve analysis than PHI alone in predicting overall PCa (54). Stephan et al. found PHID had significantly larger AUC than PHI in predicting overall PCa but no significant difference from PHI if aiming for csPCa (55). In our study, the AUC of PHID is significantly better than PHI in predicting csPCa (p=0.004, Figure 1B). Our study concluded that PHID is the best predictor of PCa and csPCa among various PSA-related biomarkers consistently both with AUC analysis and DCA.
The optimal PHID cut-off value was still not determined in as a result of the scarcity of the related studies. Tosoian et al. proposed a cut-off value 0.43 to detect Epstein significant disease with a 97.9% sensitivity and a 38.0% specificity (11). Barisiene et al. suggested a cut-off value of 0.61 to detect Epstein significant PCa at a 90% sensitivity, which had a resemblance to our PHID cut-off of 0.67 (51). Garrido et al. proposed PHID ≥ 0.49 as cut-off for csPCa, sparing 26.3% biopsies at 90% sensitivity (53). Besides, in men with initial negative prostate biopsy, those with initial PHID≥ 1.2 may have 21% risk developing csPCa at 6-year follow up, while those with PHID <0.4 had lowest risk and may not need intensive follow-up, depicted in a recent study by Liu et al. (56). In our study, at 90% sensitivity, PHID had the highest specificity (54.1%) for csPCa and could reduce the most unnecessary biopsies (43.7%) and miss the least csPCa (8.5%) when PHID > 0.67 (Table 3). We constructed a comprehensive table consisting of different PHID ranges and the corresponding risk for both PCa and csPCa (Table 4); for instance, the median PHID was 0.62 (0.41–0.95), 1.31 (0.78–2.01), and 1.49(1.0–2.21) in men with negative biopsy, PCa, and csPCa (p<0.001). The risk values for csPCa were 3.7%, 20.0%, and 55.4% for PHID <0.50, 0.5–1.5, and >1.50, respectively. We can avoid 43.7% of unnecessary biopsies and only miss 8.5% of csPCa cases for PHID > 0.67. The PHID and PHID risk tables may be used in standard clinical practice to pre-select men at a higher risk of harboring csPCa.
Association of different PCa biomarkers with mpMRI findings is another interesting topic worth researching. The combination of biomarkers and mpMRI may result in more clinical benefit than PSA plus mpMRI, especially in those who had equivocal PI-RADS scores (49, 57, 58). Druskin et al. recommended that prostate biopsy be performed in patients with PI-RADS ≥3 lesions in MRI or PHID ≥ 0.44 if PI-RADS score ≤2; this was 100% sensitive for csPCa detection (59). Similarly, in patients with at least one PI-RADS≥ 3 lesion in MRI, PHID added the greatest diagnostic value when fusion targeted biopsy methods were performed (60). We believe that the incorporation of PHID and MRI findings is a promising avenue and warrants further larger scale studies.
Our study had several limitations. First, the study cohort was heterogenous with biopsy-naïve subjects and those with biopsy histories. This may have confounded the results, as less PCa was detected in those who had prior biopsies. Secondly, the sample size of our study was relatively small. The PHID results and PHID risk table for csPCa need further external verification by other studies focused on different ethnicities. Third, mpMRI was not routinely performed in our entire cohort. We are incorporating PHI and mpMRI data from our cohort database. Further study results will be analyzed when more subjects are enrolled in the coming future.
In our prospective cohort, we found that PHID had the best performance, could reduce the most unnecessary biopsies, and missed the fewest csPCa cases. The PHID cut-off value is positively correlated with the csPCa ratio in the PHID risk table. In conclusion, the PHID has excellent ability to predict csPCa before biopsy. The PHID risk table may be used in standard clinical practice to pre-select men at a higher risk of harboring csPCa.
The original contributions presented in the study are included in the article/supplementary material. Further inquiries can be directed to the corresponding authors.
The studies involving human participants were reviewed and approved by National Taiwan University Hospital (approval code: 201612091RIPD). The patients/participants provided their written informed consent to participate in this study. Written informed consent was obtained from the individual(s) for the publication of any potentially identifiable images or data included in this article.
Study design and conceptualization: C-YH, C-HC, Y-TC. Data collection: Y-TC and S-TC. Formal analysis: Y-CL, J-HH, and S-DC. Writing—original draft preparation: Y-TC and S-TC. Writing—review and editing: Y-SP, C-YH, and C-HC. All authors contributed to the article and approved the submitted version.
The authors declare that the research was conducted in the absence of any commercial or financial relationships that could be construed as a potential conflict of interest.
All claims expressed in this article are solely those of the authors and do not necessarily represent those of their affiliated organizations, or those of the publisher, the editors and the reviewers. Any product that may be evaluated in this article, or claim that may be made by its manufacturer, is not guaranteed or endorsed by the publisher.
We thank C-YH, Chung-Hsin Chen, J-HH, Y-SP, Shih-Ping Liu, Y-CL, Yi-Kai Chang, Hong-Chiang Chang, Kuo-How Huang, Yuan-Ju Lee, Po-Ming Chow, I-Ni Chiang, Shih-Chun Hung and Shuo-Meng Wang for providing clinical data for analysis. We thank the research assistants I-Ting Teng and Pei-Yu Hsu for blood specimen collection and analysis. Beckman Coulter, Inc. provided the PHI testing kit.
1. Martin RM, Donovan JL, Turner EL, Metcalfe C, Young GJ, Walsh EI, et al. Effect of a Low-Intensity PSA-Based Screening Intervention on Prostate Cancer Mortality: The CAP Randomized Clinical Trial. JAMA (2018) 319(9):883–95. doi: 10.1001/jama.2018.0154
2. Schröder FH, Hugosson J, Roobol MJ, Tammela TLJ, Zappa M, Nelen V, et al. Screening and Prostate Cancer Mortality: Results of the European Randomised Study of Screening for Prostate Cancer (ERSPC) at 13 Years of Follow-Up. Lancet (2014) 384(9959):2027–35. doi: 10.1016/S0140-6736(14)60525-0
3. Pinsky PF, Parnes HL, Andriole G. Mortality and Complications After Prostate Biopsy in the Prostate, Lung, Colorectal and Ovarian Cancer Screening (PLCO) Trial. BJU Int (2014) 113(2):254–9. doi: 10.1111/bju.12368
4. Loeb S, Bjurlin MA, Nicholson J, Tammela TL, Penson DF, Carter HB, et al. Overdiagnosis and Overtreatment of Prostate Cancer. Eur Urol (2014) 65(6):1046–55. doi: 10.1016/j.eururo.2013.12.062
5. Yu G-P, Na R, Ye D-W, Qi J, Liu F, Chen H-T, et al. Performance of the Prostate Health Index in Predicting Prostate Biopsy Outcomes Among Men With a Negative Digital Rectal Examination and Transrectal Ultrasonography. Asian J Androl (2016) 18(4):633–8. doi: 10.4103/1008-682X.172823
6. Sriplakich S, Lojanapiwat B, Chongruksut W, Phuriyaphan S, Kitirattakarn P, Jun-Ou J, et al. Prospective Performance of the Prostate Health Index in Prostate Cancer Detection in the First Prostate Biopsy of Men With a Total Prostatic Specific Antigen of 4-10 Ng/mL and Negative Digital Rectal Examination. Prostate Int (2018) 6(4):136–9. doi: 10.1016/j.prnil.2018.02.002
7. Chiu PK, Ng CF, Semjonow A, Zhu Y, Vincendeau S, Houlgatte A, et al. A Multicentre Evaluation of the Role of the Prostate Health Index (PHI) in Regions With Differing Prevalence of Prostate Cancer: Adjustment of PHI Reference Ranges Is Needed for European and Asian Settings. Eur Urol (2019) 75(4):558–61. doi: 10.1016/j.eururo.2018.10.047
8. Loeb S, Sanda MG, Broyles DL, Shin SS, Bangma CH, Wei JT, et al. The Prostate Health Index Selectively Identifies Clinically Significant Prostate Cancer. J Urol (2015) 193(4):1163–9. doi: 10.1016/j.juro.2014.10.121
9. Cheng YT, Chiang CH, Pu YS, Liu SP, Lu YC, Chang YK, et al. The Application of P2psa% and Prostate Health Index in Prostate Cancer Detection: A Prospective Cohort in a Tertiary Medical Center. J Formosan Med Assoc Taiwan Yi Zhi (2019) 118(1 Pt 2):260–7. doi: 10.1016/j.jfma.2018.05.001
10. Carroll PH, Mohler JL. NCCN Guidelines Updates: Prostate Cancer and Prostate Cancer Early Detection. J Natl Compr Canc Netw (2018) 16(5s):620–3. doi: 10.6004/jnccn.2018.0036
11. Tosoian JJ, Druskin SC, Andreas D, Mullane P, Chappidi M, Joo S, et al. Prostate Health Index Density Improves Detection of Clinically Significant Prostate Cancer. BJU Int (2017) 120(6):793–8. doi: 10.1111/bju.13762
12. Huang Y-P, Lin T-P, Cheng W-M, Wei T-C, Huang I-S, Fan Y-H, et al. Prostate Health Index Density Predicts Aggressive Pathological Outcomes After Radical Prostatectomy in Taiwanese Patients. J Chin Med Assoc (2019) 82(11):835–9. doi: 10.1097/JCMA.0000000000000169
13. Epstein JI, Walsh PC, Carmichael M, Brendler CB. Pathologic and Clinical Findings to Predict Tumor Extent of Nonpalpable (Stage T1c) Prostate Cancer. JAMA (1994) 271(5):368–74. doi: 10.1001/jama.1994.03510290050036
14. Epstein JI, Allsbrook WC Jr, Amin MB, Egevad LL. The 2005 International Society of Urological Pathology (ISUP) Consensus Conference on Gleason Grading of Prostatic Carcinoma. Am J Surg Pathol (2005) 29(9):1228–42. doi: 10.1097/01.pas.0000173646.99337.b1
15. Vickers AJ, Elkin EB. Decision Curve Analysis: A Novel Method for Evaluating Prediction Models. Med Decis Making (2006) 26(6):565–74. doi: 10.1177/0272989X06295361
16. Ferro M, De Cobelli O, Lucarelli G, Porreca A, Busetto GM, Cantiello F, et al. Beyond PSA: The Role of Prostate Health Index (Phi). Int J Mol Sci (2020) 21(4):1184. doi: 10.3390/ijms21041184
17. Cimadamore A, Aurilio G, Nolé F, Massari F, Scarpelli M, Santoni M, et al. Update on Circulating Tumor Cells in Genitourinary Tumors With Focus on Prostate Cancer. Cells (2020) 9(6):1495. doi: 10.3390/cells9061495
18. Nicolazzo C, Busetto GM, Gradilone A, Sperduti I, Del Giudice F, Loreni F, et al. Circulating Tumor Cells Identify Patients With Super-High-Risk Non-Muscle-Invasive Bladder Cancer: Updated Outcome Analysis of a Prospective Single-Center Trial. Oncologist (2019) 24(5):612–6. doi: 10.1634/theoncologist.2018-0784
19. Xu L, Mao X, Grey A, Scandura G, Guo T, Burke E, et al. Noninvasive Detection of Clinically Significant Prostate Cancer Using Circulating Tumor Cells. J Urol (2020) 203(1):73–82. doi: 10.1097/JU.0000000000000475
20. Rangel-Pozzo A, Liu S, Wajnberg G, Wang X, Ouellette RJ, Hicks GG, et al. Genomic Analysis of Localized High-Risk Prostate Cancer Circulating Tumor Cells at the Single-Cell Level. Cells (2020) 9(8):1863. doi: 10.3390/cells9081863
21. Eklund M, Jäderling F, Discacciati A, Bergman M, Annerstedt M, Aly M, et al. MRI-Targeted or Standard Biopsy in Prostate Cancer Screening. N Engl J Med (2021) 385(10):908–20. doi: 10.1016/S0302-2838(21)01388-9
22. van der Leest M, Cornel E, Israël B, Hendriks R, Padhani AR, Hoogenboom M, et al. Head-To-Head Comparison of Transrectal Ultrasound-Guided Prostate Biopsy Versus Multiparametric Prostate Resonance Imaging With Subsequent Magnetic Resonance-Guided Biopsy in Biopsy-Naïve Men With Elevated Prostate-Specific Antigen: A Large Prospective Multicenter Clinical Study. Eur Urol (2019) 75(4):570–8. doi: 10.1016/j.eururo.2018.11.023
23. Porpiglia F, Russo F, Manfredi M, Mele F, Fiori C, Bollito E, et al. The Roles of Multiparametric Magnetic Resonance Imaging, PCA3 and Prostate Health Index-Which Is the Best Predictor of Prostate Cancer After a Negative Biopsy? J Urol (2014) 192(1):60–6. doi: 10.1016/j.juro.2014.01.030
24. Rosenzweig B, Laitman Y, Zilberman DE, Raz O, Ramon J, Dotan ZA, et al. Effects of “Real Life” Prostate MRI Inter-Observer Variability on Total Needle Samples and Indication for Biopsy. Urol Oncol (2020) 38(10):793.e13–.e18. doi: 10.1016/j.urolonc.2020.03.015
25. Osses DF, Roobol MJ, Schoots IG. Prediction Medicine: Biomarkers, Risk Calculators and Magnetic Resonance Imaging as Risk Stratification Tools in Prostate Cancer Diagnosis. Int J Mol Sci (2019) 20(7):1637. doi: 10.3390/ijms20071637
26. Kim L, Boxall N, George A, Burling K, Acher P, Aning J, et al. Clinical Utility and Cost Modelling of the Phi Test to Triage Referrals Into Image-Based Diagnostic Services for Suspected Prostate Cancer: The PRIM (Phi to RefIne Mri) Study. BMC Med (2020) 18(1):95. doi: 10.1186/s12916-020-01548-3
27. Teoh JY, Leung CH, Wang MH, Chiu PK, Yee CH, Ng CF, et al. The Cost-Effectiveness of Prostate Health Index for Prostate Cancer Detection in Chinese Men. Prostate Cancer Prostatic Dis (2020) 23(4):615–21. doi: 10.1038/s41391-020-0243-1
28. Heijnsdijk EA, Denham D, de Koning HJ. The Cost-Effectiveness of Prostate Cancer Detection With the Use of Prostate Health Index. Value Health (2016) 19(2):153–7. doi: 10.1016/j.jval.2015.12.002
29. Bouttell J, Teoh J, Chiu PK, Chan KS, Ng CF, Heggie R, et al. Economic Evaluation of the Introduction of the Prostate Health Index as a Rule-Out Test to Avoid Unnecessary Biopsies in Men With Prostate Specific Antigen Levels of 4-10 in Hong Kong. PLoS One (2019) 14(4):e0215279. doi: 10.1371/journal.pone.0215279
30. Nichol MB, Wu J, Huang J, Denham D, Frencher SK, Jacobsen SJ. Cost-Effectiveness of Prostate Health Index for Prostate Cancer Detection. BJU Int (2012) 110(3):353–62. doi: 10.1111/j.1464-410X.2011.10751.x
31. Huang D, Yang X, Wu Y, Lin X, Xu D, Na R, et al. Cost-Effectiveness Analysis of Prostate Health Index in Decision Making for Initial Prostate Biopsy. Front Oncol (2020) 10:565382. doi: 10.3389/fonc.2020.565382
32. Le BV, Griffin CR, Loeb S, Carvalhal GF, Kan D, Baumann NA, et al. [-2]Proenzyme Prostate Specific Antigen Is More Accurate Than Total and Free Prostate Specific Antigen in Differentiating Prostate Cancer From Benign Disease in a Prospective Prostate Cancer Screening Study. J Urol (2010) 183(4):1355–9. doi: 10.1016/j.juro.2009.12.056
33. Jansen FH, van Schaik RH, Kurstjens J, Horninger W, Klocker H, Bektic J, et al. Prostate-Specific Antigen (PSA) Isoform P2psa in Combination With Total PSA and Free PSA Improves Diagnostic Accuracy in Prostate Cancer Detection. Eur Urol (2010) 57(6):921–7. doi: 10.1016/j.eururo.2010.02.003
34. Guazzoni G, Nava L, Lazzeri M, Scattoni V, Lughezzani G, Maccagnano C, et al. Prostate-Specific Antigen (PSA) Isoform P2psa Significantly Improves the Prediction of Prostate Cancer at Initial Extended Prostate Biopsies in Patients With Total PSA Between 2.0 and 10 Ng/Ml: Results of a Prospective Study in a Clinical Setting. Eur Urol (2011) 60(2):214–22. doi: 10.1016/j.eururo.2011.03.052
35. Lazzeri M, Haese A, de la Taille A, Palou Redorta J, McNicholas T, Lughezzani G, et al. Serum Isoform [-2]proPSA Derivatives Significantly Improve Prediction of Prostate Cancer at Initial Biopsy in a Total PSA Range of 2-10 Ng/Ml: A Multicentric European Study. Eur Urol (2013) 63(6):986–94. doi: 10.1016/j.eururo.2013.01.011
36. Lughezzani G, Lazzeri M, Haese A, McNicholas T, de la Taille A, Buffi NM, et al. Multicenter European External Validation of a Prostate Health Index-Based Nomogram for Predicting Prostate Cancer at Extended Biopsy. Eur Urol (2014) 66(5):906–12. doi: 10.1016/j.eururo.2013.12.005
37. Tosoian JJ, Druskin SC, Andreas D, Mullane P, Chappidi M, Joo S, et al. Use of the Prostate Health Index for Detection of Prostate Cancer: Results From a Large Academic Practice. Prostate Cancer Prostatic Dis (2017) 20(2):228–33. doi: 10.1038/pcan.2016.72
38. Fossati N, Buffi NM, Haese A, Stephan C, Larcher A, McNicholas T, et al. Preoperative Prostate-Specific Antigen Isoform P2psa and Its Derivatives, %P2psa and Prostate Health Index, Predict Pathologic Outcomes in Patients Undergoing Radical Prostatectomy for Prostate Cancer: Results From a Multicentric European Prospective Study. Eur Urol (2015) 68(1):132–8. doi: 10.1016/j.eururo.2014.07.034
39. Cheng YT, Huang CY, Chen CH, Chiu ST, Hong JH, Pu YS, et al. Preoperative %P2psa and Prostate Health Index Predict Pathological Outcomes in Patients With Prostate Cancer Undergoing Radical Prostatectomy. Sci Rep (2020) 10(1):776. doi: 10.1038/s41598-020-57618-2
40. Friedersdorff F, Groß B, Maxeiner A, Jung K, Miller K, Stephan C, et al. Does the Prostate Health Index Depend on Tumor Volume?-A Study on 196 Patients After Radical Prostatectomy. Int J Mol Sci (2017) 18(3):488. doi: 10.3390/ijms18030488
41. Pinsky PF, Kramer BS, Crawford ED, Grubb RL, Urban DA, Andriole GL, et al. Prostate Volume and Prostate-Specific Antigen Levels in Men Enrolled in a Large Screening Trial. Urology (2006) 68(2):352–6. doi: 10.1016/j.urology.2006.02.026
42. Benson MC, McMahon DJ, Cooner WH, Olsson CA. An Algorithm for Prostate Cancer Detection in a Patient Population Using Prostate-Specific Antigen and Prostate-Specific Antigen Density. World J Urol (1993) 11(4):206–13. doi: 10.1007/BF00185070
43. Wolff JM, Scholz A, Boeckmann W, Jakse G. Differentiation of Benign Prostatic Hyperplasia and Prostate Cancer Employing Prostatic-Specific Antigen Density. Eur Urol (1994) 25(4):295–8. discussion 304. doi: 10.1159/000475304
44. Stephan C, Stroebel G, Heinau M, Lenz A, Roemer A, Lein M, et al. The Ratio of Prostate-Specific Antigen (PSA) to Prostate Volume (PSA Density) as a Parameter to Improve the Detection of Prostate Carcinoma in PSA Values in the Range of < 4 Ng/Ml. Cancer (2005) 104(5):993–1003. doi: 10.1002/cncr.21267
45. Elliott CS, Shinghal R, Presti JC Jr. The Performance of Prostate Specific Antigen, Prostate Specific Antigen Density and Transition Zone Density in the Era of Extended Biopsy Schemes. J Urol (2008) 179(5):1756–61. discussion 61. doi: 10.1016/j.juro.2008.01.033
46. Omri N, Kamil M, Alexander K, Alexander K, Edmond S, Ariel Z, et al. Association Between PSA Density and Pathologically Significant Prostate Cancer: The Impact of Prostate Volume. Prostate (2020) 80(16):1444–9. doi: 10.1002/pros.24078
47. Knaapila J, Jambor I, Perez IM, Ettala O, Taimen P, Verho J, et al. Prebiopsy IMPROD Biparametric Magnetic Resonance Imaging Combined With Prostate-Specific Antigen Density in the Diagnosis of Prostate Cancer: An External Validation Study. Eur Urol Oncol (2020) 3(5):648–56. doi: 10.1016/j.euo.2019.08.008
48. Boesen L, Nørgaard N, Løgager V, Balslev I, Bisbjerg R, Thestrup KC, et al. Prebiopsy Biparametric Magnetic Resonance Imaging Combined With Prostate-Specific Antigen Density in Detecting and Ruling Out Gleason 7-10 Prostate Cancer in Biopsy-Naïve Men. Eur Urol Oncol (2019) 2(3):311–9. doi: 10.1016/j.euo.2018.09.001
49. Falagario UG, Jambor I, Lantz A, Ettala O, Stabile A, Taimen P, et al. Combined Use of Prostate-Specific Antigen Density and Magnetic Resonance Imaging for Prostate Biopsy Decision Planning: A Retrospective Multi-Institutional Study Using the Prostate Magnetic Resonance Imaging Outcome Database (PROMOD). Eur Urol Oncol (2020) S2588–9311(20):30142–5. doi: 10.1016/j.euo.2020.08.014
50. Filella X, Foj L, Alcover J, Augé JM, Molina R, Jiménez W. The Influence of Prostate Volume in Prostate Health Index Performance in Patients With Total PSA Lower Than 10 μg/L. Clin Chim Acta (2014) 436:303–7. doi: 10.1016/j.cca.2014.06.019
51. Barisiene M, Bakavicius A, Stanciute D, Jurkeviciene J, Zelvys A, Ulys A, et al. Prostate Health Index and Prostate Health Index Density as Diagnostic Tools for Improved Prostate Cancer Detection. BioMed Res Int (2020) 2020:9872146. doi: 10.1155/2020/9872146
52. Schulze A, Christoph F, Sachs M, Schroeder J, Stephan C, Schostak M, et al. Use of the Prostate Health Index and Density in 3 Outpatient Centers to Avoid Unnecessary Prostate Biopsies. Urol Int (2020) 104(3-4):181–6. doi: 10.1159/000506262
53. Garrido MM, Ribeiro RM, Pinheiro LC, Holdenrieder S, Guimarães JT. The Prostate Health Index (PHI) Density: Are There Advantages Over PHI or Over the Prostate-Specific Antigen Density? Clin Chim Acta (2021) 520:133–8. doi: 10.1016/j.cca.2021.06.006
54. Peters R, Stephan C, Jung K, Lein M, Friedersdorff F, Maxeiner A. Comparison of PHI and PHI Density for Prostate Cancer Detection in a Large Retrospective Caucasian Cohort. Urol Int (2021) 25:1–6.
55. Stephan C, Jung K, Lein M, Rochow H, Friedersdorff F, Maxeiner A. PHI Density Prospectively Improves Prostate Cancer Detection. World J Urol (2021) 39(9):3273–9. doi: 10.1007/s00345-020-03585-2
56. Liu AQ, Remmers S, Lau SY, Yip SY, Leung CH, Mak CW, et al. Initial Prostate Health Index (Phi) and Phi Density Predicts Future Risk of Clinically Significant Prostate Cancer in Men With Initial Negative Prostate Biopsy: A 6-Year Follow-Up Study. Prostate Cancer Prostatic Dis (2021). doi: 10.1038/s41391-021-00444-y
57. Busetto GM, Del Giudice F, Maggi M, De Marco F, Porreca A, Sperduti I, et al. Prospective Assessment of Two-Gene Urinary Test With Multiparametric Magnetic Resonance Imaging of the Prostate for Men Undergoing Primary Prostate Biopsy. World J Urol (2021) 39(6):1869–77. doi: 10.1007/s00345-020-03359-w
58. Hsieh PF, Li WJ, Lin WC, Chang H, Chang CH, Huang CP, et al. Combining Prostate Health Index and Multiparametric Magnetic Resonance Imaging in the Diagnosis of Clinically Significant Prostate Cancer in an Asian Population. World J Urol (2020) 38(5):1207–14. doi: 10.1007/s00345-019-02889-2
59. Druskin SC, Tosoian JJ, Young A, Collica S, Srivastava A, Ghabili K, et al. Combining Prostate Health Index Density, Magnetic Resonance Imaging and Prior Negative Biopsy Status to Improve the Detection of Clinically Significant Prostate Cancer. BJU Int (2018) 121(4):619–26. doi: 10.1111/bju.14098
60. Lopes Vendrami C, McCarthy RJ, Chatterjee A, Casalino D, Schaeffer EM, Catalona WJ, et al. The Utility of Prostate Specific Antigen Density, Prostate Health Index, and Prostate Health Index Density in Predicting Positive Prostate Biopsy Outcome Is Dependent on the Prostate Biopsy Methods. Urology (2019) 129:153–9. doi: 10.1016/j.urology.2019.03.018
Keywords: prostate health index density, risk table, clinically significant prostate cancer, save unnecessary prostate biopsy, predict lethal disease
Citation: Chiu S-T, Cheng Y-T, Pu Y-S, Lu Y-C, Hong J-H, Chung S-D, Chiang C-H and Huang C-Y (2021) Prostate Health Index Density Outperforms Prostate Health Index in Clinically Significant Prostate Cancer Detection. Front. Oncol. 11:772182. doi: 10.3389/fonc.2021.772182
Received: 07 September 2021; Accepted: 29 October 2021;
Published: 19 November 2021.
Edited by:
Marco Borghesi, University of Genoa, ItalyReviewed by:
Daniela Terracciano, University of Naples Federico II, ItalyCopyright © 2021 Chiu, Cheng, Pu, Lu, Hong, Chung, Chiang and Huang. This is an open-access article distributed under the terms of the Creative Commons Attribution License (CC BY). The use, distribution or reproduction in other forums is permitted, provided the original author(s) and the copyright owner(s) are credited and that the original publication in this journal is cited, in accordance with accepted academic practice. No use, distribution or reproduction is permitted which does not comply with these terms.
*Correspondence: Chih-Hung Chiang, Z3VjaGlhbmdAZ21haWwuY29t; Chao-Yuan Huang, Y3loNTQwOTA5QGdtYWlsLmNvbQ==
Disclaimer: All claims expressed in this article are solely those of the authors and do not necessarily represent those of their affiliated organizations, or those of the publisher, the editors and the reviewers. Any product that may be evaluated in this article or claim that may be made by its manufacturer is not guaranteed or endorsed by the publisher.
Research integrity at Frontiers
Learn more about the work of our research integrity team to safeguard the quality of each article we publish.