
94% of researchers rate our articles as excellent or good
Learn more about the work of our research integrity team to safeguard the quality of each article we publish.
Find out more
ORIGINAL RESEARCH article
Front. Oncol. , 29 November 2021
Sec. Head and Neck Cancer
Volume 11 - 2021 | https://doi.org/10.3389/fonc.2021.750852
 Laveniya Satgunaseelan1,2†
 Sean Porazinski3,4†
 Dario Strbenac5
 Aji Istadi3
 Cali Willet6
 Tracy Chew6Rosemarie Sadsad6Carsten E. Palme7Jenny H. Lee8Michael Boyer2,8Jean Y. H. Yang5,9Jonathan R. Clark2,7,10
 Marina Pajic3,4‡Ruta Gupta1,2,7*‡
There is an increasing worldwide incidence of patients under 50 years of age presenting with oral squamous cell carcinoma (OSCC). The molecular mechanisms driving disease in this emerging cohort remain unclear, limiting impactful treatment options for these patients. To identify common clinically actionable targets in this cohort, we used whole genome and transcriptomic sequencing of OSCC patient samples from 26 individuals under 50 years of age. These molecular profiles were compared with those of OSCC patients over 50 years of age (n=11) available from TCGA. We show for the first time that a molecular signature comprising of EGFR amplification and increased EGFR RNA abundance is specific to the young subset of OSCC patients. Furthermore, through functional assays using patient tumor-derived cell lines, we reveal that this EGFR amplification results in increased activity of the EGFR pathway. Using a panel of clinically relevant EGFR inhibitors we determine that an EGFR-amplified patient-derived cell line is responsive to EGFR inhibition, suggesting EGFR amplification represents a valid therapeutic target in this subset of OSCC patients. In particular, we demonstrate sensitivity to the second-generation EGFR tyrosine kinase inhibitor afatinib, which offers a new and promising therapeutic avenue versus current EGFR-targeting approaches. We propose that testing for EGFR amplification could easily be integrated into current diagnostic workflows and such measures could lead to more personalized treatment approaches and improved outcomes for this younger cohort of OSCC patients.
The advent of next generation sequencing (NGS) has revolutionized our understanding of carcinogenesis and cancer care in the past decade (1). Genetic changes that may lead to carcinogenesis at a younger age or after relatively low exposure to carcinogens are being increasingly identified in a range of malignancies. For example, pulmonary adenocarcinomas in young, non-smoking patients show more frequent EGFR (epidermal growth factor receptor) exon 19 deletions and ALK (anaplastic lymphoma kinase) fusions, as compared with older patients with lifetime smoking habits (2). Similarly, melanomas in young patients with low cumulative solar ultraviolet light exposure are 2.7 times more likely to show BRAF (B-Raf Proto-Oncogene) mutations (3). These changes are amenable to therapeutic targeting which have resulted in improved survival in ALK-positive lung cancer and BRAF-mutant melanoma (4, 5). These findings suggest that malignancies occurring at a younger age and in the absence of conventional cancer risk factors, may harbor different genetic profiles when compared with older patients. Importantly, these genetic changes may be therapeutically actionable.
Oral cavity squamous cell carcinoma (OSCC) that is independent of human papillomavirus, more commonly occurs in males with a longstanding history of tobacco and alcohol use, at a median age of 61 years (6–8). Over the past decade, several studies have documented the emergence of a new demographic in OSCC, with a two- to four-fold increase in the incidence in patients younger than 45 years of age, despite falling rates of smoking (9–14). Notably, young females account for the majority, increasing at a rate of 4.9% per year (15). A recent review of all head and neck SCC (HNSCC) trials in the United States showed that trial cohorts were largely composed of older men with history of tobacco use, with a significant underrepresentation of young and female patients (16, 17). The clinical trial population in HNSCC is therefore unlikely to be representative of this emerging cohort of young patients with OSCC and therapeutic options therefore need to be explored.
In this study, using whole genome and whole transcriptome sequencing of OSCC tissues from patients younger than 50 years, we characterized the differences in the genomic and transcriptomic profiles with OSCC tissue obtained from patients older than 50 years. The differences in genomic and transcriptomic profiles of OSCC from men and women and smokers and non-smokers were also evaluated. Our data is the first to demonstrate EGFR amplification was limited to a subset of young OSCC patients, with concomitant increases in RNA abundance. Functional validation of actionable targets identified through these analyses in patient-derived cell lines revealed a potential therapeutic benefit of EGFR inhibition in EGFR-amplified OSCC.
After institutional human research ethics committee approval (X19-0282/ETH12165), a search of the Sydney Head and Neck Cancer Institute (SHNCI) databased identified 17 patients younger than 50 years of age with OSCC from 2013-2019. Fresh frozen tissues with optimal DNA, RNA and complete clinicopathologic data were available for all 17 patients. Searching the TCGA database yielded nine patients younger than 50 years of age with OSCC. These patients were included in a validation cohort. The TCGA database also included 11 patients older than 50 years of age with OSCC. These patients were included as a comparison cohort. Complete clinicopathological data including demographic, smoking, histopathology, treatment and survival data were available for the SHNCI cohort. Tumor infiltrating lymphocytes (TILs) were assessed using an established four-tier system (18), with a score of 0 given where there was no inflammatory cells; 1 representing a mild, patchy increase in inflammatory cells; 2 representing a moderate inflammatory infiltrate with some tumor island destruction; and 3 representing a florid inflammatory infiltrate with notable tumor island destruction. Smoking status was dichotomized as ‘never smoker’ (i.e. those with no history of tobacco use) and ‘ever smoker’ (i.e. those with any history of tobacco use). All SHNCI patients were screened with HPV in situ hybridization (ISH). One patient demonstrated HPV35 integration, and all other patients were HPV-negative. The available clinicopathologic data for the TCGA validation and comparison cohort were obtained from the Genomic Data Commons Portal (https://portal.gdc.cancer.gov/projects/TCGA-HNSC; dbGaP Study Accession #20551, accessed 7 October 2019). This included information regarding age, gender, smoking and survival status. Histopathologic characteristics of the tumor, treatment or progression-free or overall survival were not available.
Nucleic acids were extracted from fresh frozen OSCC tissue and matched normal (oral mucosa) using the Qiagen AllPrep Kit (Qiagen, Germantown, Maryland, USA) in accordance with the manufacturer’s instructions with purification of DNA and RNA from the same sample. DNA and RNA were quantified using Qubit V2.0 HS assays (Invitrogen, Carlsbad, USA), NanoDrop spectrophotometry (Thermo Scientific, Waltham, Massachusetts, USA) and 0.8% agarose gel electrophoresis.
DNA integrity was evaluated using the Illumina-CytoSNP-850K array (Illumina, San Diego, California, USA). Sample ploidy and purity were then assessed using “Allele-specific copy number analysis of tumors” (ASCAT) (19), to determine adequate tumor cellularity within samples. Those samples determined by ASCAT to contain an adequate tumor cell fraction (>30%) were submitted for whole genome sequencing (19). RNA quality was assessed using a BioAnalyzer (Agilent Technologies, Wilmington, Delaware USA). Samples with a RNA integrity number >8 were included (20) and only samples with high quality DNA and RNA were included in the study.
RNA was prepared using the TruSeq Stranded Total RNA with RiboZero kit. Both DNA and RNA sequencing was performed using the Illumina NovaSeq 6000 platform (NovaSeq Xp kit) at the Australian Genome Research Facility (AGRF) on the S4 flow cell to generate 150 base pair (bp) paired-end reads.
Tumoral DNA was sequenced at a target depth of 60X and non-tumoral DNA at 30X. Whole-genome sequencing (WGS) coverage was a median of 85X for tumor tissue (range 64X-140X) and 45X for normal tissue (range 16X-75X) for the SHNCI patients. For the TCGA cohort, WGS had a median coverage of 76X for tumor tissues (range 34X-85X) and 42X for normal tissues (range 30X-52X).
Raw FASTQ files were mapped to the hg38 reference genome and its alternate contigs with BWA-MEM read aligner (21) to obtain base quality score recalibrated, duplicated marked mapped BAMs. We use GATK v4.1.2.0 tools to call single nucleotide polymorphisms (SNPs) and insertion-deletion (indel) variants. Variants were annotated with their likely effects using ENSEMBL Variant Effect Predictor version 99·2 on default settings except for –pick which selects one effect per variant based on a list of ranked criteria (22). Tumors were assigned an aneuploidy score, which was defined as the total number of altered chromosome arms (23). The workflow is adapted (or based on) BROAD’s best practices workflow for “data pre-processing for variant discovery”, “germline short variant discovery (SNPs + Indels)” and “somatic short variant discovery (SNVs + Indels)”. The detailed description of the methods is available on the Sydney Informatics Hub Github repository (24–26).
Catalogue of Somatic Mutations in Cancer (COSMIC) mutational signature analysis was performed using both COSMIC v2 (27) and COSMIC v3 (28). Both versions yielded similar results for both the SHNCI and the TCGA cohorts. Thus all mutation signature data are presented in the most recent COSMIC v3 format (28), using the MutationalPatterns Bioconductor package (29). Mutational profiles are reconstructed using the relative contributions of known COSMIC v3 signatures in each sample.
We inferred the purity and ploidy across each cancer sample’s genome using the AMBER-COBALT-PURPLE pipeline provided in HMF Tools (30, 31). Whole-genome duplication (WGD) is reported as binary value in each sample’s summary file generated by PURPLE (PURity and Ploidy Estimator, version 2·4·1). The value ‘true’ is returned based on whether at least 11 of the 22 autosomes have a major allele ploidy exceeding 1·5 for at least half of the bases in the autosome. Non-integer copy number estimates were rounded to the nearest integer and a copy number of 0 or 1 was considered a deletion and a copy number of 6 or more was considered a high-level amplification.
Amplifications and deletions are defined based on the TCGA Project’s convention (32). The definition is dependent on whether the cancer sample is inferred to be mostly diploid or having undergone whole genome duplication. If a sample is diploid, then deletion is defined as a gene which has a copy number of zero and amplification is defined as a gene which has a copy number of five or more. However, if a sample is inferred to have had its genome duplicated, a deletion is defined as a gene with a copy number of at least three copies less than the sample ploidy and an amplification is defined as a gene which has at least eight copies.
A chromosome arm is defined to be deleted if at least half of its bases are one or more copies less than the sample ploidy. A chromosome arm is defined to be amplified if at least half of its bases are one or more copies more than the sample ploidy.
RNA sequencing data was preprocessed using a custom pipeline. Firstly, Illumina TruSeq adapters were trimmed using cutadapt version 2.4 (33) which also removed consecutive bases from 3’ read ends with a Phred-scale quality score of below 20. Next, STAR version 2.7.2 (34) was used to align the reads to the GRCh38 reference genome as well as output alignments in transcriptomic coordinates using the option –quantMode TranscriptomeSAM. The transcript database GENCODE Genes version 31 was used. Reads mapping to multiple locations were allowed and such read alignments were assigned to a particular gene using RSEM (35).
FISH was performed as an orthogonal method to evaluate the copy number calling of the bioinformatics pipeline using a tissue microarray (TMA) constructed from the formalin fixed paraffin embedded SHNCI samples. Interphase FISH for EGFR (Vysis EGFR/CEP7 Probe Kit, Abbott, Wiesbaden, Germany) was undertaken in a clinically accredited laboratory. Deparaffinization of unstained 4µm formalin-fixed paraffin-embedded tissue sections was performed. Heat-induced epitope retrieval (HIER) pre-treatment with a neutral buffered solution (SPoT-Light Tissue Pretreatment Solution, Thermo Scientific, MA, USA) was then carried out. Tissue sections underwent proteolytic digestion with Protease 1 (Abbott Molecular, IL, USA). A saline-sodium citrate (SSC) buffer rinse then followed. Probe application and denaturing of both the target chromosome and gene probe for 5 minutes at 95°C was completed, after which overnight probe hybridization at 37°C occurred. Dehydration and counterstaining with 4,6-diamidino-phenyldinol (SlowFade™ Gold DAPI, Invitrogen, CA, USA) was subsequently performed. Enumeration of the interphase signals in 100 tumor cell nuclei was undertaken with an epifluorescence microscope (Zeiss, CA, USA).
Immunohistochemical staining for EGFR was performed to evaluate the protein expression following EGFR CNV using the Leica BOND-III automated staining platform (Leica Biosystems, Melbourne, Australia) according to the manufacturer’s instructions. Bond enzyme pretreatment was undertaken for 15 minutes at 37°C. The primary antibody (EGFR; DAKO; clone: H11, dilution 1:100) was incubated for 30 minutes at ambient room temperature. Leica BOND Polymer Refine Detection was used according to standard BOND-III protocol. Immunohistochemical expression was quantified based on a clinically established four-tier system used to evaluate HER2 IHC expression (36): negative, no staining; 1+: cytoplasmic staining or faint incomplete membrane staining in >10% of tumor cells; 2+: unequivocal complete membrane staining of weak to moderate intensity in >10% of tumor cells; 3+, unequivocal membrane staining of strong intensity in >10% of tumor cells.
OSCC cell lines were generated by mechanically and enzymatically dissociating patient-derived tumors using the human Tumor Dissociation Kit (Miltenyi Biotec, AU) and gentleMACS Octo dissociator in accordance with the manufacturer’s instructions. Cell suspensions were plated onto flasks coated with 0.2mg/ml rat tail I collagen (BD Biosciences, USA) and cultured at 37°C in a 5% CO2 humidified incubator. The TKCC-OSCC-16 and TKCC-OSCC-22 cell lines were cultured in DMEM/F-12 (Thermo Fisher Scientific, AU) supplemented with fetal bovine serum (10%), 15mM HEPES (Thermo Fisher Scientific, AU) and 400ng/mL hydrocortisone (Sigma-Aldrich, USA). For TKCC-OSCC-22 cells, the media was further supplemented with 10ng/mL human recombinant epidermal growth factor (Thermo Fisher Scientific, AU), 0.1IU/mL insulin (Novo Nordisk, DK) and 1x MEM vitamins.
Lysates for western blotting were generated by harvesting log-phase cells, washing twice in PBS and lysing at 4°C in lysis buffer [Glycerol (10%), MgCl2 (0.03%), HEPES (1.2%), SAPP (1%), Triton (1%), NaCl (0.8%), NaF (0.4%), EGTA (0.04%)] supplemented with protease inhibitors [MG132 (21µM), Aprotinin (1.5µM), DTT (1µM), Leupeptin (23µM), Sodium Vanadate (1mM), PMSF (1µM)]. Cell debris was removed via centrifugation and protein concentration quantified using a Pierce BCA assay kit (Thermo Fisher Scientific, AU). Samples (20µg total protein) were resolved by SDS-PAGE on a Bis-Tris gel (4-12%) followed by transfer to a PVDF (0.45µM) membrane (Life Technologies, AU). Membranes were blocked in 5% non-fat milk in TBS-T [NaCl (0.87%), Tris (0.12%), Tween20 (0.1%)] followed by overnight primary antibody incubation at 4°C. Antibodies for EGFR (#4267) and pEGFR (Tyr1068, #2234) were purchased from Cell Signaling Technologies (Genesearch, AU). Detection was performed using an HRP-conjugated enhanced chemiluminescence-based system (Perkin-Elmer, AU) and relative protein expression was quantified using ImageJ2 Software (V2.1.0, NIH, US).
To examine the potential of EGFR as a therapeutic target in the EGFR-amplified OSCC, we performed cytotoxicity assays using a panel of six small molecule EGFR inhibitors with differing specificity on our PDCLs and compared these to select publicly available drug sensitivity data (37, 38). Cells for cytotoxicity assays were seeded in 96-well plates and 24h post-seeding, cetuximab (Eli Lilly/Merck), erlotinib, lapatinib, afatinib, gefitinib or saracatinib (all from Selleck Chemicals, USA) were added. Cell viability was measured at 96h post-seeding with alamarBlue (Life Technologies, AU) assays using a FLUOstar Omega (BMG LABTECH, Ortenberg, Germany) plate reader (Excitation 530-560nm, Emission 590nm). IC50 values were calculated using GraphPad Prism (V9.0.0, GraphPad, La Jolla, California, USA).
The median and median absolute deviations (MAD) were calculated for tumour mutation burden (TMB). The differences in the TMB were assessed using Mann Whitney U test. Comparisons of SNVs, CNVs and chromosomal differences were performed using Fisher’s exact test. Statistical comparisons for cytotoxicity assays were performed with unpaired two-tailed t-tests using GraphPad Prism. Data are reported as means and error bars show standard error of the mean. Survival differences between groups of patients were compared using a log-rank test.
Overall, the study included 37 OSCC patients, with 26 patients under 50 years of age and 11 patients over 50 years of age. The 26 patients <50 years included 17 patients from the SHNCI database and 9 patients from the TCGA cohort. These 26 patients comprised of 17 (65%) males and nine (35%) females with a median age of 42 years (range 19 to 50 years). The 11 patients ≥50 years from the TCGA cohort was comprised of seven (64%) males and four (36%) females with a median age of 62 years (range 52 to 79 years). Smoking data was available for 21/26 patients <50 years. Of these, 11 (52%) were smokers and 10 (48%) were non-smokers. Of the 11 patients ≥ 50 years, there were 10 (91%) smokers and one non-smoker. The clinicopathologic characteristics of the cohort are described in Table 1.
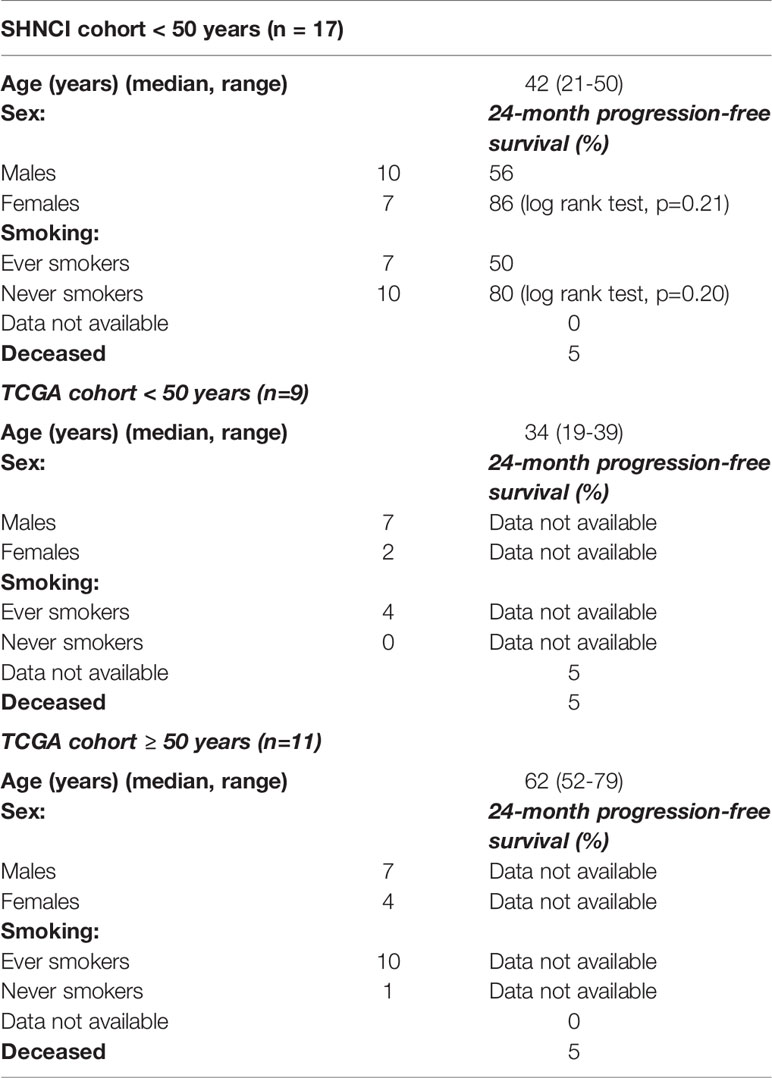
Table 1 Cohort demographics.
Follow up and survival data was available for the 17 SHNCI patients. Of these, six patients had recurrent disease and five patients were deceased. Follow-up time ranged between 6 months and 5 years. Survival data was not available in the TCGA cohort and progression-free survival (PFS) could therefore not be assessed. In the SHNCI cohort, males trended towards lower 24-month PFS compared to females (log rank test, p=0.21, Table 1). Also, smokers trended towards lower 24-month PFS as compared to non-smokers (log-rank test, p=0.20, Table 1).
Analyses of the coding regions of all 26 OSCC genomes in patients <50 years revealed 278,193 somatic variants, of which 248,475 (89%) were single-nucleotide variations (SNVs) and the remaining were small insertions and deletions (Supplementary Tables 1, 2). Microsatellite instability was assessed as a potential driver of carcinogenesis, particularly in the young cohort. All patients <50 years demonstrated microsatellite stability, and no somatic variants were seen in POLE and MUTYH.
In the SHNCI cohort, the average TMB was 2.98 variants per megabase (Mb). The TCGA validation cohort of OSCC patients <50 years showed an average TMB of 4.35 variants per Mb. The median TMB of all patients <50 years was 3.20 variants per Mb (MAD = 1.08, Figure 1A). A comparison of the median TMB of patients <50 years and those ≥50 years demonstrated a significantly lower TMB in patients <50 years (3.20 variants per Mb, MAD = 1.08) as compared with patients ≥50 years (8.45 variants per Mb, MAD = 3.05) (Mann-Whitney U test, p<0.001, Figure 1A; Table 2). There was no difference in TMB by sex (Figure 1B). Interestingly, the interaction of age and sex yielded a significantly lower median TMB in females <50 years (3.18 variants per Mb, MAD = 1.11), the emerging OSCC demographic, as compared to males ≥50 years (10.51 variants per Mb, MAD = 2.73), the typical OSCC demographic (Mann-Whitney U test, p<0.001, Figure 1C; Table 2).
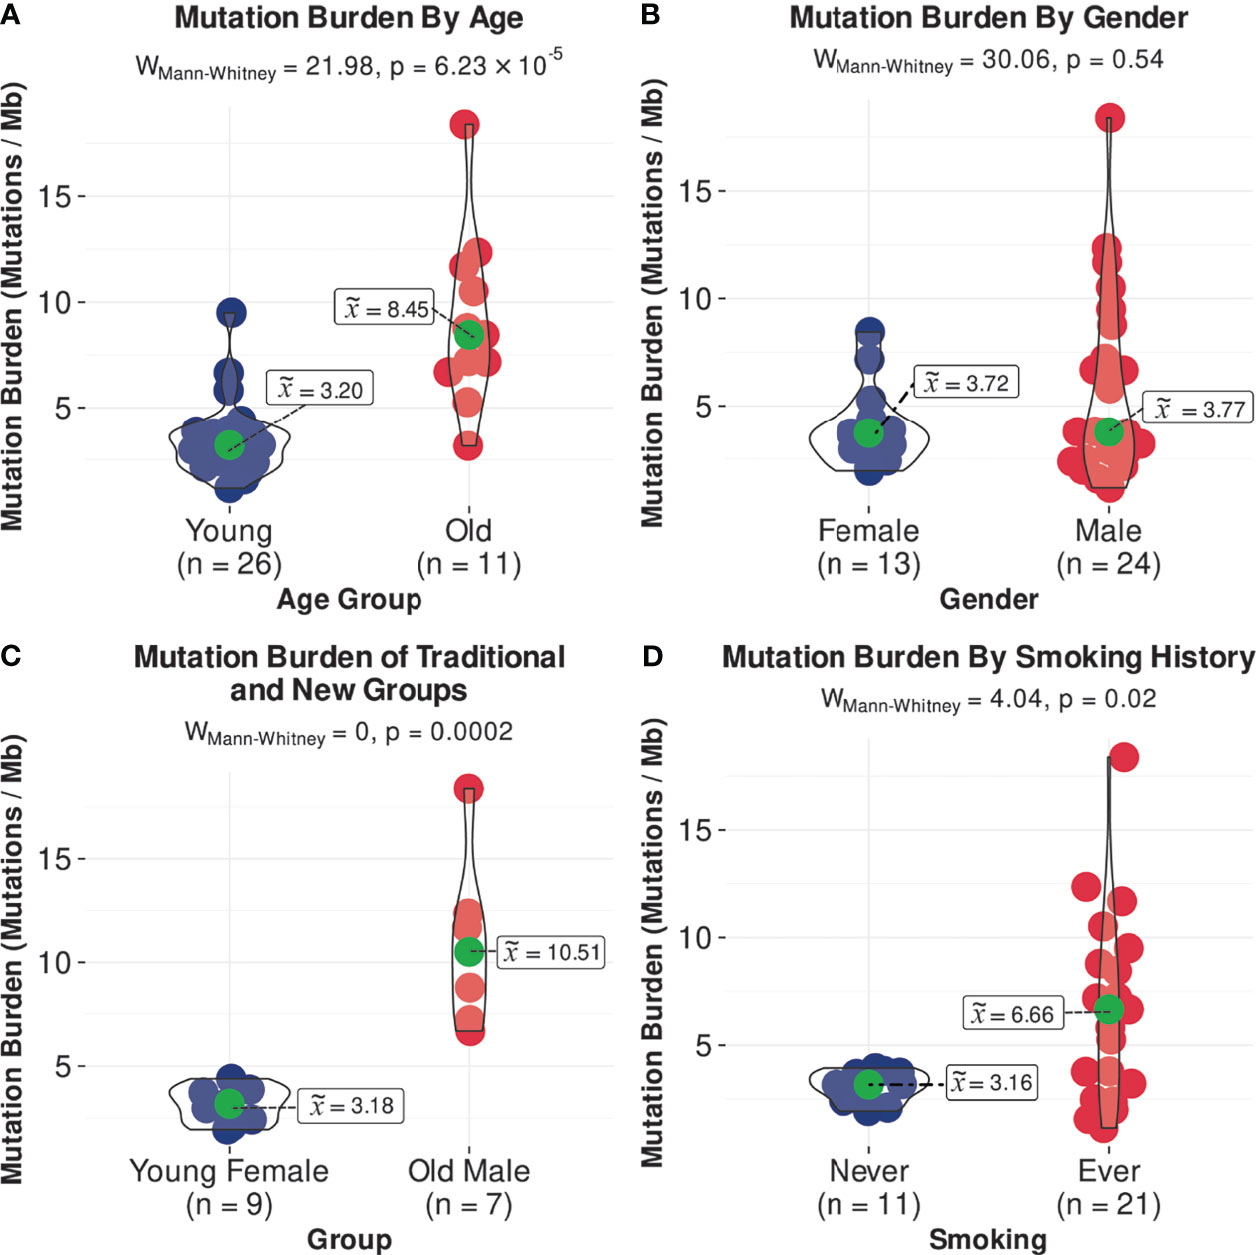
Figure 1 Comparisons of median TMB, (A) by age, (B) by gender, (C) in females <50 years and males >/=50 years, and (D) by smoking status.
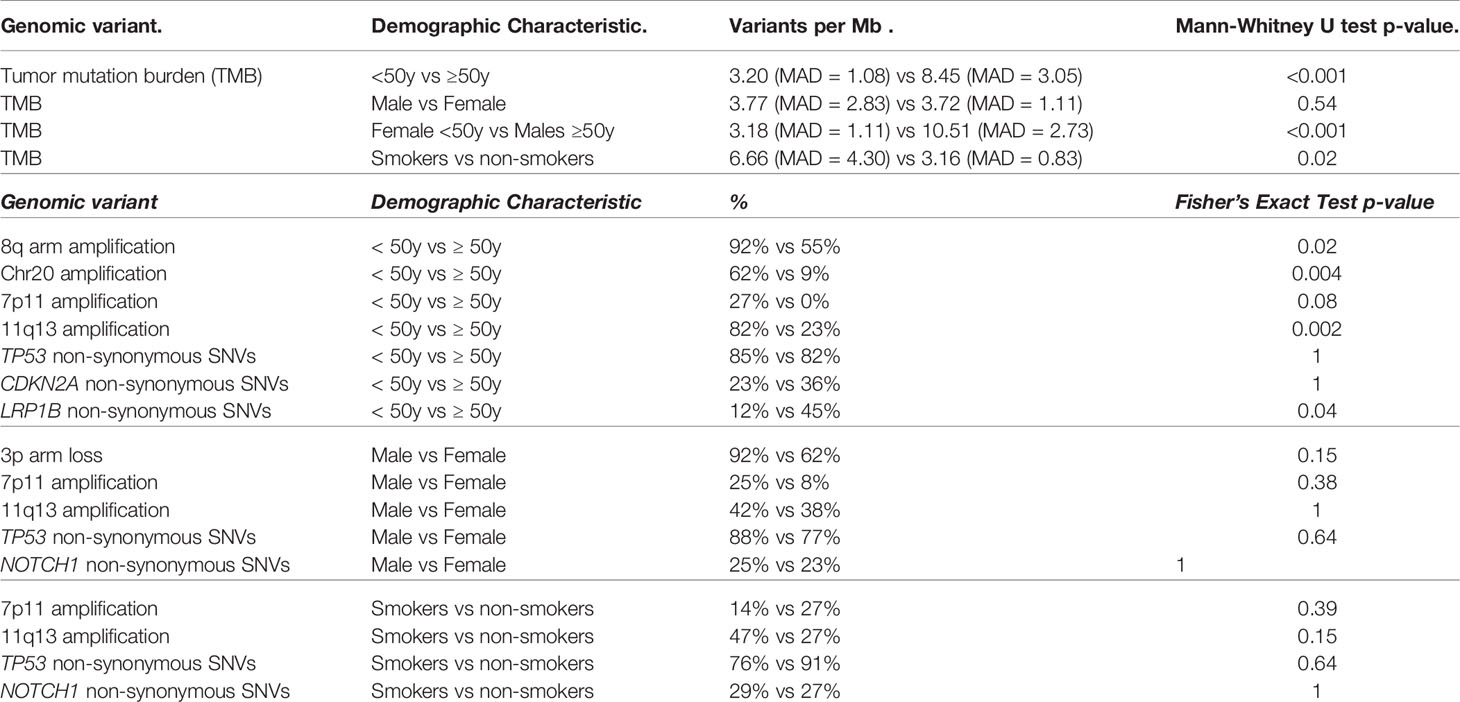
Table 2 Notable genomic differences by demographic characteristics.
COSMICv3 single base substitution signature (SBS) 1 and 5 (27, 28), associated with accumulation of mutations with age and characterized by C>T single base substitutions (SBSs) (27, 28), was the dominant pattern. This was seen in 13 (76%) patients from the SHNCI cohort and six patients from the TCGA <50 years cohort (67%, Figure 2). No patients, including those with a smoking history demonstrated SBS4 and/or SBS92 signatures, associated with tobacco carcinogens (39) (Figure 2).
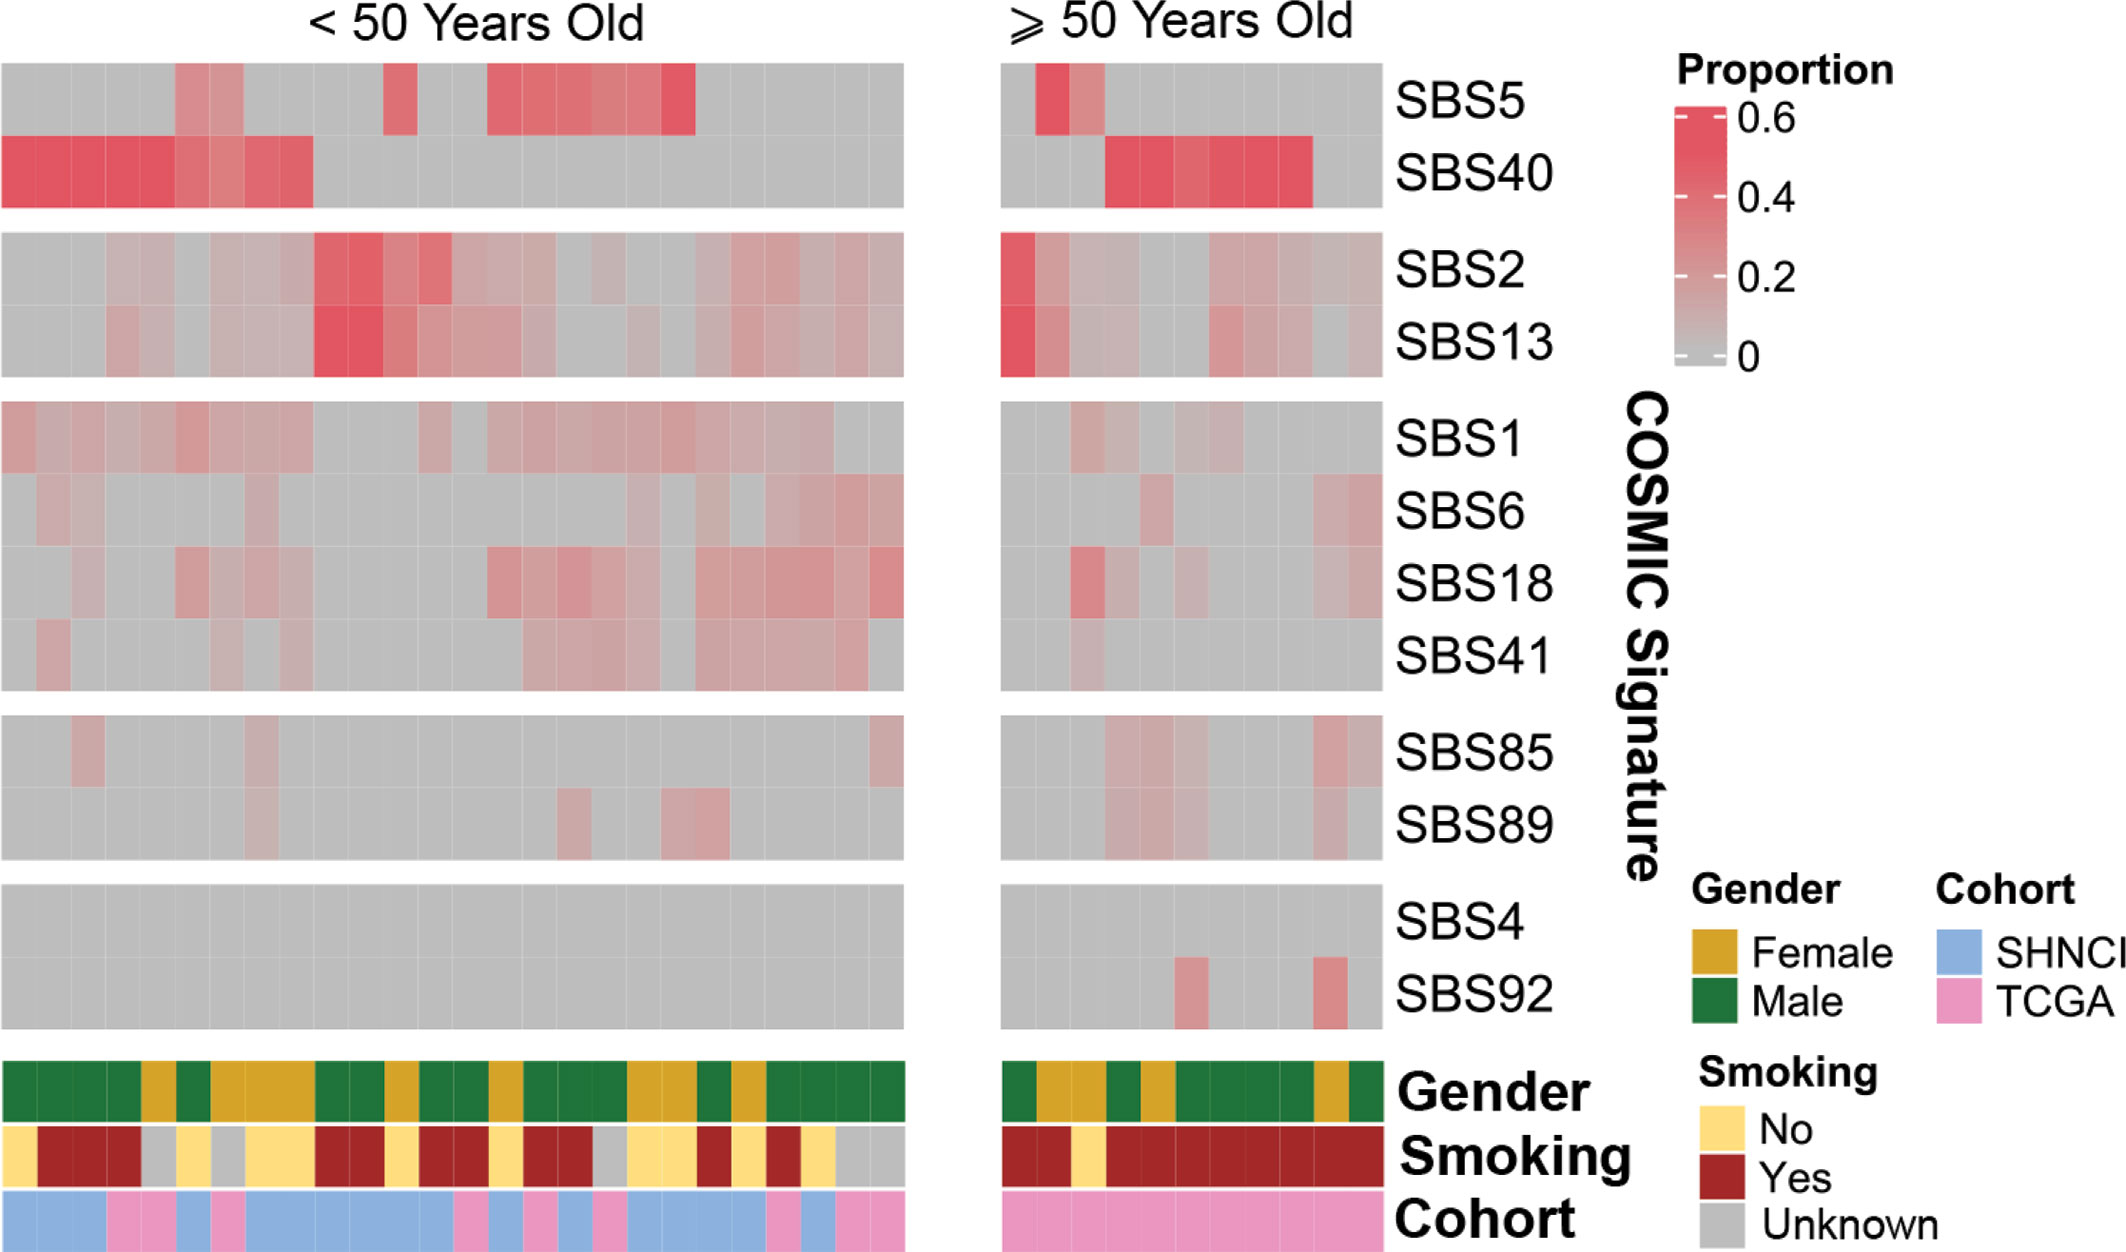
Figure 2 Reconstructed mutational profiles using the relative contributions of known COSMIC v3 signatures in each OSCC sample: COSMIC signature composition for each patient, grouped by age, gender and smoking status.
The most common chromosomal arm amplifications in the SHNCI cohort included 8q (n=15, 88%), 20q (n=11, 65%) and 20p (n=10, 59%) (Figure 3). The most common chromosome arm deletions in the SHNCI cohort included chromosome 3p (40) (n=14, 82%) and chromosome 8p (n=13, 76%). Loss of Y chromosome was seen in three male patients (30% of male patients <50 years). Similar chromosomal arm level amplifications and deletions were seen in the TCGA <50 years cohort, with 8q amplification (n=9, 100%), chromosome 20 amplification (n=7, 79%), 3p deletions (n=7, 79%) and 8p deletions (n=7, 79%) observed (Figure 3). RNA sequencing did not demonstrate a resultant increased fold change in transcription factor target genes on 8q, 20q and 20p in either cohort.
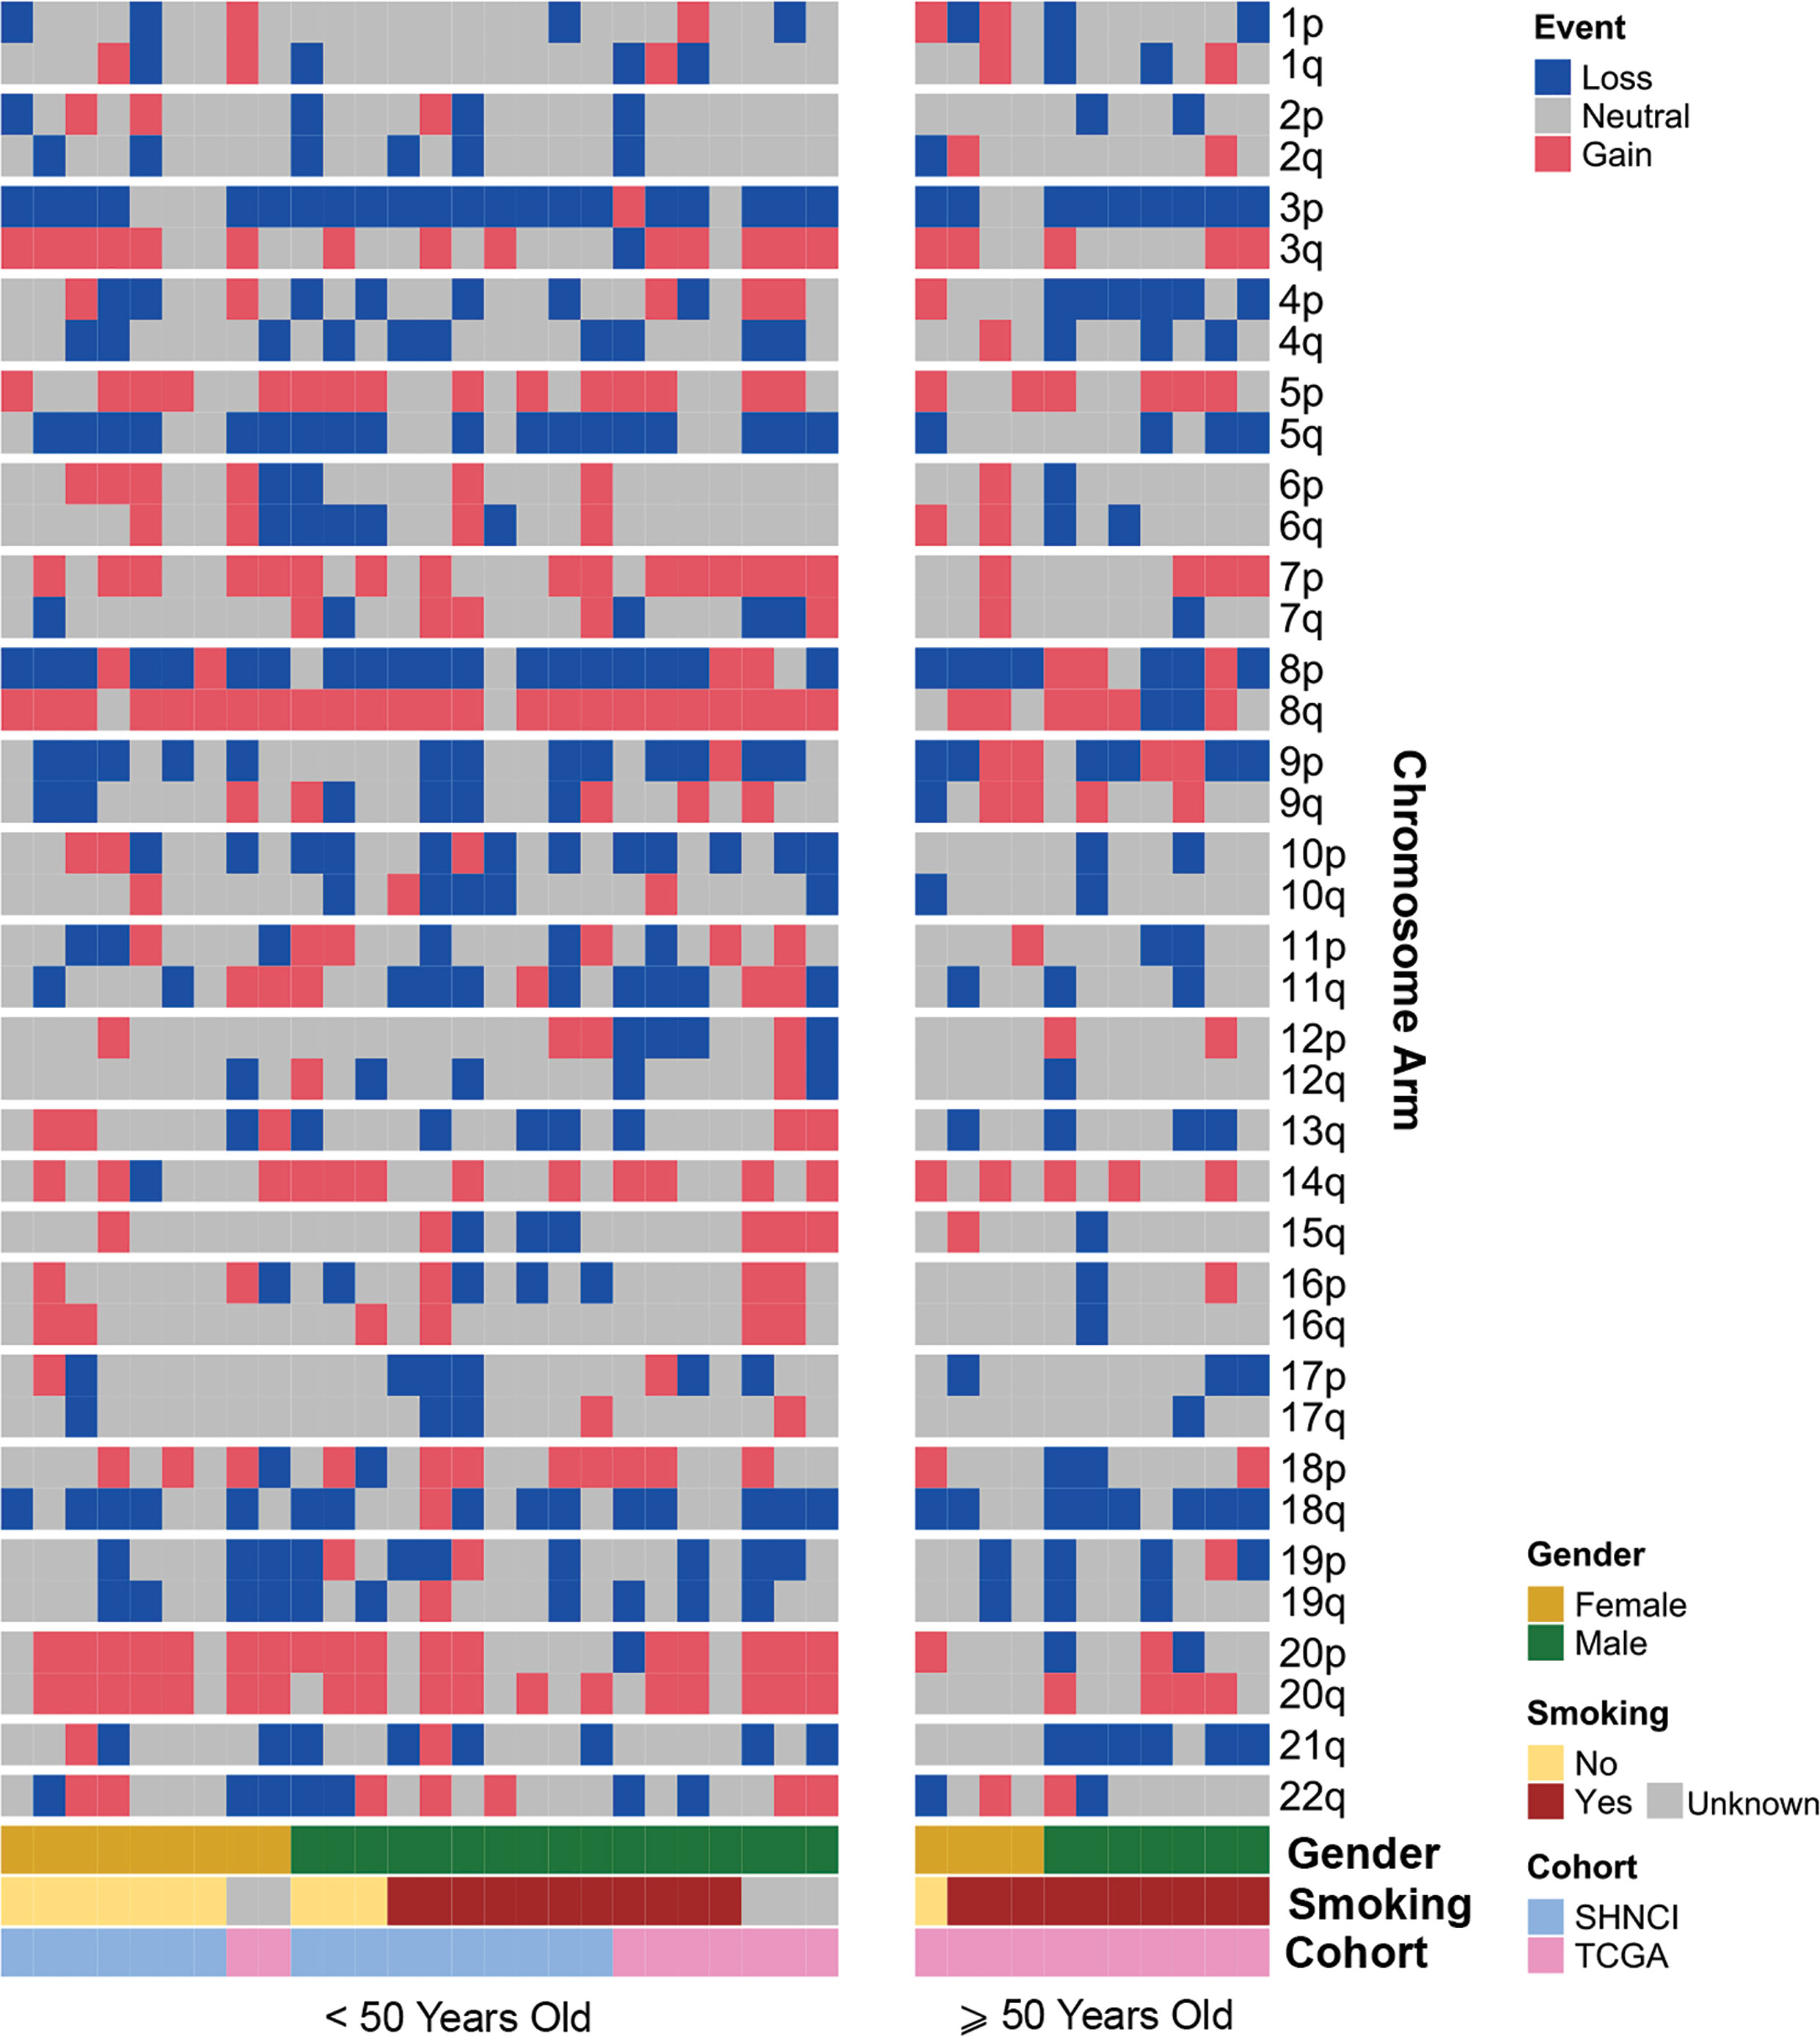
Figure 3 Distribution of chromosomal arm gains and losses in patients <50 years and ≥50 years, grouped by age, gender and smoking status.
Somatic copy number alterations (SNCAs), including amplifications of EGFR, EGFR-AS1, and LANCL2 (located at Chr7p.11, n=5, 29%) and amplifications of ANO1, CCND1, FGF3, FGF4, ORAOV1 and CTTN (located at Chr11q.13, n=4, 24%) were present in the SHNCI cohort (Figure 4A; Supplementary Table 3). Both EGFR and LANCL2 showed increased RNA abundance with increasing relative copy number (Figure 4B). In contrast, accompanying changes in RNA abundance were not observed for EGFR-AS1 or the genes present at 11q.13 (Figure 4B). The CNV profile was reproduced in the TCGA <50 years cohort, with amplification at 7p.11 (n=2, 22%) and 11q.13 (n=1, 11%, Figure 4A), with a similar transcriptomic profile.
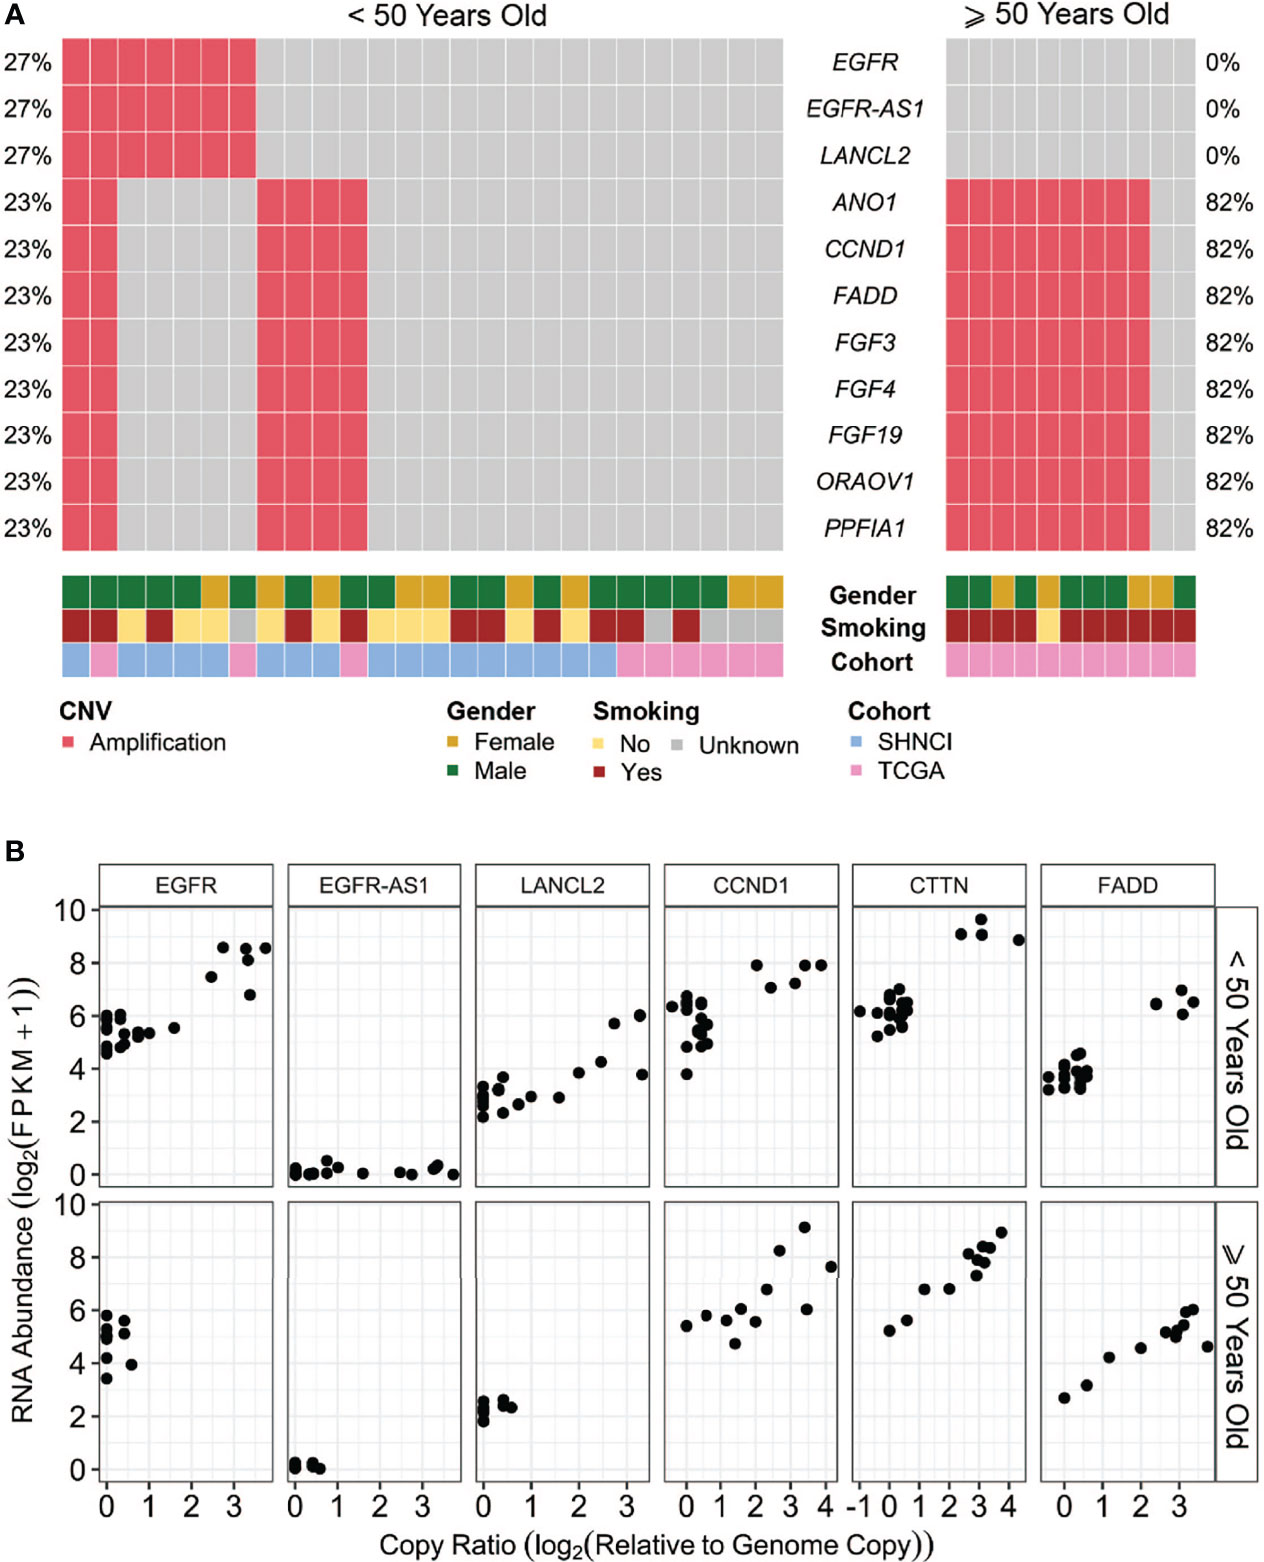
Figure 4 (A) Somatic copy number alterations (SCNAs) in patients <50 years and ≥50 years, grouped by age, gender and smoking status: The most common copy number variants occurring in over 20% of patients, with (B) associated RNA abundance.
The most common deletion was CDKN2A/B, observed in three patients in the SHNCI cohort (18%) and one in the TCGA <50 years cohort (11%). Of these, two patients showed low levels of CDKN2A RNA expression, while one patient showed an approximately 10-fold gene abundance increase in RNA. This may be due to an epigenomic phenomenon, such as aberrant methylation or transcription factor binding to the promoter region.
Non-synonymous SNVs were more frequent in tumor suppressor genes than oncogenes (Figure 5). The most common non-synonymous SNVs in the SHNCI cohort were in TP53 (n=15, 88%), of which 10 patients showed missense mutations with concomitant changes in RNA expression (40). RNA expression could not be evaluated in the remaining five patients who harbored insertion/deletions in TP53, due to the potential confounding factor of nonsense mediated decay. The TCGA <50 years cohort demonstrated comparable findings, with the most commonly affected gene being TP53 (n=7, 78%); six patients (67%) with TP53 SNVs identified had accompanying changes in RNA expression. The next most commonly affected gene was CDKN2A, where SNVs were seen in two patients in the SHNCI group (12%) and four patients in the TCGA <50 years cohort (44%). However, no transcriptomic alterations were detected. Non-synonymous SNVs in oncogenes were rare, with isolated patients showing nucleotide changes in PIK3CA (TCGA cohort: n=1, 11%) and KIT (SHNCI cohort: n=1, 6%). No RNA changes were apparent as a result of SNVs in the limited oncogenes affected.
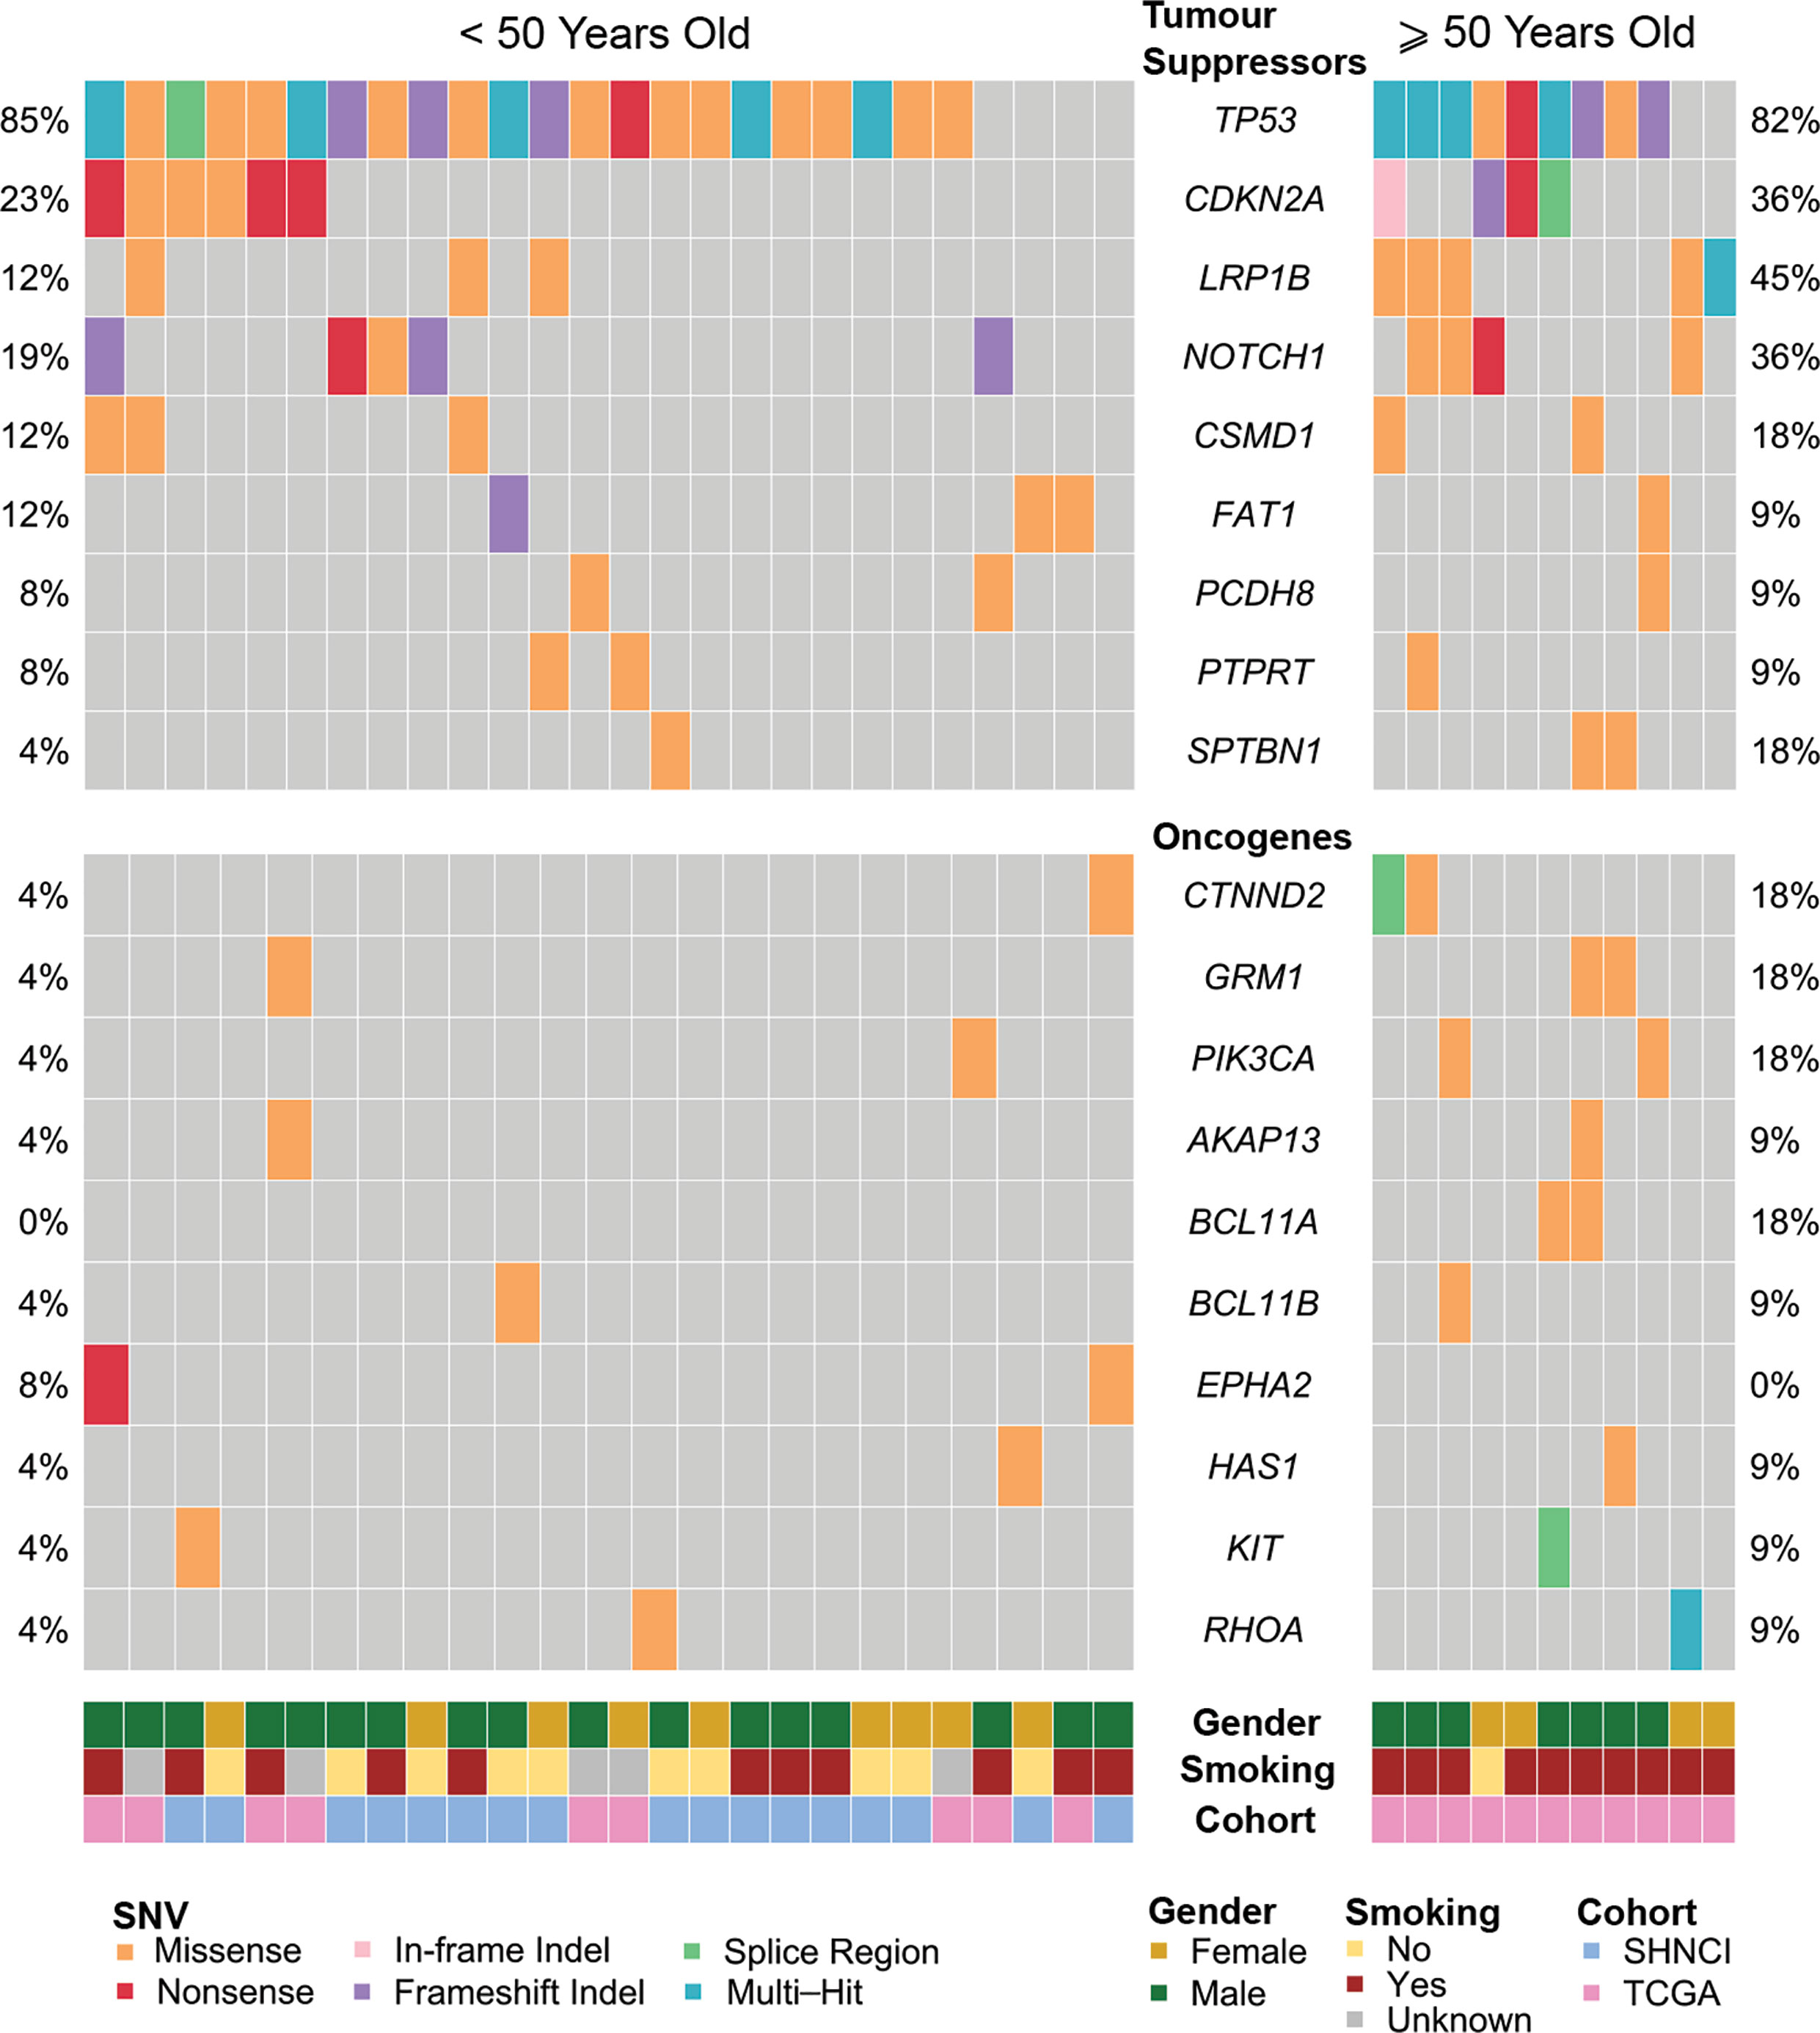
Figure 5 Frequent single nucleotide variants in patients <50 years and ≥50 years, occurring in tumor suppressor genes, and oncogenes.
FFPE material for histological evaluation of TILs was only available for the SHNCI cohort and showed that the majority of both EGFR-amplified and non-amplified cases showed low levels of TILs (Supplementary Figure 1).
There were significant differences in genomic profiles according to age. The median TMB in patients ≥50 years was more than double patients <50 years, with a median TMB of 8.45 (MAD = 3.05) versus 3.20 variants per Mb (MAD = 1.08), respectively (Mann-Whitney U test, p<0.001, Figure 1A; Table 2). The median TMB for males ≥50 years (10.51 variants per Mb, MAD = 2.73) was more than triple females <50 years (3.18 variants per Mb, MAD = 1.11; Mann-Whitney U test, p<0.001, Figure 1C; Table 2).
COSMIC SBS2 and SBS13, associated with the activation-induced deaminase (AID) and apolipoprotein B mRNA editing catalytic polypeptide-like (APOBEC) family of cytidine deaminases (27, 28), was the dominant pattern seen in 9/11 (82%) TCGA patients ≥50 years (Figure 2).
At the chromosomal arm level, 8q amplification was significantly more common in the patients <50 years [24/26 (92%) versus 6/11 (55%) ≥50 years, Fisher’s exact test, p=0.02, Table 2]. Whole chromosome 20 amplification was observed more frequently in patients <50 years (16/26 (62%) versus 1/11 (9%) ≥50 years, (Fisher’s exact test, p=0.004, Table 2). All male patients ≥50 years showed Y chromosome deletion, compared with only 3/17 (17%) male patients <50 years (Figure 3). Transcriptomic changes were not observed in association with the frequently recurrent chromosome arm level changes.
Interestingly, amplification of EGFR, EGFR-AS1 and LANCL2 were not seen in any of the patients ≥50 years, versus 7/26 (27%) patients <50 years (Fisher’s exact test, p=0.08, Figure 4A; Table 2). Conversely, CNVs of 11q.13 with amplification of CCND1, CTTN, FADD, FGF3 and FGF4 were more frequent in patients ≥50 years (9/11 (82%) versus 6/26 (23%) patients <50 years; Fisher’s exact test, p=0.002, Figure 4A; Table 2). Like patients <50 years, an increase in RNA abundance with increase in relative copy numbers of CCND1, CTTN and FADD was observed in patients ≥50 years (Figure 4B). An increase in RNA abundance with increase in relative copy numbers was limited to three (27%) patients ≥50 years for FGF3 and two (19%) patients ≥50 years for FGF4.
All patients ≥50 years demonstrated microsatellite stability. While there were no MUTYH variants, one patient ≥50 years (11%) harbored a missense mutation in POLE. A high frequency of TP53 variants (nine patients, 82%) was also observed in the ≥50 year cohort (Figure 5), of which six patients (55%) showed changes in RNA. SNVs in LRP1B occurred in five patients in the ≥50 year cohort (45%), as compared to three patients (12%) in the <50 year cohort. CDKN2A mutations occurred at similar frequencies in both cohorts (6/26 (23%) <50 years versus 4/11 (36%) ≥50 years, Figure 5).
The median TMB in females (3.72 variants per Mb, MAD = 1.11) was similar to males (3.77 variants per Mb, MAD = 2.83; Figure 1B), although a significant difference was observed on stratification by age (Figure 1C; Table 2). There were no differences in COSMIC mutation signature patterns between males and females (Figure 2). Chromosomal arm alterations also occurred at similar frequencies, with the exceptions of chromosome 3p loss [eight (62%) females versus 22 (92%) males, Figure 3; Table 2]. SCNAs were seen predominantly in males. EGFR, EGFR-AS1 and LANCL2 amplification with increased RNA abundance was found in seven patients, six of whom were male (Figures 4A, B; Table 2). Focal amplification of chromosome 11q.13, including CCND1, FGF3 and FGF4 was seen in 13 patients (35%) of which eight were male (Figure 4A; Table 2). Associated transcriptomic changes were seen in CCND1, CTTN and FADD. Similarly, SNVs in tumor suppressor genes were observed largely in males. SNVs in TP53 were the most frequent in the cohort, seen in 31 patients overall, with 21 of these being male (Table 2). The next most frequent SNV was NOTCH1 seen in nine patients overall, of which six were male (Table 2). As SNVs in oncogenes were uncommon, a sex preponderance was not detected (Figure 5).
Overall, there were 11 non-smokers, 21 smokers and smoking information unavailable for five patients <50 years from the TCGA validation cohort. Smokers demonstrated a two-fold increase in TMB (6.66 variants per Mb, MAD = 4.30) compared with non-smokers (3.16 variants per Mb, MAD = 0.83; Mann-Whitney U test, p=0.02, Figure 1D; Table 2). Non-smokers predominantly showed SBS1 (10/11, 91%), whereas the AID/APOBEC mutational signatures (SBS2 and SBS13) was the most frequent signature in smokers (16/21, 76%). Of note, the tobacco associated signature SBS4 was not seen in any patient and SBS92 was seen in only two smokers (10%) (Figure 2).
Smokers were more likely to have 11q.13 (harboring ANO1, CCND1, FGF3, FGF4, ORAOV1 and CTTN) amplifications (12/21 (47%) smokers versus 3/11 (27%) non-smokers, Fisher’s exact test, p=0.15; Figure 4A; Table 2), with concomitant increases in RNA abundance in CCND1, CTTN and FADD. Focal amplification of 7p.11 (including the genes EGFR, EGFR-AS1 and LANCL2) occurred in three smokers (14%) and three non-smokers (27%) (Figure 4A; Table 2), with an associated increase in RNA abundance of EGFR and LANCL2 (Figure 4B). The SNV profile was also similar, with TP53 mutations frequent in both smokers (16/21, 76%) and non-smokers (10/11, 91%) (Table 2). NOTCH1 mutations were infrequent in both cohorts (24% in smokers and 27% in non-smokers, Figure 5; Table 2). All patients for whom smoking data was available were microsatellite stable.
EGFR amplification was observed in 7/26 (27%) OSCCs from patients <50 years with an average of >20 copies per tumor (Figure 6A). This represented the only genetic change with currently FDA-approved therapy. Orthogonal confirmation with FISH and IHC on FFPE was only possible for the patients in SHNCI cohort. All patients with EGFR CNVs were found to have EGFR amplification by FISH (median copy number 15, range 10 to 200, Figure 6B). Two cases demonstrated intratumoral heterogeneity with aggregates of markedly EGFR-amplified cells surrounded by clusters of SCC cells with similar histologic appearance but no amplification (Supplementary Figure 2). Of the five patient tumors with identified EGFR amplification, all showed membranous EGFR protein expression (three showed 3+ staining and two showed 2+ staining in >10% of tumor cells; Supplementary Figure 3). Patient tumors without EGFR SCNAs did not demonstrate EGFR amplification by FISH or 3+ membranous staining with IHC. All of the non-amplified cases showed EGFR immunostaining intensity of 0, 1+ and 2+.
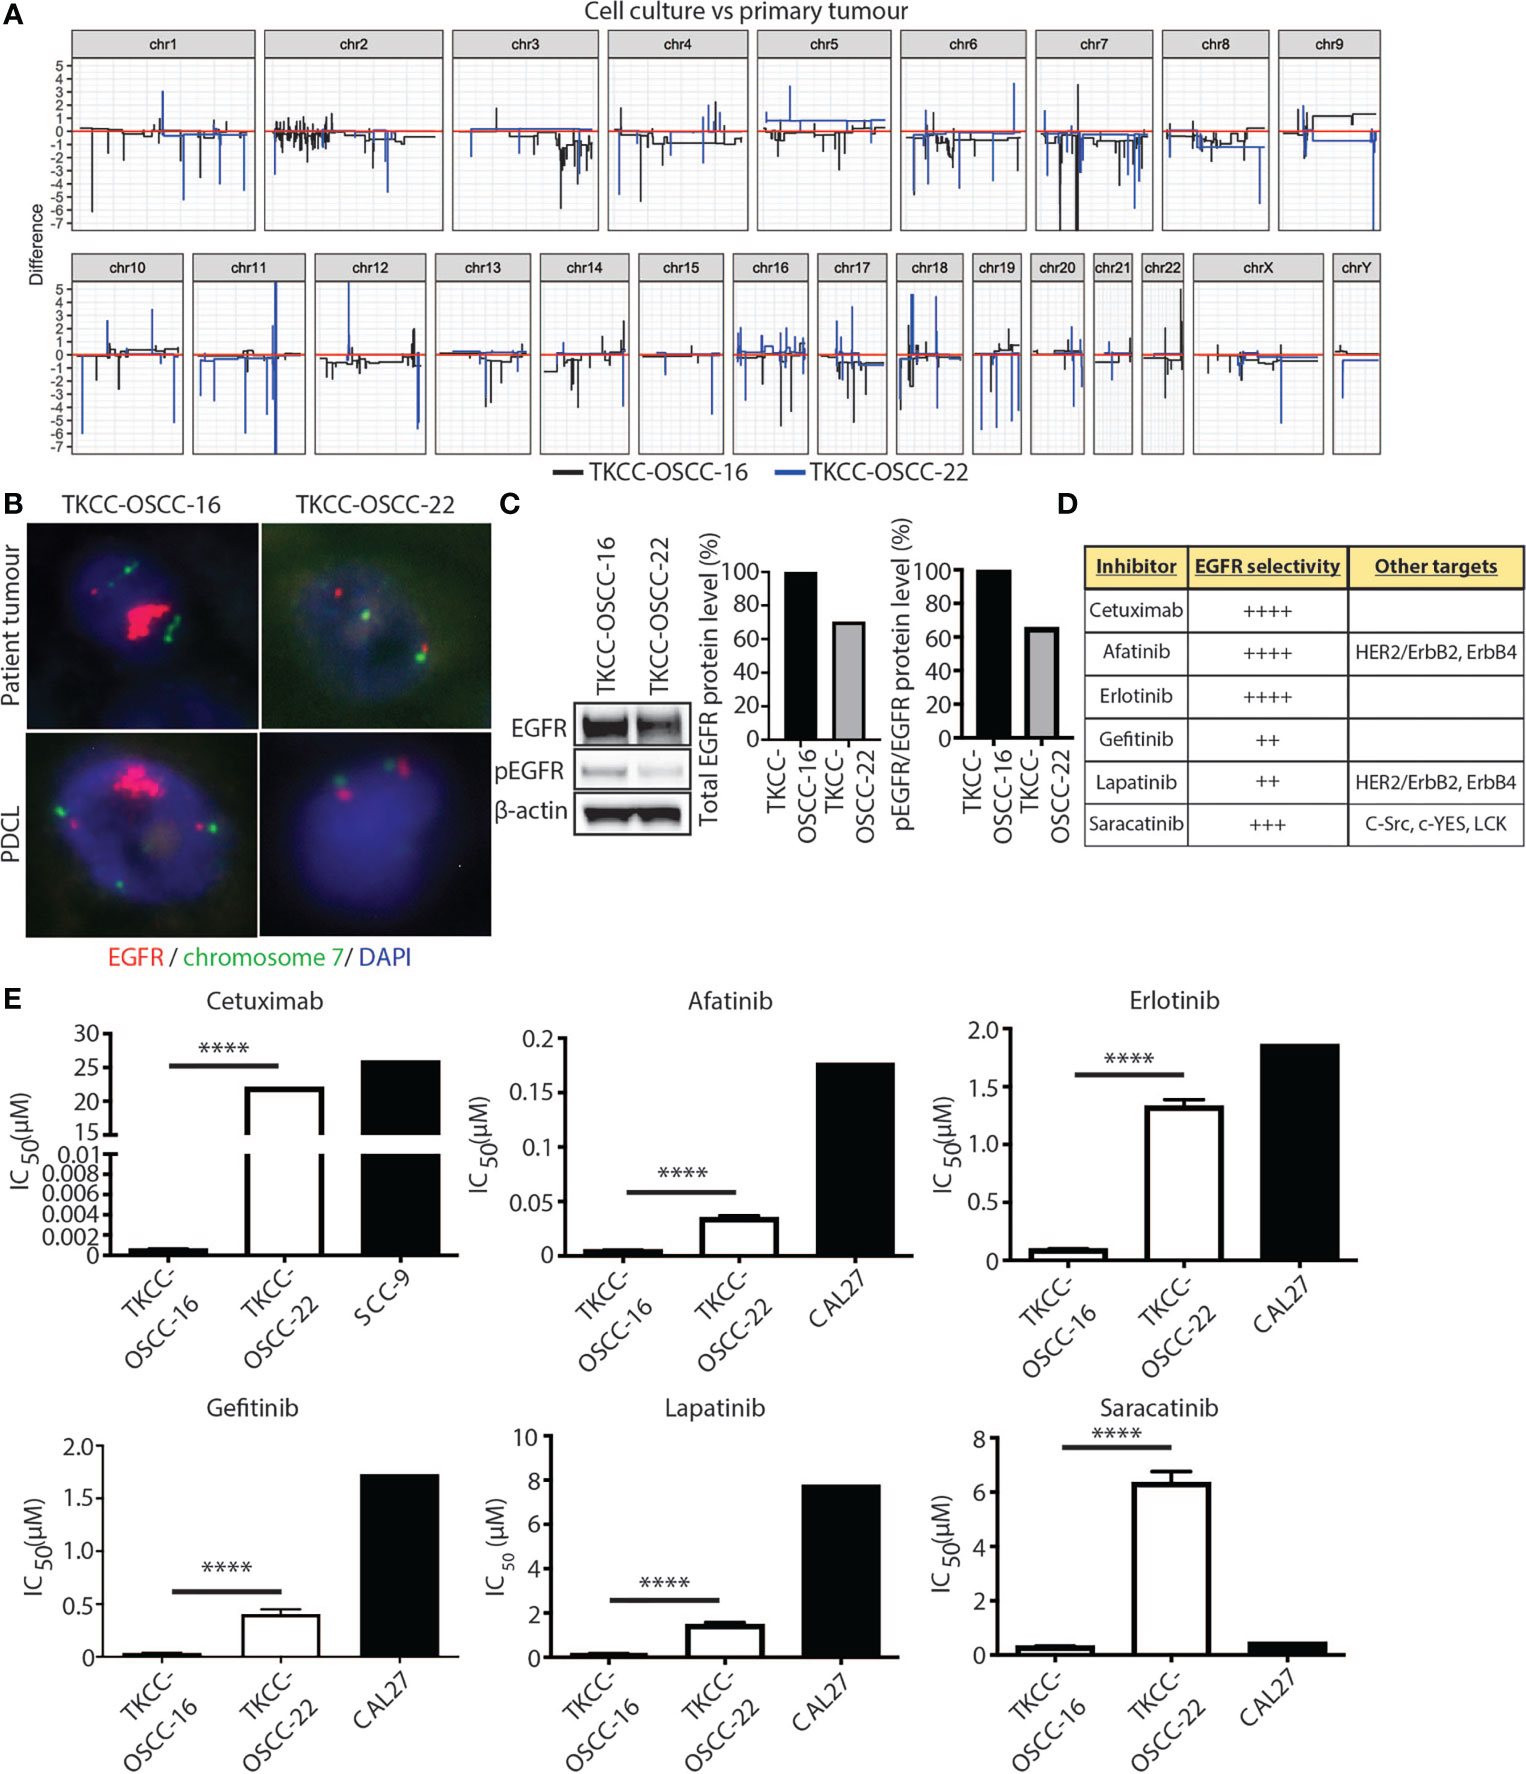
Figure 6 EGFR as a therapeutic target in OSCC patients <50 years. (A) Linearized plots of the copy number difference between matched patient tumor samples and PDCLs. (B) EGFR FISH for matched patient tumor tissue samples and PDCLs (red = EGFR probe; green = chromosome 7 centromeric probe; blue = DAPI). (C) Western blotting analysis for total EGFR and pEGFR protein levels in indicated PDCLs. β-actin was used as a loading control. Quantification of protein levels is shown in graphs on right. (D) Panel of EGFR inhibitors used in cytotoxicity assays with EGFR selectivity indicated. (E) alamarBlue proliferation assays were performed with indicated EGFR inhibitors and IC50 values calculated for PDCLs. IC50 values for PDCLs generated by us were compared against IC50 values for a reference OSCC cell line available from public databases. Significance levels are indicated by asterisks where *P < 0.05, **P < 0.01, ***P < 0.001 and ****P < 0.0001, unpaired t-test.
To assess the efficacy of EGFR-targeted therapies in EGFR-amplified OSCC, we generated two patient tumor-derived primary cell lines (PDCLs), one harboring EGFR-amplification (TKCC-OSCC-16) and one without EGFR-amplification (TKCC-OSCC-22). The TKCC-OSCC-16 line was derived from a primary tongue tumor specimen from a 41-year-old male and the TKCC-OSCC-22 line was obtained from a primary tongue tumor specimen from a 37-year-old male. Both tumor samples and PDCLs underwent WGS and transcriptomic profiling and demonstrated similar genomic (Supplementary Figures 4, 5) and transcriptomic landscapes. Importantly, EGFR copy numbers were concordant between respective tissue and PDCLs (Figure 6A). This was confirmed with EGFR FISH analysis of both PDCLs, which showed conservation of EGFR CNVs between patient tumor tissue and matched cell lines (Figure 6B). Western blot analysis revealed that EGFR protein levels were approximately 30% higher in the EGFR-amplified TKCC-OSCC-16 PDCL versus non-EGFR amplified TKCC-OSCC-22 cells (Figure 6C). In line with previous reports (37), we observed low basal levels of EGFR phosphorylation (pEGFR, Tyr1068) in the TKCC-OSCC-22 tumor culture, whereas pEGFR protein levels were 55% higher in the TKCC-OSCC-16 model, suggesting activation of this signaling axis in the EGFR-amplified line (Figure 6C).
The EGFR-amplified TKCC-OSCC-16 cell line displayed approximately 10-fold increased sensitivity to all inhibitors compared to the TKCC-OSCC-22 cells (Figure 6D), except for cetuximab where the difference was much greater (Table 3). For afatinib, a dual HER2/neu and EGFR inhibitor, we observed an IC50 value of 0.0051µM for TKCC-OSCC-16 and 0.035µM for TKCC-OSCC-22 (Figure 6E) suggesting both cell lines were sensitive to this inhibitor. Cetuximab treatment resulted in IC50 values of 0.00058µM and 22µM for the TKCC-OSCC-16 and TKCC-OSCC-22 cell lines, respectively, revealing that the cell line harboring the EGFR amplification was highly sensitive to cetuximab (Figure 6E). Treatment with erlotinib resulted in IC50 values of 0.096µM and 1.33µM for TKCC-OSCC-16 and TKCC-OSCC-22, respectively (Figure 6E), demonstrating that TKCC-OSCC-22 was resistant to erlotinib. IC50 values for gefitinib were 0.034µM and 0.4µM for TKCC-OSCC-16 and TKCC-OSCC-22, respectively (Figure 6E), suggesting both cell lines were susceptible to gefitinib. Examination of the dual HER2/neu and EGFR inhibitor, lapatinib, revealed IC50 values of 0.16µM for TKCC-OSCC-16 and 1.47µM for TKCC-OSCC-22 (Figure 6E), demonstrating TKCC-OSCC-22 was resistant to lapatinib. Finally, saracatinib produced IC50 values of 0.32µM for TKCC-OSCC-16 and 6.34µM for TKCC-OSCC-22 (Figure 6E), indicating the TKCC-OSCC-22 cell line was highly resistant to saracatinib. In summary, these data demonstrate that the EGFR-amplified TKCC-OSCC-16 cell line was sensitive to all six EGFR inhibitors, with exquisite sensitivity observed for the clinically relevant EGFR inhibitors, cetuximab, afatinib and erlotinib.
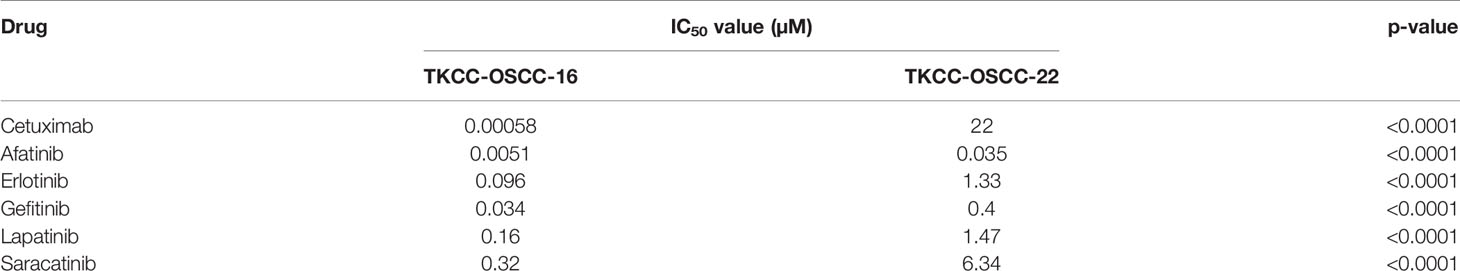
Table 3 IC50 values for cytotoxicity screening.
HPV-independent OSCC has been on the rise in patients <50 years over the past decade, particularly in females and non-smokers (6, 15). Young patients and females are significantly under-represented in clinical trials evaluating therapeutic options in OSCC (16, 17). Indeed, studies of adjuvant treatment in <50 year OSCC patients are often heterogeneous, and while standard treatment protocols of surgery and radiotherapy are well established, targeted therapy protocols are yet to be defined (41). It is increasingly being recognized that in a variety of solid tumors, younger patients with lower cumulative exposure to carcinogens harbor different genomic characteristics, compared to older patients with a lifetime exposure to environmental or lifestyle mutagens (42–44). Our data demonstrate a significantly divergent genomic and transcriptomic landscape in OSCC from patients <50 years and those ≥50 years. For example, young non-smoking females demonstrate significantly lower median TMB (3.18 variants per Mb) as compared with older males with smoking history (10.51 variants per Mb). Co-amplification of EGFR and LANCL2 was seen in younger patients in our study. Amplification of these co-located genes at 7p11 has also been described in glioblastoma, with LANCL2 amplification portending a poor prognosis in younger glioblastoma patients (45). We also observed EGFR amplification with concomitant increase in RNA abundance to be more common in OSCC patients <50 years. We have further demonstrated the clinical utility of this finding by showing high response rates to EGFR inhibitors in a patient-derived cell line with EGFR amplification and increased levels of pEGFR protein suggesting activation of the EGFR signaling axis.
As part of this study, we generated two robust 2-dimensional patient-derived cell line models from patients <50 years, one with and one without demonstrable EGFR amplification confirmed computationally and by orthogonal methods such as FISH and IHC. The EGFR-amplified model, TKCC-OSCC-16 retained EGFR-amplification, exhibiting increased EGFR activation, compared against the non-amplified model, representing a valuable preclinical tool for the examination of therapeutic efficacy of EGFR-targeting. Importantly, we demonstrate, for the first time, potent efficacy of single agent EGFR inhibitor therapy in a subtype of OSCC with EGFR amplification. Broad efficacy was observed across EGFR monoclonal antibody (mAb) cetuximab and five tyrosine kinase inhibitors with differing selectivity for EGFR (plus other kinases, HER2/neu, SRC family), with the most promising signal of activity observed for clinically relevant and selective EGFR inhibitors, cetuximab, afatinib and erlotinib.
Anti-EGFR therapies, chiefly cetuximab, have been studied in HNSCC with modest benefits and variable results (46–48). This may be attributed to the advanced patient age in most HNSCC clinical trials (16, 49), a cohort unlikely to have EGFR CNV. Similar to our study, Costa et al (50) and Vincent-Chong et al (51) also demonstrated higher rates of EGFR CNV in young patients. Furthermore, most HNSCC clinical trials evaluating anti-EGFR therapies were performed in unselected populations where EGFR CNV or EGFR overexpression using immunohistochemistry was not investigated (49). Studies that have evaluated EGFR amplification by in situ hybridization techniques have demonstrated benefits with either EGFR tyrosine kinase inhibitors (TKIs) or anti-EGFR mAb in non-small cell lung cancer (NSCLC) (52, 53). Thus, the low response rates to EGFR inhibitors in HNSCC trials may not be applicable to younger OSCC patients who have a high rate of EGFR amplification. Huang et al. in their proteomics study of HPV-independent HNSCC suggested that elevated protein levels of EGFR may play a role in response to EGFR mAb such as cetuximab (54). These findings imply that both EGFR amplification and elevated EGFR protein levels may be used as a biomarker to select patients likely to respond to EGFR inhibitors. Kirchner et al. (55) and Matsumoto et al. (56) have described a ‘cold’ immunophenotype in EGFR-mutant NSCLC. Our analysis demonstrates that young patients with OSCC appear to have low levels of TILs irrespective of EGFR amplification status.
EGFR amplification is associated with downstream EGFR protein activation and may potentially present a robust stratifying biomarker for EGFR-targeting therapy. Interestingly, 3+ membranous staining on EGFR IHC entirely correlated with EGFR amplification, while the cases with intratumoral heterogeneity demonstrated a 2+ staining pattern. Thus, IHC expression of 2+ and 3+ can be useful in triaging patients for more comprehensive testing of EGFR CNV by ISH or polymerase chain reaction as is the current practice for detection of HER2 amplification in breast and gastric cancer (36, 57). Testing for EGFR amplification can be easily integrated into the current pathology diagnostic workflow with the use of IHC and FISH, providing results in a cost-effective and clinically appropriate timeframe. However, this will require standardisation of criteria, particularly for copy numbers of the EGFR gene and the proportion of tumor cells demonstrating EGFR amplification as has been achieved for HER2 in breast (36) and gastric (57) cancer. This is highlighted by our observations of intratumoral heterogeneity for EGFR amplification in two patients <50 years. Both tumors showed a subpopulation of tumor cells (approximately 40-50% of tumor cells) with copy numbers >30, with other tumor cells showing normal ploidy. Similar heterogeneity has been described for HER2 in both breast and gastric cancer and ISH testing of tissues with 2+ and 3+ membranous staining by IHC is recommended for HER2 testing in gastric cancer (36, 57).
Afatinib represents an important unexplored therapeutic avenue since patients with recurrent and metastatic HNSCC, including OSCC, frequently develop resistance to cetuximab (58–60). EGFR mutations are uncommon in HNSCC (61, 62). By contrast, marked upregulation of EGFR via amplification or activation via one of its ligands (e.g. transforming growth factor alpha, TGF-α) is common (62, 63). Cetuximab is a monoclonal antibody that prevents dimerization of EGFR by binding to its extracellular domain, inhibiting receptor-ligand interactions (61, 64), whereas afatinib is a second-generation TKI that irreversibly binds the intracellular tyrosine kinase domain of EGFR (61, 65). Afatinib has been shown to be more efficacious than chemotherapy for the treatment of NSCLCs harboring specific EGFR mutations (55, 56, 66). However, data on the use of afatinib for the treatment of HNSCC is still emerging, although in clinical trials, afatinib has demonstrated higher activity versus other EGFR TKIs (67). Early phase clinical trials suggested similar abilities of afatinib and cetuximab to control disease progression in platinum-resistant HNSCC (68). Furthermore, afatinib has also shown promise as a second-line monotherapy treatment for recurrent/metastatic HNSCC (68, 69). Combination treatments utilising targeted inhibition of EGFR may further improve therapeutic response. EGFR inhibition using gefitinib in combination with cisplatin, has been shown to enhance the pro-apoptotic and anti-proliferative effects of chemotherapy in vitro in selected (non-EGFR amplified) HNSCC commercially available cell lines (37). Furthermore, combinations of afatinib with cisplatin (70) or cisplatin treatment followed by afatinib (67) in EGFR wild-type HNSCC cells have led to increased cytotoxicity, suggesting such approaches warrant further investigation in the context of EGFR-amplified OSCC.
One of the limitations of our study is its sample size. HPV-independent OSCC in those under 50 years, although increasing in incidence, is a rare cancer with devastating consequences for young patients (15). TCGA data was therefore accessed in an effort to increase the sample size, however, only nine cases of HPV independent OSCC <50 years, with whole genome sequencing data, were identified from this international, multi-institutional cohort, indicating the rarity of this cancer. TCGA data also does not provide treatment and survival details for its cohort. However, the comprehensive functional analyses included in the current study highlight the robust nature of our findings.
Our study is the first to identify lower TMB and EGFR amplification with associated increased RNA abundance in cases of OSCC <50 years – a much needed advance towards personalized therapy, where the literature to date has recognized limited differences in OSCC patients <50 and ≥50 years (71–73). The genomic, transcriptomic and functional findings of this study provide evidence for testing EGFR CNV and pEGFR levels when designing future clinical trials utilizing EGFR targeted therapies. With EGFR amplification testing readily available in the clinical diagnostic setting, EGFR CNV testing needs to be considered in OSCC patients <50 years of age.
The original contributions presented in the study are publicly available. This data can be found here: National Center for Biotechnology Information (NCBI) Gene Expression Omnibus (GEO) with accession ID GSE184616 (https://www.ncbi.nlm.nih.gov/geo/query/acc.cgi?acc=GSE184616).
The studies involving human participants were reviewed and approved by Sydney Local Health District, NSW Health, Human research ethics committee approval X19-0282/ETH12165. The patients/participants provided their written informed consent to participate in this study.
MP, RG, SP, and LS devised the project and the main conceptual ideas. LS, JC, RG, and CP were responsible for tissue collection. LS collected all included clinicopathological data for the SHNCI and TCGA cohorts. CW, TC, and RS performed the pre-processing of the raw sequencing data. DS and JY performed the computational analysis. FISH study interpretation was performed by LS. LS and RG translated the computational data to the clinicopathological context. SP, AI, and MP performed all patient derived cell line generation and culture, Western blotting and in vitro cytotoxicity assays, as well as all related analysis. JC, JL, and MB contributed to the interpretation of the results. LS and SP prepared the manuscript. All authors provided critical feedback and helped shape the analysis and the manuscript. All authors contributed to the article and approved the submitted version.
This work was supported by the National Health and Medical Research Council (NHMRC), Australia (Project Grant 2003310 and Fellowship 1162556 to Associate Professor Marina Pajic). This work was also supported by the Australian and New Zealand Head and Neck Cancer Society (ANZHNCS). SP is supported in part by a Tour de Cure mid-career researcher grant (RSP-359-2020).
The authors declare that the research was conducted in the absence of any commercial or financial relationships that could be construed as a potential conflict of interest.
All claims expressed in this article are solely those of the authors and do not necessarily represent those of their affiliated organizations, or those of the publisher, the editors and the reviewers. Any product that may be evaluated in this article, or claim that may be made by its manufacturer, is not guaranteed or endorsed by the publisher.
This research was undertaken with the assistance of resources and services from the National Computational Infrastructure (NCI), which is supported by the Australian Government and accessed through the National Computational Merit Allocation Scheme 2020. The results published here are in whole or part based upon data generated by The Cancer Genome Atlas managed by NCI and NHGRI. Information about TCGA can be found at http://cancergenome.nih.gov. The authors acknowledge the bioinformatics support and access to infrastructure of Sydney Informatics Hub Core Research Facility and University of Sydney. The authors also acknowledge the Sydney Head and Neck Cancer Institute Biobank in the Department of Tissue Pathology and Diagnostic Oncology, NSW Health Pathology, Royal Prince Alfred Hospital. The authors would also like to thank Ms Diana Van Beek, Mr Ki Lam, Mr Isuru Hewage and Ms Mikaela Holmes of the Department of Tissue Pathology and Diagnostic Oncology, Royal Prince Alfred Hospital, for their assistance in the construction of the TMAs and IHC/FISH studies respectively, and Ms Maggie Y Lee and Dr Grace H Wei of the Department of Neuropathology, Royal Prince Alfred Hospital, for their assistance in nucleic acid extractions.
The Supplementary Material for this article can be found online at: https://www.frontiersin.org/articles/10.3389/fonc.2021.750852/full#supplementary-material
1. Sicklick JK, Kato S, Okamura R, Schwaederle M, Hahn ME, Williams CB, et al. Molecular Profiling of Cancer Patients Enables Personalized Combination Therapy: The I-PREDICT Study. Nat Med (2019) 25(5):744–50. doi: 10.1038/s41591-019-0407-5
2. Liu YF, Chiang SL, Lin CY, Chang JG, Chung CM, Ko AM, et al. Somatic Mutations and Genetic Variants of NOTCH1 in Head and Neck Squamous Cell Carcinoma Occurrence and Development. Sci Rep (2016) 6:24014. doi: 10.1038/srep24014
3. Bauer J, Büttner P, Murali R, Okamoto I, Kolaitis NA, Landi MT, et al. BRAF Mutations in Cutaneous Melanoma Are Independently Associated With Age, Anatomic Site of the Primary Tumor, and the Degree of Solar Elastosis at the Primary Tumor Site. Pigment Cell melanoma Res (2011) 24(2):345–51. doi: 10.1111/j.1755-148X.2011.00837.x
4. Mok T, Camidge DR, Gadgeel SM, Rosell R, Dziadziuszko R, Kim DW, et al. Updated Overall Survival and Final Progression-Free Survival Data for Patients With Treatment-Naive Advanced ALK-Positive Non-Small-Cell Lung Cancer in the ALEX Study. Ann Oncol Off J Eur Soc Med Oncol (2020) 31(8):1056–64. doi: 10.1016/j.annonc.2020.04.478
5. Robert C, Grob JJ, Stroyakovskiy D, Karaszewska B, Hauschild A, Levchenko E, et al. Five-Year Outcomes With Dabrafenib Plus Trametinib in Metastatic Melanoma. New Engl J Med (2019) 381(7):626–36. doi: 10.1056/NEJMoa1904059
6. Warnakulasuriya S. Global Epidemiology of Oral and Oropharyngeal Cancer. Oral Oncol (2009) 45(4-5):309–16. doi: 10.1016/j.oraloncology.2008.06.002
7. Toporcov TN, Znaor A, Zhang ZF, Yu GP, Winn DM, Wei Q, et al. Risk Factors for Head and Neck Cancer in Young Adults: A Pooled Analysis in the INHANCE Consortium. Int J Epidemiol (2015) 44(1):169–85. doi: 10.1093/ije/dyu255
8. de Morais EF, Mafra RP, Gonzaga AKG, de Souza DLB, Pinto LP, da Silveira EJD. Prognostic Factors of Oral Squamous Cell Carcinoma in Young Patients: A Systematic Review. J Oral Maxillofac Surg (2017) 75(7):1555–66. doi: 10.1016/j.joms.2016.12.017
9. Hussein AA, Helder MN, de Visscher JG, Leemans CR, Braakhuis BJ, de Vet HCW, et al. Global Incidence of Oral and Oropharynx Cancer in Patients Younger Than 45 Years Versus Older Patients: A Systematic Review. Eur J Cancer (2017) 82:115–27. doi: 10.1016/j.ejca.2017.05.026
10. Muller S, Pan Y, Li R, Chi AC. Changing Trends in Oral Squamous Cell Carcinoma With Particular Reference to Young Patients: 1971-2006. The Emory University Experience. Head Neck Pathol (2008) 2(2):60–6. doi: 10.1007/s12105-008-0054-5
11. Ali J, Sabiha B, Jan HU, Haider SA, Khan AA, Ali SS. Genetic Etiology of Oral Cancer. Oral Oncol (2017) 70:23–8. doi: 10.1016/j.oraloncology.2017.05.004
12. Annertz K, Anderson H, Biorklund A, Moller T, Kantola S, Mork J, et al. Incidence and Survival of Squamous Cell Carcinoma of the Tongue in Scandinavia, With Special Reference to Young Adults. Int J Cancer (2002) 101(1):95–9. doi: 10.1002/ijc.10577
13. Hertrampf K, Wiltfang J, Katalinic A, Timm O, Wenz HJ. Trends in Incidence, Tumour Sites and Tumour Stages of Oral and Pharyngeal Cancer in Northern Germany. J Cancer Res Clin Oncol (2012) 138(3):431–7. doi: 10.1007/s00432-011-1118-6
14. Chalmers ZR, Connelly CF, Fabrizio D, Gay L, Ali SM, Ennis R, et al. Analysis of 100,000 Human Cancer Genomes Reveals the Landscape of Tumor Mutational Burden. Genome Med (2017) 9(1):34. doi: 10.1186/s13073-017-0424-2
15. Satgunaseelan L, Allanson BM, Asher R, Reddy R, Low HTH, Veness M, et al. The Incidence of Squamous Cell Carcinoma of the Oral Tongue is Rising in Young Non-Smoking Women: An International Multi-Institutional Analysis. Oral Oncol (2020) 110:104875. doi: 10.1016/j.oraloncology.2020.104875
16. Benchetrit L, Torabi SJ, Tate JP, Mehra S, Osborn HA, Young MR, et al. Gender Disparities in Head and Neck Cancer Chemotherapy Clinical Trials Participation and Treatment. Oral Oncol (2019) 94:32–40. doi: 10.1016/j.oraloncology.2019.05.009
17. Fortpied C, Vinches M. The Statistical Evaluation of Treatment and Outcomes in Head and Neck Squamous Cell Carcinoma Clinical Trials. Front Oncol (2019) 9:634. doi: 10.3389/fonc.2019.00634
18. Huh JW, Lee JH, Kim HR. Prognostic Significance of Tumor-Infiltrating Lymphocytes for Patients With Colorectal Cancer. Arch Surg (2012) 147(4):366–72. doi: 10.1001/archsurg.2012.35
19. Van Loo P, Nordgard SH, Lingjaerde OC, Russnes HG, Rye IH, Sun W, et al. Allele-Specific Copy Number Analysis of Tumors. Proc Natl Acad Sci USA (2010) 107(39):16910–5. doi: 10.1073/pnas.1009843107
20. Gallego Romero I, Pai AA, Tung J, Gilad Y. RNA-Seq: Impact of RNA Degradation on Transcript Quantification. BMC Biol (2014) 12:42. doi: 10.1186/1741-7007-12-42
21. Li H. Aligning Sequence Reads, Clone Sequences and Assembly Contigs With BWA-MEM. (2013). arXiv e-prints [Internet]. doi: 10.6084/M9.FIGSHARE.963153.V1
22. McLaren W, Gil L, Hunt SE, Riat HS, Ritchie GRS, Thormann A, et al. The Ensembl Variant Effect Predictor. Genome Biol (2016) 17(1):122. doi: 10.1186/s13059-016-0974-4
23. Alessi JoãoV, Ricciuti B, Li YY, Gupta H, Lamberti G, Recondo G, et al. eds. Association of Aneuploidy Score With Clinical Outcomes to Immunotherapy in NSCLC. American Association for Cancer Research Annual Meeting; 2021; Virtual Meeeting. (2021).
24. Sydney Informatics Hub (SIH) Core Research Facility UoS. Fastq-To-BAM 2021. Available at: https://github.com/Sydney-Informatics-Hub/Fastq-to-BAM.
25. Sydney Informatics Hub (SIH) Core Research Facility UoS. Germline-ShortV 2021. Available at: https://github.com/Sydney-Informatics-Hub/Germline-ShortV.
26. Sydney Informatics Hub (SIH) Core Research Facility UoS. Somatic-ShortV 2021. Available at: https://github.com/Sydney-Informatics-Hub/Somatic-ShortV.
27. Alexandrov LB, Nik-Zainal S, Wedge DC, Aparicio SA, Behjati S, Biankin AV, et al. Signatures of Mutational Processes in Human Cancer. Nature (2013) 500(7463):415–21. doi: 10.1038/nature12477
28. Alexandrov LB, Kim J, Haradhvala NJ, Huang MN, Tian Ng AW, Wu Y, et al. The Repertoire of Mutational Signatures in Human Cancer. Nature (2020) 578(7793):94–101. doi: 10.1038/s41586-020-1943-3
29. Blokzijl F, Janssen R, van Boxtel R, Cuppen E. MutationalPatterns: Comprehensive Genome-Wide Analysis of Mutational Processes. Genome Med (2018) 10(1):33. doi: 10.1186/s13073-018-0539-0
30. Priestley P, Baber J, Lolkema MP, Steeghs N, de Bruijn E, Shale C, et al. Pan-Cancer Whole-Genome Analyses of Metastatic Solid Tumours. Nature (2019) 575(7781):210–6. doi: 10.1038/s41586-019-1689-y
31. Wong M, Mayoh C, Lau LMS, Khuong-Quang DA, Pinese M, Kumar A, et al. Whole Genome, Transcriptome and Methylome Profiling Enhances Actionable Target Discovery in High-Risk Pediatric Cancer. Nat Med (2020) 26(11):1742–53. doi: 10.1038/s41591-020-1072-4
32. Catalogue of Somatic Mutations In Cancer . Available at: https://cancer.sanger.ac.uk/cosmic/help/cnv/overview.
33. Martin M. Cutadapt Removes Adapter Sequences From High-Throughput Sequencing Reads. 2011 (2011) 17(1):3. doi: 10.14806/ej.17.1.200
34. Dobin A, Davis CA, Schlesinger F, Drenkow J, Zaleski C, Jha S, et al. STAR: Ultrafast Universal RNA-Seq Aligner. Bioinformatics (2012) 29(1):15–21. doi: 10.1093/bioinformatics/bts635
35. Li B, Dewey CN. RSEM: Accurate Transcript Quantification From RNA-Seq Data With or Without a Reference Genome. BMC Bioinf (2011) 12(1):323. doi: 10.1186/1471-2105-12-323
36. Wolff AC, Hammond MEH, Allison KH, Harvey BE, Mangu PB, Bartlett JMS, et al. Human Epidermal Growth Factor Receptor 2 Testing in Breast Cancer: American Society of Clinical Oncology/College of American Pathologists Clinical Practice Guideline Focused Update. J Clin Oncol (2018) 36(20):2105–22. doi: 10.1200/JCO.2018.77.8738
37. Khalil A, Jameson MJ. The EGFR Inhibitor Gefitinib Enhanced the Response of Human Oral Squamous Cell Carcinoma to Cisplatin In Vitro. Drugs R&D (2017) 17(4):545–55. doi: 10.1007/s40268-017-0204-x
38. Yang W, Soares J, Greninger P, Edelman EJ, Lightfoot H, Forbes S, et al. Genomics of Drug Sensitivity in Cancer (GDSC): A Resource for Therapeutic Biomarker Discovery in Cancer Cells. Nucleic Acids Res (2013) 41(Database issue):D955–61. doi: 10.1093/nar/gks1111
39. Plath M, Gass J, Hlevnjak M, Li Q, Feng B, Hostench XP, et al. Unraveling Most Abundant Mutational Signatures in Head and Neck Cancer. Int J Cancer (2021) 148(1):115–27. doi: 10.1002/ijc.33297
40. Gross AM, Orosco RK, Shen JP, Egloff AM, Carter H, Hofree M, et al. Multi-Tiered Genomic Analysis of Head and Neck Cancer Ties TP53 Mutation to 3p Loss. Nat Genet (2014) 46(9):939–43. doi: 10.1038/ng.3051
41. Subramaniam N, Balasubramanian D, Low T-HH, Vidhyadharan S, Menon A, Murthy S, et al. Squamous Cell Carcinoma of the Oral Tongue in Young Patients: Outcomes and Implications for Treatment. Indian J Surg Oncol (2020) 11(2):274–80. doi: 10.1007/s13193-020-01049-y
42. Arbour KC, Riely GJ. Systemic Therapy for Locally Advanced and Metastatic Non-Small Cell Lung Cancer: A Review. Jama (2019) 322(8):764–74. doi: 10.1001/jama.2019.11058
43. Ribas A, Daud A, Pavlick AC, Gonzalez R, Lewis KD, Hamid O, et al. Extended 5-Year Follow-Up Results of a Phase Ib Study (BRIM7) of Vemurafenib and Cobimetinib in BRAF-Mutant Melanoma. Clin Cancer Res (2020) 26(1):46–53. doi: 10.1158/1078-0432.CCR-18-4180
44. Pros E, Saigi M, Alameda D, Gomez-Mariano G, Martinez-Delgado B, Alburquerque-Bejar JJ, et al. Genome-Wide Profiling of Non-Smoking-Related Lung Cancer Cells Reveals Common RB1 Rearrangements Associated With Histopathologic Transformation in EGFR-Mutant Tumors. Ann Oncol Off J Eur Soc Med Oncol (2020) 31(2):274–82. doi: 10.1016/j.annonc.2019.09.001
45. Zhao H-f, Zhou X-m, Wang J, Chen F-f, Wu C-p, Diao P-y, et al. Identification of Prognostic Values Defined by Copy Number Variation, mRNA and Protein Expression of LANCL2 and EGFR in Glioblastoma Patients. J Trans Med (2021) 19(1):372. doi: 10.1186/s12967-021-02979-z
46. Guigay J, Chamorey E, Lefebvre G, Rotarski M, Wagner JP, Blot E, et al. Observational, Prospective, Phase 4 Study in Patients With First-Line Recurrent and/or Metastatic Squamous Cell Carcinoma of the Head and Neck Treated With Cetuximab and Platinum-Based Therapy: DIRECT. Cancer Rep (Hoboken NJ) (2021), e1467. doi: 10.1002/cnr2.1467
47. Lien MY, Wang TH, Hsieh CY, Tsai MH, Hua CH, Cheng FM, et al. Both Combined or Sequential Use With Immune Checkpoint Inhibitors on Cetuximab-Treated Patients With Recurrent or Metastatic Head and Neck Squamous Cell Carcinoma Improve the Overall Survival. Oral Oncol (2021) 119:105380. doi: 10.1016/j.oraloncology.2021.105380
48. Zaryouh H, De Pauw I, Baysal H, Peeters M, Vermorken JB, Lardon F, et al. Recent Insights in the PI3K/Akt Pathway as a Promising Therapeutic Target in Combination With EGFR-Targeting Agents to Treat Head and Neck Squamous Cell Carcinoma. Medicinal Res Rev (2021). doi: 10.1002/med.21806
49. Szturz P, Vermorken JB. Management of Recurrent and Metastatic Oral Cavity Cancer: Raising the Bar a Step Higher. Oral Oncol (2020) 101:104492. doi: 10.1016/j.oraloncology.2019.104492
50. Costa V, Kowalski LP, Coutinho-Camillo CM, Begnami MD, Calsavara VF, Neves JI, et al. EGFR Amplification and Expression in Oral Squamous Cell Carcinoma in Young Adults. Int J Oral Maxillofacial Surg (2018) 47(7):817–23. doi: 10.1016/j.ijom.2018.01.002
51. Vincent-Chong VK, Salahshourifar I, Woo KM, Anwar A, Razali R, Gudimella R, et al. Genome Wide Profiling in Oral Squamous Cell Carcinoma Identifies a Four Genetic Marker Signature of Prognostic Significance. PloS One (2017) 12(4):e0174865. doi: 10.1371/journal.pone.0174865
52. Shan L, Wang Z, Guo L, Sun H, Qiu T, Ling Y, et al. Concurrence of EGFR Amplification and Sensitizing Mutations Indicate a Better Survival Benefit From EGFR-TKI Therapy in Lung Adenocarcinoma Patients. Lung Cancer (2015) 89(3):337–42. doi: 10.1016/j.lungcan.2015.06.008
53. Landi L, Rossi A. Cetuximab in the Treatment of Advanced Non-Small Cell Lung Cancer: FISHing for a Miraculous Catch. J Thorac Dis (2018) 10(Suppl 17):S1940–s4. doi: 10.21037/jtd.2018.04.126
54. Huang C, Chen L, Savage SR, Eguez RV, Dou Y, Li Y, et al. Proteogenomic Insights Into the Biology and Treatment of HPV-Negative Head and Neck Squamous Cell Carcinoma. Cancer Cell (2021) 39(3):361–79.e16. doi: 10.1016/j.ccell.2020.12.007
55. Kirchner M, Kluck K, Brandt R, Volckmar AL, Penzel R, Kazdal D, et al. The Immune Microenvironment in EGFR- and ERBB2-Mutated Lung Adenocarcinoma. ESMO Open (2021) 6(5):100253. doi: 10.1016/j.esmoop.2021.100253
56. Matsumoto Y, Koh Y. Tumor Immune Microenvironment of EGFR-Mutant Non-Small-Cell Lung Cancer and Its Impact on Therapeutic Efficacy. Immunotherapy (2020) 12(7):431–7. doi: 10.2217/imt-2019-0213
57. Bartley AN, Washington MK, Colasacco C, Ventura CB, Ismaila N, Benson AB 3rd, et al. HER2 Testing and Clinical Decision Making in Gastroesophageal Adenocarcinoma: Guideline From the College of American Pathologists, American Society for Clinical Pathology, and the American Society of Clinical Oncology. J Clin Oncol (2017) 35(4):446–64. doi: 10.1200/JCO.2016.69.4836
58. Vermorken JB, Mesia R, Rivera F, Remenar E, Kawecki A, Rottey S, et al. Platinum-Based Chemotherapy Plus Cetuximab in Head and Neck Cancer. N Engl J Med (2008) 359(11):1116–27. doi: 10.1056/NEJMoa0802656
59. Vermorken JB, Trigo J, Hitt R, Koralewski P, Diaz-Rubio E, Rolland F, et al. Open-Label, Uncontrolled, Multicenter Phase II Study to Evaluate the Efficacy and Toxicity of Cetuximab as a Single Agent in Patients With Recurrent and/or Metastatic Squamous Cell Carcinoma of the Head and Neck Who Failed to Respond to Platinum-Based Therapy. J Clin Oncol (2007) 25(16):2171–7. doi: 10.1200/JCO.2006.06.7447
60. Bonner JA, Harari PM, Giralt J, Azarnia N, Shin DM, Cohen RB, et al. Radiotherapy Plus Cetuximab for Squamous-Cell Carcinoma of the Head and Neck. N Engl J Med (2006) 354(6):567–78. doi: 10.1056/NEJMoa053422
61. Byeon HK, Ku M, Yang J. Beyond EGFR Inhibition: Multilateral Combat Strategies to Stop the Progression of Head and Neck Cancer. Exp Mol Med (2019) 51(1):1–14. doi: 10.1038/s12276-018-0202-2
62. Liu H, Zhang B, Sun Z. Spectrum of EGFR Aberrations and Potential Clinical Implications: Insights From Integrative Pan-Cancer Analysis. Cancer Commun (London England) (2020) 40(1):43–59. doi: 10.1002/cac2.12005
63. Bossi P, Resteghini C, Paielli N, Licitra L, Pilotti S, Perrone F. Prognostic and Predictive Value of EGFR in Head and Neck Squamous Cell Carcinoma. Oncotarget (2016) 7(45):74362–79. doi: 10.18632/oncotarget.11413
64. Li S, Schmitz KR, Jeffrey PD, Wiltzius JJ, Kussie P, Ferguson KM. Structural Basis for Inhibition of the Epidermal Growth Factor Receptor by Cetuximab. Cancer Cell (2005) 7(4):301–11. doi: 10.1016/j.ccr.2005.03.003
65. Yu HA, Riely GJ. Second-Generation Epidermal Growth Factor Receptor Tyrosine Kinase Inhibitors in Lung Cancers. J Natl Compr Cancer Network JNCCN (2013) 11(2):161–9. doi: 10.6004/jnccn.2013.0024
66. Wu YL, Zhou C, Hu CP, Feng J, Lu S, Huang Y, et al. Afatinib Versus Cisplatin Plus Gemcitabine for First-Line Treatment of Asian Patients With Advanced Non-Small-Cell Lung Cancer Harbouring EGFR Mutations (LUX-Lung 6): An Open-Label, Randomised Phase 3 Trial. Lancet Oncol (2014) 15(2):213–22. doi: 10.1016/S1470-2045(13)70604-1
67. Longton E, Schmit K, Fransolet M, Clement F, Michiels C. Appropriate Sequence for Afatinib and Cisplatin Combination Improves Anticancer Activity in Head and Neck Squamous Cell Carcinoma. Front Oncol (2018) 8:432. doi: 10.3389/fonc.2018.00432
68. Specenier P, Vermorken J. Afatinib in Squamous Cell Carcinoma of the Head and Neck. Expert Opin Pharmacother (2016) 17(9):1295–301. doi: 10.1080/14656566.2016.1183647
69. Maarof NNN, Alsalahi A, Abdulmalek E, Fakurazi S, Tejo BA, Abdul Rahman MB. Efficacy of Afatinib in the Treatment of Patients With Non-Small Cell Lung Cancer and Head and Neck Squamous Cell Carcinoma: A Systematic Review and Meta-Analysis. Cancers (2021) 13(4):688. doi: 10.3390/cancers13040688
70. Brands RC, Müller-Richter UD, De Donno F, Seher A, Mutzbauer G, Linz C, et al. Co-Treatment of Wild-Type EGFR Head and Neck Cancer Cell Lines With Afatinib and Cisplatin. Mol Med Rep (2016) 13(3):2338–44. doi: 10.3892/mmr.2016.4786
71. Pickering CR, Zhang J, Neskey DM, Zhao M, Jasser SA, Wang J, et al. Squamous Cell Carcinoma of the Oral Tongue in Young Non-Smokers Is Genomically Similar to Tumors in Older Smokers. Clin Cancer Res (2014) 20(14):3842–8. doi: 10.1158/1078-0432.CCR-14-0565
72. Campbell BR, Chen Z, Faden DL, Agrawal N, Li RJ, Hanna GJ, et al. The Mutational Landscape of Early- and Typical-Onset Oral Tongue Squamous Cell Carcinoma. Cancer (2021) 127(4):544–53. doi: 10.1002/cncr.33309
Keywords: oral squamous cell carcinoma, EGFR, genomics, personalized therapy, tumor mutation burden
Citation: Satgunaseelan L, Porazinski S, Strbenac D, Istadi A, Willet C, Chew T, Sadsad R, Palme CE, Lee JH, Boyer M, Yang JYH, Clark JR, Pajic M and Gupta R (2021) Oral Squamous Cell Carcinoma in Young Patients Show Higher Rates of EGFR Amplification: Implications for Novel Personalized Therapy. Front. Oncol. 11:750852. doi: 10.3389/fonc.2021.750852
Received: 31 July 2021; Accepted: 26 October 2021;
Published: 29 November 2021.
Edited by:
Wojciech Golusiński, Poznan University of Medical Sciences, PolandReviewed by:
Ines N. Nishimoto, Retired, São Paulo, BrazilCopyright © 2021 Satgunaseelan, Porazinski, Strbenac, Istadi, Willet, Chew, Sadsad, Palme, Lee, Boyer, Yang, Clark, Pajic and Gupta. This is an open-access article distributed under the terms of the Creative Commons Attribution License (CC BY). The use, distribution or reproduction in other forums is permitted, provided the original author(s) and the copyright owner(s) are credited and that the original publication in this journal is cited, in accordance with accepted academic practice. No use, distribution or reproduction is permitted which does not comply with these terms.
*Correspondence: Ruta Gupta, UnV0YS5HdXB0YUBoZWFsdGgubnN3Lmdvdi5hdQ==
†These authors have contributed equally to this work and share first authorship
‡These authors have contributed equally to this work and share last authorship
Disclaimer: All claims expressed in this article are solely those of the authors and do not necessarily represent those of their affiliated organizations, or those of the publisher, the editors and the reviewers. Any product that may be evaluated in this article or claim that may be made by its manufacturer is not guaranteed or endorsed by the publisher.
Research integrity at Frontiers
Learn more about the work of our research integrity team to safeguard the quality of each article we publish.