 Mengting Cai1
 Yunjun Yang
 Feng Lin
 Zhangyong Hu
95% of researchers rate our articles as excellent or good
Learn more about the work of our research integrity team to safeguard the quality of each article we publish.
Find out more
ORIGINAL RESEARCH article
Front. Oncol. , 14 December 2021
Sec. Gynecological Oncology
Volume 11 - 2021 | https://doi.org/10.3389/fonc.2021.749114
This article is part of the Research Topic Women in Gynecological Oncology: 2021 View all 34 articles
Objectives: To investigate the prognostic role of radiomic features based on pretreatment MRI in predicting progression-free survival (PFS) of locally advanced cervical cancer (LACC).
Methods: All 181 women with histologically confirmed LACC were randomly divided into the training cohort (n = 126) and the validation cohort (n = 55). For each patient, we extracted radiomic features from whole tumors on sagittal T2WI and axial DWI. The least absolute shrinkage and selection operator (LASSO) algorithm combined with the Cox survival analysis was applied to select features and construct a radiomic score (Rad-score) model. The cutoff value of the Rad-score was used to divide the patients into high- and low-risk groups by the X-tile. Kaplan–Meier analysis and log-rank test were used to assess the prognostic value of the Rad-score. In addition, we totally developed three models, the clinical model, the Rad-score, and the combined nomogram.
Results: The Rad-score demonstrated good performance in stratifying patients into high- and low-risk groups of progression in the training (HR = 3.279, 95% CI: 2.865–3.693, p < 0.0001) and validation cohorts (HR = 2.247, 95% CI: 1.735–2.759, p < 0.0001). Otherwise, the combined nomogram, integrating the Rad-score and patient’s age, hemoglobin, white blood cell, and lymph vascular space invasion, demonstrated prominent discrimination, yielding an AUC of 0.879 (95% CI, 0.811–0.947) in the training cohort and 0.820 (95% CI, 0.668–0.971) in the validation cohort. The Delong test verified that the combined nomogram showed better performance in estimating PFS than the clinical model and Rad-score in the training cohort (p = 0.038, p = 0.043).
Conclusion: The radiomics nomogram performed well in individualized PFS estimation for the patients with LACC, which might guide individual treatment decisions.
Cervical cancer is one of the most common cancer in women worldwide and an important cause of cancer-related death among women (1). In developing countries, screening has not yet been fully universal, and the incidence and mortality of cervical cancer are still on the rise. In China, most cervical cancer patients are at advanced stages when diagnosed (2). Radical hysterectomy or concurrent chemoradiotherapy is the standard treatment protocol for locally advanced cervical cancer (LACC) (3). Nevertheless, recurrence or metastasis frequently occurred in these patients, with only 50%~60% 5-year survival rate. Thence, pretreatment prediction for the high-risk recurrence or distant metastasis is important for the development of individualized treatment protocols.
Several clinical factors have already been identified as risk factors in cervical cancer patients, including International Federation of Gynecology and Obstetrics (FIGO) stage, lymph node metastasis (LNM), lymph vascular space invasion (LVSI), and depth of invasion (4, 5). Nevertheless, even if the clinical stage and treatment plan of the patient are similar, the clinical outcome can vary widely. These findings imply that the present prognostic model could not provide adequate prognostic information and correctly assess the intrinsic heterogeneity of tumors. Hence, new prognostic biomarkers are required for individual treatment.
Pretreatment magnetic resonance imaging (MRI) can supply more details about tumor heterogeneity than tissue samples and assist in determining the tumor size, location, degree of invasion into adjacent organs, and LNM (6, 7). The emerging radiomics holds great potential for facilitating better clinical decision-making. Radiomics refers to the conversion of medical images into mineable high-dimensional data via automatic high-throughput extraction of data characterization algorithms (8, 9). The main function of radiomics is that the image data-mining method can detect the intrinsic heterogeneity of tumors, unidentifiable by radiologists, and provide decision support noninvasively for oncology at low cost (10, 11). According to previous studies, radiomics features could predict the survival outcomes and recurrence, evaluate tumor subtype and stage, monitor therapeutic response, and detect LNM or distant metastasis (12–14). It is unknown whether radiomics signatures of pretreatment MRI can predict progression-free survival (PFS) in LACC patients who received radical hysterectomy without preoperative neoadjuvant chemotherapy.
Therefore, the purpose of our study is to develop and validate a noninvasive radiomics signature based on pretreatment MRI for the PFS prediction in patients with LACC.
We identified 181 consecutive women with LACC who underwent surgeries following pretreatment MRI using a 3.0-T scanner at our institution between January 2011 and February 2017 (to ensure a minimum follow-up of 3 years). The inclusion criteria were as follows (Supplementary Figure S1): (i) patients who underwent radical hysterectomies and pelvic lymphadenectomies; (ii) patients who have not received treatment before surgery and the clinicopathological data are complete; and (iii) sagittal T2-weighted imaging (T2WI) and axial diffusion-weighted imaging (DWI) were performed less than the 2-week period before surgery. The exclusion criteria were as follows: (i) lesions invisible on axial DWI or sagittal T2WI; (ii) poor image quality due to the movement of the patient during examination or the chemical shift artifact of the gas in the colorectum; (iii) patients who underwent preoperative therapies; and (iv) patients with other cancers at the same time.
Information was collected from telephone consultations, outpatient medical records, and social security death indices. In our study, the endpoint event was PFS, which was defined as the time from the date of surgery until any recurrence (local or distant recurrence, metastasis). Clinical follow-up was every 3 months for the first 2 years, every 6 months for the next 3 years, and annually thereafter. Gynecological examinations, cervical cytology, and imaging tools such as computed tomography (CT), MR, and positron emission tomography (PET)/CT imaging were used to evaluate the patients during the follow-up.
All patients underwent pelvic 3.0-T MRI scans (Signa EXCITE; GE Medical Systems, 3200N, Grandview Blvd, Waukesha, WI 53188, USA; or Achieva, Philips Healthcare, The Netherlands), using a 16-channel phased-array encoding abdominal coil. The scanning range was set to cover the entire pelvis from the level of the anterior superior iliac spine to the inferior level of the symphysis pubis. Patients had to fast at least 6 h before the examination. The standard pelvic MR scan protocol was used in this retrospective study, including multiple b-value DWI (repetition time (TR)/echo time (TE) = 3,625/74 ms, field of view (FOV): 420 × 420 mm, matrix: 256 × 128, slice thickness/gap = 5 mm/6 mm, b-values: 0.700 s/mm2), sagittal T2-weighted fat suppression (FS) images: (TR/TE = 3,200/106 ms, FOV = 320 × 320 mm, matrix = 320 × 224, slice thickness/gap = 4 mm/5 mm); axial T2-weighted fat suppression (FS) images: (TR/TE = 3,600/104 ms, FOV = 380 × 380 mm, matrix = 320 × 224. slice thickness/gap = 5 mm/6 mm); coronal T2-weighted fat suppression (FS) images: (TR/TE = 3,400/107 ms, FOV = 360 × 360 mm, matrix = 320 × 192, slice thickness/gap = 4 mm/5 mm); and axial T1-weighted imaging (T1WI): (TR/TE = 245 ms/2 ms, FOV: 380 × 380 mm, matrix: 384 × 180, slice thickness/gap = 5 mm/6 mm).
Pelvic MRI Digital Imaging and Communications in Medicine (DICOM) original images of all patients were downloaded from the Picture Archiving and Communication System (PACS) and uploaded into the ITK-SNAP (open source software; www.itksnap.org) for three-dimensional manual segmentation of MR images (15). The regions of interest (ROIs) of the entire tumor were manually outlined layer by layer by a radiologist with 5 years of experience in gynecological imaging, and the results were verified by a senior radiologist with 15 years of work experience. The radiomics workflow is displayed in Figure 1.
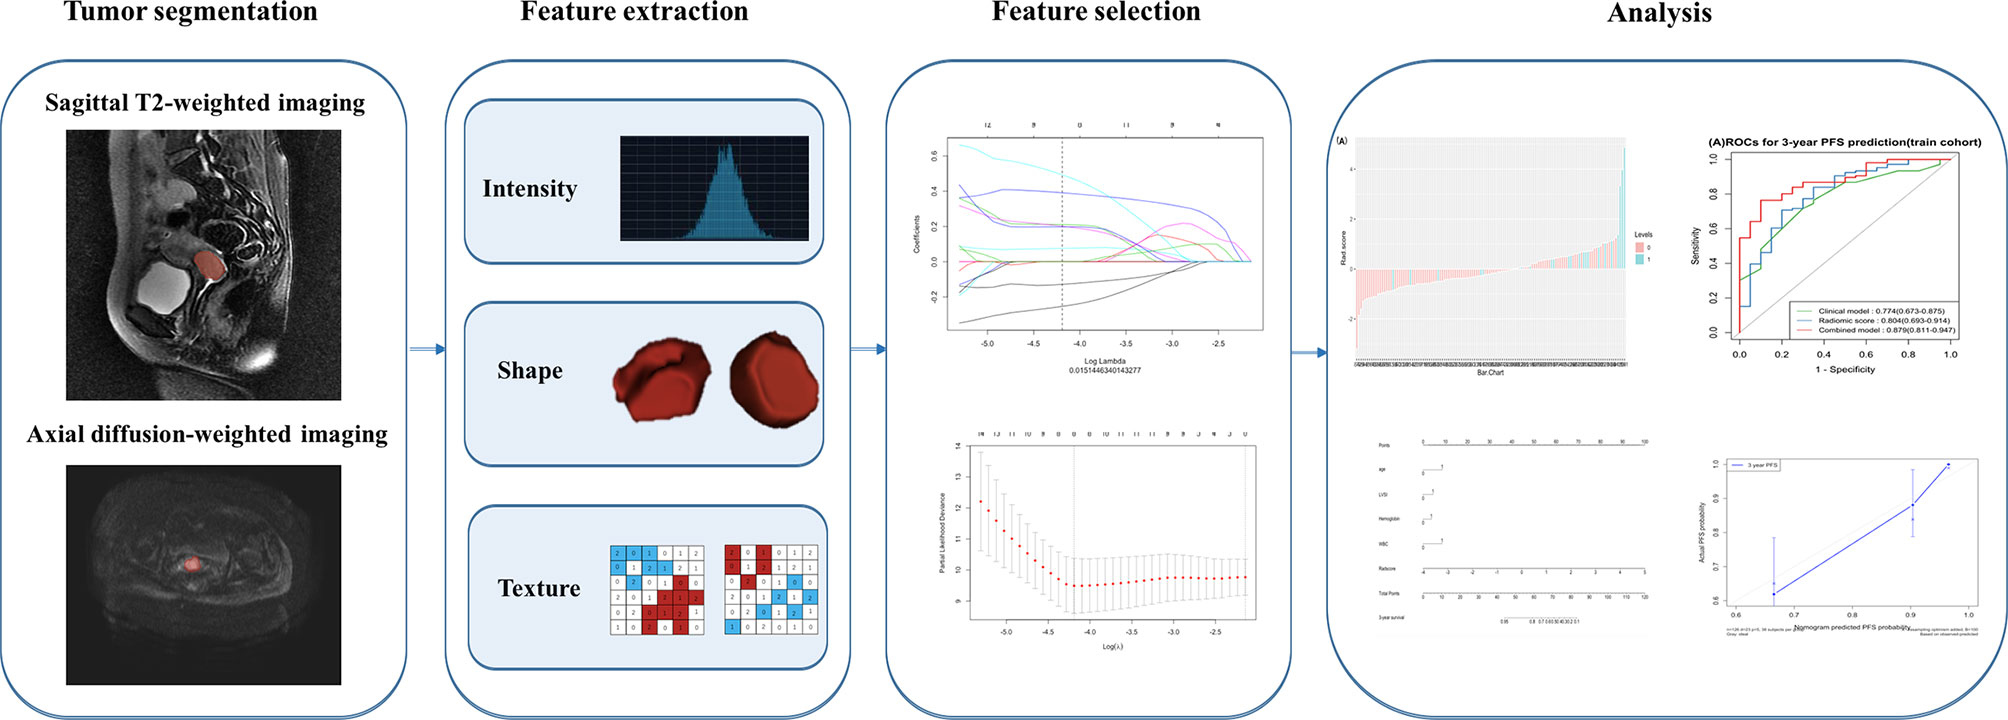
Figure 1 The radiomics workflow.
Before feature extraction, the image was preprocessed, including resampling the MR image to a 1 × 1 × 1-mm3 voxel size and normalizing the image gray scale to 0 to 255. The purpose of image preprocessing is to reduce heterogeneity bias caused by different equipments and scanning parameters. Radiomic feature extraction was implemented in Artificial Intelligence Kit Version 3.0.0.R, which is a commercial software of GE Healthcare. We extracted 396 radiomic features of tumor on T2WI and DWI, respectively, and a total of 792 quantitative features for each patient. The features were divided into four groups: (I) intensity histogram (n = 84), (II) morphology (n = 40) and (III) texture (n = 668), including (a) gray-level co-occurrence matrix (GLCM, n = 288), (b) gray-level run length matrix (GLRLM, n = 344), and (c) Haralick (n = 36).
High-dimensional extraction produced various radiomic features, but not all of them were significantly associated with PFS in LACC. To develop the radiomics model, we designed a two-step procedure for dimensionality reduction and selection of radiomic features. We applied the least absolute shrinkage and selection operator (LASSO) algorithm jointly with the Cox survival analysis to select the importantly prognostic features in the training cohort (16, 17). Then, the multiple-feature-based radiomic signatures were created for predicting patients’ PFS in the training cohort. The LASSO Cox regression model analysis was completed by the “glmnet” package (18, 19).
The radiomics score (Rad-score, which was defined as the radiomics signature in the current study) was computed in the training cohort by the LASSO Cox regression model analysis. Above all, we evaluated the potential relationship of the Rad-score with PFS in the training cohort and then tested it in the validation cohort. In addition, all patients were divided into high-risk and low-risk groups according to the optimum cutoff value of the Rad-score by applying X-tile software (20). The relationship of the radiomic risk score with PFS was assessed in the training cohort and then verified in the validation cohort by using Kaplan–Meier analysis and log-rank test.
The univariate Cox analysis was used to determine clinicopathologic factors associated with PFS in all patients (n = 181). LASSO Cox regression model analysis was applied to select variables with a p value < 0.1 in the univariate Cox analysis. Except the Rad-score, a clinical model which incorporated only the independent clinicopathologic risk factors was also built to predict the 3-year PFS. The prognostic performance of the models was measured by Harrell’s concordance index (C-index), C-index = 0.5 describes a random prediction, and C-index = 1.0 implies a perfect prediction ability (21). Since the C-index method may be wrong when predicting a fixed time point (22), we also use the time-dependent area under the receiver operating characteristic (ROC) analysis to assess the t-year risk of an event (23, 24).
To provide the clinician with a quantitative approach to predict patients’ probability of 3-year PFS, and to show the incremental value of the Rad-score to the clinicopathologic risk factors, we further built a combined nomogram (combined model) as an individualized PFS prediction model that incorporated both the Rad-score and clinicopathologic risk factors for PFS prediction. The prognostic performance of the nomogram was estimated by C-index and ROC analysis. Besides, calibration curves were used to compare the predicted PFS with the actual PFS.
Statistical analysis was executed by R software (version 3.6.3) and SPSS (version 23.0). Rad-scores were divided into two groups according to the cutoff value selected by X-tile. In addition, the continuous clinical variables were converted into categorical variables on the basis of cutoff values, which were determined by ROC analysis or routine cutoff points (for size). Differences in distributions between the training and validation cohorts were assessed with the chi-squared test as appropriate. A quantitative comparison of the area under the curve (AUC) was made with the Delong test (25). The glmnet package was adopted for running LASSO–Cox. The survival package was adopted for building the Cox proportional risk model, drawing the Kaplan–Meier analysis, and calculating the C-index. The rms package was used for nomograms and calibration curves. All two-sided p values less than 0.05 were considered significant.
The clinicopathologic factors of all patients are summarized in Table 1. Of the 181 patients included in the study, the mean age of the patients was 50.67 ± 10.81 years. Disease recurred in 33 of 181 patients (18.2%). The median follow-up time was 50.5 months (40.75–66.0) for the training cohort and 48.0 months (40.0–66.0) for the validation cohort. There were no significant differences between the training cohort and the validation cohort in clinicopathologic features (p = 0.146–0.714).
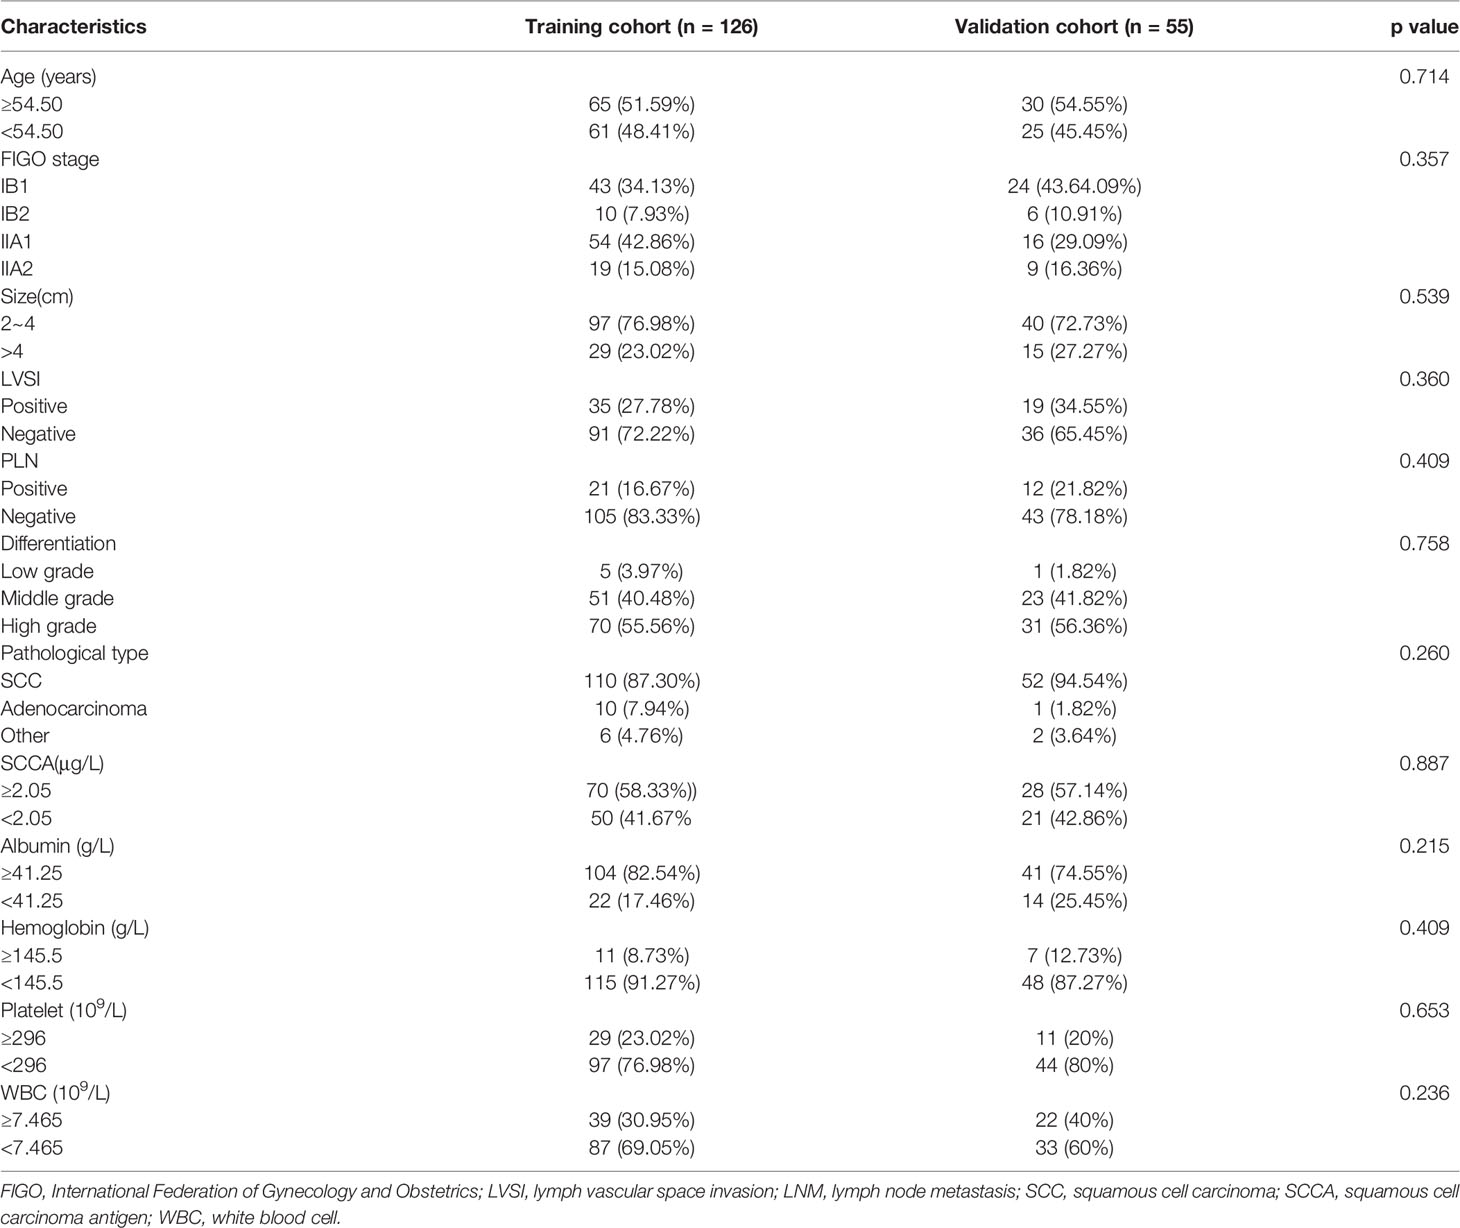
Table 1 Patient characteristics in the training and validation cohorts.
The LASSO Cox regression model was used to build a prognostic Rad-score. Eight potential predictors, six features from T2WI, and two features from DWI were included in the training cohort. Finally, the Rad-score was constructed based on the eight features, and the calculation formula is as follows: Rad-score = -0.253 × T2WI_MinIntensity + 0.210 × T2WI_ClusterShade + 0.076 × T2WI_GLCM-IDM + 0.201 × T2WI_RLM-LongRunEmphasis × T2WI_RLM-LongRunHighGreyLevelEmphasis + 0.391 × T2WI_LowIntensityLargeAreaEmphasis + 0.198 × DWI_HighIntensitySmallAreaEmphasis + 0.493 × DWI_SmallAreaEmphasis. Distributions of the Rad-score in the training and validation cohorts are displayed in Supplementary Figure S2.
The optimum cutoff generated by X-tile was 0.543. According to the optimal cutoff value, patients were classified into high-risk (Rad-score ≥ 0.543) and low-risk (Rad-score < 0.543) groups. A Kaplan–Meier analysis (Figure 2) was demonstrated that the patients in the high-risk group had shorter PFS than did the low-risk group in the training [hazard ratio (HR) = 3.279, 95% CI: 2.865–3.693, p < 0.0001] and validation cohorts (HR = 2.247, 95% CI: 1.735–2.759, p < 0.0001). Figure 3 shows typical patients who had similar clinicopathological characteristics, but their PFS time was significantly different (9 vs. 37 months). The Rad-score of patient 2 was significantly higher than that of patient 1 (1.380 vs. 0.029). In the LASSO Cox regression analysis, the Rad-score yielded a C-index of 0.778 [95% confidence interval (CI): 0.699–0.858] for the training cohort (Table 2). The favorable prognostic performance of the Rad-score was further confirmed in the validation cohort (C-index, 0.816; 95% CI: 0.673–0.958).
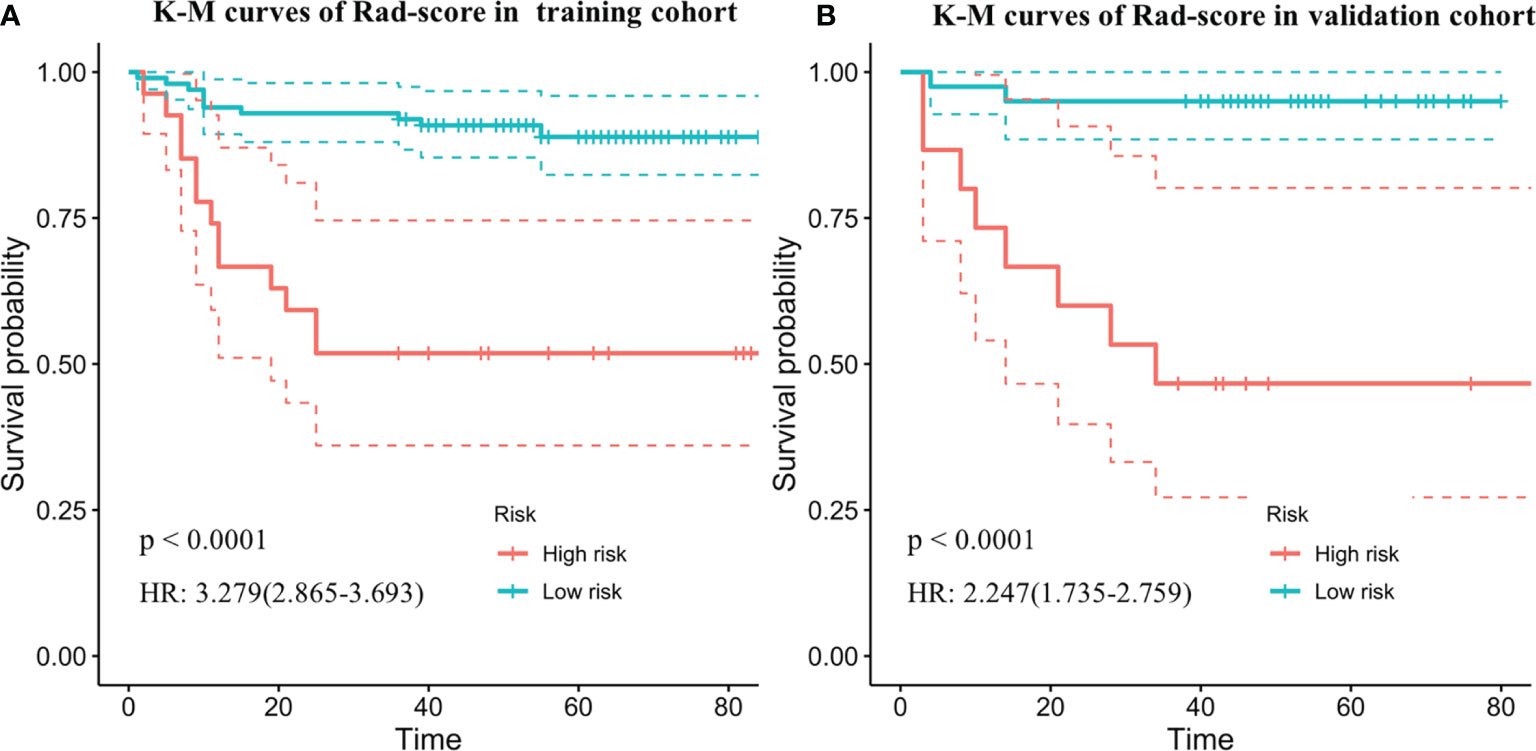
Figure 2 Kaplan–Meier survival curves of progression-free survival according to the Rad-score in the training cohorts (A) and independent validation data set (B). Shadows represent 95% confidence interval. HR, hazard ratio.
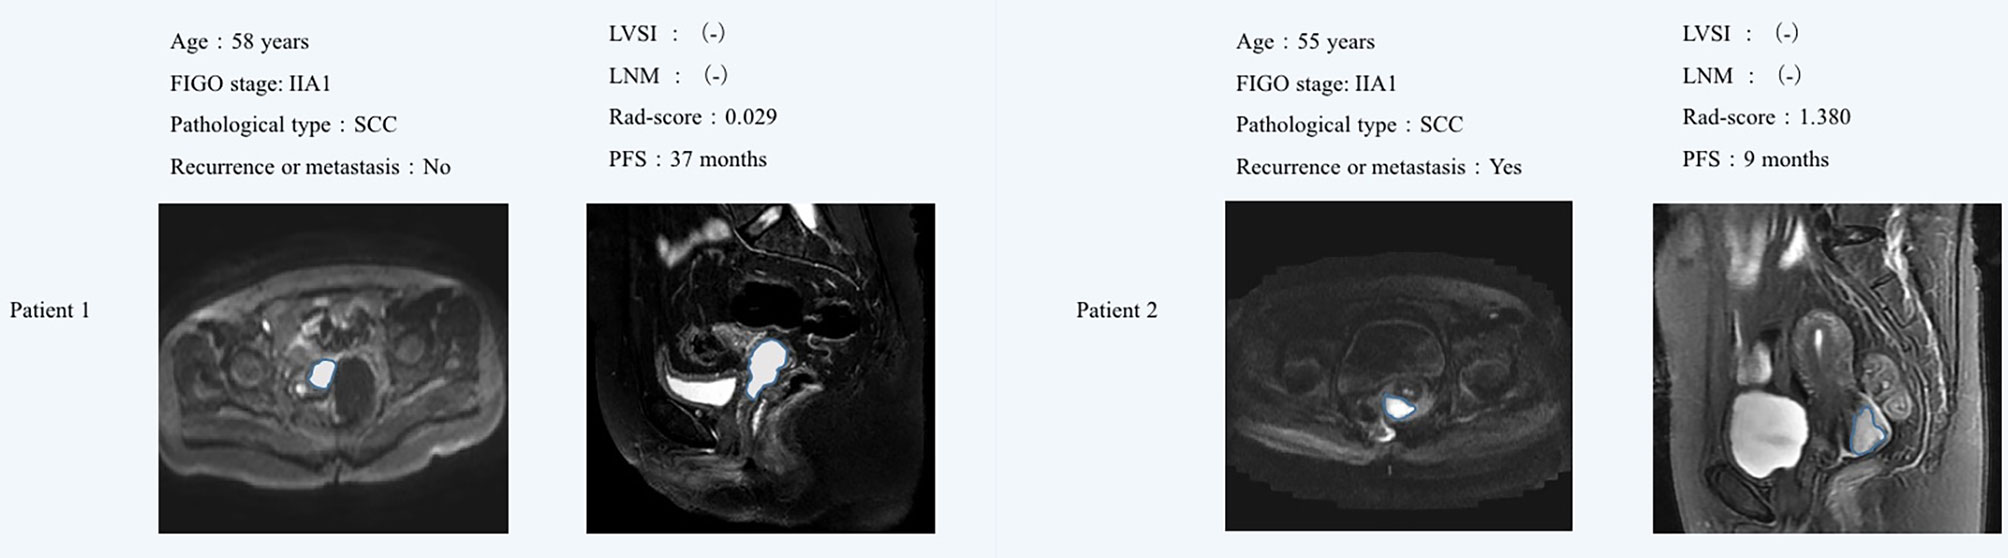
Figure 3 MR images showed that the sagittal T2WI and axial DWI lesions were cervical cancer. Although patient 1 and patient 2 had similar clinicopathological characteristics, their Rad-score were significantly different. Patient 1 did not find obvious signs of recurrence or metastasis after 37 months of postoperative follow-up, while the Patient 2 relapsed 9 months after surgery. The Rad-score of patient 2 was significantly higher than that of patient 1. FIGO, International Federation of Gynecology and Obstetrics; LVSI, lymph vascular space invasion; LNM, lymph node metastasis; SCC, squamous cell carcinoma; PFS, progression-free survival.
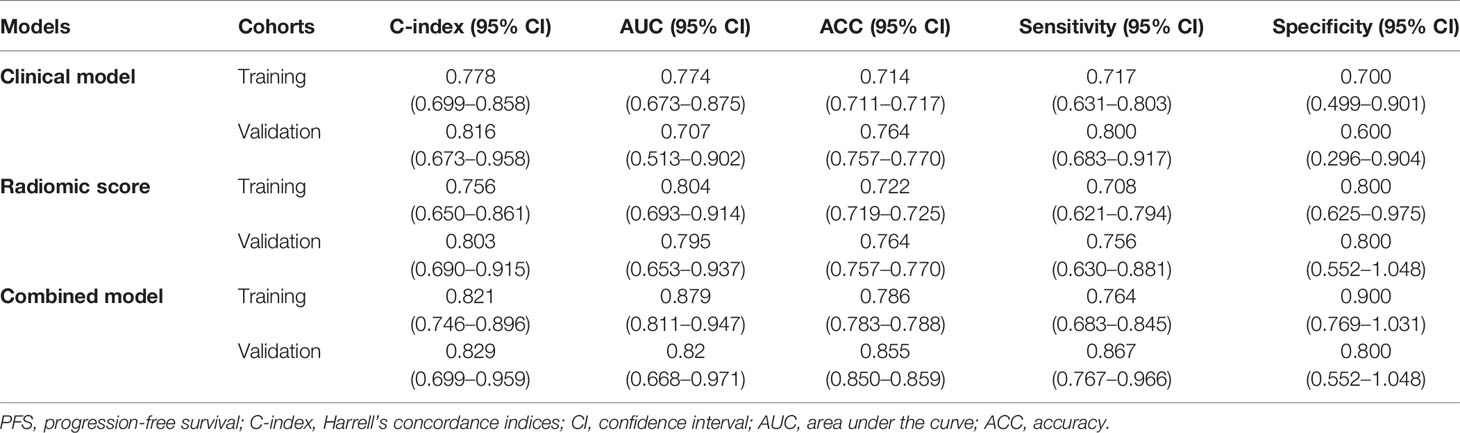
Table 2 Model performance on predicting 3-year PFS.
In addition to Rad-score, we included a total of 12 clinicopathologic factors into the univariate analysis (Table 3), and the results showed that age (HR = 0.511, 95% CI: 0.247–1.053, p = 0.069), LVSI (HR = 2.286, 95% CI: 1.151–4.538, p = 0.018), squamous cell carcinoma antigen (HR = 0.427, 95% CI: 0.182–1.005, p = 0.051), albumin (HR = 0.530, 95% CI: 0.252–1.113, p = 0.091), hemoglobin (HR = 5.393, 95% CI: 2.560–11.363, p < 0.0001), white blood cell (WBC) (HR = 2.233, 95% CI: 1.128–4.420, p = 0.021), and Rad-score (HR = 2.647, 95% CI: 2.002–3.501, p < 0.0001), would be identified as candidate risk factors (p < 0.1) into the LASSO Cox regression analysis.
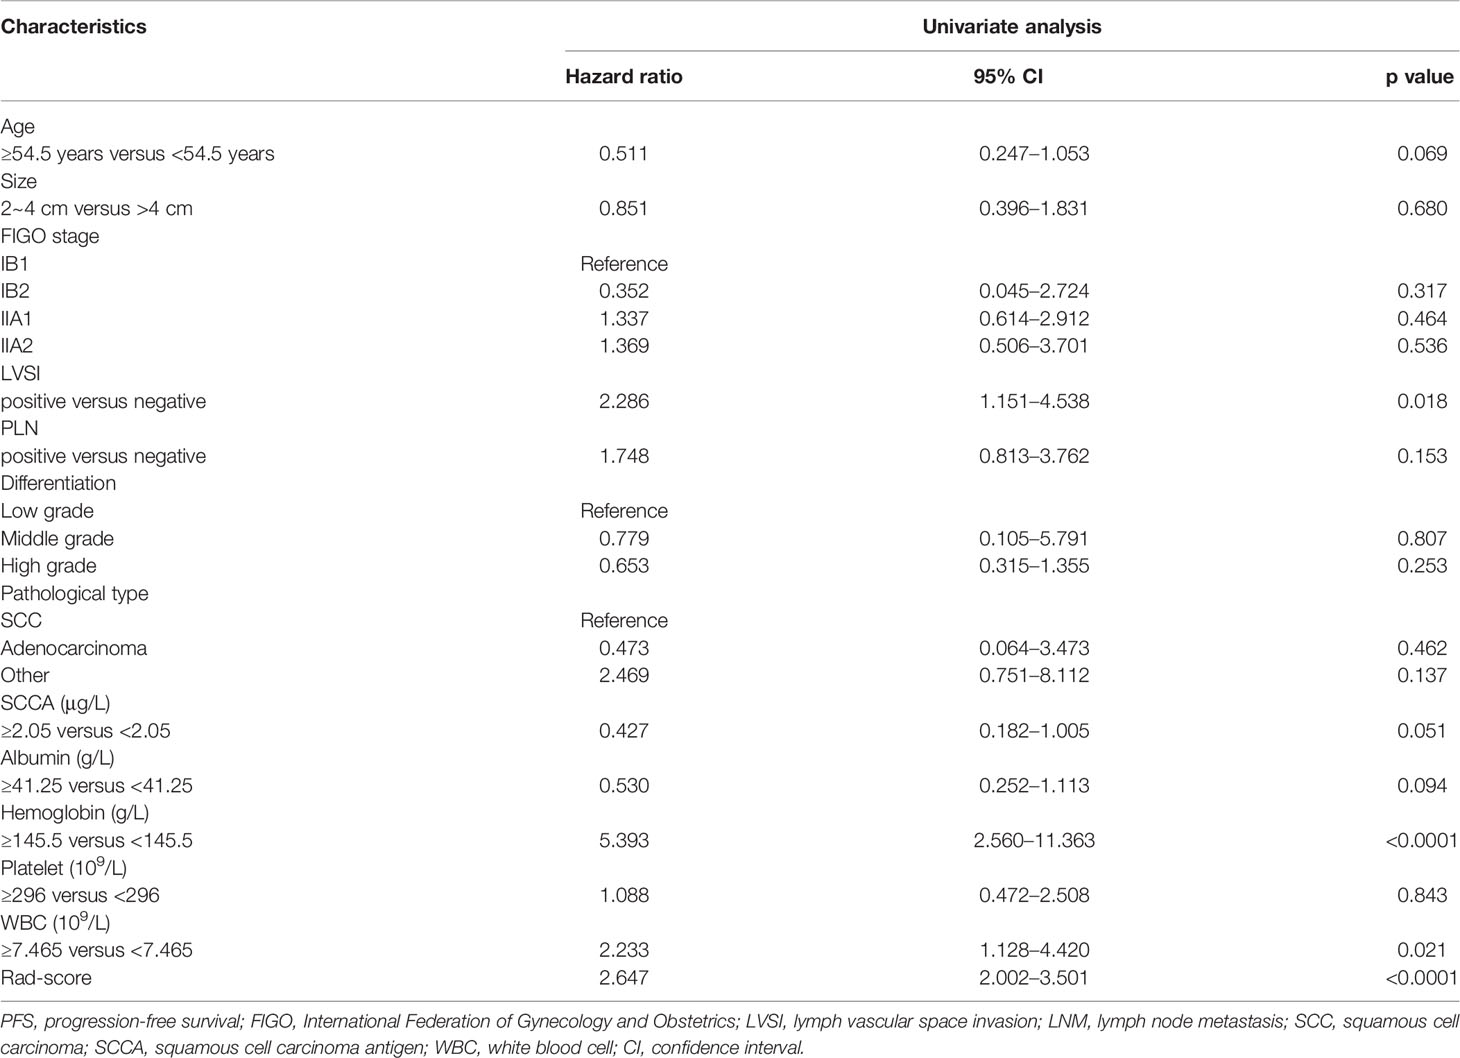
Table 3 Univariate Cox analysis of risk factors for PFS in all patients.
The LASSO Cox regression model analysis showed that age, LVSI, hemoglobin, and WBC were finally selected and integrated into a clinical model (Figure 4). The performance of the clinical model for 3-year PFS prediction yielded a C-index value of 0.778 (95% CI: 0.699–0.858) in the training cohort and 0.816 (95% CI: 0.673–0.958) in the validation cohort (Table 2). The combined nomogram (Figure 4) integrating the radiomic score and the above four clinicopathologic factors demonstrated a better discrimination both in the training (C-index, 0.821; 95% CI: 0.746–0.896) and in the validation cohort (C-index, 0.829; 95% CI: 0.699–0.959) when compared with radiomic score or clinical model alone (Table 2).
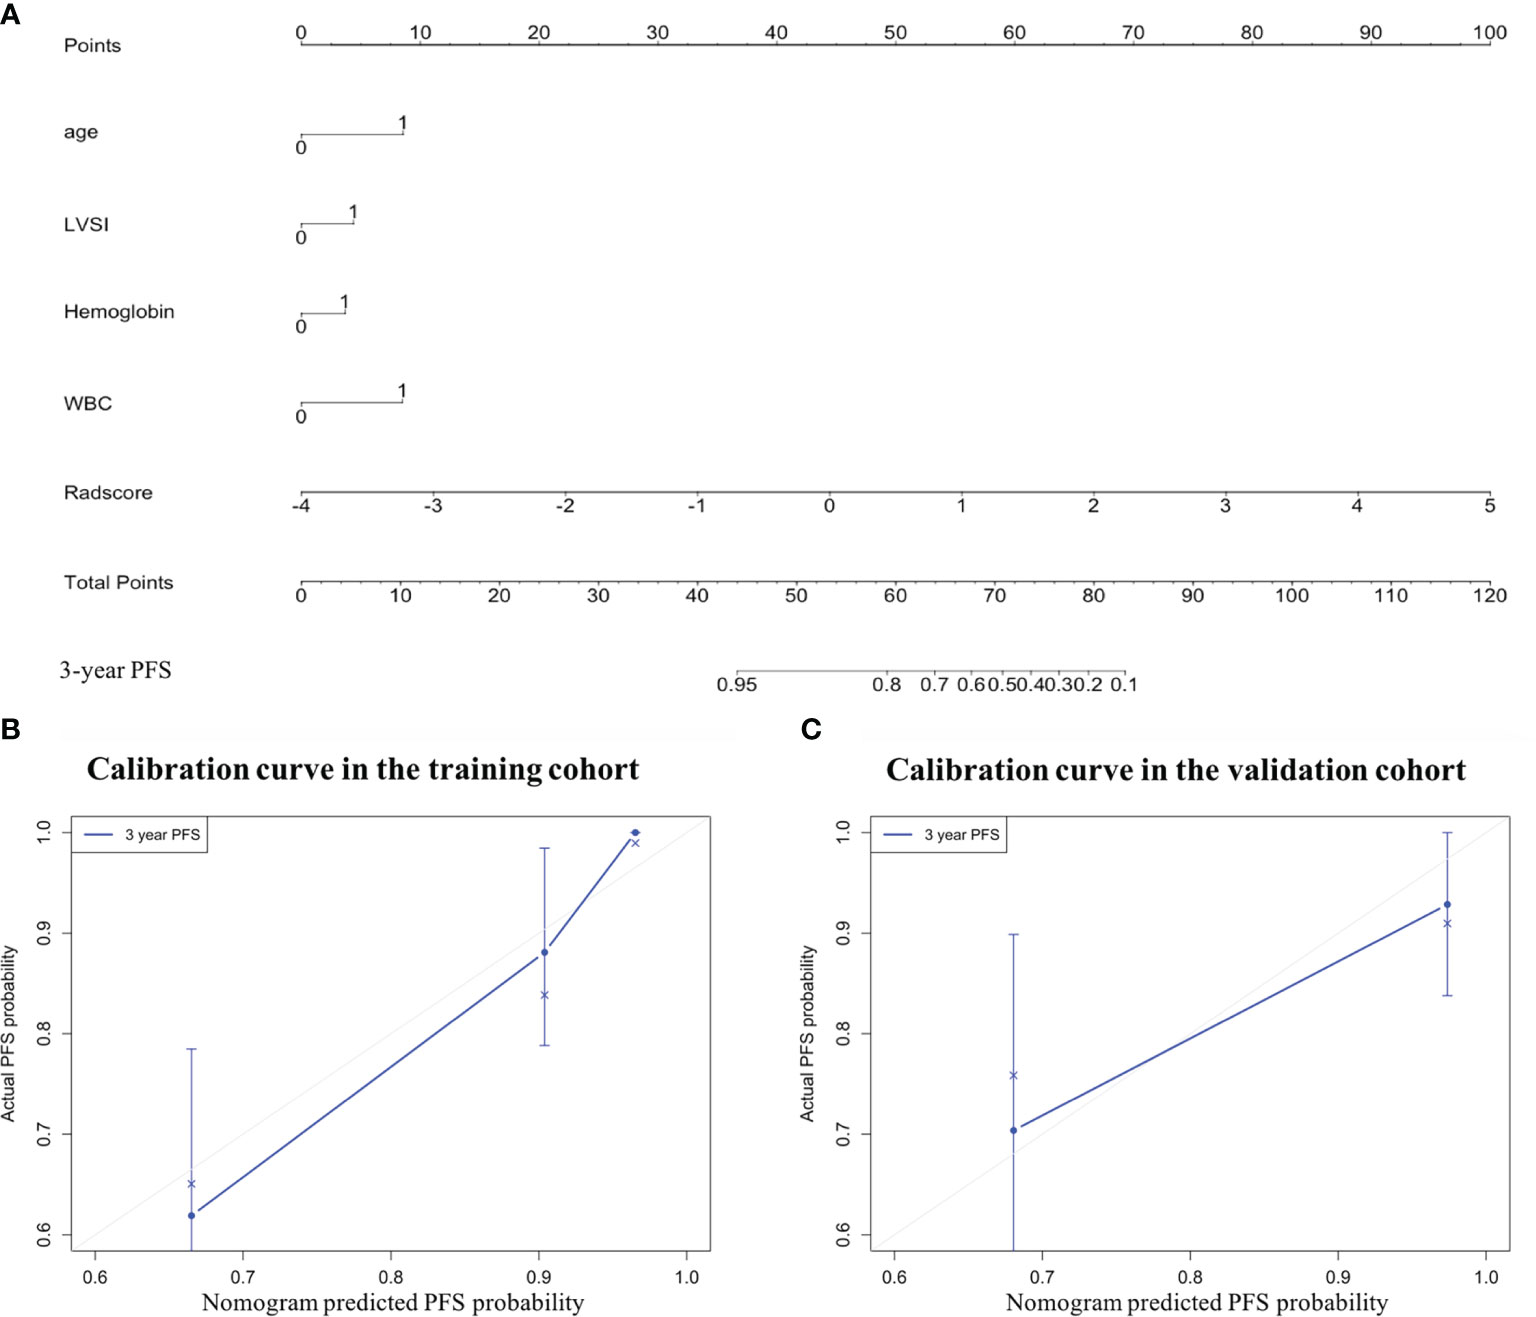
Figure 4 The combined nomogram was developed to predict the risk of 3-year progression-free survival (PFS) of patients with locally advanced cervical cancer undergoing surgery. (A) The combined nomogram that integrates the Rad-score with the clinicopathologic features in the training data set. Calibration curves of the combined nomogram in the (B) training and (C) validation cohorts. The diagonal gray line represents a perfect evaluation, while the blue line represents the actual performance of the nomogram. A closer fit to the diagonal gray line indicates a better assessment. LVSI, lymph vascular space invasion; WBC, white blood cell.
In the training cohort (Table 2 and Figure 5A), the radiomics score (AUC, 0.804 [95% CI: 0.693–0.914]) showed a comparable prognostic performance with the clinical model (AUC, 0.774 [95% CI: 0.673–0.875]), with a p value of 0.719 (Figure 6). The combined nomogram was shown to be with the highest AUC value (0.879, [95% CI: 0.811–0.947]), demonstrating a significant improvement in PFS prediction compared to the clinical model or the radiomics score (p = 0.038, p = 0.043, respectively) (Figure 6). In the validation cohort (Table 2 and Figure 5B), the clinical model yielded an AUC of 0.707 (95% CI: 0.513–0.902). Although the radiomics score (AUC, 0.795 [95% CI: 0.653–0.937]) showed improvement compared with the clinical model, the Delong test found that no significant difference was shown between the AUCs (p = 0.458) (Figure 6). The combined nomogram (AUC, 0.820 [95% CI: 0.668–0.971]) also showed improvement over the clinical model or the radiomics score for the PFS prediction in the validation cohort. However, the difference was not significant (p = 0.150, p = 0.684, respectively) (Figure 6).
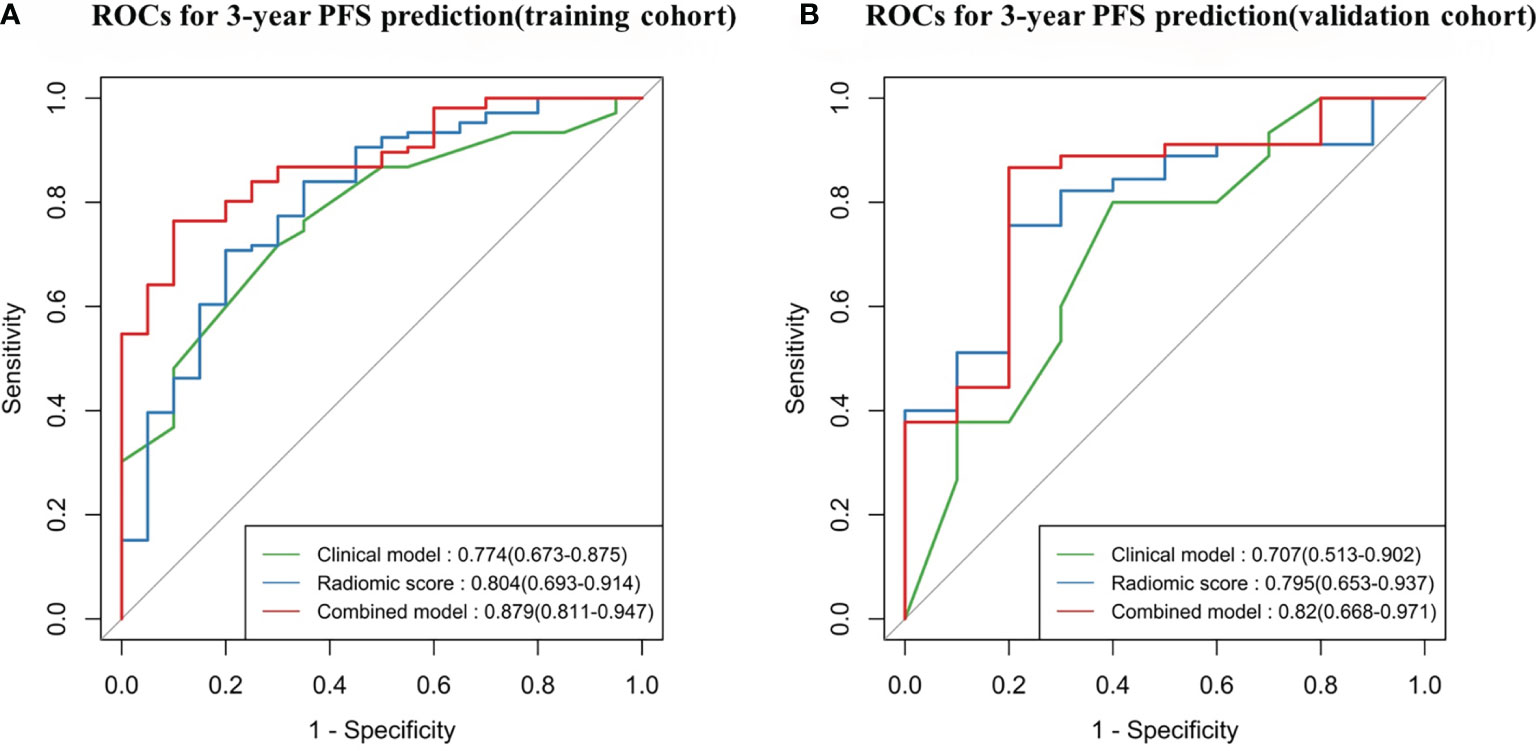
Figure 5 Time-dependent receiver operating characteristic (ROC) curves comparing the predictive capacity of the three models. (A) Training cohort, N = 126. (B) Validation cohort, N = 55. PFS, progression-free survival.
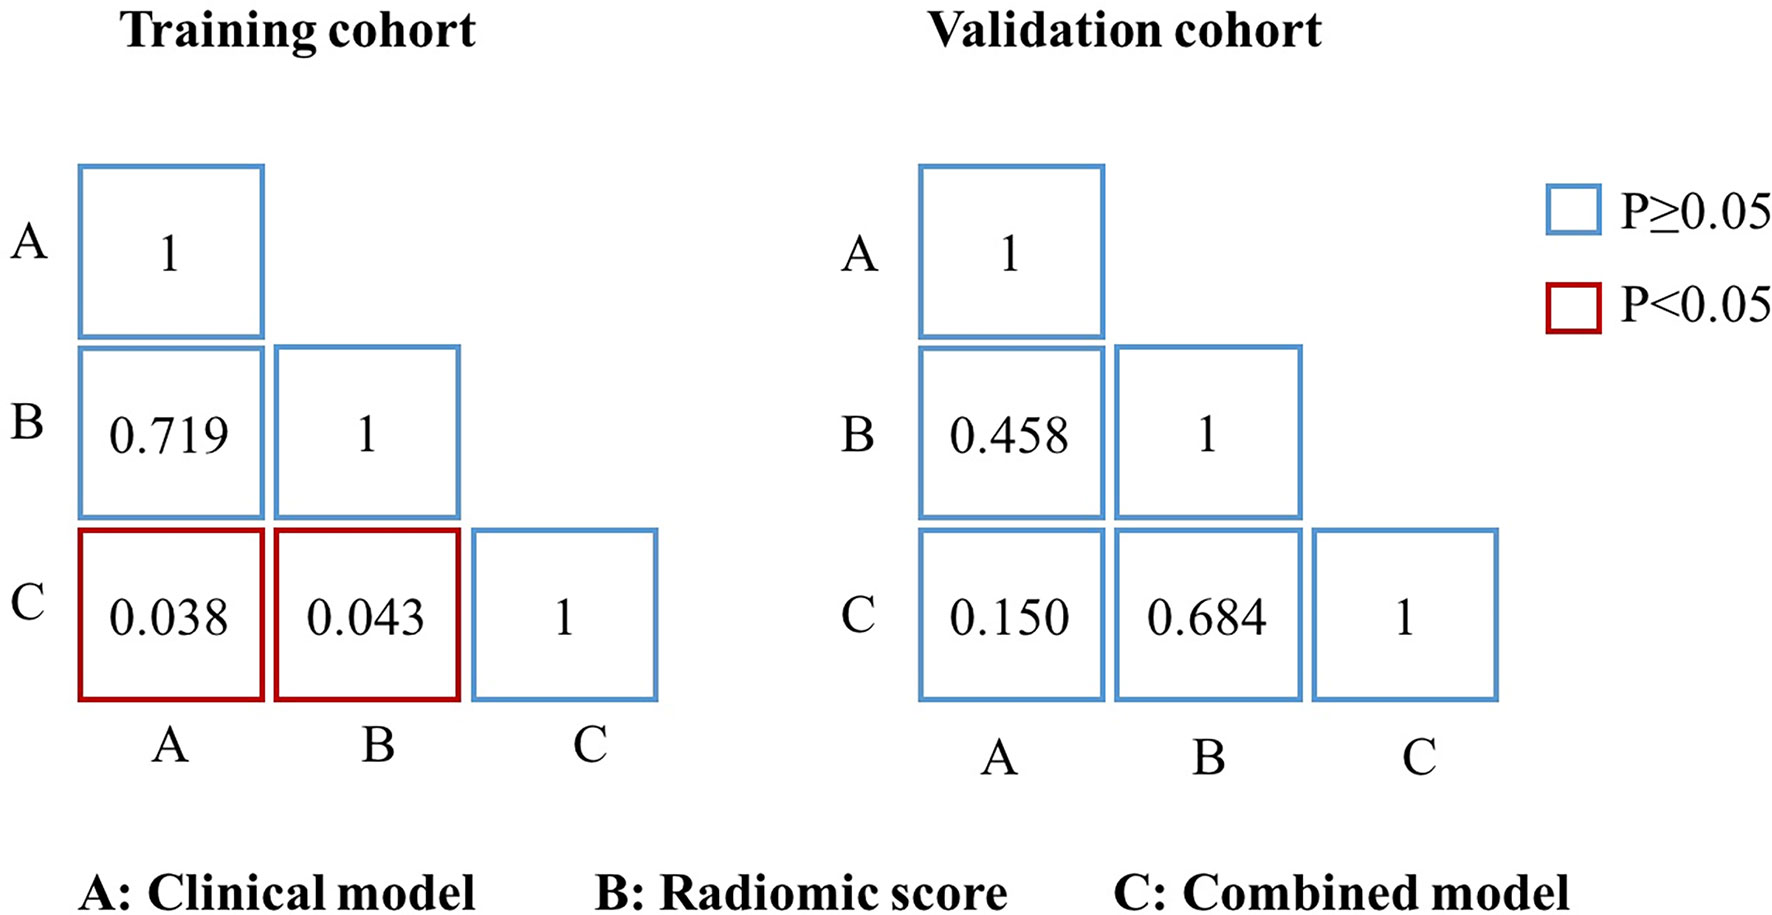
Figure 6 Delong test between different models. p-value of the Delong test between any two models.
In this study, we developed and validated an MRI-based Rad-score for noninvasive PFS prediction in patients with LACC undergoing surgery. The study demonstrated that the Rad-score was significantly related with 3-year PFS in both the training and validation cohorts. The Rad-score stratified the patients into low-risk and high-risk groups, and the Kaplan–Meier analysis showed that the patients in the high-risk group portended a worse prognosis with shorter PFS than did the low-risk group in the training (HR = 3.279, 95% CI: 2.865–3.693, p < 0.0001) and validation cohorts (HR = 2.247, 95% CI: 1.735–2.759, p < 0.0001). The performance of the combined nomogram which integrated Rad-score and significant clinicopathologic parameters was demonstrated to have better performance than the Rad-score or clinical model alone in the PFS prediction. Furthermore, the nomogram showed a satisfactory discrimination performance, with C-indexes of 0.821 and 0.829 in the training and validation cohorts.
Cox regression analysis was used to build the clinical model for PFS prediction. Four clinical features including age, hemoglobin, WBC, and LVSI were found to be correlated with PFS. Inflammation is an important part of the tumor microenvironment and plays a key role in the initiation, promotion, progression, invasion, and metastasis of the tumor (26). Systemic inflammation biomarkers such as C-reactive protein (CRP), platelet count, hemoglobin, and WBC had already been shown to have prognostic values in different tumors (27, 28). In our study, hemoglobin and WBC were also identified as important prognostic factors for PFS which was coherent with the results of the previous studies. In addition, lymph-vascular space invasion is considered to be a crucial factor in the tumor cell dissemination (29) and is identified as an unfavorable prognostic factor in cervical cancer (30, 31), which is consistent with our study.
Radiomics analysis has developed as a non-invasive method to visualize and quantify intra-tumor heterogeneity by high-throughput quantitative characteristic extraction from medical images, thereby providing prognostic information in medical decision making (8). In the recent years, researchers have used radiomics in the prediction of pathological features, LNM, and response to neoadjuvant chemotherapy in cervical cancer (12–14, 32), rather than clinical outcomes such as PFS and overall survival (OS). Jin et al. reported that MRI-based radiomics signature was an independent predictor of DFS in patients with early-stage cervical cancer treated with radical hysterectomy, and their study demonstrated that the Rad-score yielded a C-index of 0.753 (95% CI: 0.696-0.805) on 3-year DFS prediction, which were higher than either clinical model or combined model (33). However, these studies focused on early-stage (IB-IIA) cervical cancer treated by surgery. Only two clinicopathological features (LNM and LVSI) were included in their clinical model, which did not contain another hematological parameter. Some previous studies applied PET/CT radiomics to evaluate patients’ responses to chemoradiotherapy with LACC (34, 35). Although PET/CT demonstrated good discrimination ability, its high cost and high radiation limited its wide use. The role of MRI-based radiomic signatures to evaluate PFS in patients with LACC who have surgical indicators has not yet been investigated. Therefore, in this context, it is necessary for us to do this research.
The LASSO-Cox-based method was used to construct the Rad-score, which derived from the joint T2WI and DWI. Wang et al. have published two articles about using Rad-score based on the joint T2WI and DWI for prediction of LNM or parametrial invasion (PMI) in patients with early cervical cancer (36, 37). These studies demonstrated that the Rad-score from the combined T2WI and DWI has a significant improvement performance for prediction of LNM or PMI, compared with the Rad-score from T2WI or DWI alone. The advantage of T2WI is that it can clearly show the anatomical features of tumors in the cervical cancer patients, and as a functional imaging, DWI can provide microscopic motion of water molecules in tissues and subsequently detect early pathological changes based on water diffusion properties (38). Therefore, the combination of T2WI and DWI could balance the shortcomings and gain more precise and comprehensive information about the tumors. In our study, the radiomic score that combined T2WI and DWI showed good performance for prediction of 3-year PFS in patients with LACC, which yielded a C-index of 0.803 (95% CI, 0.690–0.915) and an AUC of 0.795 (95% CI: 0.653-0.937) in the validation cohort.
To provide a clinically suitable and quantitative approach for the individual prediction of PFS in patients with LACC, a nomogram could enable gynecologists to evaluate the survival of patients based on their clinical and image characteristics. In the current study, a combined nomogram that combined both the Rad-score and other important clinicopathologic features was established for the 3-year PFS evaluation in patients with LACC for the first time. The combined nomogram was shown to have a significant improvement performance for the 3-year PFS prediction, compared with the Rad-score or clinical model alone (C-index of 0.821 vs. 0.778 and 0.816 in the training cohort; 0.829 vs. 0.816 and 0.803 in the validation cohort). This result was also verified by the conclusions of the ROC analysis. It indicated that the radiomics signature may contain information that is complementary to clinical factors, reflecting changes of human tissues at the molecular and genetic levels (9, 33). Another interesting finding of our research was that the Rad-score could serve as a marker in discriminating low-risk and high-risk patients. Patients with higher Rad-scores have the worse PFS. These results provided a new insight into the future treatment protocols in patients with LACC. For instance, LACC patients at high risk of recurrence and metastasis could be considered for preoperative neoadjuvant chemotherapy, whereas patients at low risk of recurrence could directly select surgeries, thereby avoiding unnecessary chemotherapy-related toxicities and disease progression due to delays in effective treatment. Therefore, the Rad-score may be used as an effective biomarker to improve the prognostic ability of pretreatment.
Our research has the following limitations. Firstly, its retrospective design and single-institution study may lead to inevitable selection bias. Prospective multicenter studies with larger populations will be required to confirm the robustness and reproducibility of the current research. Secondly, imaging data were collected by different MR scanners or imaging protocols. Although all the imaging data were normalized to reduce bias before extraction, the performance of the radiomics signature will be significantly improved by normalization of the imaging data. Finally, due to the limited number of patients with genetic data, we did not provide genomic characteristics in our study. In the future study, how to integrate genomic features, radiomics signature, and clinical characteristics together will become increasingly important.
We developed and validated a Rad-score as a non-invasive method for a preoperative evaluation of PFS in patients with LACC. The combined nomogram, which integrated the Rad-score and clinicopathologic factors, showed significant improvement in the prediction of PFS and may serve as a potential tool to guide individual treatment plans for patients with LACC.
The raw data supporting the conclusions of this article will be made available by the authors, without undue reservation.
The studies involving human participants were reviewed and approved by the First Affiliated Hospital of Wenzhou Medical University, Wenzhou, China. Written informed consent for participation was not required for this study in accordance with the national legislation and the institutional requirements.
MTC wrote the manuscript. MTC, YJY, ZYH, and FL: conception and design. MTC, FY, JD, RRZ, and XWH: collection and assembly of data. ZYH, MTC, FY, JD, RRZ, and XWH: development of methodology. MTC, ZYH, FY: data analysis and interpretation.All authors contributed to the article and approved the submitted version.
This paper was financially supported by the Science and Technology Planning Projects of Wenzhou (Grant No. Y20180112), Health Foundation for Creative Talents in Zhejiang Province, China (No: 2016) and Project Foundation for the College Young and Middle-aged Academic Leader of Zhejiang Province, China (No: 2017).
The authors declare that the research was conducted in the absence of any commercial or financial relationships that could be construed as a potential conflict of interest.
All claims expressed in this article are solely those of the authors and do not necessarily represent those of their affiliated organizations, or those of the publisher, the editors and the reviewers. Any product that may be evaluated in this article, or claim that may be made by its manufacturer, is not guaranteed or endorsed by the publisher.
The Supplementary Material for this article can be found online at: https://www.frontiersin.org/articles/10.3389/fonc.2021.749114/full#supplementary-material
1. Siegel RL, Miller KD, Jemal A. Cancer Statistics, 2015. CA Cancer J Clin (2015) 65(1):5–29. doi: 10.3322/caac.21254
2. Serkies K, Jassem J. Systemic Therapy for Cervical Carcinoma - Current Status. Chin J Cancer Res (2018) 30(2):209–21. doi: 10.21147/j.issn.1000-9604.2018.02.04
3. Bhatla N, Aoki D, Sharma DN, Sankaranarayanan R. Cancer of the Cervix Uteri. Int J Gynaecol Obstet (2018) 143(Suppl 2):22–36. doi: 10.1002/ijgo.12611
4. Halle MK, Ojesina AI, Engerud H, Woie K, Tangen IL, Holst F, et al. Clinicopathologic and Molecular Markers in Cervical Carcinoma: A Prospective Cohort Study. Am J Obstet Gynecol (2017) 217(4):432.e1–.e17. doi: 10.1016/j.ajog.2017.05.068
5. Rose PG, Java J, Whitney CW, Stehman FB, Lanciano R, Thomas GM, et al. Nomograms Predicting Progression-Free Survival, Overall Survival, and Pelvic Recurrence in Locally Advanced Cervical Cancer Developed From an Analysis of Identifiable Prognostic Factors in Patients From NRG Oncology/Gynecologic Oncology Group Randomized Trials of Chemoradiotherapy. J Clin Oncol (2015) 33(19):2136–42. doi: 10.1200/jco.2014.57.7122
6. Ng SH, Chang TC, Ko SF, Yen PS, Wan YL, Tang LM, et al. Nasopharyngeal Carcinoma: MRI and CT Assessment. Neuroradiology (1997) 39(10):741–6. doi: 10.1007/s002340050499
7. Kusmirek J, Robbins J, Allen H, Barroilhet L, Anderson B, Sadowski EA. PET/CT and MRI in the Imaging Assessment of Cervical Cancer. Abdom Imaging (2015) 40(7):2486–511. doi: 10.1007/s00261-015-0363-6
8. Gillies RJ, Kinahan PE, Hricak H. Radiomics: Images Are More Than Pictures, They Are Data. Radiology (2016) 278(2):563–77. doi: 10.1148/radiol.2015151169
9. Aerts HJ, Velazquez ER, Leijenaar RT, Parmar C, Grossman P, Carvalho S, et al. Decoding Tumour Phenotype by Noninvasive Imaging Using a Quantitative Radiomics Approach. Nat Commun (2014) 5:4006. doi: 10.1038/ncomms5006
10. Lambin P, Rios-Velazquez E, Leijenaar R, Carvalho S, van Stiphout RG, Granton P, et al. Radiomics: Extracting More Information From Medical Images Using Advanced Feature Analysis. Eur J Cancer (Oxf Engl 1990) (2012) 48(4):441–6. doi: 10.1016/j.ejca.2011.11.036
11. Bartoschek M, Oskolkov N, Bocci M, Lövrot J, Larsson C, Sommarin M, et al. Spatially and Functionally Distinct Subclasses of Breast Cancer-Associated Fibroblasts Revealed by Single Cell RNA Sequencing. Nat Commun (2018) 9(1):5150. doi: 10.1038/s41467-018-07582-3
12. Erbay G, Onal C, Karadeli E, Guler OC, Arica S, Koc Z. Predicting Tumor Recurrence in Patients With Cervical Carcinoma Treated With Definitive Chemoradiotherapy: Value of Quantitative Histogram Analysis on Diffusion-Weighted MR Images. Acta Radiol (Stockholm Sweden 1987) (2017) 58(4):481–8. doi: 10.1177/0284185116656492
13. Schob S, Meyer HJ, Pazaitis N, Schramm D, Bremicker K, Exner M, et al. ADC Histogram Analysis of Cervical Cancer Aids Detecting Lymphatic Metastases-A Preliminary Study. Mol Imaging Biol (2017) 19(6):953–62. doi: 10.1007/s11307-017-1073-y
14. Liu Y, Zhang Y, Cheng R, Liu S, Qu F, Yin X, et al. Radiomics Analysis of Apparent Diffusion Coefficient in Cervical Cancer: A Preliminary Study on Histological Grade Evaluation. J Magn Reson Imaging (2019) 49(1):280–90. doi: 10.1002/jmri.26192
15. Yushkevich PA, Piven J, Hazlett HC, Smith RG, Ho S, Gee JC, et al. User-Guided 3D Active Contour Segmentation of Anatomical Structures: Significantly Improved Efficiency and Reliability. NeuroImage (2006) 31(3):1116–28. doi: 10.1016/j.neuroimage.2006.01.015
16. Zhang JX, Song W, Chen ZH, Wei JH, Liao YJ, Lei J, et al. Prognostic and Predictive Value of a microRNA Signature in Stage II Colon Cancer: A microRNA Expression Analysis. Lancet Oncol (2013) 14(13):1295–306. doi: 10.1016/s1470-2045(13)70491-1
17. Jiang Y, Yuan Q, Lv W, Xi S, Huang W, Sun Z, et al. Radiomic Signature of (18)F Fluorodeoxyglucose PET/CT for Prediction of Gastric Cancer Survival and Chemotherapeutic Benefits. Theranostics (2018) 8(21):5915–28. doi: 10.7150/thno.28018
18. Friedman J, Hastie T, Tibshirani R. Regularization Paths for Generalized Linear Models via Coordinate Descent. J Stat Softw (2010) 33(1):1–22. doi: 10.18637/jss.v033.i01
19. Simon N, Friedman J, Hastie T, Tibshirani R. Regularization Paths for Cox’s Proportional Hazards Model via Coordinate Descent. J Stat Softw (2011) 39(5):1–13. doi: 10.18637/jss.v039.i05
20. Camp RL, Dolled-Filhart M, Rimm DL. X-Tile: A New Bio-Informatics Tool for Biomarker Assessment and Outcome-Based Cut-Point Optimization. Clin Cancer Res (2004) 10(21):7252–9. doi: 10.1158/1078-0432.Ccr-04-0713
21. Harrell FE Jr., Califf RM, Pryor DB, Lee KL, Rosati RA. Evaluating the Yield of Medical Tests. Jama (1982) 247(18):2543–6. doi: 10.1001/jama.247.18.2543
22. Blanche P, Kattan MW, Gerds TA. The C-Index Is Not Proper for the Evaluation of $T$-Year Predicted Risks. Biostatistics (Oxf Engl) (2019) 20(2):347–57. doi: 10.1093/biostatistics/kxy006
23. Heagerty PJ, Zheng Y. Survival Model Predictive Accuracy and ROC Curves. Biometrics (2005) 61(1):92–105. doi: 10.1111/j.0006-341X.2005.030814.x
24. Chambless LE, Diao G. Estimation of Time-Dependent Area Under the ROC Curve for Long-Term Risk Prediction. Stat Med (2006) 25(20):3474–86. doi: 10.1002/sim.2299
25. DeLong ER, DeLong DM, Clarke-Pearson DL. Comparing the Areas Under Two or More Correlated Receiver Operating Characteristic Curves: A Nonparametric Approach. Biometrics (1988) 44(3):837–45. doi: 10.2307/2531595
26. Mantovani A, Allavena P, Sica A, Balkwill F. Cancer-Related Inflammation. Nature (2008) 454(7203):436–44. doi: 10.1038/nature07205
27. Barkati M, Fortin I, Mileshkin L, Bernshaw D, Carrier JF, Narayan K. Hemoglobin Level in Cervical Cancer: A Surrogate for an Infiltrative Phenotype. Int J Gynecol Cancer (2013) 23(4):724–9. doi: 10.1097/IGC.0b013e31828a0623
28. Wang L, Jia J, Lin L, Guo J, Ye X, Zheng X, et al. Predictive Value of Hematological Markers of Systemic Inflammation for Managing Cervical Cancer. Oncotarget (2017) 8(27):44824–32. doi: 10.18632/oncotarget.14827
29. Kikuchi E, Margulis V, Karakiewicz PI, Roscigno M, Mikami S, Lotan Y, et al. Lymphovascular Invasion Predicts Clinical Outcomes in Patients With Node-Negative Upper Tract Urothelial Carcinoma. J Clin Oncol (2009) 27(4):612–8. doi: 10.1200/jco.2008.17.2361
30. Yu Q, Lou XM, He Y. Prediction of Local Recurrence in Cervical Cancer by a Cox Model Comprised of Lymph Node Status, Lymph-Vascular Space Invasion, and Intratumoral Th17 Cell-Infiltration. Med Oncol (Northwood Lond Engl) (2014) 31(1):795. doi: 10.1007/s12032-013-0795-1
31. Twu NF, Ou YC, Liao CI, Chang WY, Yang LY, Tang YH, et al. Prognostic Factors and Adjuvant Therapy on Survival in Early-Stage Cervical Adenocarcinoma/Adenosquamous Carcinoma After Primary Radical Surgery: A Taiwanese Gynecologic Oncology Group (TGOG) Study. Surg Oncol (2016) 25(3):229–35. doi: 10.1016/j.suronc.2016.05.028
32. Downey K, Riches SF, Morgan VA, Giles SL, Attygalle AD, Ind TE, et al. Relationship Between Imaging Biomarkers of Stage I Cervical Cancer and Poor-Prognosis Histologic Features: Quantitative Histogram Analysis of Diffusion-Weighted MR Images. AJR Am J Roentgenol (2013) 200(2):314–20. doi: 10.2214/ajr.12.9545
33. Fang J, Zhang B, Wang S, Jin Y, Wang F, Ding Y, et al. Association of MRI-Derived Radiomic Biomarker With Disease-Free Survival in Patients With Early-Stage Cervical Cancer. Theranostics (2020) 10(5):2284–92. doi: 10.7150/thno.37429
34. Ho KC, Fang YH, Chung HW, Yen TC, Ho TY, Chou HH, et al. A Preliminary Investigation Into Textural Features of Intratumoral Metabolic Heterogeneity in (18)F-FDG PET for Overall Survival Prognosis in Patients With Bulky Cervical Cancer Treated With Definitive Concurrent Chemoradiotherapy. Am J Nucl Med Mol Imaging (2016) 6(3):166–75.
35. Lucia F, Visvikis D, Desseroit MC, Miranda O, Malhaire JP, Robin P, et al. Prediction of Outcome Using Pretreatment (18)F-FDG PET/CT and MRI Radiomics in Locally Advanced Cervical Cancer Treated With Chemoradiotherapy. Eur J Nucl Med Mol Imaging (2018) 45(5):768–86. doi: 10.1007/s00259-017-3898-7
36. Wang T, Gao T, Yang J, Yan X, Wang Y, Zhou X, et al. Preoperative Prediction of Pelvic Lymph Nodes Metastasis in Early-Stage Cervical Cancer Using Radiomics Nomogram Developed Based on T2-Weighted MRI and Diffusion-Weighted Imaging. Eur J Radiol (2019) 114:128–35. doi: 10.1016/j.ejrad.2019.01.003
37. Wang T, Gao T, Guo H, Wang Y, Zhou X, Tian J, et al. Preoperative Prediction of Parametrial Invasion in Early-Stage Cervical Cancer With MRI-Based Radiomics Nomogram. Eur Radiol (2020) 30(6):3585–93. doi: 10.1007/s00330-019-06655-1
Keywords: locally advanced cervical cancer, magnetic resonance imaging, radiomics, progression-free survival, MRI
Citation: Cai M-T, Yao F, Ding J, Zheng R-R, Huang X-W, Yang Y-J, Lin F and Hu Z-Y (2021) MRI Radiomic Features: A Potential Biomarker for Progression-Free Survival Prediction of Patients With Locally Advanced Cervical Cancer Undergoing Surgery. Front. Oncol. 11:749114. doi: 10.3389/fonc.2021.749114
Received: 29 July 2021; Accepted: 19 November 2021;
Published: 14 December 2021.
Edited by:
Jian-Jun Wei, Northwestern University, United StatesReviewed by:
Raffaella Ergasti, Università Cattolica del Sacro Cuore, ItalyCopyright © 2021 Cai, Yao, Ding, Zheng, Huang, Yang, Lin and Hu. This is an open-access article distributed under the terms of the Creative Commons Attribution License (CC BY). The use, distribution or reproduction in other forums is permitted, provided the original author(s) and the copyright owner(s) are credited and that the original publication in this journal is cited, in accordance with accepted academic practice. No use, distribution or reproduction is permitted which does not comply with these terms.
*Correspondence: Zhangyong Hu, aHV6eUAyMWNuLmNvbQ==; Feng Lin, bGluODAxMDI2QDE2My5jb20=
†These authors have contributed equally to this work
Disclaimer: All claims expressed in this article are solely those of the authors and do not necessarily represent those of their affiliated organizations, or those of the publisher, the editors and the reviewers. Any product that may be evaluated in this article or claim that may be made by its manufacturer is not guaranteed or endorsed by the publisher.
Research integrity at Frontiers
Learn more about the work of our research integrity team to safeguard the quality of each article we publish.